Unlock document.
This document is partially blurred.
Unlock all pages and 1 million more documents.
Get Access
21
2. How was ownership transferred in this deal? Speculate as to why this structure may have been used?
3. Describe the motivation for Berkshire and 3G to buy Heinz.
4. How will the investors be able to recover the 20% purchase price premium?
5. Do you believe that Heinz is a good candidate for a leveraged buyout? Explain your answer.
6. What do you believe was the purpose of the $1.5 billion senior secured revolving loan facility, and the $2.1
billion second lien bridge loan facility as part of the deal financing package?
7. Why do you believe Berkshire Hathaway wanted to receive preferred rather than common stock in exchange
for its investing $8 billion? Be specific.
22
INSIDE M&A: VERIZON FINANCES ITS $130 BILLION BUYOUT OF
VODAFONE’S STAKE IN VERIZON WIRELESS
Key Points
• The timing of buyouts is influenced heavily by equity and credit market conditions.
• To close deals, interim or “bridge financing” often is required and replaced with longer-term or “permanent
financing.”
• How deals are financed can impact a firm’s investment strategy long after the deal is completed.
_____________________________________________________________________________________
In a deal that has been in the making for almost a decade, Verizon Communications agreed to buy British-based
wireless carrier Vodafone’s 45% ownership stake in the Verizon Wireless joint venture corporation for $130 billion.
Formed in 2000, the joint venture serves more than 100 million customers in the United States.
Announced on September 2, 2013, the deal marked the crowning event in the careers of Vittorio Colao and Lowell
McAdam, the chief executives of Vodafone and Verizon, respectively. The agreement succeeded in rebuilding relations
between the two firms that had long been strained by clashes about the size of the dividend paid by the JV, matters of
strategy, and who would eventually achieve full ownership.
While Verizon sees growth in the U.S. wireless market it is due more to the potential growth in the car or home
security markets. While smartphone and cellphone growth may have plateaued, the growth in tablet computers is not
likely to drive demand for wireless communication since 90% of tablets sold connect only to Wi-Fi rather than cellular
wireless networks. For Vodafone, the deal leaves the British firm flush with cash to repay debt, reinvest in its
operations, and to buy competitors in Europe and in emerging markets.
The total consideration (purchase price) of $130 billion, consisted of $58.9 billion of cash, $60.2 billion of common
stock issued directly to Vodafone shareholders, $5 billion of notes to Vodafone, the sale of a minority stake in Omnitel
to Vodafone for $3.5 billion, and other net consideration of $2.4 billion (consisting of specific assets transferred
between Verizon and Vodafone). The price paid is equal to Verizon’s market value, enormous by most metrics. The
Verizon buyout of Vodafone was the third-largest corporate acquisition after Vodafone’s $203 billion (enterprise value)
takeover of German cell phone operator Mannesmann in 2000 and the $182 billion (enterprise value) merger of AOL
and Time Warner in 2001.
The timing of the deal reflects the near record low interest rate environment and the strength of Verizon’s own
stock. A higher Verizon share price meant that it would have to issue fewer new shares limiting the potentially dilutive
impact on the firm’s current shareholders. Another major issue was making sure the debt markets could absorb the
sheer amount of new Verizon debt without sending interest rates spiraling upward. The huge increase in Verizon’s
leverage was sure to catch the eye of credit rating agencies charged with evaluating the likelihood that borrowers could
repay their debt on a timely basis. While Verizon’s rating was reduced, it was only one notch from what it had been to
“investment grade,” rating agency jargon for ok for investors to buy.
Verizon hired two banks, JPMorgan Chase and Morgan Stanley, to raise $61 billion in debt to finance the cash
portion of the deal. The $61 billion raised exceeded the cash portion of the total consideration by $2.1 billion to leave
23
Verizon with a positive yearend cash balance. As lead banks, the two banks joined in a “syndicate” with Bank of
America and Barclays to provide short term financing to “bridge” the gap between the payment of the purchase price
and the time required to raise long-term financing. The $61 billion bridge loan was to be eventually replaced by a $49
billion bond offering and $12 billion in bank term loans.
The record books were shattered when Verizon sold $49 billion in investment grade debt in a single day without
roiling the bond markets. The bond markets absorbed the huge debt issue because of the relative attractiveness of the
yields offered by Verizon. The debt offering included 10-year bonds that yielded 5.3% and 30-year bonds yielding
6.55%. These yields compared to the average BBB-rated industrial bond of 4.16% at the time and BBB bonds for
telecommunications companies averaging 4.34%.
The addition of a massive new debt load on Verizon's books may tie the company's hands in making major
investments for some time as its priority during the next several years will be reducing its leverage as quickly as
possible. It is likely to limit the firm’s ability to finance additional deals at least in the short-run and maybe longer if
the U.S. wireless market slows and smaller rivals compete more aggressively on price, as these factors erode the firm’s
cash flow.
Hollywood’s Biggest Independent Studios Combine in a Leveraged Buyout
Key Points
LBOs allow buyouts using relatively little cash and often rely heavily on the target firm’s assets to finance the
transaction.
Private equity investors often “cash out” of their investments by selling to a strategic buyer.
______________________________________________________________________________
The Lionsgate-Summit tie-up represented the culmination of more than four years of intermittent discussions between
the two firms. The number of studios making and releasing movies has been shrinking amid falling DVD sales and
continued efforts to transition to digital distribution. As the largest independent studios in Hollywood, both firms saw
their cash flow whipsawed as one blockbuster hit would be followed by a series of failures. Film and TV program
libraries offered the only source of cash flow stability due to the recurring fees paid by those licensing the rights to use
this proprietary content.
Lionsgate is a diversified film and television production and distribution company, with a film library of 13,000
titles. The firm’s major distribution channels include home entertainment and prepackaged media (DVDs); digital
distribution (on-demand TV) and pay TV (premium network programming). Summit, also a producer and distributor of
film and TV content, has a less consistent track record in realizing successful releases, with the Twilight “franchise” its
primary success. However, Summit does have strong international licensing operations, with arrangements in the
United States, Canada, Germany, France, Scandinavia, Spain, and Australia. The acquisition also strengthens
Lionsgate’s position as a leading content supplier and, controlling the Twilight and Hunger Games franchises, positions
Lionsgate as a market leader for young adult audiences. The combination also results in cost and revenue synergies,
more diversified cash flow streams, and greater access to international distribution channels.
24
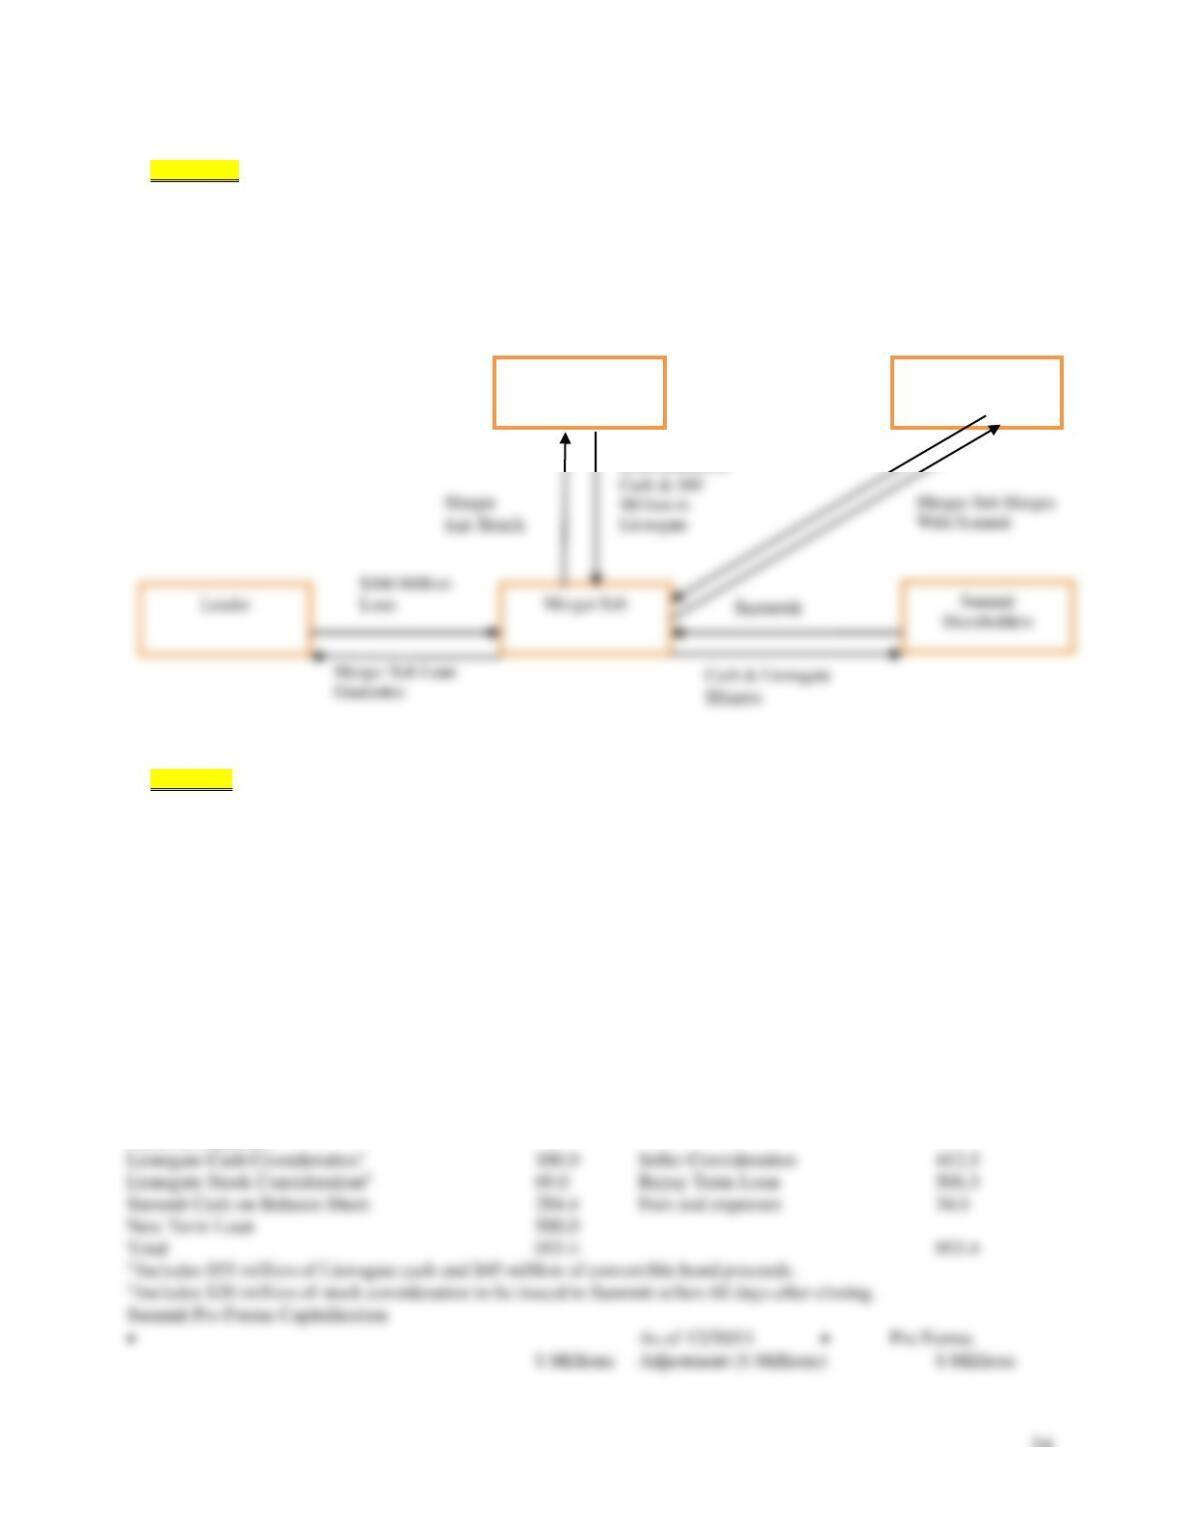
Figure 13.3 illustrates the subsidiary structure for completing the buyout of Summit Entertainment LLC. As is
typical of such transactions, Lionsgate created a merger subsidiary (Merger Sub) and funded the subsidiary with its
equity contribution of $100 million in cash and $69 million in Lionsgate stock, receiving 100% of the subsidiary’s
stock in exchange. Merger Sub was further capitalized by a bank term loan of $500 million. Following a tender offer to
Summit’s shareholders by Merger Sub, Merger Sub was merged into Summit Entertainment, with Summit surviving as
a wholly owned subsidiary of Lionsgate in a reverse triangular merger. At closing, $284.4 million of Summit’s excess
cash was used to finance the total cost of the deal.
Figure 13.3
Lionsgate-Summit Legal and Financing Structure.
Table 13.4 summarizes the sources of financing for the buyout and shows how these funds were used to pay for the
deal. Lionsgate financed the total cost of the deal of $953.4 million (consisting of $412.5 million for Summit stock +
the pretransaction term loan of $506.3 million + $34.6 million in transaction-related fees and expenses) as follows:
$100 million in cash from Lionsgate and $69 million in Lionsgate stock + $284.4 million of the $310 million in cash on
Summit’s balance sheet at closing + a new $500 million term loan. Summit’s $506.3 million term loan B was
refinanced with the new term loan for $500 million as part of the transaction. The new term loan is an obligation of and
is secured by the assets of Summit and its subsidiaries. It also is secured by a loan guarantee provided by Merger Sub,
created by Lionsgate to consummate the transaction. The guarantee is secured by the equity in Summit held by Merger
Sub. Lionsgate anticipates paying off the term loan well in advance of its 2016 maturity date out of future cash flows
from new movie releases. Summit’s pretransaction net debt was $196.3 million (pretransaction term loan of $506.3 less
total cash on the balance sheet of $310 million). Postclosing net debt increased to $474.4 million (postclosing term loan
of $500 million less $25.6 million in total cash of the balance sheet).
Table 13.4
Lionsgate-Summit Transaction Overview
• Sources of Funds ($ Millions) • Uses of
Funds ($ Millions)
Lionsgate
Entertainment
Summit
Entertainment
$100 Million in
$284.4
Million in
Excess
Summit
Cash
Cash3 310 (284.4) 25.6
Revolver ($200 million) — — NA4
Prior Term Loan B Due 9/2016 506.3 (506.3) 0.0
New Term Loan B Due 9/2016 0.0 500.0 500.0
Total Debt 506.3 (6.3) 500.0
Table 13.5 presents the key features of the new term loan B facility. Note how Summit’s assets are used as collateral
to secure the loan. In addition, the lender has first priority on the proceeds from certain types of transactions, giving
them priority access to such funds. Cash distributions are not possible until the loan is almost paid off, and even then
the size of such distributions is limited. Finally, loan covenants require Summit to maintain a comparatively liquid
position during the term of the loan.
Table 13.5
Initial Terms and Conditions of the New Term Loan B Facility
• Item • Comment
Borrower Summit Entertainment LLC (Lionsgate subsidiary)
Guarantor Merger Sub
Security First priority security interest in tangible and intangible assets
Pledge of equity interests of Summit and guarantor
Assignments of all trademarks and copyrights
Direct assignment of all proceeds payable to borrowers or any guarantor under all existing license and distribution
agreements
Facilities $500 million senior secured term loan B
Ratings B1/B+
Discussion Questions
1. What about Lionsgate’s acquisition of Summit indicates that this transaction should be characterized as a
leveraged buyout? How does Lionsgate use Summit’s assets to help finance the deal? Be specific.
26
.
2. How are $34.6 million in fees and expenses associated with the transaction paid for? Be specific.
3. Speculate as to why Lionsgate refinanced as part of the transaction the existing Summit Term Loan B due in
2016 that had been borrowed in the early 2000s.
4. Do you believe that Summit is a good candidate for a leveraged buyout? Explain your answer.
5. Why is Summit Entertainment organized as a limited liability company?
6. Why did Lionsgate make an equity contribution in the form of cash and stock to the Merger Sub rather than
making the cash portion of the contributed capital in the form of a loan?
TXU Goes Private in the Largest Private Equity Transaction in History—The Dark Side of Leverage
Key Points
The 2007/2008 financial crisis left many LBOs excessively leveraged.
As structured, the TXU buyout (now Energy Future Holdings) left no margin for error.
Excessive leverage severely limits the firm’s future financial options.
_____________________________________________________________________________
27
Before the buyout, TXU, a Dallas-based energy giant, was a highly profitable utility. Historically low interest rates and
an overly optimistic outlook for natural gas prices set the stage for the largest private equity deal in history. The 2007
buyout of TXU was valued at $48 billion and, at the time, appeared to offer such promise that several of Wall Street’s
largest lenders –—including the likes of Lehman Brothers and Citigroup—invested, along with such storied names in
private equity as KKR, TPG, and Goldman Sachs. However, the price of gas plummeted, eroding TXU’s cash flow.
Since the deal closed in October 2007, investors who bought $40 billion of TXU’s debt have experienced losses as high
as 70% to 80% of their value. The other $8 billion used to finance the deal came from the private equity investors,
banks, and large institutional investors. They, too, have suffered huge losses. Having met its obligations to date, the
firm faces a $20 billion debt repayment coming due in 2014.
of their own cash for a stake in TXU.
The financial sponsor group, consisting of Kohlberg Kravis Roberts & Co, Texas Pacific Group, and Goldman
Sachs, created a shell corporation, referred to as Merger Sub Parent, and its wholly owned subsidiary Merger Sub. TXU
was merged into Merger Sub, with Merger Sub surviving. Each outstanding share of TXU common stock was
converted into the right to receive $69.25 in cash. Total cash required for the purchase was provided by the financial
sponsor group and lenders (Creditor Group) to Merger Sub. Regulatory authorities required that the debt associated
with the transaction be held at the level of the Merger Sub Parent holding company so as not to leverage the utility
further.
Subsequent to closing, the new company was reorganized into independent businesses under a new holding
company, controlled by the Sponsor Group, called Texas Holdings (TH). Merger Sub (which owns TXU) was renamed
Energy Future Holdings. TH’s direct subsidiaries are EFH and Oncor (an energy distribution business formerly held by
TXU). EFH’s primary direct subsidiary is Texas Competitive Electric Holdings, which holds TXU’s public utility
operating assets and liabilities. All TXU non-Sponsor Group–related debt incurred to finance the transaction is held by
EFH, while any debt incurred by the Sponsor Group is shown on the TH balance sheet. This legal structure allows for
the concentration of debt in TH and EFH, separate from the cash-generating assets held by Oncor and Texas
Competitive Electric Holdings.
Loan covenants limit EFH’s and its subsidiaries’ ability to issue new debt or preferred stock; pay dividends on,
repurchase, or make distributions of capital stock or make other restricted payments; make investments; sell or transfer
assets; consolidate, merge, sell, or dispose of all or substantially all its assets; and repay, repurchase, or modify debt. A
breach of any of these covenants could result in default. Table 13.6 illustrates selected covenants in which certain ratios
must be maintained either above or below stipulated thresholds. Note that EFH was in violation of certain covenants
when you compare actual December 31, 2009 (the last year for which public information is available), ratios with
required threshold levels.
EFH Corp 9.75% Notes:
EFH Corp fixed charge coverage ratio
TCEH fixed charge coverage ratio
TCEH Senior Notes:
TCEH fixed charge coverage ratio
TCEH Senior Secured Facilities:
TCEH fixed charge coverage ratio
1.2–1.0
1.5–1.0
1.2–1.0
1.5–1.0
Restricted Payments/Limitations on Investments Covenants
EFH Corp Senior Notes
General restrictions
EFH Corp fixed charge coverage ratio
General restrictions
EFH Fixed Charge coverage ratio
EFH Corp leverage ratio
EFH Corp 9.75% Notes
General restrictions
EFH Corp fixed charge coverage ratio
General restrictions
EFH Corp fixed charge coverage ratio
EFH Corp leverage ratio
TCEH Senior Notes
TCEH fixed charge coverage ratio
1.5–1.0
At least 2.0–1.0
At least 2.0–1.0
≤7.0–1.0
At least 2.0–1.0
At least 2.0–1.0
≤7.0–1.0
At least 2.0–1.0
Things clearly have not turned out as expected. The firm faces an almost-untenable capital structure. The firm’s debt
traded at between 20 and 30 cents on the dollar throughout most of 2012. The $8 billion equity invested in the deal has
been virtually wiped out on paper. Absent a turnaround in natural gas prices, EFH is left with seeking a way to reduce
substantially the burden of the pending 2014 $20 billion loan payment with its lenders through a debt-for-equity swap
or more favorable terms on existing debt or by pursuing Chapter 11 bankruptcy. EFH has posted eight consecutive
quarterly losses. In December 2012, in an effort to extend debt maturities to buy time for a turnaround and to reduce
interest expense, EFH exchanged $1.15 billion of new payment-in-kind notes (interest is paid with more debt) for
existing notes with a face value of $1.6 billion. By any measure, this transaction illustrates the dark side of leverage.
Discussion Questions
1. How does the postclosing holding company structure protect the interests of the financial sponsor group
and the utility’s customers but potentially jeopardize creditor interests in the event of bankruptcy?
30
2. What was the purpose of the pre-closing covenants and closing conditions as described in the merger
agreement?
3. Loan covenants exist to protect the lender. How might such covenants inhibit the EFH from meeting its
2014 $20 billion obligations?
4. As CEO of EFH, would you recommend to the board of directors as an appropriate strategy for paying the
$20 billion in debt that is maturing in 2014?
5. The substantial writedown of the net acquired assets in 2008 suggests that the purchase price paid for
TXU was too high. How might this impact KKR, TPG, and Goldman’s ability to earn financial returns
expected by their investors on the TXU acquisition? How might this writedown impact EFH’s ability
meet the $20 billion debt maturing in 2014?
Lessons from Pep Boys’ Aborted Attempt to Go Private
Key Points
LBOs in recent years have involved financial sponsors’ providing a larger portion of the purchase price in cash than in
the past.
Financial sponsors focus increasingly on targets in which they have previous or related experience.
Deals that would have been completed in the early 2000s are more likely to be terminated or subject to renegotiation
than in the past.
31
_____________________________________________________________________________________
It ain’t over till it’s over” quipped former New York Yankees’ catcher Yogi Berra, famous for his malapropisms. The
oft-quoted comment was once again proven true in Pep Boys’ unsuccessful attempt to go private in 2012. On May 30,
2012, after nearly two years of discussions between Pep Boys and several interested parties, the firm announced that a
buyout agreement with the Gores Group (Gores), valued at approximately $1 billion (including assumed debt), had
collapsed, a victim of Pep Boys’ declining operating performance. The firm’s shares fell 20% on the news to $8.89 per
share, well below its level following the all-cash $15-a-share deal with Gores announced in January 2012. The terms of
the transaction also included a termination fee if either party failed to complete the deal by July 27, 2012. The failed
transaction illustrates the characteristics and potential pitfalls common to contemporary LBOs.
Pep Boys, a U.S. auto parts and repair business, operates more than 7,000 service bays in over 700 locations in 35
states and Puerto Rico. With its share price lagging the overall stock market in recent years, the firm’s board of
directors explored a range of options for boosting the firm’s value and ultimately decided to put the firm up for sale.
Gores was attracted initially by what appeared to be a low purchase price, stable cash flow, and the firm’s real estate
holdings (many of the firm’s store sites are owned by the firm). Such assets could be used as collateral underlying loans
to finance a portion of the purchase price. Furthermore, Gores has experience in retailing, having several retailers
among their portfolio of companies, including J. Mendel and Mexx.
Upon learning that the Pep Boys’ reported earnings for the first quarter of 2012 would be well below expectations,
Gores attempted to renegotiate the terms of the deal, arguing that Pep Boys had breached the deal’s agreements. With
Pep Boys unwilling to accept a lower valuation, Gores exercised its right to terminate the deal by paying the $50
million breakup fee and agreed to reimburse Pep Boys for other costs it had incurred related to the deal. Pep Boys said
the firm will use the proceeds of the breakup fee to refinance a portion of its outstanding debt.
"Grave Dancer" Takes Tribune Corporation Private in an Ill-Fated Transaction
At the closing in late December 2007, well-known real estate investor Sam Zell described the takeover of the Tribune
Company as "the transaction from hell." His comments were prescient in that what had appeared to be a cleverly
crafted, albeit highly leveraged, deal from a tax standpoint was unable to withstand the credit malaise of 2008. The end
came swiftly when the 161-year-old Tribune filed for bankruptcy on December 8, 2008.
On April 2, 2007, the Tribune Corporation announced that the firm's publicly traded shares would be acquired in a
multistage transaction valued at $8.2 billion. Tribune owned at that time 9 newspapers, 23 television stations, a 25%
stake in Comcast's SportsNet Chicago, and the Chicago Cubs baseball team. Publishing accounts for 75% of the firm's
total $5.5 billion annual revenue, with the remainder coming from broadcasting and entertainment. Advertising and
circulation revenue had fallen by 9% at the firm's three largest newspapers (Los Angeles Times, Chicago Tribune, and
Newsday in New York) between 2004 and 2006. Despite aggressive efforts to cut costs, Tribune's stock had fallen more
than 30% since 2005.
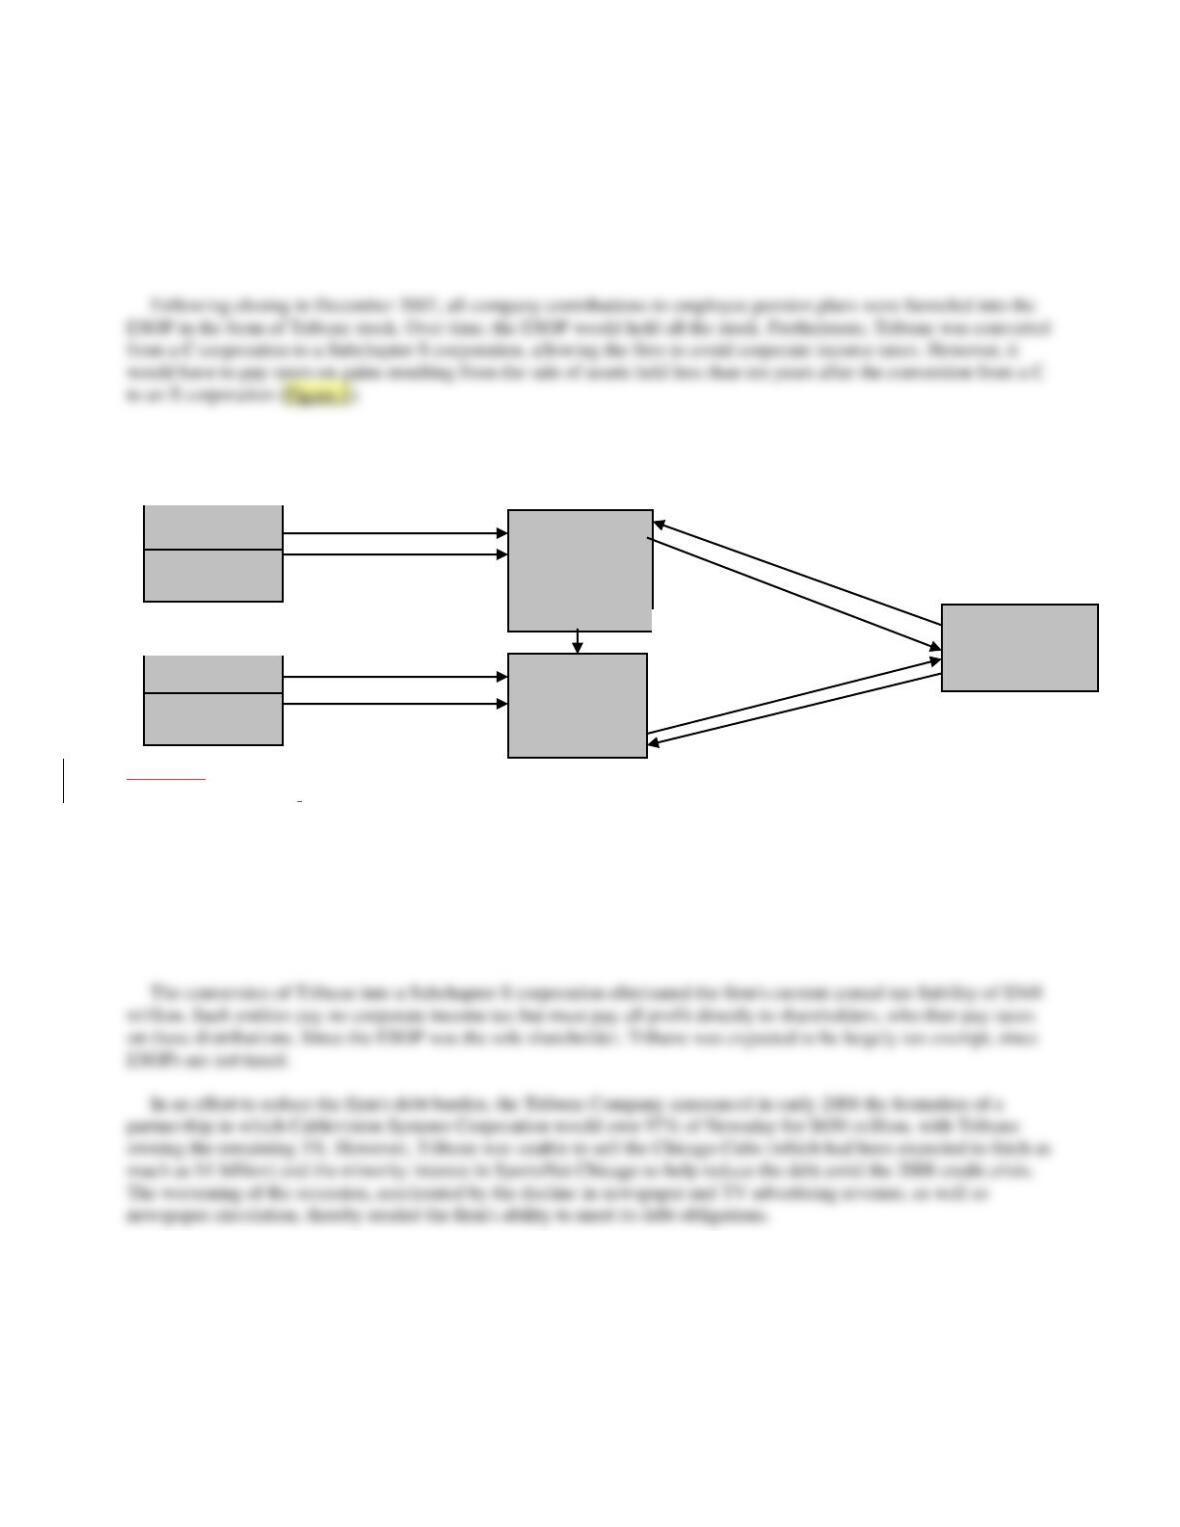
The transaction was implemented in a two-stage transaction, in which Sam Zell acquired a controlling 51% interest
in the first stage followed by a backend merger in the second stage in which the remaining outstanding Tribune shares
were acquired. In the first stage, Tribune initiated a cash tender offer for 126 million shares (51% of total shares) for
$34 per share, totaling $4.2 billion. The tender was financed using $250 million of the $315 million provided by Sam
Zell in the form of subordinated debt, plus additional borrowing to cover the balance. Stage 2 was triggered when the
32
deal received regulatory approval. During this stage, an employee stock ownership plan (ESOP) bought the rest of the
shares at $34 a share (totaling about $4 billion), with Zell providing the remaining $65 million of his pledge. Most of
the ESOP's 121 million shares purchased were financed by debt guaranteed by the firm on behalf of the ESOP. At that
point, the ESOP held all of the remaining stock outstanding valued at about $4 billion. In exchange for his commitment
of funds, Mr. Zell received a 15-year warrant to acquire 40% of the common stock (newly issued) at a price set at $500
million.
Figure 13.1
Tribune deal structure.
The purchase of Tribune's stock was financed almost entirely with debt, with Zell's equity contribution amounting to
less than 4% of the purchase price. The transaction resulted in Tribune being burdened with $13 billion in debt
(including the approximate $5 billion currently owed by Tribune). At this level, the firm's debt was ten times EBITDA,
more than two and a half times that of the average media company. Annual interest and principal repayments reached
$800 million (almost three times their preacquisition level), about 62% of the firm's previous EBITDA cash flow of
$1.3 billion. While the ESOP owned the company, it was not be liable for the debt guaranteed by Tribune.
By filing for Chapter 11 bankruptcy protection, the Tribune Company sought a reprieve from its creditors while it
attempted to restructure its business. Although the extent of the losses to employees, creditors, and other stakeholders is
difficult to determine, some things are clear. Any pension funds set aside prior to the closing remain with the
employees, but it is likely that equity contributions made to the ESOP on behalf of the employees since the closing
would be lost. The employees would become general creditors of Tribune. As a holder of subordinated debt, Mr. Zell
had priority over the employees if the firm was liquidated and the proceeds distributed to the creditors.
Lenders
Zell
Lenders
Zell
Tribune
Shareholders
ESOP
Tribune
Stage 1
Stage 2
$3.85 Billion
$.25 billion
$4 Billion
$.065 Billion
126 Million Shares
$4.2 Billion
121 Million Shares
$4.05
126 Million Shares
& Loan Guarantee
Those benefitting from the deal included Tribune's public shareholders, including the Chandler family, which owed
12% of Tribune as a result of its prior sale of the Times Mirror to Tribune, and Dennis FitzSimons, the firm's former
CEO, who received $17.7 million in severance and $23.8 million for his holdings of Tribune shares. Citigroup and
Merrill Lynch received $35.8 million and $37 million, respectively, in advisory fees. Morgan Stanley received $7.5
million for writing a fairness opinion letter. Finally, Valuation Research Corporation received $1 million for providing
a solvency opinion indicating that Tribune could satisfy its loan covenants.
What appeared to be one of the most complex deals of 2007, designed to reap huge tax advantages, soon became a
victim of the downward-spiraling economy, the credit crunch, and its own leverage. A lawsuit filed in late 2008 on
behalf of Tribune employees contended that the transaction was flawed from the outset and intended to benefit Sam
Zell and his advisors and Tribune’s board. Even if the employees win, they will simply have to stand in line with other
Tribune creditors awaiting the resolution of the bankruptcy court proceedings.
Discussion Questions:
1. What is the acquisition vehicle, post-closing organization, form of payment, form of acquisition, and tax
strategy described in this case study?
2. Describe the firm’s strategy to finance the transaction?
3. Is this transaction best characterized as a merger, acquisition, leveraged buyout, or spin-off? Explain your
answer.
4. Is this transaction taxable or non-taxable to Tribune’s public shareholders? To its post-transaction
shareholders? Explain your answer.
5. Comment on the fairness of this transaction to the various stakeholders involved. How would you apportion
the responsibility for the eventual bankruptcy of Tribune among Sam Zell and his advisors, the Tribune board,
and the largely unforeseen collapse of the credit markets in late 2008? Be specific.

34
Financing LBOs--The SunGard Transaction
With their cash hoards accumulating at an unprecedented rate, there was little that buyout firms could do but to invest
in larger firms. Consequently, the average size of LBO transactions grew significantly during 2005. In a move
reminiscent of the blockbuster buyouts of the late 1980s, seven private investment firms acquired 100 percent of the
outstanding stock of SunGard Data Systems Inc. (SunGard) in late 2005. SunGard is a financial software firm known
for providing application and transaction software services and creating backup data systems in the event of disaster.
The company‘s software manages 70 percent of the transactions made on the Nasdaq stock exchange, but its biggest
business is creating backup data systems in case a client’s main systems are disabled by a natural disaster, blackout, or
terrorist attack. Its large client base for disaster recovery and back-up systems provides a substantial and predictable
cash flow.
SunGard’s new owners include Silver lake Partners, Bain Capital LLC, The Blackstone Group L.P., Goldman Sachs
Capital Partners, Kohlberg Kravis Roberts & Co., Providence Equity Partners Inc. and Texas Pacific Group. Buyout
firms in 2005 tended to band together to spread the risk of a deal this size and to reduce the likelihood of a bidding war.
Indeed, with SunGard, there was only one bidder, the investor group consisting of these seven firms.
The software side of SunGard is believed to have significant growth potential, while the disaster-recovery side
provides a large stable cash flow. Unlike many LBOs, the deal was announced as being all about growth of the
financial services software side of the business. The deal is structured as a merger, since SunGard would be merged
into a shell corporation created by the investor group for acquiring SunGard. Going private, allows SunGard to invest
heavily in software without being punished by investors, since such investments are expensed and reduce reported
earnings per share. Going private also allows the firm to eliminate the burdensome reporting requirements of being a
public company.
The buyout represented potentially a significant source of fee income for the investor group. In addition to the 2
percent management fees buyout firms collect from investors in the funds they manage, they receive substantial fee
income from each investment they make on behalf of their funds. For example, the buyout firms receive a 1 percent
deal completion fee, which is more than $100 million in the SunGard transaction. Buyout firms also receive fees paid
for by the target firm that is “going private” for arranging financing. Moreover, there are also fees for conducting due
diligence and for monitoring the ongoing performance of the firm taken private. Finally, when the buyout firms exit
their investments in the target firm via a sale to a strategic buyer or a secondary IPO, they receive 20 percent (i.e., so-
called carry fee) of any profits.
Under the terms of the agreement, SunGard shareholders received $36 per share, a 14 percent premium over the
SunGard closing price as of the announcement date of March 28, 2005, and 40 percent more than when the news first
leaked about the deal a week earlier. From the SunGard shareholders’ perspective, the deal is valued at $11.4 billion
dollars consisting of $10.9 billion for outstanding shares and “in-the-money” options (i.e., options whose exercise price
is less than the firm’s market price per share) plus $500 million in debt on the balance sheet.
The seven equity investors provided $3.5 billion in capital with the remainder of the purchase price financed by
commitments from a lending consortium consisting of Citigroup, J.P. Morgan Chase & Co., and Deutsche Bank. The
purpose of the loans is to finance the merger, repay or refinance SunGard’s existing debt, provide ongoing working
capital, and pay fees and expenses incurred in connection with the merger. The total funds necessary to complete the
merger and related fees and expenses is approximately $11.3 billion, consisting of approximately $10.9 billion to pay
SunGard’s stockholders and about $400.7 million to pay fees and expenses related to the merger and the financing
arrangements. Note that the fees that are to be financed comprise almost 4 percent of the purchase price. Ongoing
working capital needs and capital expenditures required obtaining commitments from lenders well in excess of $11.3
billion.
35
The merger financing consists of several tiers of debt and “credit facilities.” Credit facilities are arrangements for
extending credit. The senior secured debt and senior subordinated debt are intended to provide “permanent” or long-
term financing. Senior debt covenants included restrictions on new borrowing, investments, sales of assets, mergers
and consolidations, prepayments of subordinated indebtedness, capital expenditures, liens and dividends and other
distributions, as well as a minimum interest coverage ratio and a maximum total leverage ratio.
If the offering of notes is not completed on or prior to the closing, the banks providing the financing have committed
to provide up to $3 billion in loans under a senior subordinated bridge credit facility. The bridge loans are intended as
a form of temporary financing to satisfy immediate cash requirements until permanent financing can be arranged. A
special purpose SunGard subsidiary will purchase receivables from SunGard, with the purchases financed through the
sale of the receivables to the lending consortium. The lenders subsequently finance the purchase of the receivables by
issuing commercial paper, which is repaid as the receivables are collected. The special purpose subsidiary is not shown
on the SunGard balance sheet. Based on the value of receivables at closing, the subsidiary could provide up to $500
million. The obligation of the lending consortium to buy the receivables will expire on the sixth anniversary of the
closing of the merger.
The following table provides SunGard’s post-merger proforma capital structure. Note that the proforma capital
structure is portrayed as if SunGard uses 100 percent of bank lending commitments. Also, note that individual LBO
investors may invest monies from more than one fund they manage. This may be due to the perceived attractiveness of
the opportunity or the limited availability of money in any single fund. Of the $9 billion in debt financing, bank loans
constitute 56 percent and subordinated or mezzanine debt comprises represents 44 percent.
SunGard Proforma Capital Structure
Pre-Merger Existing SunGard Debt Outstanding $Millions
Senior Notes (3.75% due in 2009) 250,000,000
Senior Notes (4.785 due in 2014) 250,000,000
Total Existing Debt Outstanding 500,000,000
Debt Portion of Merger Financing
Senior Secured Notes (≤ $5 billion) 5,000,000,000
$1 billion revolving credit facility with
6 year term
$4 billion term loan maturing in 7-1/2 years
Senior Subordinated Notes (≤$3 billion) 3,000,000,000
Payment-in-Kind Senior Notes (≤$.5 billion) 500,000,000
Receivables Credit Facility (≤$.5 billion) 500,000,000
Total Merger Financing (as if fully utilized) 9,000,000,000
Equity Portion of Merger Financing
Equity Investor Commitment ($Millions)
Silver Lake Partners II, LP1 540,000,000
Bain Capital Fund VIII, LP 540,000,000
Blackstone Capital Partners IV, L.P. 270,000,000
Blackstone Communications Partners I, L.P. 270,000,000
GS Capital Partners 2000, L.P. 250,000,000
GS Capital Partners 2000 V, L.P. 250,000,000
KKR Millennium Fund, L.P. 540,000,000
Providence Equity Partners V, L.P. 300,000,000
TPG Partners IV, L.P. 540,000,000
Total Equity Portion of Merger Financing 3,500,000,000
Total Debt and Equity 13,000,000,000
1The roman numeral II refers to the fund providing the equity capital managed by the
partnership.
Case Study Discussion Questions:
36
1. SunGard is a software company with relatively few tangible assets. Yet, the ratio of debt to equity of almost 5
to 1. Why do you think lenders would be willing to engage in such a highly leveraged transaction for a firm of
this type?
2. Under what circumstances would SunGard refinance the existing $500 million in outstanding senior debt after
the merger? Be specific.
3. In what ways is this transaction similar to and different from those that were common in the 1980s? Be
specific.
4. Why are payment-in-kind securities (e.g., debt or preferred stock) particularly well suited for financing LBOs?
Under what circumstances might they be most attractive to lenders or investors?
5. Explain how the way in which the LBO is financed affects the way it is operated and the timing of when
equity investors choose to exit the business. Be specific.
HCA'S LBO REPRESENTS A HIGH-RISK BET ON GROWTH
While most LBOs are predicated on improving operating performance through a combination of aggressive cost cutting
and revenue growth, HCA laid out an unconventional approach in its effort to take the firm private. On July 24, 2006,
management again announced that it would "go private" in a deal valued at $33 billion including the assumption of
$11.7 billion in existing debt.
The approximate $21.3 billion purchase price for HCA's stock was financed by a combination of $12.8 billion in
senior secured term loans of varying maturities and an estimated $8.5 billion in cash provided by Bain Capital, Merrill
Lynch Global Private Equity, and Kohlberg Kravis Roberts & Company. HCA also would take out a $4 billion
revolving credit line to satisfy immediate working capital requirements. The firm publicly announced a strategy of
improving performance through growth rather than through cost cutting. HCA's network of 182 hospitals and 94
surgery centers is expected to benefit from an aging U.S. population and the resulting increase in health-care spending.
The deal also seems to be partly contingent on the government assuming a larger share of health-care costs in the
future. Finally, with many nonprofit hospitals faltering financially, HCA may be able to acquire them inexpensively.
While the longer-term trends in the health-care industry are unmistakable, shorter-term developments appear
troublesome, including sluggish hospital admissions, more uninsured patients, and higher bad debt expenses. Moreover,
with Medicare and Medicaid financially insolvent, it is unclear if future increases in government health-care spending
would be sufficient to enable HCA investors to achieve their expected financial returns. With the highest operating
37
profit margins in the industry, it is uncertain if HCA's cash flows could be significantly improved by cost cutting, if the
revenue growth assumptions fail to materialize. HCA's management and equity investors have put themselves in a
position in which they seem to have relatively little influence over the factors that directly affect the firm's future cash
flows.
Discussion Questions:
1. Does a hospital or hospital system represent a good or bad LBO candidate? Explain your answer.
2. Having pledged not to engage in aggressive cost cutting, how do you think HCA and its financial sponsor
group planned on paying off the loans?
practices.
Case Study. Sony Buys MGM
Sony’s long-term vision has been to create synergy between its consumer electronics products and music, movies, and
games. Sony, which bought Columbia Pictures in 1989 for $3.4 billion, had wanted to control Metro-Goldwyn-Mayer’s
film library for years, but it did not want to pay the estimated $5 billion it would take to acquire it. On September 14,
2004, a consortium, consisting of Sony Corp of America, Providence Equity Partners, Texas Pacific Group, and DLJ
Merchant Banking Partners, agreed to acquire MGM for $4.8 billion, consisting of $2.85 billion in cash and the
assumption of $2 billion in debt. The cash portion of the purchase price consisted of about $1.8 billion in debt and $1
billion in equity capital. Of the equity capital, Providence contributed $450 million, Sony and Texas Pacific Group
$300 million, and DLJ Merchant Banking $250 million.
The combination of Sony and MGM will create the world’s largest film library of about 7,600 titles, with MGM
contributing about 54 percent of the combined libraries. Sony will control MGM and Comcast will distribute the films
over cable TV. Sony will shut down MGM’s film making operations and move all operations to Sony. Kirk Kerkorian,
who holds a 74 percent stake in MGM, will make $2 billion because of the transaction. The private equity partners
could cash out within three-to-five years, with the consortium undertaking an initial public offering or sale to a strategic
investor. Major risks include the ability of the consortium partners to maintain harmonious relations and the
problematic growth potential of the DVD market.
Sony and MGM negotiations had proven to be highly contentious for almost five months when media giant Time
Warner Inc. emerged to attempt to satisfy Kerkorian’s $5 billion asking price. The offer was made in stock on the
assumption that Kerkorian would want a tax-free transaction. MGM’s negotiations with Time Warner stalled around
the actual value of Time Warner stock, with Kerkorian leery about Time Warner’s future growth potential. Time
Warner changed its bid in late August to an all cash offer, albeit somewhat lower than the Sony consortium bid, but it
was more certain. Sony still did not have all of its financing in place. Time Warner had a “handshake agreement” with
MGM by Labor Day for $11 per share, about $.25 less than Sony’s.
38
The Sony consortium huddled throughout the Labor Day weekend to put in place the financing for a bid of $12 per
share. What often takes months to work out in most leveraged buyouts was hammered out in three days of marathon
sessions at law firm Davis Polk & Wardwell. In addition to getting final agreement on financing arrangements
including loan guarantees from J.P. Morgan Chase & Company, Sony was able to reach agreement with Comcast to
feature MGM movies in new cable and video-on-demand TV channels. This distribution mechanism meant additional
revenue for Sony, making it possible to increase the bid to $12 per share. Sony also offered to make a $150 non-
refundable cash payment to MGM. As a testament to the adage that timing is everything, the revised Sony bid was
faxed to MGM just before the beginning of a board meeting to approve the Time Warner offer.
Discussion Questions:
1. Do you believe that MGM is an attractive LBO candidate? Why? Why not?
2. In what way do you believe that Sony’s objectives might differ from those of the private equity investors
making up the remainder of the consortium? How might such differences affect the management of MGM?
Identify possible short-term and long-term effects.
3. How did Time Warner’s entry into the bidding affect pace of the negotiations and the relative bargaining
power of MGM, Time Warner, and the Sony consortium?
4. What do you believe were the major factors persuading the MGM board to accept the Revised Sony bid? In
your judgment, do these factors make sense? Explain your answer.
RJR NABISCO GOES PRIVATE—
KEY SHAREHOLDER AND PUBLIC POLICY ISSUES
Background
The largest LBO in history is as well known for its theatrics as it is for its substantial improvement in shareholder
value. In October 1988, H. Ross Johnson, then CEO of RJR Nabisco, proposed an MBO of the firm at $75 per share.
His failure to inform the RJR board before publicly announcing his plans alienated many of the directors. Analysts
outside the company placed the breakup value of RJR Nabisco at more than $100 per share—almost twice its then
current share price. Johnson’s bid immediately was countered by a bid by the well-known LBO firm, Kohlberg, Kravis,


