39
and Roberts (KKR), to buy the firm for $90 per share (Wasserstein, 1998). The firm’s board immediately was faced
with the dilemma of whether to accept the KKR offer or to consider some other form of restructuring of the company.
The board appointed a committee of outside directors to assess the bid to minimize the appearance of a potential
conflict of interest in having current board members, who were also part of the buyout proposal from management, vote
on which bid to select.
The bidding war soon escalated with additional bids coming from Forstmann Little and First Boston, although the
latter’s bid never really was taken very seriously. Forstmann Little later dropped out of the bidding as the purchase
price rose. Although the firm’s investment bankers valued both the bids by Johnson and KKR at about the same level,
the board ultimately accepted the KKR bid. The winning bid was set at almost $25 billion—the largest transaction on
record at that time and the largest LBO in history. Banks provided about three-fourths of the $20 billion that was
borrowed to complete the transaction. The remaining debt was supplied by junk bond financing. The RJR shareholders
were the real winners, because the final purchase price constituted a more than 100% return from the $56 per share
price that existed just before the initial bid by RJR management.
When KKR eventually fully liquidated its position in RJR Nabisco in 1995, it did so for a far smaller profit than
expected. KKR earned a profit of about $60 million on an equity investment of $3.1 billion. KKR had not done well for
the outside investors who had financed more than 90% of the total equity investment in KKR. However, KKR fared
much better than investors had in its LBO funds by earning more than $500 million in transaction fees, advisor fees,
management fees, and directors’ fees. The publicity surrounding the transaction did not cease with the closing of the
transaction. Dissident bondholders filed suits alleging that the payment of such a large premium for the company
represented a “confiscation” of bondholder wealth by shareholders.
Potential Conflicts of Interest
In any MBO, management is confronted by a potential conflict of interest. Their fiduciary responsibility to the
shareholders is to take actions to maximize shareholder value; yet in the RJR Nabisco case, the management bid
appeared to be well below what was in the best interests of shareholders. Several proposals have been made to
minimize the potential for conflict of interest in the case of an MBO, including that directors, who are part of an MBO
effort, not be allowed to participate in voting on bids, that fairness opinions be solicited from independent financial
advisors, and that a firm receiving an MBO proposal be required to hold an auction for the firm.
The most contentious discussion immediately following the closing of the RJR Nabisco buyout centered on the
alleged transfer of wealth from bond and preferred stockholders to common stockholders when a premium was paid for
the shares held by RJR Nabisco common stockholders. It often is argued that at least some part of the premium is offset
by a reduction in the value of the firm’s outstanding bonds and preferred stock because of the substantial increase in
leverage that takes place in LBOs.
Winners and Losers
RJR Nabisco shareholders before the buyout clearly benefited greatly from efforts to take the company private.
However, in addition to the potential transfer of wealth from bondholders to stockholders, some critics of LBOs argue
that a wealth transfer also takes place in LBO transactions when LBO management is able to negotiate wage and
benefit concessions from current employee unions. LBOs are under greater pressure to seek such concessions than
other types of buyouts because they need to meet huge debt service requirements.
Discussion Questions:
1. In your opinion, was the buyout proposal presented by Ross Johnson’s management group in the best interests
of the shareholders? Why? / Why not?
2. What were the RJR Nabisco board’s fiduciary responsibilities to the shareholders? How well did they satisfy
these responsibilities? What could/should they have done differently?
3. Why might the RJR Nabisco board have accepted the KKR bid over the Johnson bid?
4. How might bondholders and preferred stockholders have been hurt in the RJR Nabisco leveraged buyout?
5. Describe the potential benefits and costs of LBOs to shareholders, employers, lenders, customers, and
communities in which the firm undergoing the buyout may have operations. Do you believe that on average
LBOs provide a net benefit or cost to society? Explain your answer.
41
Case Study. Private Equity Firms Acquire Yellow Pages Business
Qwest Communications agreed to sell its yellow pages business, QwestDex, to a consortium led by the Carlyle Group
and Welsh, Carson, Anderson and Stowe for $7.1 billion. In a two stage transaction, Qwest sold the eastern half of the
yellow pages business for $2.75 billion in late 2002. This portion of the business included directories in Colorado,
Iowa, Minnesota, Nebraska, New Mexico, South Dakota, and North Dakota. The remainder of the business, Arizona,
Idaho, Montana, Oregon, Utah, Washington, and Wyoming, was sold for $4.35 billion in late 2003. Caryle and Welsh
Carson each put in $775 million in equity (about 21 percent of the total purchase price).
Qwest was in a precarious financial position at the time of the negotiation. The telecom was trying to avoid
bankruptcy and needed the first stage financing to meet impending debt repayments due in late 2002. Qwest is a local
phone company in 14 western states and one of the nation’s largest long-distance carriers. It had amassed $26.5 billion
in debt following a series of acquisitions during the 1990s.
The Carlyle Group has invested globally, mainly in defense and aerospace businesses, but it has also invested in
companies in real estate, health care, bottling, and information technology. Welsh Carson focuses primarily on the
communications and health care industries. While the yellow pages business is quite different from their normal areas
of investment, both firms were attracted by its steady cash flow. Such cash flow could be used to trim debt over time
and generate a solid return. The business’ existing management team will continue to run the operation under the new
ownership. Financing for the deal will come from J.P. Morgan Chase, Bank of America, Lehman Brothers, Wachovia
Securities, and Deutsche Bank. The investment groups agreed to a two stage transaction to facilitate borrowing the
large amounts required and to reduce the amount of equity each buyout firm had to invest. By staging the purchase, the
lenders could see how well the operations acquired during the first stage could manage their debt load.
The new company will be the exclusive directory publisher for Qwest yellow page needs at the local level and will
provide all of Qwest’s publishing requirements under a fifty year contract. Under the arrangement, Qwest will continue
to provide certain services to its former yellow pages unit, such as billing and information technology, under a variety
of commercial services and transitional services agreements (Qwest: 2002).
Discussion Questions:
1. Why was QwestDex considered an attractive LBO candidate? Do you think it has significant growth potential?
Explain the following statement: “A business with high growth potential may not be a good candidate for an LBO.
2. Why did the buyout firms want a 50-year contract to be the exclusive provider of publishing services to Qwest
Communications?
3. Why would the buyout firms want Qwest to continue to provide such services as billing and information
technology support? How might such services be priced?
42
4. Why would it take five very large financial institutions to finance the transactions?
5. Why was the equity contribution of the buyout firms as a percentage of the total capital requirements so much
higher than amounts contributed during the 1980s?
Cox Enterprises Offers to Take Cox Communications Private
In an effort to take the firm private, Cox Enterprises announced on August 3, 2004 a proposal to buy the remaining
38% of Cox Communications’ shares that they did not currently own for $32 per share. Cox Communications is the
third largest provider of cable television, telecommunications, and wireless services in the U.S, serving more than 6.2
million customers. Historically, the firm’s cash flow has been steady and substantial.
The deal is valued at $7.9 billion and represented a 16% premium to Cox Communication’s share price at that time.
Cox Communications would become a subsidiary of Cox Enterprises and would continue to operate as an autonomous
business. In response to the proposal, the Cox Communications Board of Directors formed a special committee of
independent directors to consider the proposal. Citigroup Global Markets and Lehman Brothers Inc. have committed
$10 billion to the deal. Cox Enterprises would use $7.9 billion for the tender offer, with the remaining $2.1 billion used
for refinancing existing debt and to satisfy working capital requirements.
Cable service firms have faced intensified competitive pressures from satellite service providers DirecTV Group and
EchoStar communications. Moreover, telephone companies continue to attack cable’s high-speed Internet service by
cutting prices on high-speed Internet service over phone lines. Cable firms have responded by offering a broader range
of advanced services like video-on-demand and phone service. Since 2000, the cable industry has invested more than
$80 billion to upgrade their systems to provide such services, causing profitability to deteriorate and frustrating
investors. In response, cable company stock prices have fallen. Cox Enterprises stated that the increasingly competitive
cable industry environment makes investment in the cable industry best done through a private company structure.
Discussion Questions::
1. Why did the board feel that it was appropriate to set up special committee of independent board directors?
2. Why does Cox Enterprises believe that the investment needed for growing its cable business is best done
through a private company structure?
Financing Challenges in the Home Depot Supply Transaction
Buyout firms Bain Capital, Carlyle Group, and Clayton, Dubilier & Rice (CD&R) bid $10.3 billion in June 2007 to buy
Home Depot Inc.’s HD Supply business. HD Supply represented a collection of small suppliers of construction
43
products. Home Depot had announced earlier in the year that it planned to use the proceeds of the sale to pay for a
portion of a $22.5 billion stock buyback.
Three banks, Lehman Brothers, JPMorgan Chase, and Merril Lynch agreed to provide the firms with a $4 billion
loan. The repayment of the loans was predicated on the ability of the buyout firms to improve significantly HD
Supply’s current cash flow. Such loans are normally made with the presumption that they can be sold to investors, with
the banks collecting fees from both the borrower and investor groups. However, by July, concern about the credit
quality of subprime mortgages spread to the broader debt market and raised questions about the potential for default of
loans made to finance highly leveraged transactions. The concern was particularly great for so–called “covenant–lite”
loans for which the repayment terms were very lenient.
Fearing they would not be able to resell such loans to investors, the three banks involved in financing the HD
Supply transaction wanted more financial protection. Additional protection, they reasoned, would make such loans
more marketable to investors. They used the upheaval in the credit markets as a pretext for reopening negotiations on
their previous financing commitments. Home Depot was willing to lower the selling price thereby reducing the amount
of financing required by the buyout firms and was willing to guarantee payment in the event of default by the buyout
firms. While Bain, Carlyle, and CD&R were willing to increase their cash investment and pay higher fees to the banks,
they were unwilling to alter the original terms of the loans. Eventually the banks agreed to provide financing consisting
of a $1 billion “covenant–lite” loan and a $1.3 billion “payment–in–kind” loan. Home Depot agreed to assume the loan
payments on the $1 billion loan if the investor firms were to default and to lower the selling price to $8.5 billion for
87.5 percent of HD Supply, with Home Depot retaining the remaining 12.5 percent.
By the end of August, Home Depot had succeeded in raising the cash needed to help pay for its share repurchase,
and the banks had reduced their original commitment of $4 billion in loans to $2.3 billion. While they had agreed to put
more money into the transaction, the buyout firms had been successful in limiting the number of new restrictive
covenants.
Case Study Discussion Questions:
1. Based on the information given it the case, determine the amount of the price reduction Home Depot accepted
for HD Supply and the amount of cash the three buyout firms put into the transaction?
2. Why did banks lower their lending standards in financing LBOs in 2006 and early 2007? How did the lax
standards contribute to their inability to sell the loans to investors? How did the inability to sell the loans once
made curtail their future lending?
Cerberus Capital Management Acquires Chrysler Corporation
According to the terms of the transaction, Cerberus would own 80.1 percent of Chrysler’s auto manufacturing and
financial services businesses in exchange for $7.4 billion in cash. Daimler would continue to own 19.9 percent of the
new business, Chrysler Holdings LLC. Of the $7.4 billion, Daimler would receive $1.35 billion while the remaining
$6.05 billion would be invested in Chrysler (i.e., $5.0 billion is to be invested in the auto manufacturing operation and
$1.05 billion in the finance unit). Daimler also agreed to pay to Cerberus $1.6 billion to cover Chrysler‘s long-term debt
and cumulative operating losses during the four months between the signing of the merger agreement and the actual
closing. In acquiring Chrysler, Cerberus assumed responsibility for an estimated $18 billion in unfunded retiree pension
and medical benefits. Daimler also agreed to loan Chrysler Holdings LLC $405 million.
The transaction is atypical of those involving private equity investors, which usually take public firms private,
expecting to later sell them for a profit. The private equity firm pays for the acquisition by borrowing against the firm’s
assets or cash flow. However, the estimated size of Chrysler’s retiree health-care liabilities and the uncertainty of future
cash flows make borrowing impractical. Therefore, Cerberus agreed to invest its own funds in the business to keep it
running while it restructured the business.
By going private, Cerberus would be able to focus on the long-term without the disruption of meeting quarterly
earnings reports. Cerberus was counting on paring retiree health-care liabilities through aggressive negotiations with
the United Auto Workers (UAW). Cerberus sought a deal similar to what the UAW accepted from Goodyear Tire and
Rubber Company in late 2006. Under this agreement, the management of $1.2 billion in health-care liabilities was
transferred to a fund managed by the UAW, with Goodyear contributing $1 billion in cash and Goodyear stock. By
transferring responsibility for these liabilities to the UAW, Chrysler believed that it would be able to cut in half the $30
dollar per hour labor cost advantage enjoyed by Toyota. Cerberus also expected to benefit from melding Chrysler’s
financial unit with Cerberus’s 51 percent ownership stake in GMAC, GM’s former auto financing business. By
consolidating the two businesses, Cerberus hoped to slash cost by eliminating duplicate jobs, combining overlapping
operations such as data centers and field offices, and increasing the number of loans generated by combining back–
office operations.
However, the 2008 credit market meltdown, severe recession, and subsequent free fall in auto sales threatened the
financial viability of Chrysler, despite an infusion of U.S. government capital, and it’s leasing operations as well as
GMAC. GMAC applied for commercial banking status to be able to borrow directly from the U.S. Federal Reserve. In
late 2008, the U.S. Treasury purchased $6 billion in GMAC preferred stock to provide additional capital to the
financially ailing firm. To avoid being classified as a bank holding company under direct government supervision,
Cerberus reduced its ownership in 2009 to 14.9 percent of voting stock and 33 percent of total equity by distributing
equity stakes to its coinvestors in GMAC. By surrendering its controlling interest in GMAC, it is less likely that
Cerberus would be able to realize anticipated cost savings by combining the GMAC and Chrysler Financial operations.
In early 2009, Chrysler entered into negotiations with Italian auto maker Fiat to gain access to the firm’s technology in
exchange for a 20 percent stake in Chrysler.
Discussion Questions and Answers:
1. What were the motivations for this deal from Cerberus’ perspective? From Daimler’s perspective?
2. What are the risks to this deal’s eventual success? Be specific.
3. Cite examples of economies of scale and scope?
45
4. Cerberus and Daimler will own 80.1% and 19.9% of Chrysler Holdings LLC, respectively. Why do you think
the two parties agreed to this distribution of ownership?
5. Which of the leading explanations of why deals sometimes fail to meet expectations best explains why the
combination of Daimler and Chrysler failed? Explain your answer.
6. The new company, Chrysler Holdings, is a limited liability company. Why do you think CCM chose this legal
structure over a more conventional corporate structure?
Pacific Investors Acquires California Kool in a Leveraged Buyout
Pacific Investors (PI) is a small private equity limited partnership with $3 billion under management. The objective of
the fund is to give investors at least a 30-percent annual average return on their investment by judiciously investing
these funds in highly leveraged transactions. PI has been able to realize such returns over the last decade because of its
focus on investing in industries that have slow but predictable growth in cash flow, modest capital investment
requirements, and relatively low levels of research and development spending. In the past, PI made several lucrative
investments in the contract packaging industry, which provides packaging for beverage companies that produce various
types of noncarbonated and carbonated beverages. Because of its commitments to its investors, PI likes to liquidate its
investments within four to six years of the initial investment through a secondary public offering or sale to a strategic
investor.
Following its past success in the industry, PI currently is negotiating with California Kool (CK), a privately owned
contract beverage packaging company with the technology required to package many types of noncarbonated drinks.
CK’s 2003 revenue and net income are $190.4 million and $5.9 million, respectively. With a reputation for effective
management, CK is a medium-sized contract packaging company that owns its own plant and equipment and has a
history of continually increasing cash flow. The company also has significant unused excess capacity, suggesting that
production levels can be increased without substantial new capital spending.
The owners of CK are demanding a purchase price of $70 million. This is denoted on the balance sheet (see Table
13-15 at the end of the case) as a negative entry in additional paid–in capital. This price represents a multiple of 11.8
times 2003’s net income, almost twice the multiple for comparable publicly traded companies. Despite the “rich”
multiple, PI believes that it can finance the transaction through an equity investment of $25 million and $47 million in
debt. The equity investment consists of $3 million in common stock, with PI’s investors and CK’s management each
contributing $1.5 million. Debt consists of a $12 million revolving loan to meet immediate working capital
requirements, $20 million in senior bank debt secured by CK’s fixed assets, and $15 million in a subordinated loan
from a pension fund. The total cost of acquiring CK is $72 million, $70 million paid to the owners of CK and $2
million in legal and accounting fees.
As indicated on Table 13-15, the change in total liabilities plus shareholders’ equity (i.e., total sources of funds or
cash inflows) must equal the change in total assets (i.e., total uses of funds or cash outflows). Therefore, as shown in
the adjustments column, total liabilities increase by $47 million in total borrowings and shareholders’ equity declines by
$45 million (i.e., $25 million in preferred and common equity provided by investors less $70 million paid to CK
owners). The excess of sources over uses of $2 million is used to finance legal and accounting fees incurred in closing
the transaction. Consequently, total assets increase by $2 million and total liabilities plus shareholders’ equity increase
by $2 million between the pre– and postclosing balance sheets as shown in the adjustments column.hasi1 Delta;Total
assets = ΔTotal liabilities + ΔShareholders’ equity: $2 million = $47 million –$45 million = $2 million.
Revenue for CK is projected to grow at 4.5 percent annually through the foreseeable future. Operating expenses and
sales, general, and administrative expenses as a percent of sales are expected to decline during the first three years of
operation due to aggressive cost cutting and the introduction of new management and engineering processes. Similarly,
improved working capital management results in significant declines in working capital as a percent of sales during the
first year of operation. Gross fixed assets as percent of sales is held constant at its 2003 level during the forecast period,
reflecting reinvestment requirements to support the projected increase in net revenue. Equity cash flow adjusted to
include cash generated in excess of normal operating requirements (i.e., denoted by the change in investments available
for sale) is expected to reach $8.5 million annually by 2010. Using the cost of capital method, the cost of equity
declines in line with the reduction in the firm’s beta as the debt is repaid from 26 percent in 2004 to 16.5 percent in
2010. In contrast, the adjusted present value method employs a constant unlevered COE of 17 percent.
The deal would appear to make sense from the standpoint of PI, since the projected average annual internal rates of
return (IRRs) for investors exceed PI’s minimum desired 30 percent rate of return in all scenarios considered between
2007 and 2009 (see Table 13-13). This is the period during which investors would like to “cash out.” The rates of return
scenarios are calculated assuming the business can be sold at different multiples of adjusted equity cash flow in the
year in which the business is assumed to be sold. Consequently, IRRs are calculated using the cash outflow (initial
equity investment in the business) in the first year offset by any positive equity cash flow from operations generated in
the first year, equity cash flows for each subsequent year, and the sum of equity cash flow in the year in which the
business is sold or taken public plus the estimated sale value (e.g., eight times equity cash flow) in that year. Adjusted
equity cash flow includes free cash flow generated from operations and the increase in “investments available for sale.”
Such investments represent cash generated in excess of normal operating requirements; and as such, this cash is
available to LBO investors.
The actual point at which CK would either be taken public, sold to a strategic investor, or sold to another LBO fund
depends on stock market conditions, CK‘s leverage relative to similar firms in the industry, and cash flow performance
as compared to the plan. Discounted cash flow analysis also suggests that PI should do the deal, since the total present
value of adjusted equity cash flow of $57.2 million using the CC method is more than twice the magnitude of the initial
equity investment. At $56 million, the APV method results in a slightly lower estimate of total present value. See
Tables 13-14,13-15, and 13-16 for the income, balance-sheet, and cash-flow statements, respectively, associated with
this transaction. Exhibits 13-1 and 13-2 illustrate the calculation of present value of the transaction based on the cost of
capital and the adjusted present value methods, respectively. Note the actual Excel spreadsheets and formulas used to
create these financial tables are available on the CD-ROM accompanying this book in a worksheet, Excel-Based
Leveraged Buyout Valuation and Structuring Model.
Discussion Questions
1. What criteria did Pacific Investors (PI) use to select California Kool (CK) as a target for an LBO? Why
were these criteria employed?
2. Describe how PI financed the purchase price. Speculate as why each source of financing was selected?
How did CK pay for feels incurred in closing the transaction?
3. What are the advantages and disadvantages of using enterprise cash flow in valuing CK? In what might
EBITDA been a superior (inferior) measure of cash flow for valuing CK?
4. Compare and contrast the Cost of Capital Method and the Adjusted Present Value Method of valuation.
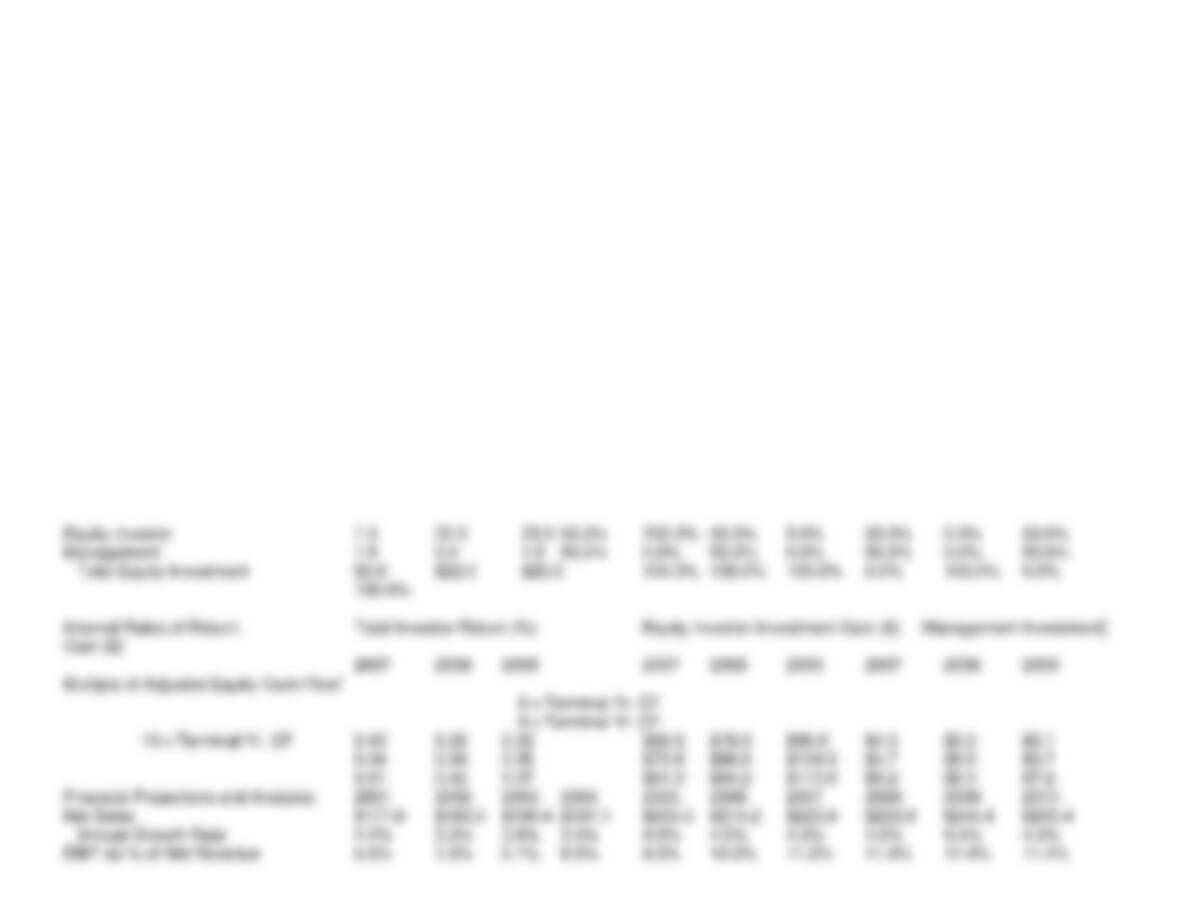
Table 13-11: California Kool Model Output Summary
Sources (Cash Inflows) and Uses (Cash Outflows) of Funds: Pro Forma Capital Structure
Amount($) Interest
Rate (%) Uses of Funds Amount ($) Form of Debt and Equity Market
Value % of Total
Capital
Sources of Funds:
Cash From Balance Sheet $0.0 0.0% Cash to Owners $70.0 Revolving Loan $12.0 16.7%
New Revolving Loan $12.0 9.0% Seller’s Equity $0.0 Senior Debt $20.0 27.8%
New Senior Debt $20.0 9.0% Seller’s Note $0.0 Subordinated Debt $15.0 20.8%
New Subordinated Debt $15.0 12.0% Excess Cash $0.0 Total Debt $47.0 65.3%
New Preferred Stock (PIK) $22.0 12.0% Paid to Owners $70.0 Preferred Equity
$22.0 30.6%
New Common Stock $3.0 0.0% Debt Repayment $0.0 Common Equity $3.0
4.2%
Buyer Expenses $2.0 Total Equity $25.0 34.7%
Total Sources $72.0 Total Uses $72.0 Total Capital $72.0
Equity Investment: Ownership Distribution ($) % Distribution Fully Diluted Ownership Distribution
Common Preferred Total Common Preferred Common Warrants Pre-Option
Ownership Perform.
Options Fully Dil.
Ownership
49
Adjusted Enterprise Cash Flow2 $4.2 $0.2 $0.1 $9.5 $9.6 $10.8 $13.0 $13.4 $14.2 $14.9
Adjusted Equity Cash Flow $4.2 $0.2 $0.1 $0.3 $0.2 $1.8 $7.4 $7.7 $8.1 $8.5
Total Debt Outstanding 0 0 $47.0 $39.5 $31.5 $23.8 $19.2 $14.3 $8.8 $2.7
Total Debt/Adjusted Enterprise Cash Flow 0.0 0.0 NA 4.1 3.3 2.2 1.5 1.1 0.6 0.2
EBIT/Interest Expense 0 0 0 3.6 4.9 6.6 10.1 13.3 18.6 30.9
PV of Adjusted Equity Cash Flow @ 26% $57.2
PV of 2004-10 Adj. Equity CF/Terminal Val 28.1%
1Net Income + Depreciation & Amortization – Gross Capital Spending – Chg. In Working Capital – Principal Repayments – Change Investments
51
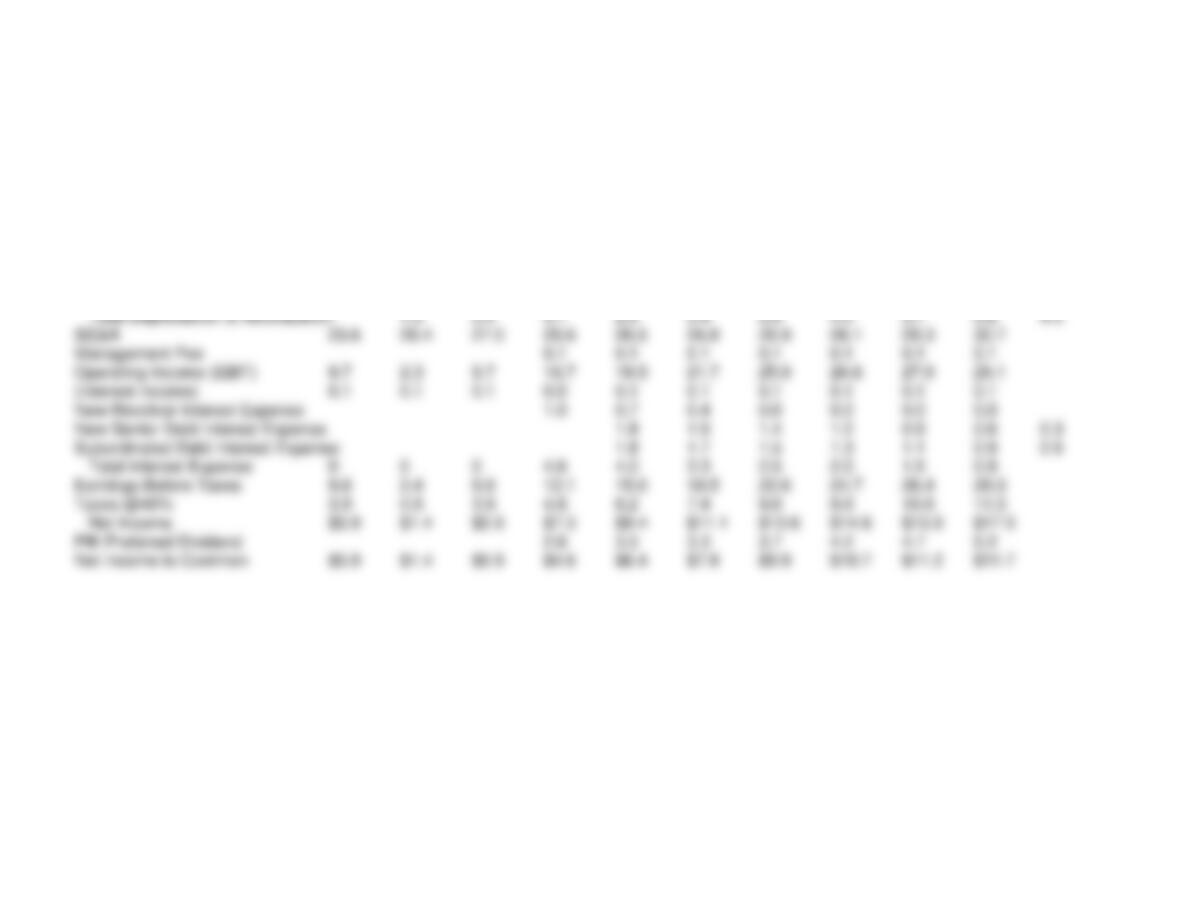
Table 13-12. California Kool Income Statement and Forecast Assumptions
Historical Period Projections: Twelve Months Ending December 31,
Income Statement Assumptions: 2001 2002 2003 2004 2005 2006 2007 2008 2009 2010
Net Sales Growth (%) 0.042 0.033 0.038 0.035 0.040 0.045 0.045 0.045 0.045 0.045
Cost of Sales as % of Sales 0.805 0.814 0.780 0.765 0.758 0.755 0.750 0.750 0.750 0.750
SG&A as % of Sales 0.133 0.144 0.142 0.135 0.130 0.125 0.120 0.120 0.120 0.120
Effective Tax Rate (%) 0.400 0.400 0.400 0.400 0.400 0.400 0.400 0.400 0.400 0.400
Income Statement:
Net Sales $177.6 $183.5 $190.4 $197.1 $205.0 $214.2 $223.8 $233.9 $244.4 $255.4
Cost of Sales 143.0 149.3 148.5 150.8 155.4 161.7 167.9 175.4 183.3 191.6
Gross Profit 34.6 34.1 41.9 46.3 49.6 52.5 56.0 58.5 61.1 63.9
Depreciation 1.3 5.4 5.1 2.4 2.9 3.4 3.5 3.7 3.8 4.0
Amortization of Financing Fees 0.5 0.5 0.5 0.5
Table 13-13. California Kool Balance Sheet and Forecast Assumptions
Historical Period Adjust. Closing Projections: Twelve Months Ended December,
52
2001 2002 2003 2003 2004 2005 2006 2007 2008 2009 2010
Balance Sheet Assumptions:
Cash & Marketable Securities (%Sales) 0.02 0.02 0.02 0.0 0.02 0.02 0.02 0.02 0.02 0.02 0.02
0.02
Accounts Receivable (%Sales) 0.161 0.158 0.167 0.0 0.167 0.155 0.155 0.155 0.155 0.155 0.155 0.155
0.0
Total Assets 66.9 70.6 77.3 2.0 79.3 77.7 80.3 83.4 95.5 106.8 118.8 131.3
Liabilities & Shareholders’ Equity ($Millions)
Current Liabilities:
Accounts Payable 14.2 15.2 16.0 0.0 16.0 15.4 16.0 16.7 17.5 18.2 19.1 19.9
Other Current Liabilities 13.1 14.5 14.5 0.0 14.5 13.8 14.3 15.0 15.7 16.4 17.1 17.9
Total Current Liabilities 27.4 29.7 30.5 0.0 30.5 29.2 30.3 31.7 33.1 34.6 36.2 37.8
Long-Term Debt:
Revolving Loan 12.0 12.0 7.9 3.7 0.0 0.0 0.0 0.0 0.0
Senior Debt 20.0 20.0 17.8 15.5 12.9 10.1 7.0 3.7 0.0
Subordinated Debt 15.0 15.0 13.8 12.4 10.9 9.2 7.2 5.1 2.7
Total Long-Term Debt 0.0 0.0 0.0 47.0 39.5 31.5 23.8 19.2 14.3 8.8 2.7
Shareholders’ Equity
Preferred Stock (PIK) 22.0 22.0 24.6 27.6 30.9 34.6 38.8 43.4 48.6
Common Stock 3.0 3.0 3.0 3.0 3.0 3.0 3.0 3.0 3.0
Additional Paid in Capital (70.0) (70.0) (70.0) (70.0) (70.0) (70.0) (70.0) (70.0) (70.0)
Retained Earnings 39.5 40.9 46.8 0.0 46.8 51.4 57.8 65.7 75.5 86.2 97.4 109.1
Total Shareholders‘ Equity 39.5 40.9 46.8 1.8 9.1 18.4 29.6 43.1 58.0 73.8 90.8
Total Liabilities & Shareholders’ Equity 66.9 70.6 77.3 2.0 79.3 77.7 80.3 85.0 95.5 106.8 118.8
131.3
Table 13-14: California Kool Cash Flow Statement and Analysis
Historical Data Projections: Twelve Months Ended
December 31,
2001 2002 2003 2004 2005 2006 2007 2008 2009
2010
GAAP Cash Flow ($Millions)
Cash Flow from Operating Activities:
Net Income Available to Common Equity 5.9 1.4 5.9 4.6 6.4 7.8 9.9 10.7 11.2
11.7
Adjustments to Reconcile Net Income to Net Cash Flow
Depreciation 1.3 5.4 5.1 2.4 2.9 3.4 3.5 3.7 3.8
4.0
Amortization of Financing Fees 0.0 0.0 0.0 0.5 0.5 0.5 0.5 0.0 0.0
20.3
Cash Flow from Investing Activities:
(Increase) Decrease in Investments Available for Sale. 0.0 0.0 0.0 (8.9) (7.4) (7.9)
(8.5)
(Increase) Decrease in Gross Property, Plant & Equipment (3.5) (4.1) (4.8) (5.0) (5.2)
(5.5) (5.7)
Net Cash Used in Investments 0.0 0.0 0.0 (3.5) (4.1) (4.8) (13.9) (12.7) (13.3)
(14.2)
Cash Flows from Financing Activities:
Net Debt (Repayment) or Issuance 0.0 0.0 0.0 (7.5) (8.0) (7.8) (4.5) (5.0) (5.5)
54
Net Income to Available to Common Equity 5.9 1.4 5.9 4.6 6.4 7.8 9.9 10.7 11.2
11.7
After-Tax Net Interest Expense (Income) 0 0 0 1.7 1.4 1.2 1.0 0.8 0.6
0.4
Depreciation 1.3 5.4 5.1 2.4 2.9 3.4 3.5 3.7 3.8
(0.7)
Net Cash Flow Before Gross Property, Plant & Equip. Spending 7.2 7.9 7.4 13.0 13.7 15.6 18.0 18.7
19.6 20.7
(Increase) Decrease in Invest Available for Sale 0.0 0.0 0.0 (8.9) (7.4) (7.9)
(8.5)
(Increase) Decrease in Gross Property, Plant & Equipment (3.0) (7.7) (7.3) (3.5) (4.1) (4.8) (5.0) (5.2) (5.5)
(5.7)
Enterprise Cash Flow 4.2 0.2 0.1 9.5 9.6 10.8 4.1 6.0 6.3
6.5
After-Tax Net Interest Expense (Income) 0.0 0.0 0.0 1.7 1.4 1.2 1.0 0.8 0.6
0.4
Net Debt (Repayments) or Issuance 0.0 0.0 0.0 (7.5) (8.0) (7.8) (4.5) (5.0) (5.5)
(6.0)
Equity Cash Flow 4.2 0.2 0.1 0.3 0.2 1.8 (1.5) 0.2 0.2

Adjusted Equity Cash Flow 4.2 0.2 0.1 0.3 0.2 1.8 7.4 7.7 8.1
8.5