b.
A+B+C.
c.
D+H+F.
d.
A+B+C+D+H+F.
64. Refer to Figure 7-23. If the price were P3, consumer surplus would be represented by the area
a.
A.
b.
A+B+C.
c.
D+H+F.
d.
A+B+C+D+H+F.
65. Refer to Figure 7-23. At equilibrium, producer surplus is represented by the area
a.
F.
b.
F+G.
c.
D+H+F.
d.
D+H+F+G+I.
66. Refer to Figure 7-23. If the price were P1, producer surplus would be represented by the area
a.
F.
b.
F+G.
c.
D+H+F.
d.
D+H+F+G+I.
67. Refer to Figure 7-23. At equilibrium, total surplus is represented by the area
a.
A+B+C.
b.
A+B+D+F.
c.
A+B+C+D+H+F.
d.
A+B+C+D+H+F+G+I.
68. Refer to Figure 7-23. The efficient price-quantity combination is
a.
P1 and Q1.
b.
P2 and Q2.
c.
P3 and Q1.
d.
P4 and 0.
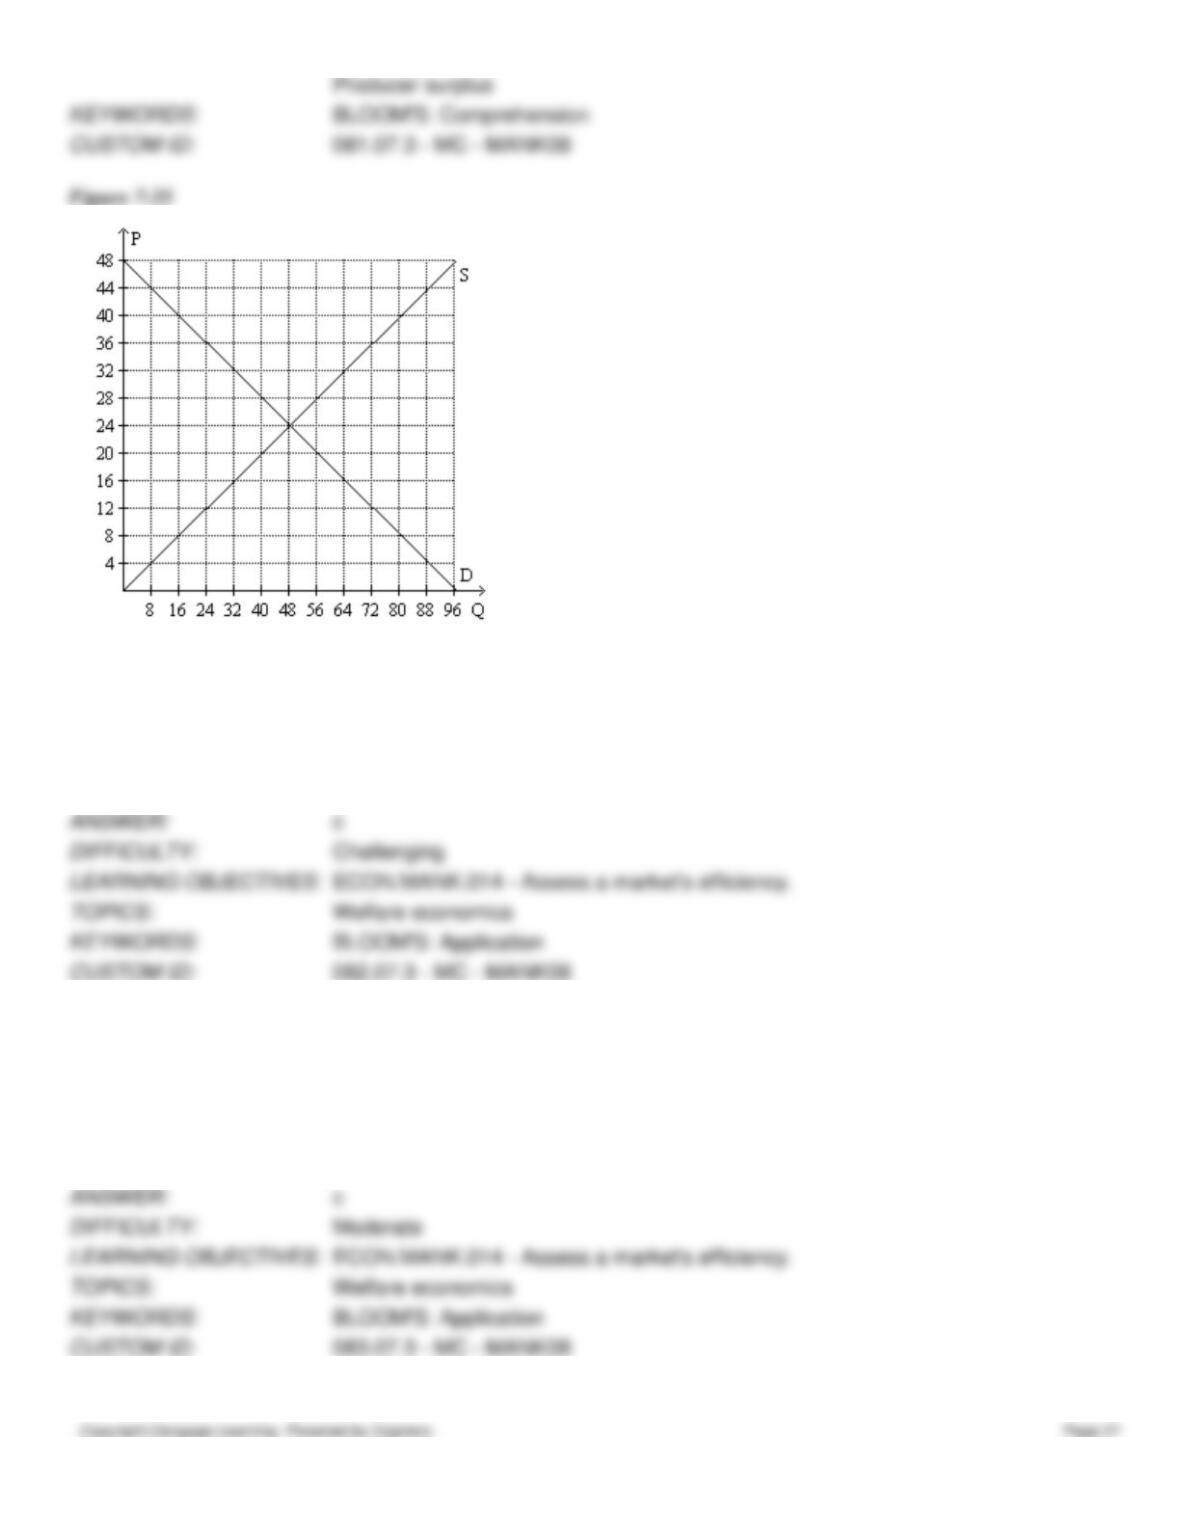
Figure 7-24
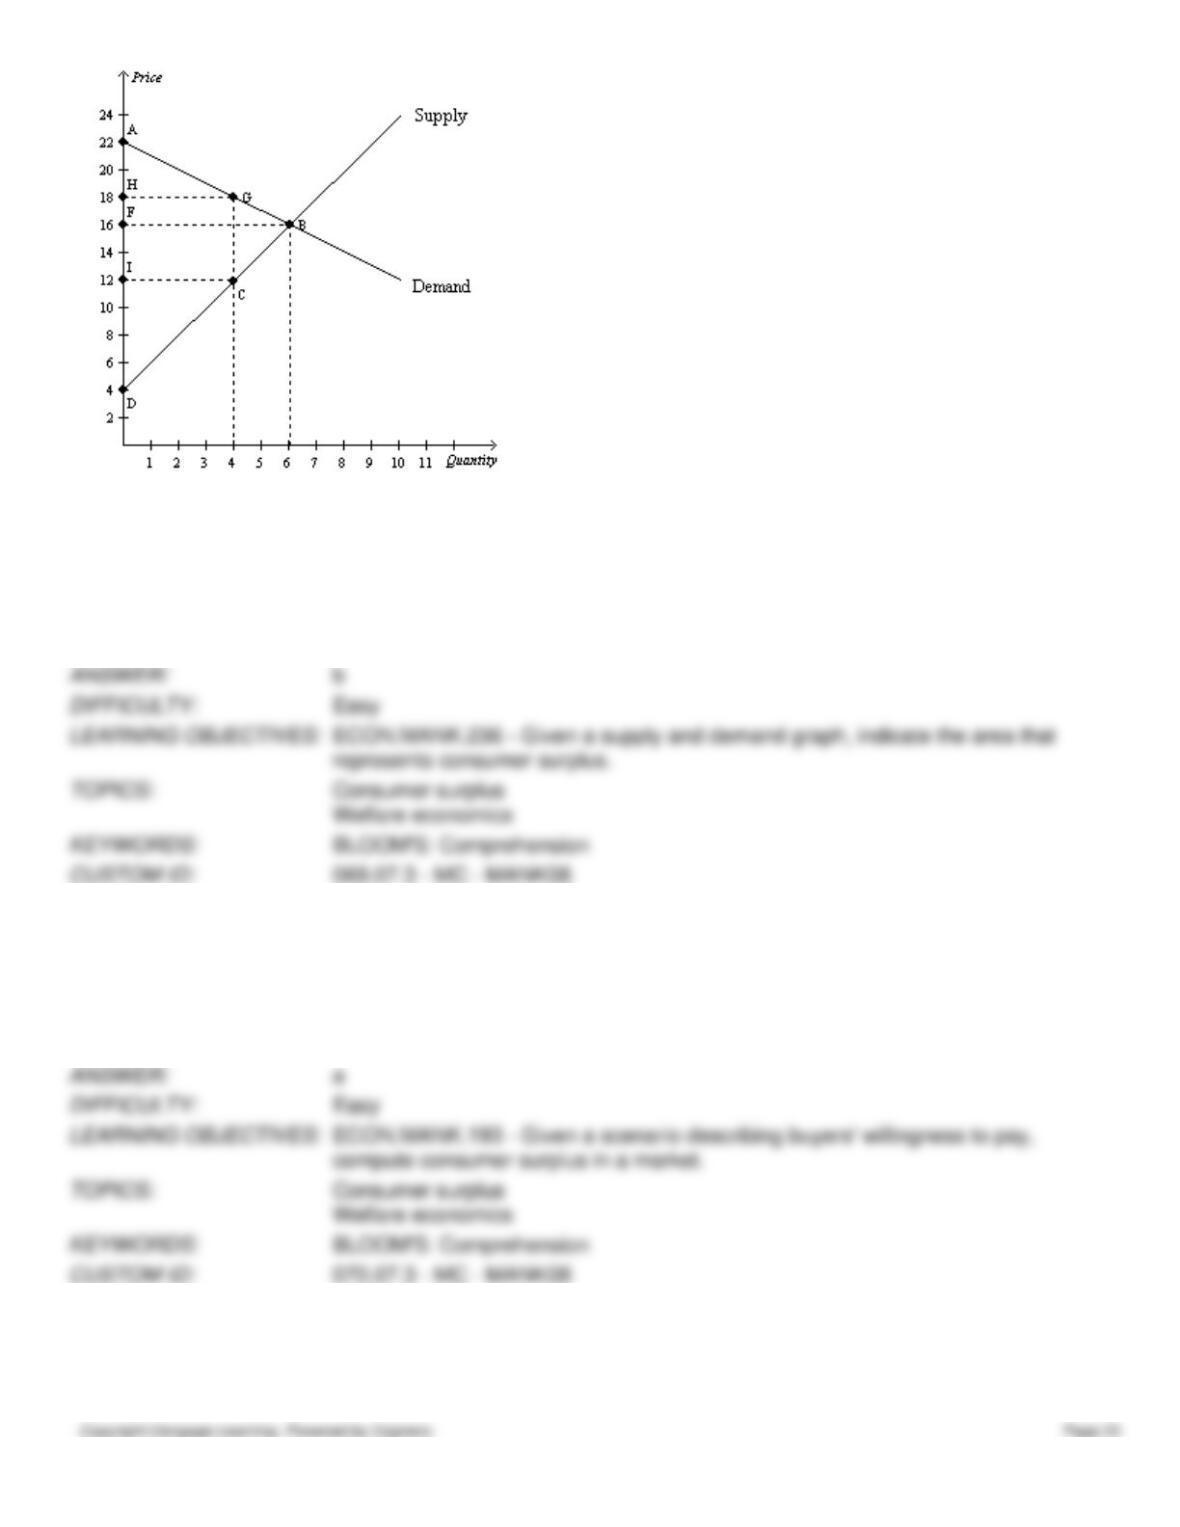
69. Refer to Figure 7-24. At equilibrium, consumer surplus is measured by the area
a.
AHG.
b.
AFB.
c.
ABD.
d.
BDF.
70. Refer to Figure 7-24. At equilibrium, consumer surplus is
a.
$18.
b.
$36.
c.
$54.
d.
$72.
71. Refer to Figure 7-24. At equilibrium, producer surplus is measured by the area
a.
ABD.
b.
ABF.
c.
CDI.
d.
BDF.
72. Refer to Figure 7-24. At equilibrium, producer surplus is
a.
$36.
b.
$72.
c.
$54.
d.
$18.
73. Refer to Figure 7-24. At equilibrium, total surplus is measured by the area
a.
ABD.
b.
ABF.
c.
FBD.
d.
HGCI.
74. Refer to Figure 7-24. At equilibrium, total surplus is
a.
$36.
b.
$54.
c.
$18.
d.
$108.
75. Refer to Figure 7-24. The equilibrium allocation of resources is
a.
efficient because total surplus is maximized at the equilibrium.
b.
efficient because consumer surplus is maximized at the equilibrium.
c.
inefficient because consumer surplus is larger than producer surplus at the equilibrium.
d.
inefficient because producer surplus is not maximized.
76. Refer to Figure 7-24. If 4 units of the good are produced and sold, then
a.
producer surplus is greater than consumer surplus.
b.
consumer surplus is $16.
c.
total surplus is minimized.
d.
total surplus is not maximized.
77. Refer to Figure 7-24. If 10 units of the good are produced and sold, then
a.
the marginal cost to sellers exceeds the marginal value to buyers.
b.
producer surplus is maximized.
c.
total surplus is minimized.
d.
the marginal value to buyers exceeds the marginal cost to sellers.
78. Refer to Figure 7-24. If 6 units of the good are produced and sold, then
a.
consumer surplus is greater than producer surplus.
b.
producer surplus is maximized.
c.
the sum of consumer surplus and producer surplus is maximized.
d.
consumer surplus equals producer surplus.
79. Refer to Figure 7-24. If 6 units of the good are produced and sold, then
a.
efficiency is achieved in this market.
b.
the marginal value to buyers equals the marginal cost to sellers.
c.
the sum of consumer surplus and producer surplus is maximized.
d.
All of the above are correct.
80. Refer to Figure 7-24. If the government imposes a price floor at $18, then consumer surplus is
a.
ABF.
b.
AGH.
c.
HGCD.
d.
HGBF.
81. Refer to Figure 7-24. If the government imposes a price ceiling at $12, then producer surplus is
a.
CDI.
b.
BDF.
c.
BCIF.
d.
HGCD.
82. Refer to Figure 7-25. At the equilibrium price, total surplus is
a.
$288.
b.
$576.
c.
$1,152.
d.
$2,304.
83. Refer to Figure 7-25. Suppose the government imposes a price ceiling of $16 in this market. If the buyers with the
highest willingness to pay purchase the good, then total surplus will be
a.
$256.
b.
$768.
c.
$1,024.
d.
$1,280.
84. Refer to Figure 7-25. Suppose the government imposes a price floor of $28 in this market. If the sellers with the
lowest cost are the ones who sell the good and the government does not purchase any excess units produced, then total
surplus will be
a.
$400.
b.
$800.
c.
$1,120.
d.
$1,184.
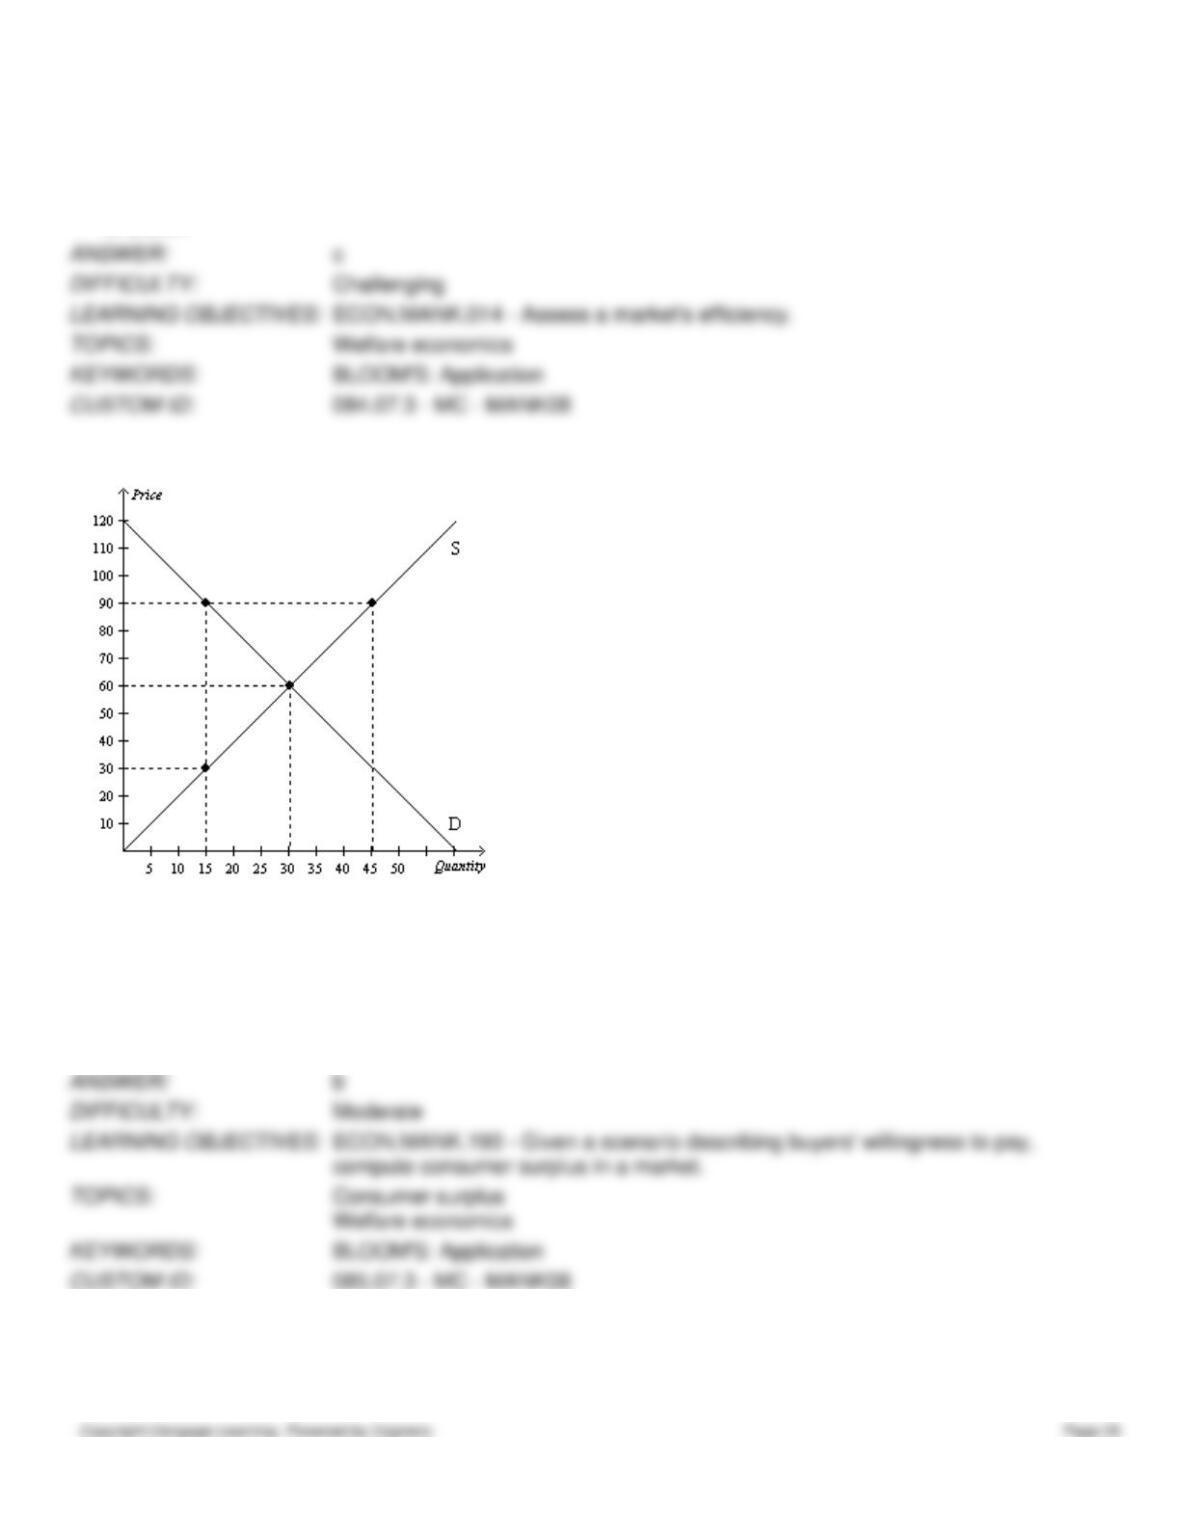
Figure 7-26
85. Refer to Figure 7-26. At the equilibrium price, consumer surplus is
a.
$600.
b.
$900.
c.
$1,500.
d.
$1,800.
86. Refer to Figure 7-26. At the equilibrium price, producer surplus is
a.
$600.
b.
$900.
c.
$1,200.
d.
$1,800.
87. Refer to Figure 7-26. At the equilibrium price, total surplus is
a.
$600.
b.
$1,200.
c.
$1,500.
d.
$1,800.
88. Refer to Figure 7-26. If the government imposes a price floor of $90 in this market, then consumer surplus will be
a.
$225.
b.
$450.
c.
$975.
d.
$1,350
89. Refer to Figure 7-27. Buyers who value this good more than the equilibrium price are represented by which line
segment?
a.
AC.
b.
CK.
c.
BC.
d.
CH.
90. Refer to Figure 7-27. Buyers who value this good less than the equilibrium price are represented by which line
segment?
a.
AC.
b.
CK.
c.
BC.
d.
CH.
91. Refer to Figure 7-27. Sellers whose costs are less than the equilibrium price are represented by which line segment?
a.
AC.
b.
CK.
c.
BC.
d.
CH.
92. Refer to Figure 7-27. Sellers whose costs are greater than the equilibrium price are represented by segment
a.
AC.
b.
CK.
c.
BC.
d.
CH.
93. Refer to Figure 7-27. If the government mandated a price increase from P1 to a higher price, then
a.
total surplus would decrease.
b.
consumer surplus would increase.
c.
total surplus would increase, since producer surplus would increase.
d.
total surplus would remain unchanged.
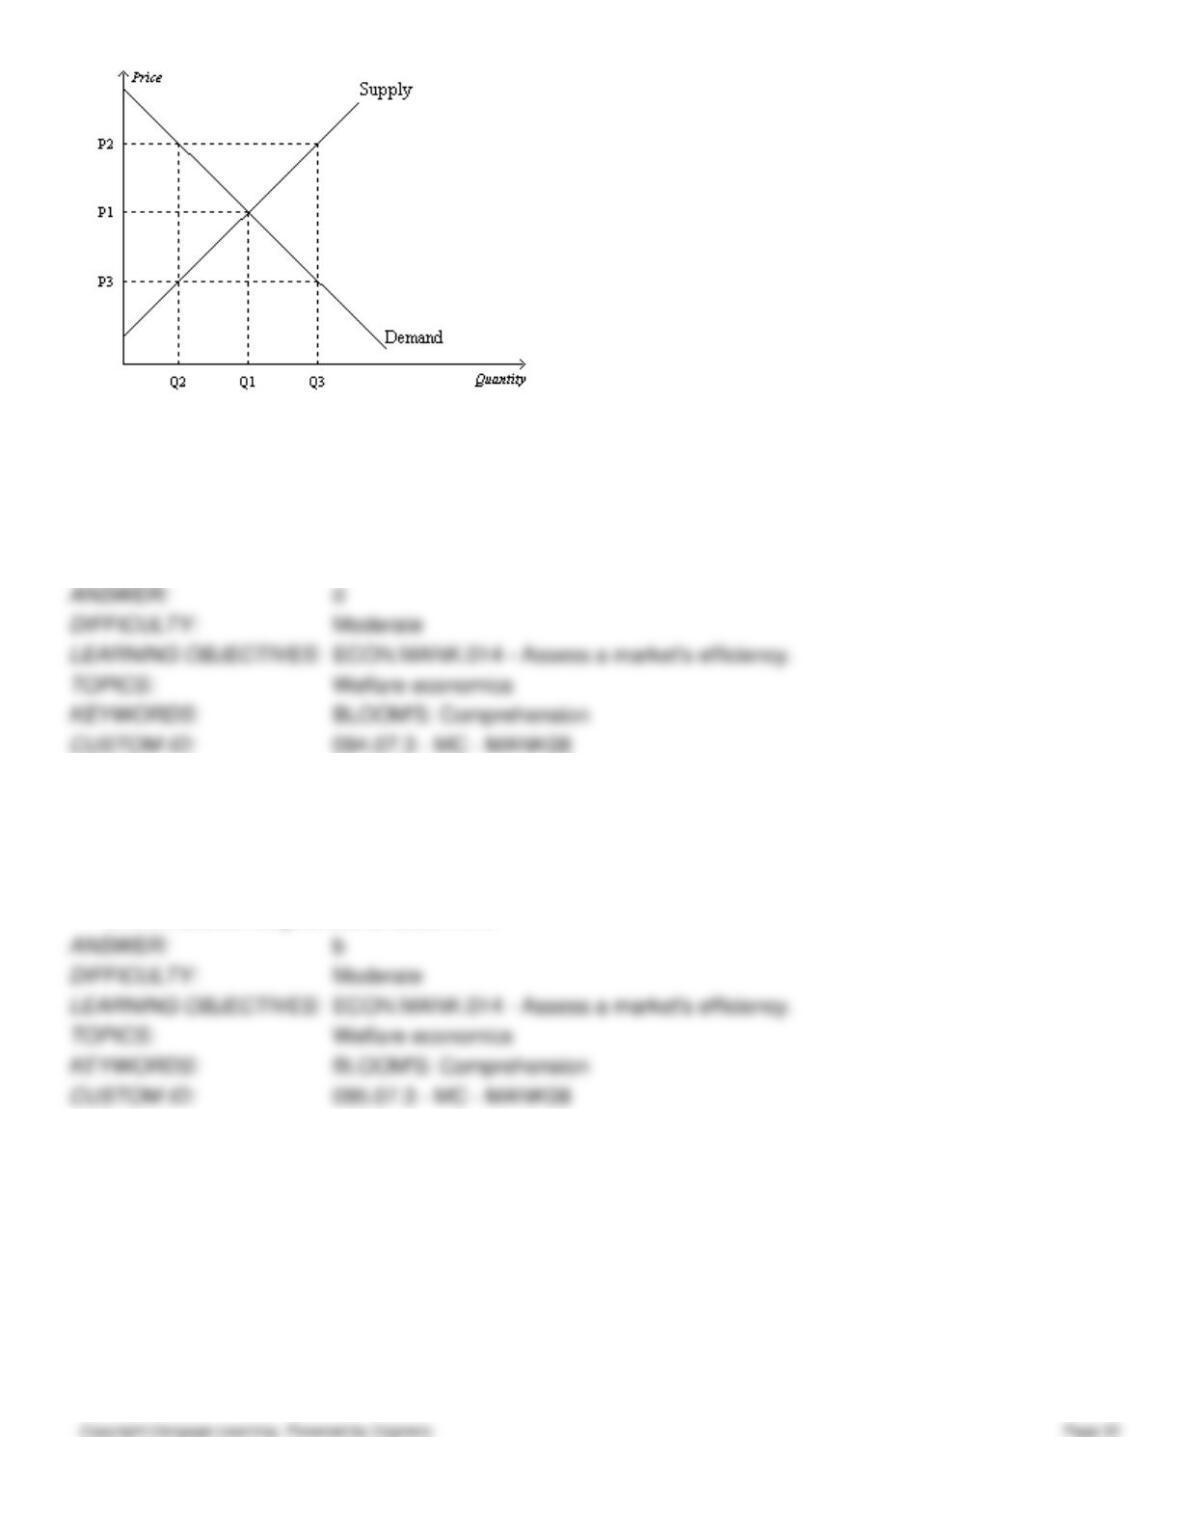
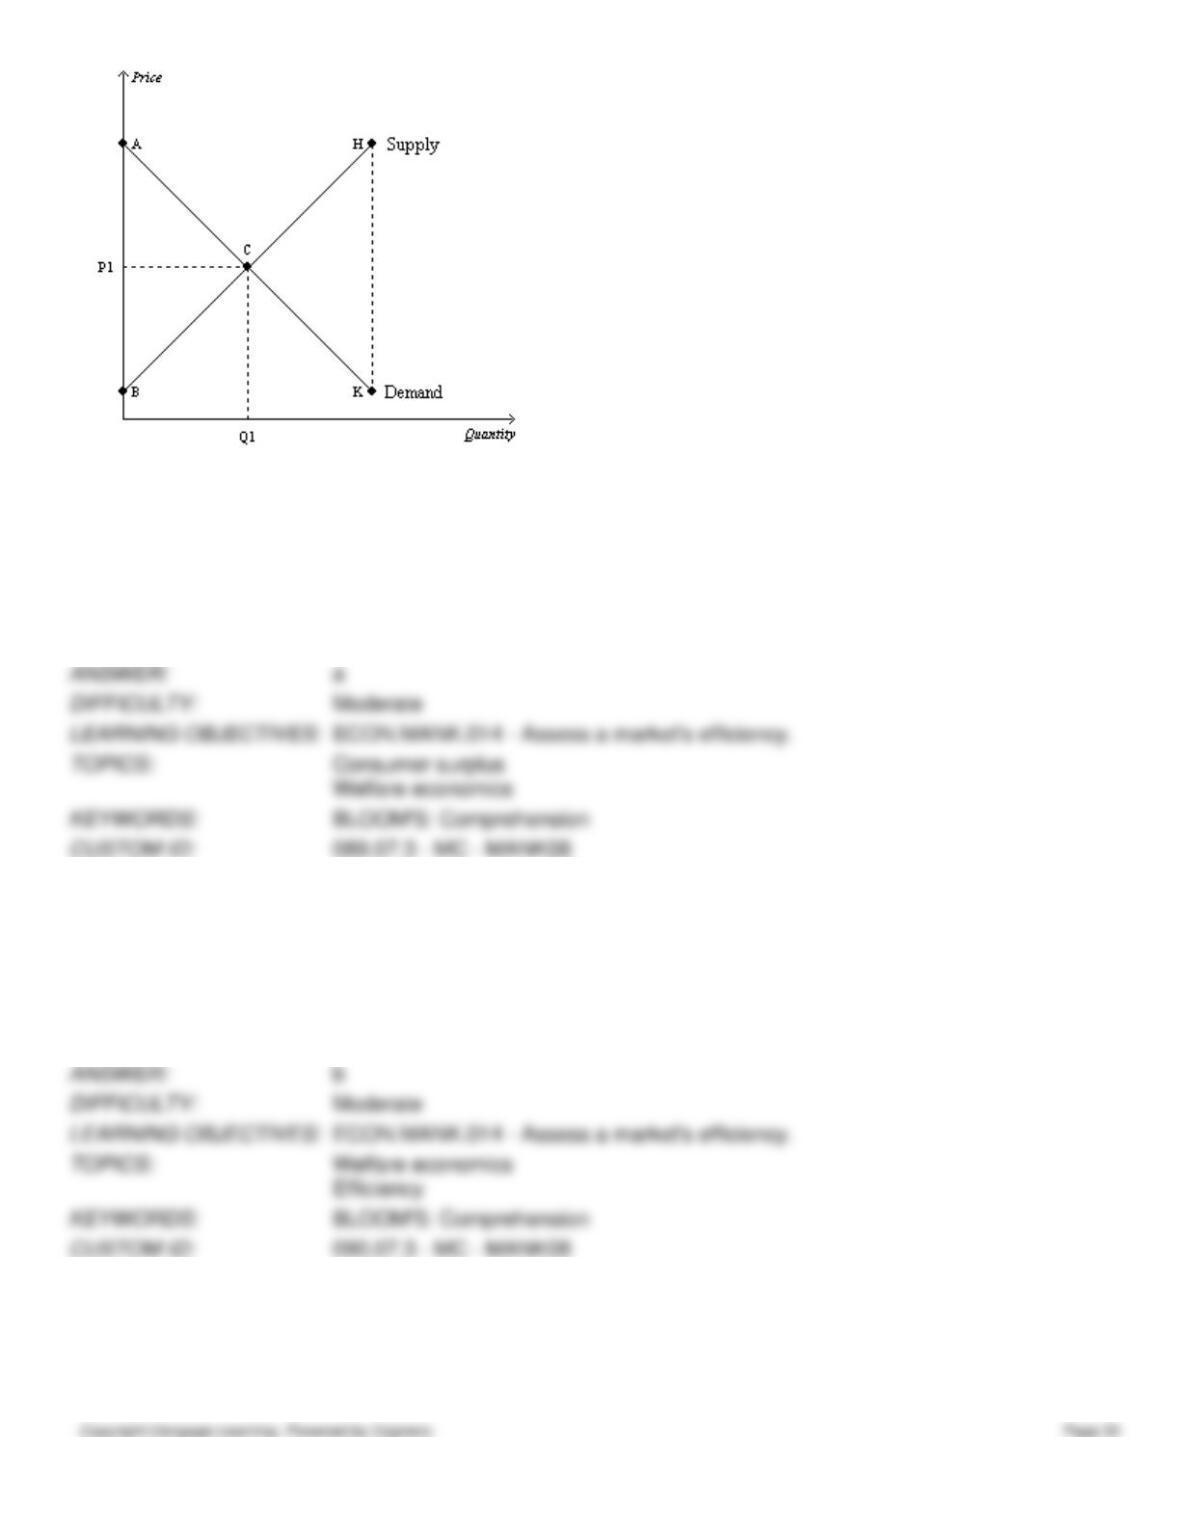
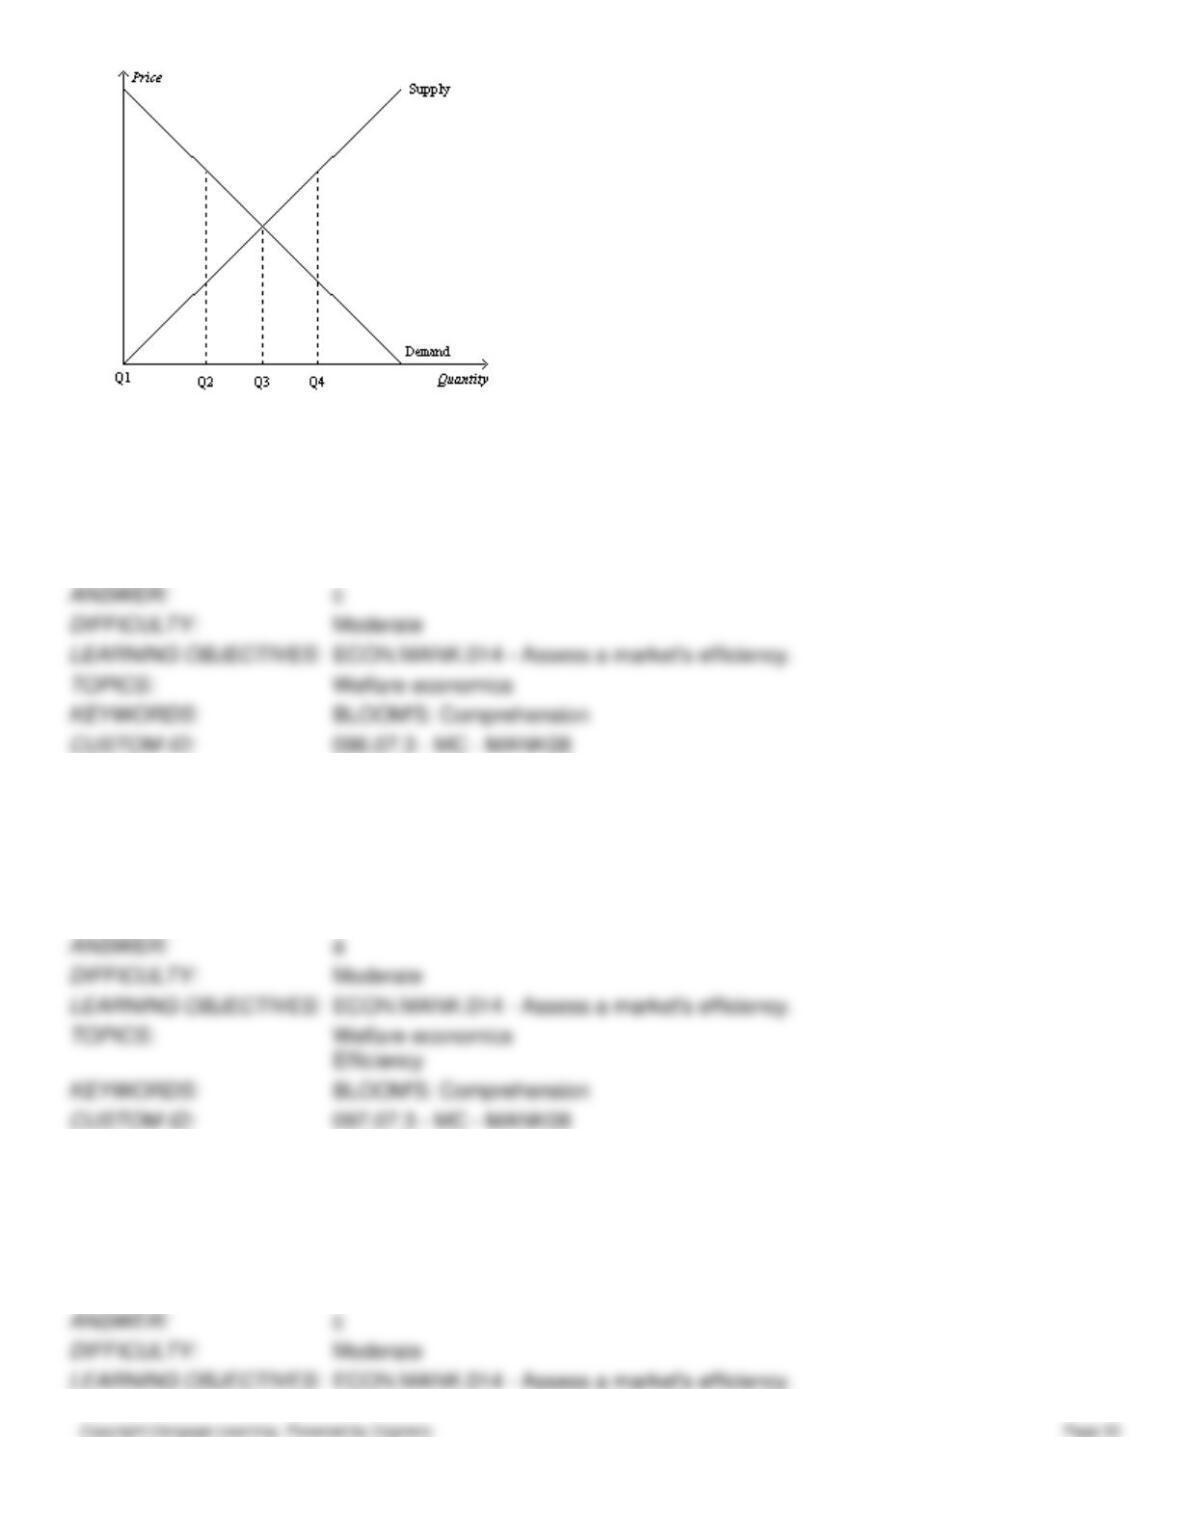
94. Refer to Figure 7-28. At the quantity Q3,
a.
the market is in equilibrium.
b.
consumer surplus is maximized.
c.
the sum of consumer surplus and producer surplus is maximized.
d.
the marginal value to buyers is less than the marginal cost to sellers.
95. Refer to Figure 7-28. At the quantity Q2, the marginal value to buyers
a.
and the marginal cost to sellers are both P2.
b.
is P2, and the marginal cost to sellers is P3.
c.
and the marginal cost to sellers are both P3.
d.
is P3, and the marginal cost to sellers is P2.
Figure 7-29
96. Refer to Figure 7-29. Which of the following statements is correct?
a.
The market is in equilibrium at Q1.
b.
At Q2, the cost to sellers exceeds the value to buyers.
c.
At Q4, the value to buyers is less than the cost to sellers.
d.
At Q3, the market is producing too much output.
97. Inefficiency exists in an economy when a good is
a.
not being consumed by buyers who value it most highly.
b.
not distributed fairly among buyers.
c.
not produced because buyers do not value it very highly.
d.
being produced with less than all available resources.
98. Inefficiency exists in an economy when a good is
a.
being produced with less than all available resources.
b.
not distributed fairly among buyers.
c.
not being produced by the lowest-cost producers.
d.
being consumed by buyers who value it most highly.