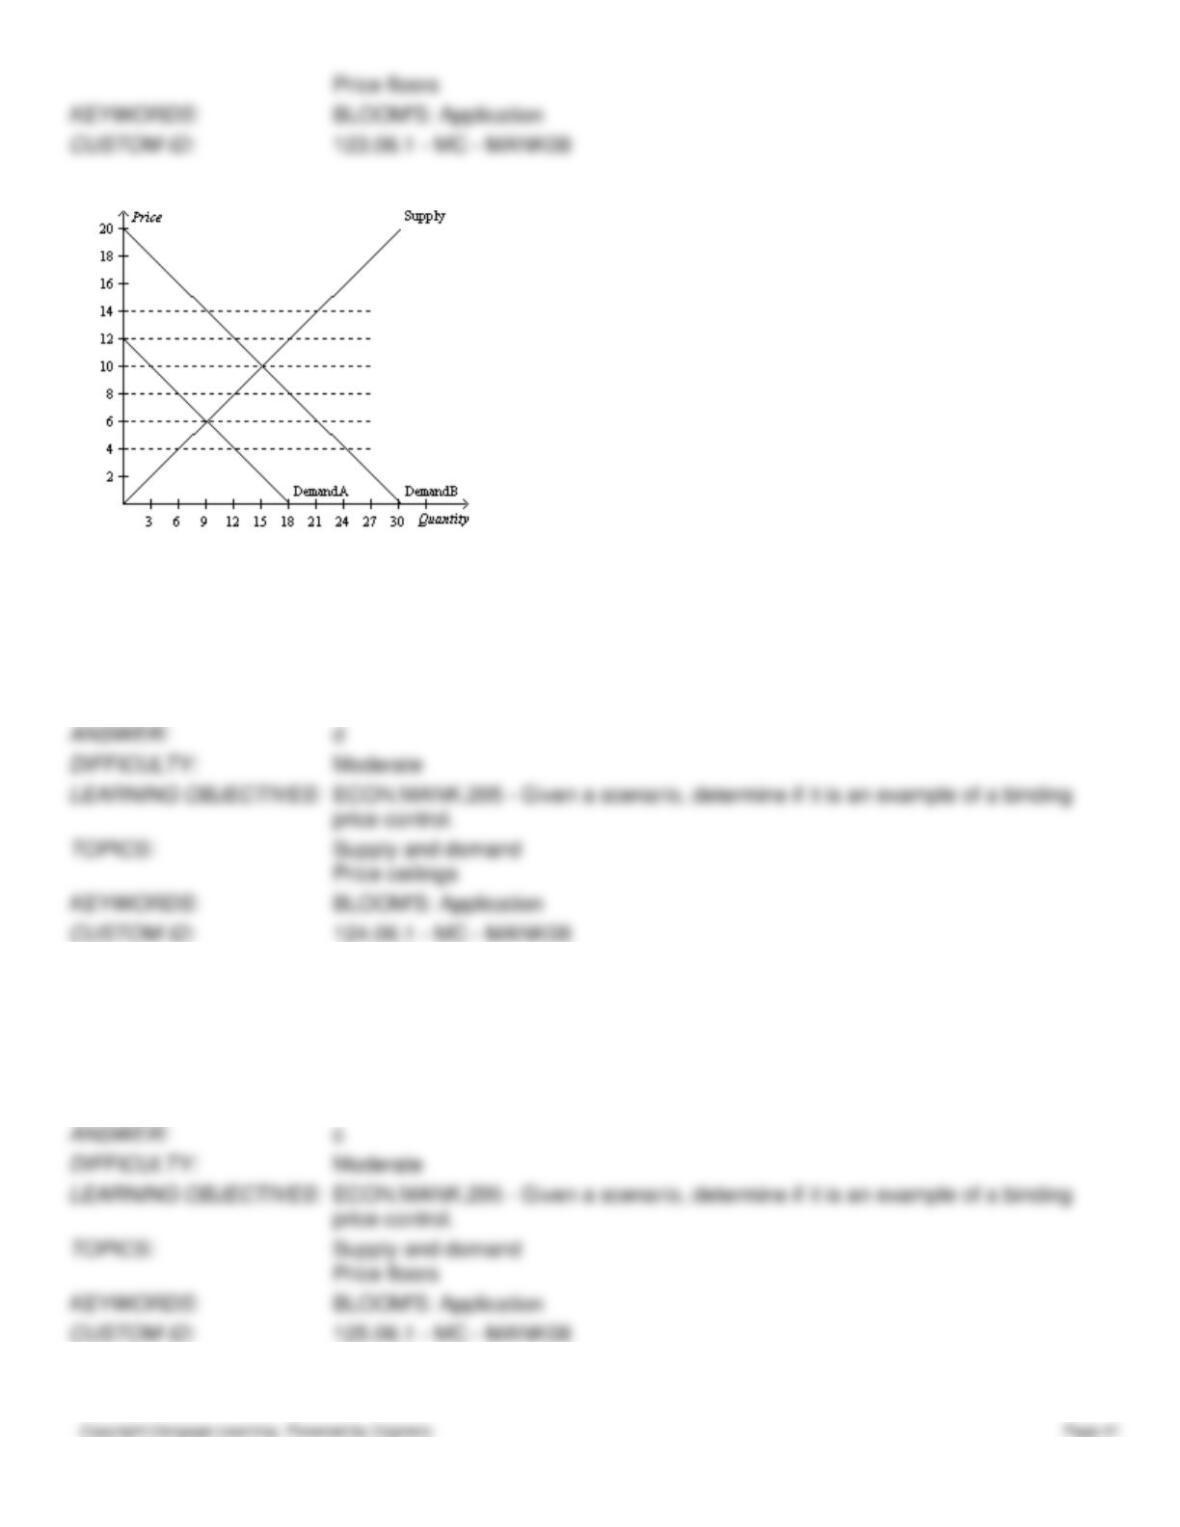
Figure 6-11
124. Refer to Figure 6-11. If the government imposes a price ceiling at $6, it would be
a.
binding if market demand is Demand A or Demand B.
b.
non-binding if market demand is Demand A or Demand B.
c.
binding if market demand is Demand A and non-binding if market demand is Demand B.
d.
non-binding if market demand is Demand A and binding if market demand is Demand B.
125. Refer to Figure 6-11. If the government imposes a price floor at $10, it would be
a.
binding if market demand is Demand A or Demand B.
b.
non-binding if market demand is Demand A or Demand B.
c.
binding if market demand is Demand A and non-binding if market demand is Demand B.
d.
non-binding if market demand is Demand A and binding if market demand is Demand B.
126. Refer to Figure 6-11. Which of the following statements is not correct?
a.
A government-imposed price of $8 would be a binding price floor if market demand is Demand A and a
binding price ceiling if market demand is Demand B.
b.
A government-imposed price of $10 would be a binding price ceiling if market demand is either Demand A or
Demand B.
c.
A government-imposed price of $4 would be a binding price ceiling if market demand is either Demand A or
Demand B.
d.
A government-imposed price of $10 would be a binding price floor if market demand is Demand A and a non-
binding price ceiling if market demand is Demand B.
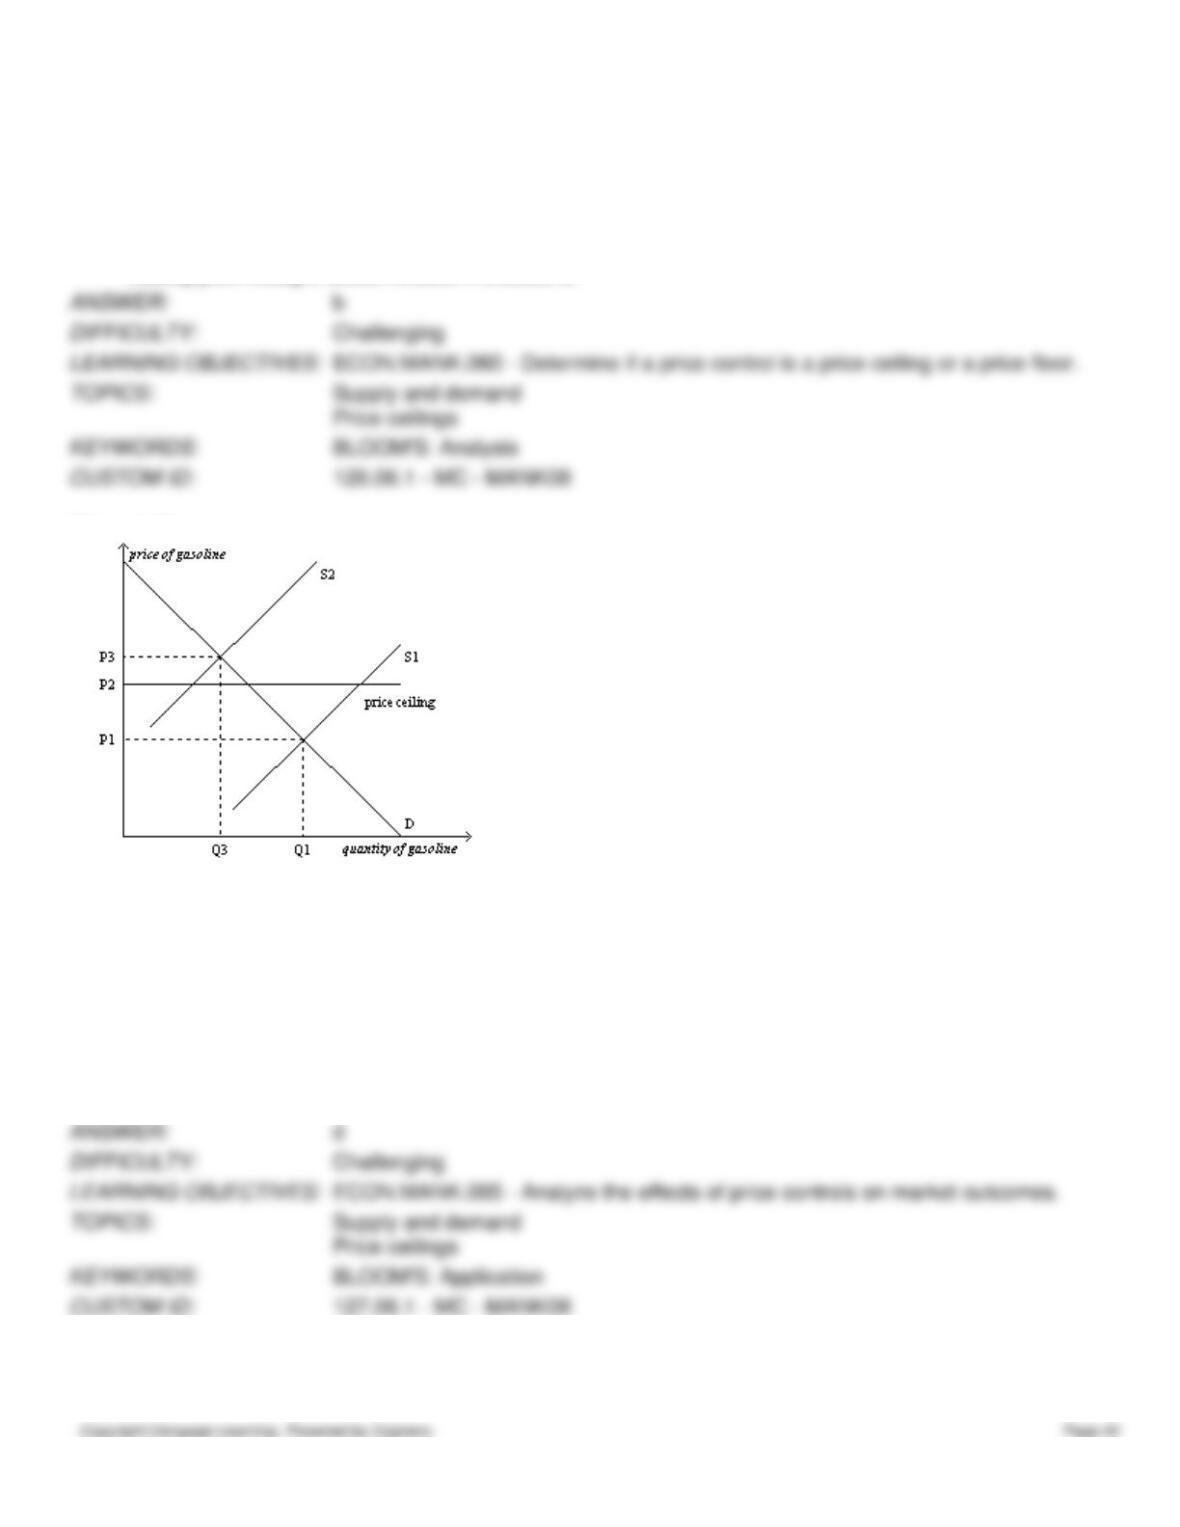
Figure 6-12
127. Refer to Figure 6-12. When the price ceiling applies in this market and the supply curve for gasoline shifts from S1
to S2,
a.
the market price will increase to P3.
b.
a surplus will occur at the new market price of P2.
c.
the market price will stay at P1.
d.
a shortage will occur at the new market price of P2.
128. Refer to Figure 6-12. When the price ceiling applies in this market, and the supply curve for gasoline shifts from S1
to S2, the resulting quantity of gasoline that is bought and sold is
a.
less than Q3.
b.
Q3.
c.
between Q1 and Q3.
d.
at least Q1.
129. Refer to Figure 6-12. Which of the following statements best relates the figure to the events that occurred in the
United States in the 1970s?
a.
Buyers of gasoline paid a price of P1 before 1973; they paid a price of P2 after OPEC increased the price of
crude oil in 1973, and there was a shortage of gasoline at that price.
b.
Buyers of gasoline paid a price of P1 before 1973; they paid a price of P3 after OPEC increased the price of
crude oil in 1973, and there was a shortage of gasoline at that price.
c.
Buyers of gasoline paid a price of P2 before 1973; they paid a price of P3 after OPEC increased the price of
crude oil in 1973, with no shortage of gasoline at that price.
d.
The price ceiling was binding before 1973; the price ceiling was no longer binding after OPEC increased the
price of crude oil in 1973.
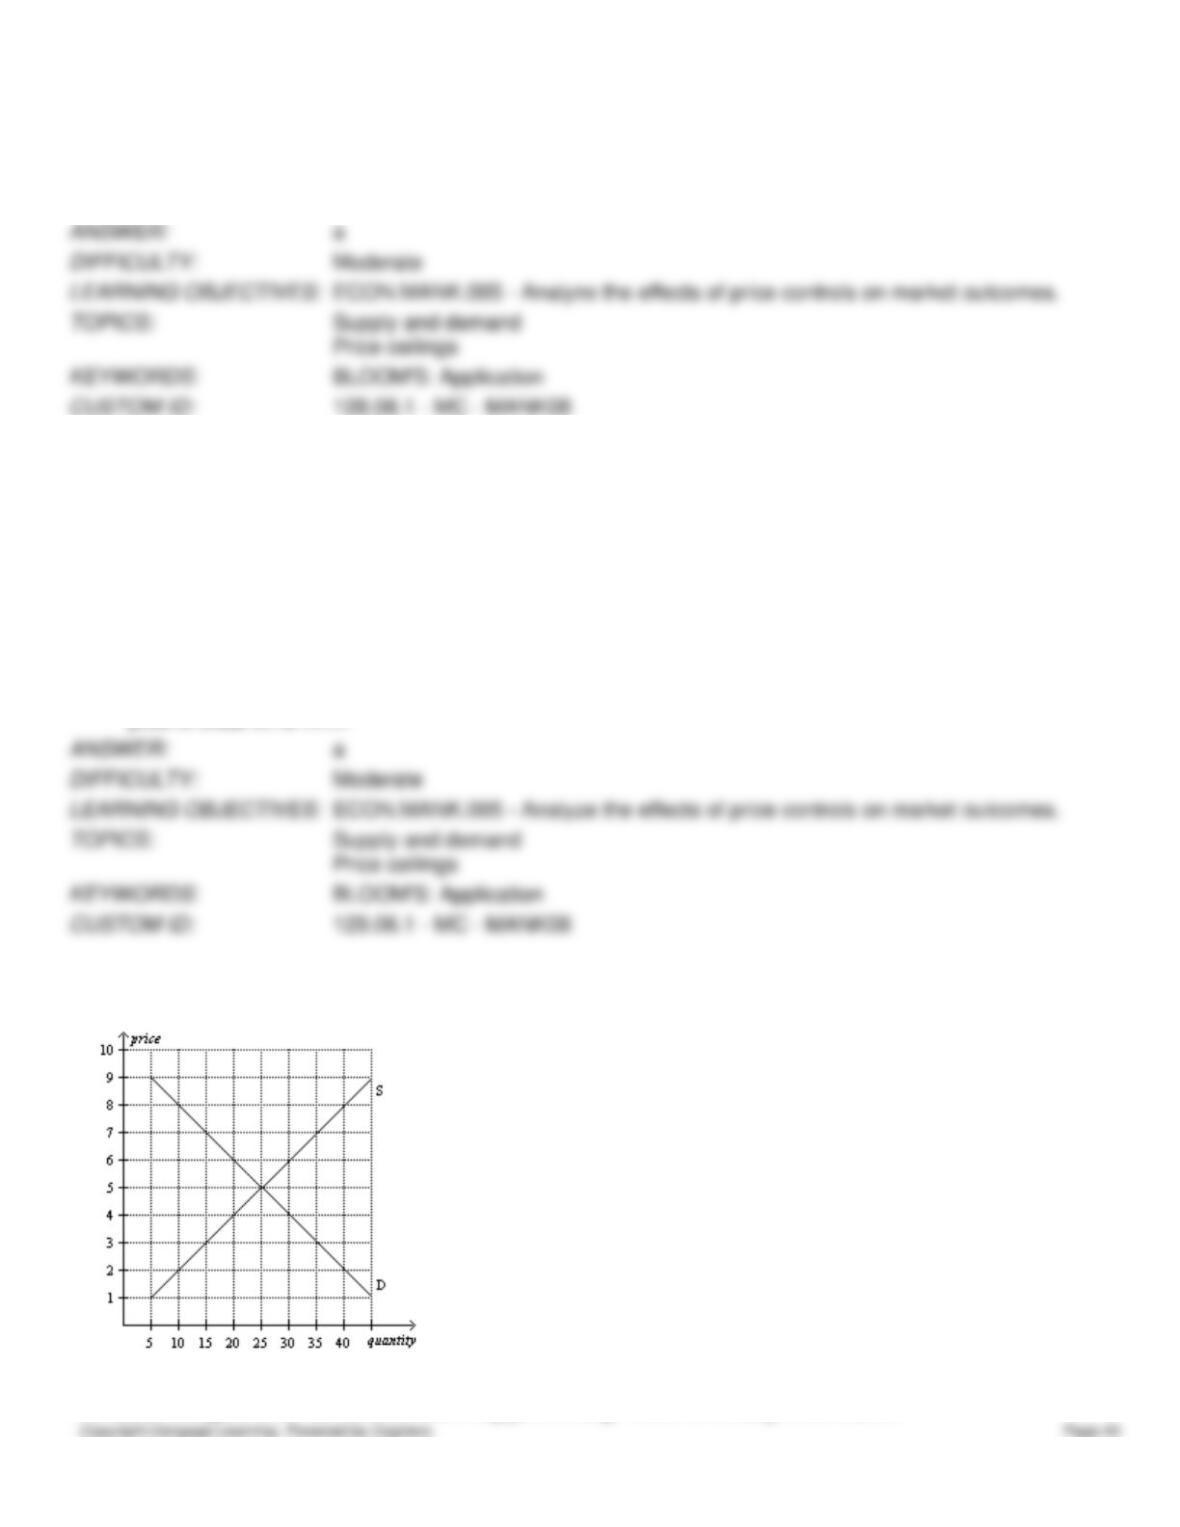
Figure 6-13
This figure shows the market demand and market supply curves for good X.
130. Refer to Figure 6-13. Which of the following price ceilings would be binding in this market?
a.
$4
b.
$5
c.
$6
d.
$7
131. Refer to Figure 6-13. Which of the following price floors would be binding in this market?
a.
$3
b.
$4
c.
$5
d.
$6
132. Refer to Figure 6-13. Which of the following statements is correct?
a.
A price ceiling set at $6 would be binding, but a price ceiling set at $4 would not be binding.
b.
A price floor set at $4 would be binding, but a price ceiling set at $4 would not be binding.
c.
A price ceiling set at $3.50 would result in a surplus.
d.
A price floor set at $6.50 would result in a surplus.
133. Refer to Figure 6-13. Which of the following statements is not correct?
a.
A price ceiling set at $4 would be binding, but a price ceiling set at $6 would not be binding.
b.
A price floor set at $7 would be binding, but a price floor set at $4 would not be binding.
c.
A price ceiling set at $3.50 would result in a surplus.
d.
A price floor set at $6.50 would result in a surplus.
134. Refer to Figure 6-13. If the government imposes a price ceiling of $4 on this market, then there will be
a.
no shortage.
b.
a shortage of 5 units.
c.
a shortage of 10 units.
d.
a shortage of 20 units.
135. Refer to Figure 6-13. If the government imposes a price ceiling of $6 on this market, then there will be
a.
no shortage.
b.
a shortage of 5 units.
c.
a shortage of 10 units.
d.
a shortage of 20 units.
136. Refer to Figure 6-13. If the government imposes a price floor of $3 on this market, then there will be
a.
no surplus.
b.
a surplus of 10 units.
c.
a surplus of 15 units.
d.
a surplus of 20 units.
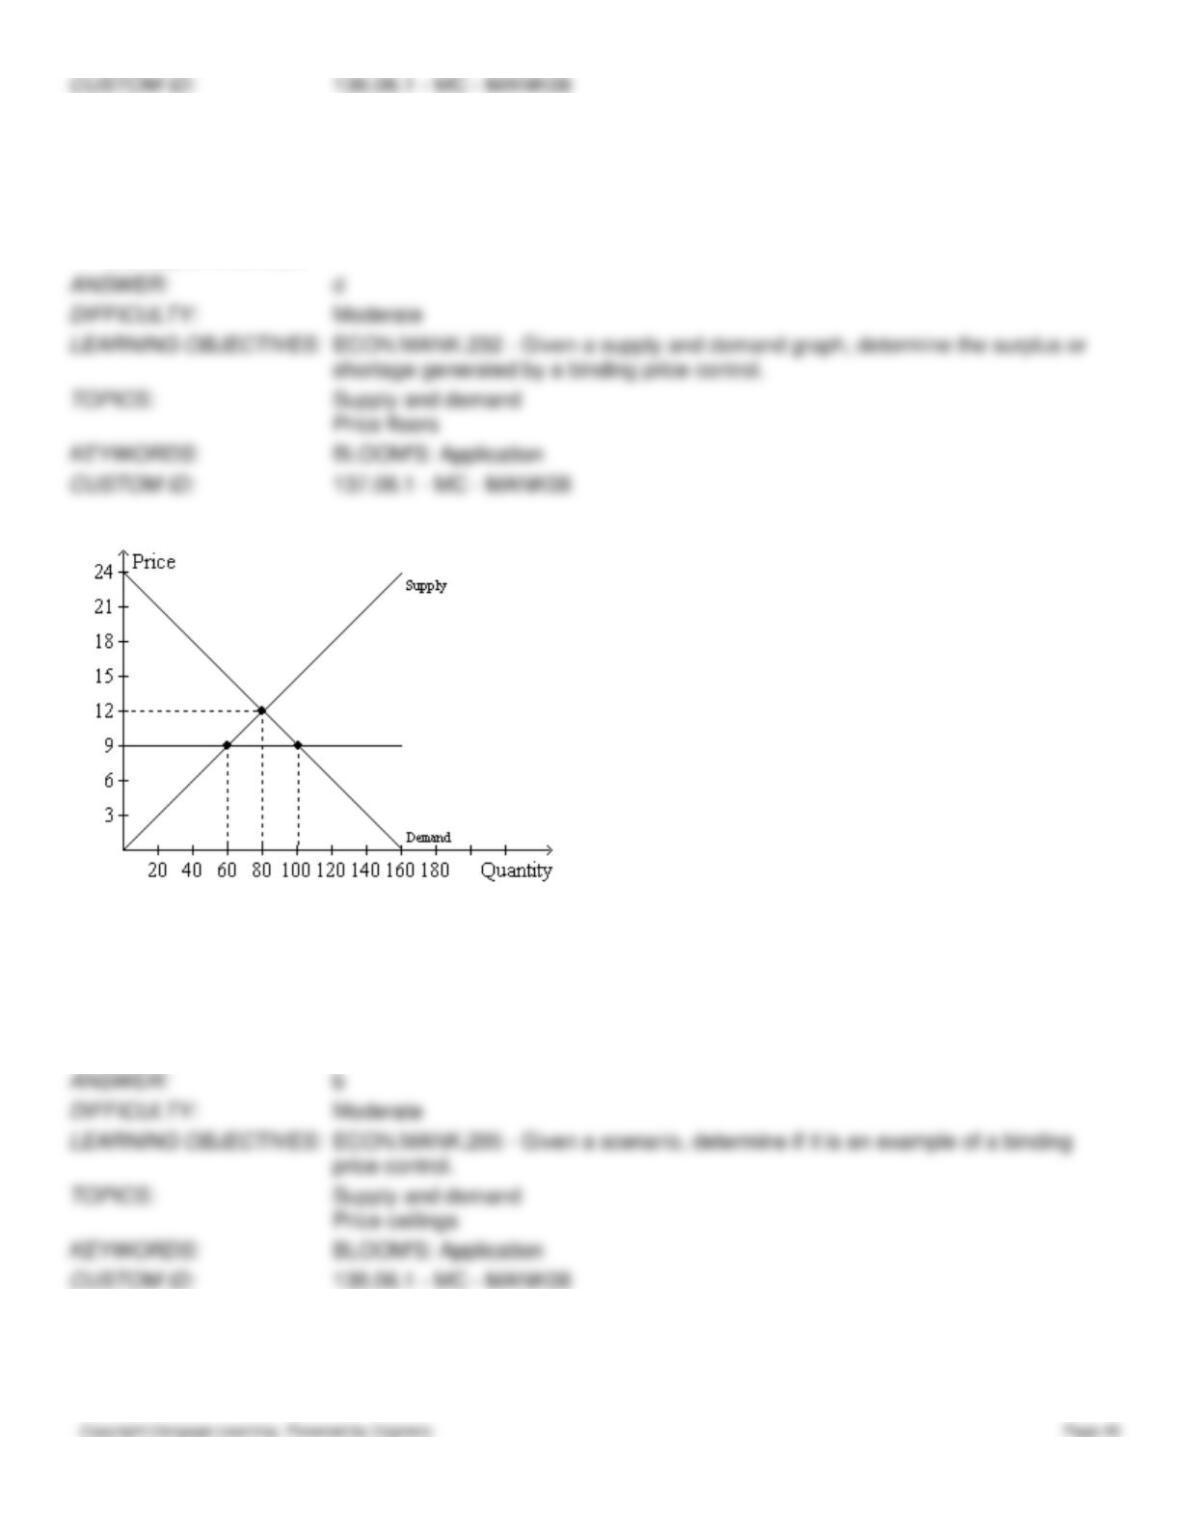
137. Refer to Figure 6-13. If the government imposes a price floor of $7 on this market, then there will be
a.
no surplus.
b.
a surplus of 10 units.
c.
a surplus of 15 units.
d.
a surplus of 20 units.
Figure 6-14
138. Refer to Figure 6-14. If the horizontal line on the graph represents a price ceiling, then the price ceiling is
a.
binding and creates a shortage of 20 units of the good.
b.
binding and creates a shortage of 40 units of the good.
c.
not binding but creates a shortage of 40 units of the good.
d.
not binding, and there will be no surplus or shortage of the good.
139. Refer to Figure 6-14. If the horizontal line on the graph represents a price floor, then the price floor is
a.
binding and creates a shortage of 20 units of the good.
b.
binding and creates a shortage of 40 units of the good.
c.
not binding but creates a shortage of 40 units of the good.
d.
not binding, and there will be no surplus or shortage of the good.
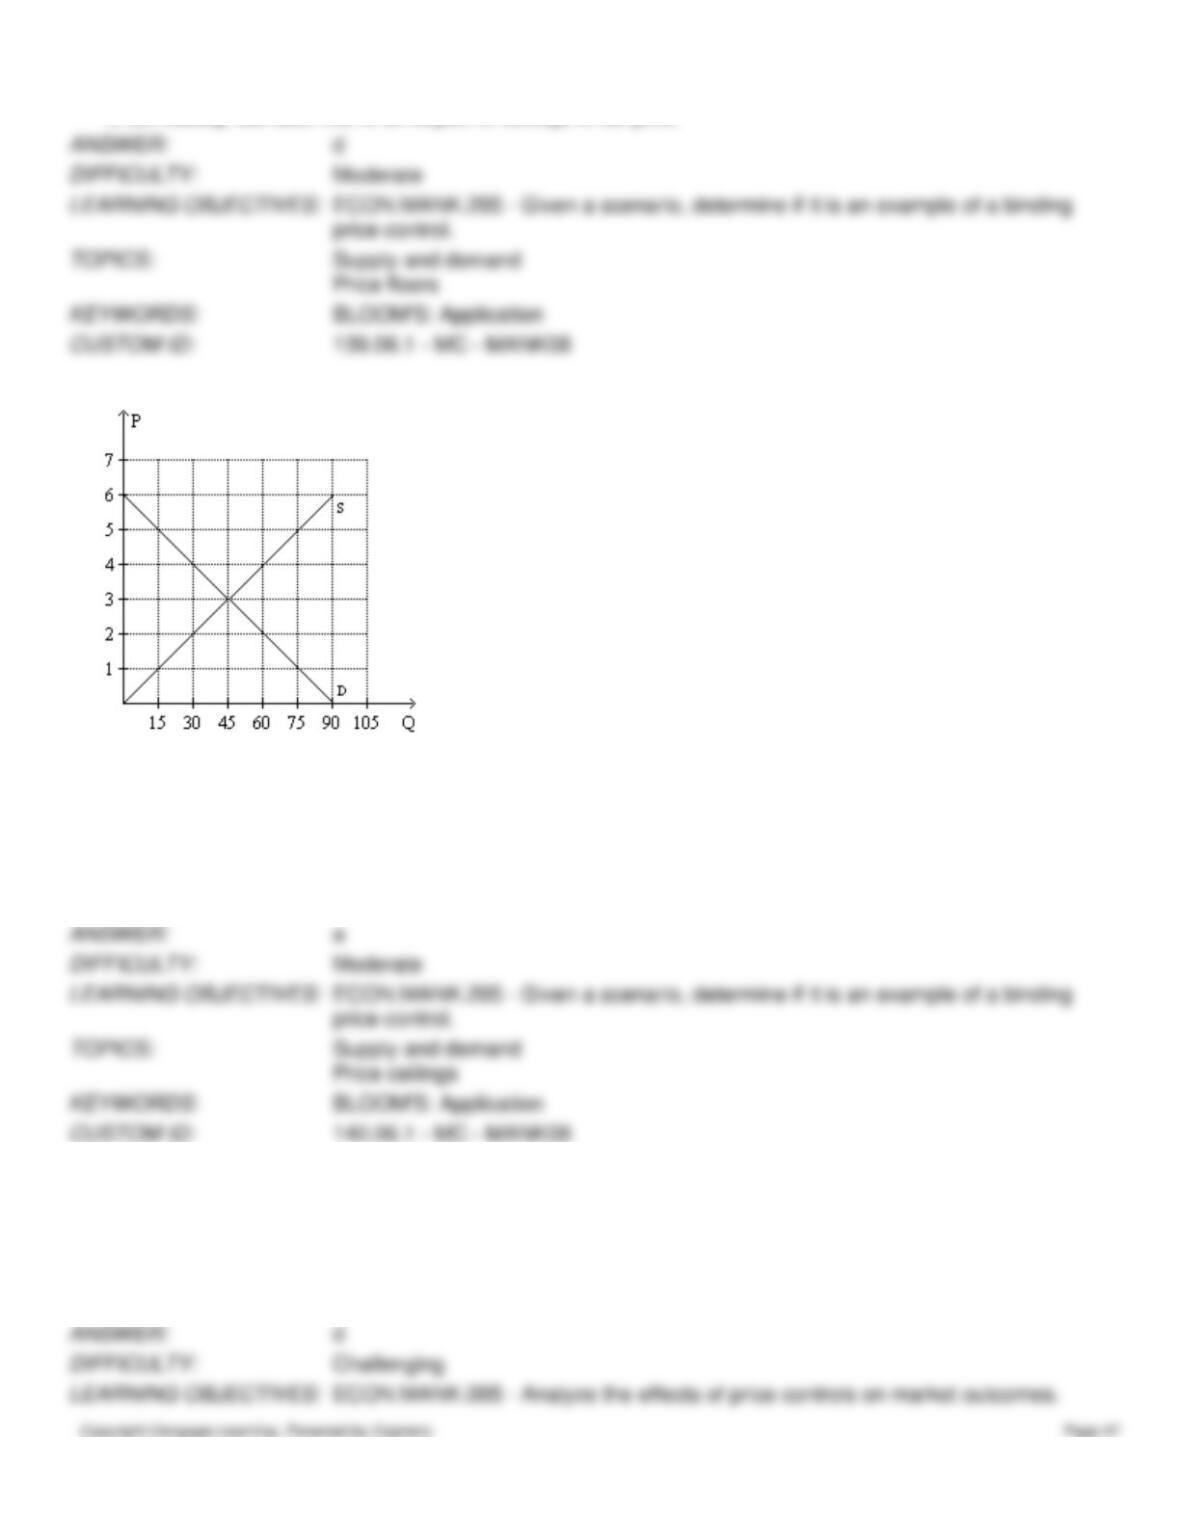
Figure 6-15
140. Refer to Figure 6-15. For a price ceiling to be binding in this market, it would have to be set at
a.
any price below $3.
b.
a price between $2 and $3.
c.
a price between $3 and $4.
d.
any price above $3.
141. Refer to Figure 6-15. Suppose a price ceiling of $2 is imposed on this market. As a result,
a.
the quantity of the good supplied decreases by 30 units.
b.
the demand curve shifts to the left so as to now pass through the point (quantity = 30, price = $2).
c.
buyers’ total expenditure on the good decreases by $75.
d.
buyers’ total expenditure on the good falls by $15.
142. Refer to Figure 6-15. For a price floor to be binding in this market, it would have to be set at
a.
any price below $3.
b.
a price between $2 and $3.
c.
a price between $3 and $4.
d.
any price above $3.
143. Refer to Figure 6-15. Suppose a price floor of $4 is imposed on this market. As a result,
a.
buyers’ total expenditure on the good decreases by $15.
b.
the supply curve shifts to the left so as to now pass through the point (quantity = 30, price = $4).
c.
the quantity demanded of the good decreases by 30 units.
d.
the number of units sold in the market will increase by 15 units.
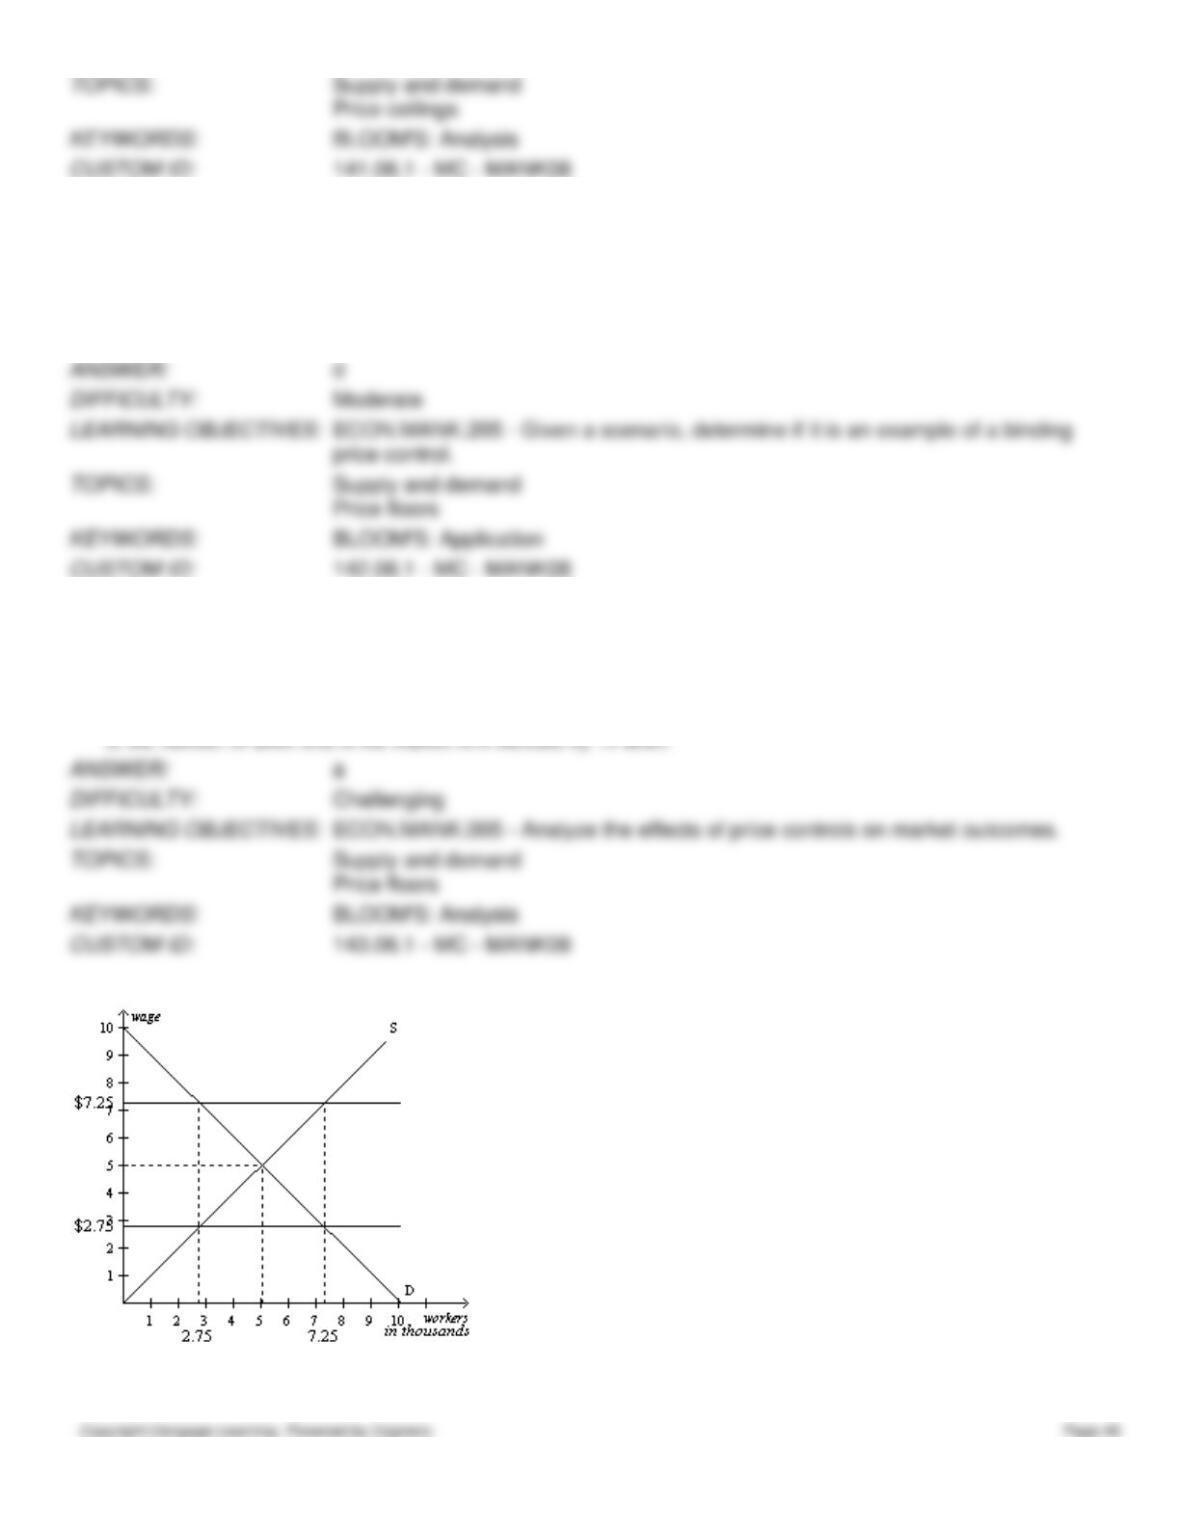
Figure 6-16
144. Refer to Figure 6-16. In this market, a minimum wage of $7.25 is
a.
binding and creates a labor shortage.
b.
binding and creates unemployment.
c.
nonbinding and creates a labor shortage.
d.
nonbinding and creates neither a labor shortage nor unemployment.
145. Refer to Figure 6-16. In this market, a minimum wage of $2.75 is
a.
binding and creates a labor shortage.
b.
binding and creates unemployment.
c.
nonbinding and creates a labor shortage.
d.
nonbinding and creates neither a labor shortage nor unemployment.
146. Refer to Figure 6-16. In this market, a minimum wage of $7.25 creates a labor
a.
shortage of 2,250 workers.
b.
shortage of 4,500 workers.
c.
surplus of 2,250 workers.
d.
surplus of 4,500 workers.
147. Refer to Figure 6-16. In this market, a minimum wage of $2.75 creates a labor
a.
shortage of 2,250 workers.
b.
shortage of 4,500 workers.
c.
surplus of 2,250 workers.
d.
neither a labor shortage nor surplus.
Table 6-1
Price
Quantity
Demanded
Quantity
Supplied
$20
2400
0
$30
2000
200
$40
1600
400
$50
1200
600
$60
800
800
$70
400
1000
$80
0
1200
148. Refer to Table 6-1. Which of the following price ceilings would be binding in this market?
a.
$80
b.
$70
c.
$60
d.
$50
149. Refer to Table 6-1. Which of the following price floors would be binding in this market?
a.
$70
b.
$60
c.
$50
d.
$40
150. Refer to Table 6-1. Suppose the government imposes a price ceiling of $40 on this market. What will be the size of
the shortage in this market?
a.
0 units
b.
400 units
c.
1200 units
d.
1600 units
151. Refer to Table 6-1. Suppose the government imposes a price ceiling of $70 on this market. What will be the size of
the shortage in this market?
a.
0 units
b.
400 units
c.
600 units
d.
1000 units
152. Refer to Table 6-1. Suppose the government imposes a price floor of $30 on this market. What will be the size of
the surplus in this market?
a.
0 units
b.
200 units
c.
1800 units
d.
2000 units
153. Refer to Table 6-1. Suppose the government imposes a price floor of $70 on this market. What will be the size of
the surplus in this market?
a.
0 units
b.
400 units
c.
600 units
d.
1000 units
Table 6-2
Price
Quantity
Demanded
Quantity
Supplied
$0
375
0
$5
300
50
$10
225
100
$15
150
150
$20
75
200
$25
0
250
154. Refer to Table 6-2. A price ceiling set at $5 will
a.
be binding and will result in a shortage of 50 units.
b.
be binding and will result in a shortage of 250 units.
c.
be binding and will result in a shortage of 300 units.
d.
not be binding.
155. Refer to Table 6-2. A price ceiling set at $20 will
a.
be binding and will result in a shortage of 75 units.
b.
be binding and will result in a shortage of 200 units.
c.
be binding and will result in a shortage of 125 units.
d.
not be binding.
156. Refer to Table 6-2. A price floor set at $20 will
a.
be binding and will result in a surplus of 75 units.
b.
be binding and will result in a surplus of 125 units.
c.
be binding and will result in a surplus of 200 units.
d.
not be binding.
157. Refer to Table 6-2. A price floor set at $5 will
a.
be binding and will result in a surplus of 50 units.
b.
be binding and will result in a surplus of 250 units.
c.
be binding and will result in a surplus of 300 units.
d.
not be binding.
158. Refer to Table 6-2. A price ceiling set at $5 results in
a.
50 units sold.
b.
250 units sold.
c.
300 units sold.
d.
350 units sold.
159. Refer to Table 6-2. A price floor set at $20 results in
a.
75 units sold.
b.
125 units sold.
c.
200 units sold.
d.
275 units sold.
Table 6-3
The following table contains the demand schedule and supply schedule for a market for a particular good. Suppose sellers
of the good successfully lobby Congress to impose a price floor $2 above the equilibrium price in this market.
Price
Quantity
Demanded
Quantity
Supplied
$0
15
0
$1
13
3
$2
11
6
$3
9
9
$4
7
12
$5
5
15
$6
3
18
160. Refer to Table 6-3. How many units of the good are sold after the imposition of the price floor?
a.
5
b.
9
c.
10
d.
15
161. Refer to Table 6-3. Following the imposition of a price floor $2 above the equilibrium price, irate buyers convince
Congress to repeal the price floor and to impose a price ceiling $1 below the former price floor. The resulting market price
is
a.
$2.
b.
$3.
c.
$4.
d.
$5.
162. Refer to Table 6-3. Following the imposition of a price floor $2 above the equilibrium price, irate buyers convince
Congress to repeal the price floor and to impose a price ceiling $1 below the former price floor. The resulting shortage is
a.
0 units.
b.
2 units.
c.
5 units.
d.
7 units.
Table 6-4
The following table contains the demand schedule and supply schedule for a market for a particular good. Suppose sellers
of the good successfully lobby Congress to impose a price floor $3 above the equilibrium price in this market.
Price
Quantity
Demanded
Quantity
Supplied
$0
15
0
$1
13
3
$2
11
6
$3
9
9
$4
7
12
$5
5
15
$6
3
18
163. Refer to Table 6-4. How many units of the good are sold after the imposition of the price floor?
a.
3
b.
9
c.
15
d.
18
164. Refer to Table 6-4. Following the imposition of a price floor $3 above the equilibrium price, irate buyers convince
Congress to repeal the price floor and to impose a price ceiling $1 below the former price floor. The resulting market price
is
a.
$2.
b.
$3.
c.
$4.
d.
$5.
165. Refer to Table 6-4. Following the imposition of a price floor $3 above the equilibrium price, irate buyers convince
Congress to repeal the price floor and to impose a price ceiling $1 below the former price floor. The resulting shortage is
a.
0 units.
b.
4 units.
c.
5 units.
d.
10 units.
Table 6-5
Price
Quantity
Demanded
Quantity
Supplied
$0
150
0
$3
120
45
$6
90
90
$9
60
135
$12
30
180
$15
0
225
166. Refer to Table 6-5. Which of the following price ceilings would be binding in this market?
a.
$3
b.
$6
c.
$9
d.
None of the above price ceilings would be binding.
167. Refer to Table 6-5. Which of the following price floors would be binding in this market?
a.
$3
b.
$6
c.
$9
d.
None of the above price floors would be binding.
168. Refer to Table 6-5. Suppose the government imposes a price ceiling of $3 on this market. What will be the size of
the shortage in this market?
a.
0 units
b.
30 units
c.
45 units
d.
75 units
169. Refer to Table 6-5. Suppose the government imposes a price floor of $3 on this market. What will be the size of the
surplus (or shortage) in this market?
a.
0 units
b.
30 units
c.
45 units
d.
75 units
170. In the United States, before OPEC increased the price of crude oil in 1973, there was
a.
no price ceiling on gasoline.
b.
a nonbinding price ceiling on gasoline.
c.
a binding price ceiling on gasoline.
d.
a nonbinding price floor on gasoline.
171. In the 1970s, long lines at gas stations in the United States were primarily a result of the fact that
a.
OPEC raised the price of crude oil in world markets.
b.
U.S. gasoline producers raised the price of gasoline.
c.
the U.S. government maintained a price ceiling on gasoline.
d.
Americans typically commuted long distances.
172. Economists blame the long lines at gasoline stations in the U.S. in the 1970s on
a.
U.S. government regulations pertaining to the price of gasoline.
b.
the Organization of Petroleum Exporting Countries (OPEC).
c.
major oil companies operating in the U.S.
d.
consumers who bought gasoline frequently, even when their cars’ gasoline tanks were nearly full.
173. When OPEC raised the price of crude oil in the 1970s, it caused the
a.
demand for gasoline to increase.
b.
demand for gasoline to decrease.
c.
supply of gasoline to increase.
d.
supply of gasoline to decrease.
174. When OPEC raised the price of crude oil in the 1970s, it caused the
a.
supply of gasoline to decrease.
b.
quantity of gasoline demanded to decrease.
c.
equilibrium price of gasoline to increase.
d.
All of the above are correct.
175. When OPEC raised the price of crude oil in the 1970s, it caused the United States’
a.
nonbinding price floor on gasoline to become binding.
b.
binding price floor on gasoline to become nonbinding.
c.
nonbinding price ceiling on gasoline to become binding.
d.
binding price ceiling on gasoline to become nonbinding.
176. Other than OPEC, the shortage of gasoline in the U.S. in the 1970s could also be blamed on
a.
a sharp increase in the demand for gasoline that was brought on by the Vietnam War.
b.
the government’s policy of maintaining a price ceiling on gasoline.
c.
an indifference among U.S. consumers toward conservation.
d.
the lack of substitutes for crude oil.
177. Economists generally believe that rent control is
a.
an efficient and fair way to help the poor.
b.
inefficient but the best available means of solving a serious social problem.
c.
a highly inefficient way to help the poor raise their standard of living.
d.
an efficient way to allocate housing, but not a good way to help the poor.