250. Refer to Figure 5-11. If price increases from $10 to $20, total revenue will
a.
increase by $120, so demand must be inelastic in this price range.
b.
increase by $320, so demand must be inelastic in this price range.
c.
decrease by $120, so demand must be elastic in this price range.
d.
decrease by $320, so demand must be elastic in this price range.
251. Refer to Figure 5-11. A decrease in price from $20 to $10 leads to a
a.
decrease in total revenue of $200, so the price elasticity of demand is greater than 1 in this price range.
b.
decrease in total revenue of $200, so the price elasticity of demand is less than 1 in this price range.
c.
decrease in total revenue of $120, so the price elasticity of demand is less than 1 in this price range.
d.
decrease in total revenue of $120, so demand is elastic in this price range.
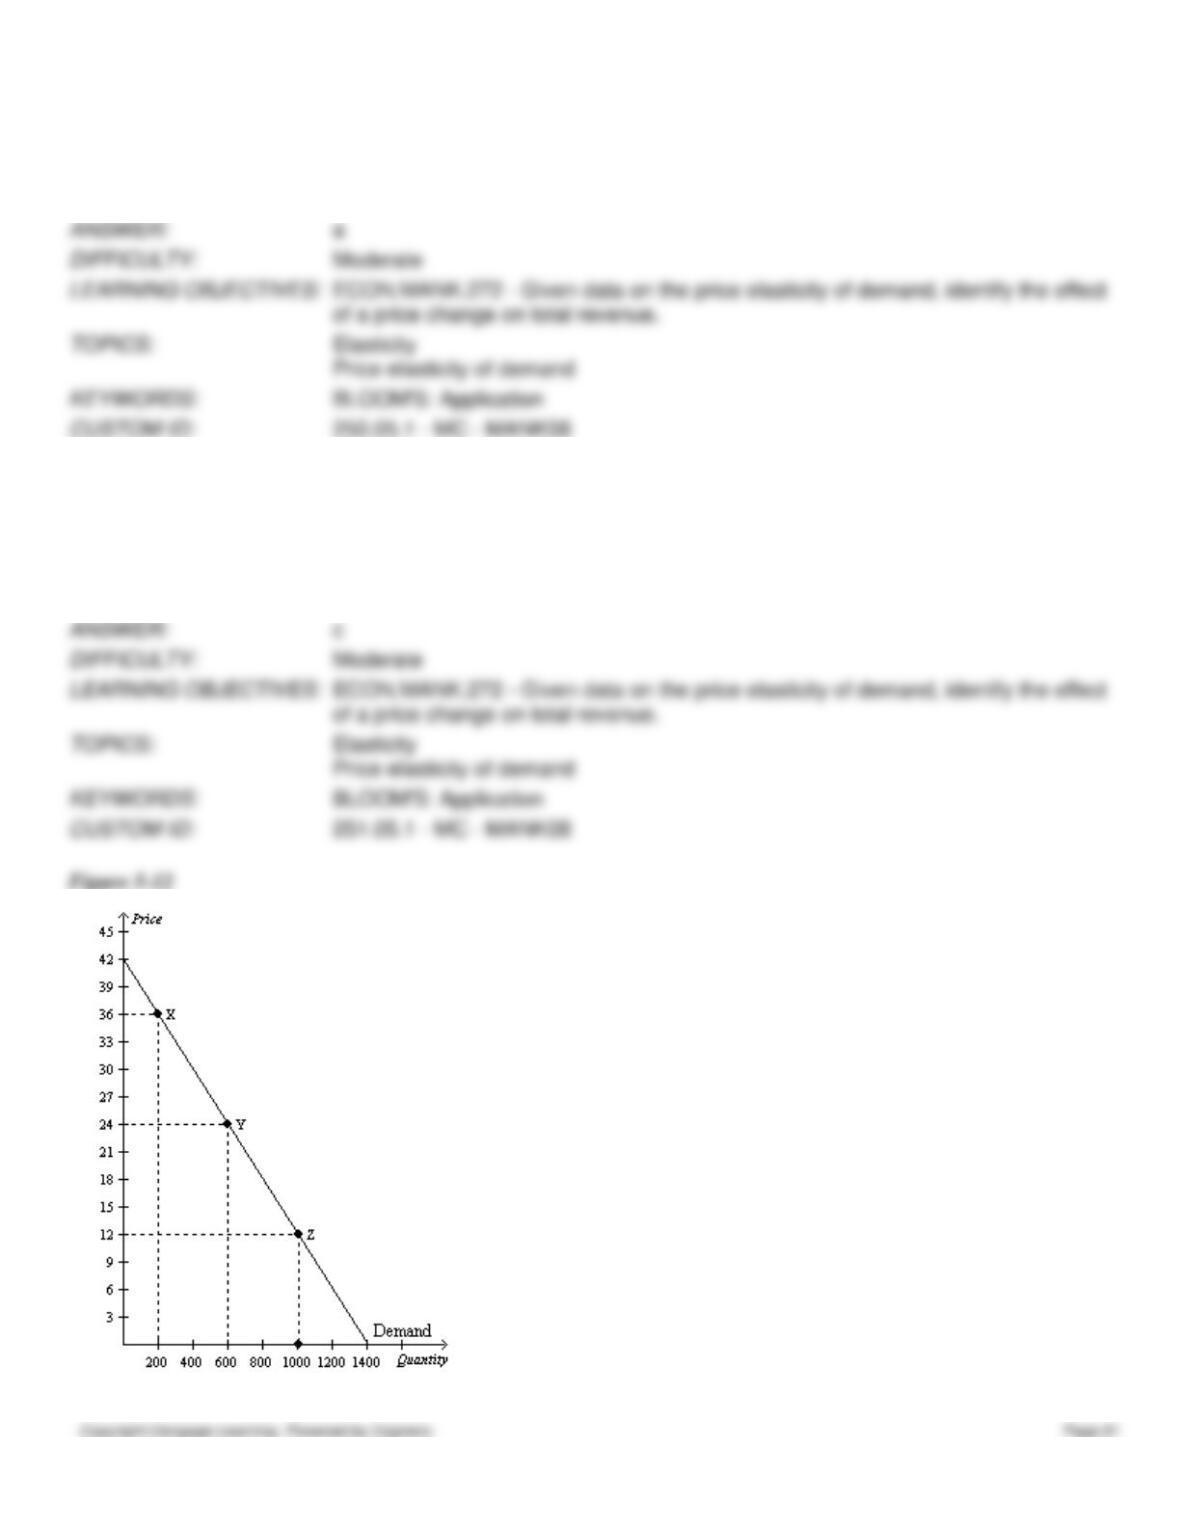
252. Refer to Figure 5-12. Using the midpoint method, the price elasticity of demand between point X and point Y is
a.
0.4.
b.
1.
c.
2.
d.
2.5.
253. Refer to Figure 5-12. Using the midpoint method, the price elasticity of demand between point Y and point Z is
a.
0.5.
b.
0.75.
c.
1.0.
d.
1.3.
254. Refer to Figure 5-12. If the price decreased from $36 to $12, total revenue would
a.
increase by $4,800, and demand is elastic between points X and Z.
b.
increase by $7,200, and demand is elastic between points X and Z.
c.
decrease by $4,800, and demand is inelastic between points X and Z.
d.
decrease by $7,200, and demand is inelastic between points X and Z.
255. Refer to Figure 5-12. Sellers’ total revenue would increase if the price
a.
increased from $6 to $9.
b.
increased from $33 to $36.
c.
decreased from $15 to $12.
d.
All of the above are correct.
256. Refer to Figure 5-12. Which of the following price changes would result in no change in sellers’ total revenue?
a.
The price increases from $15 to $21.
b.
The price increases from $18 to $21.
c.
The price decreases from $24 to $18.
d.
The price decreases from $27 to $24.
257. Refer to Figure 5-12. Sellers’ total revenue would increase if the price
a.
increased from $12 to $15.
b.
decreased from $39 to $36.
c.
decreased from $27 to $24.
d.
All of the above are correct.
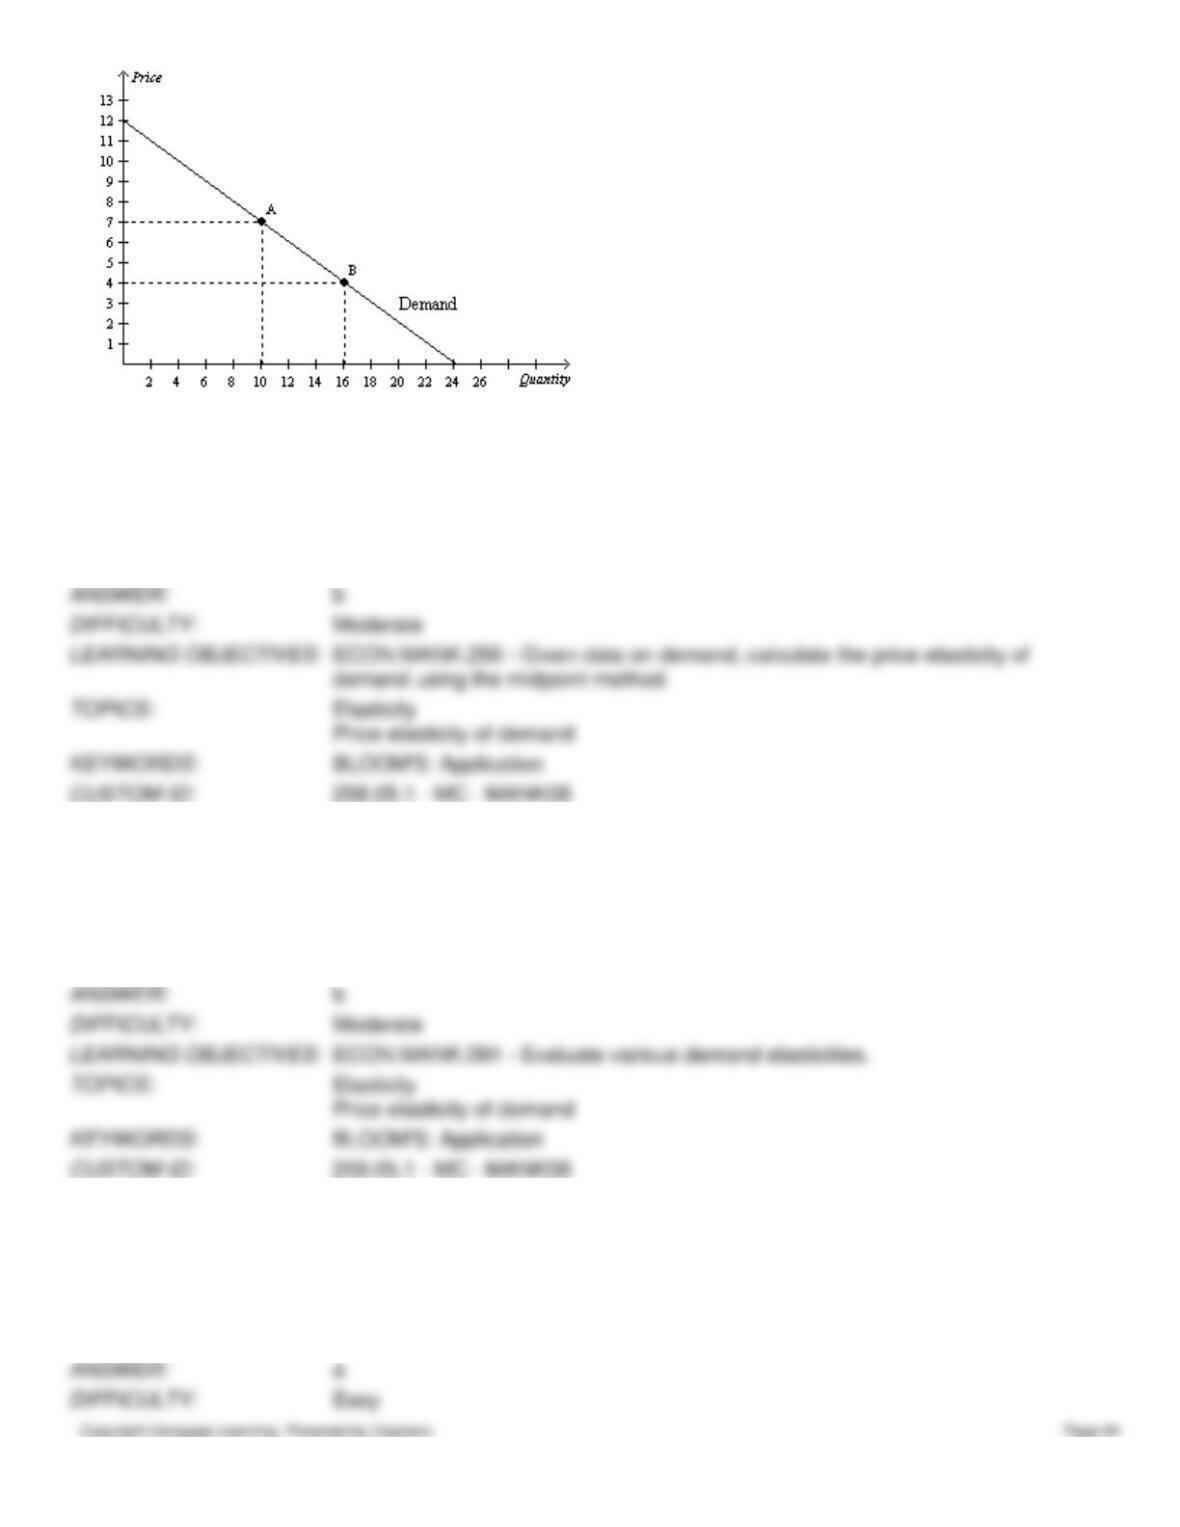
258. Refer to Figure 5-13. Between point A and point B, price elasticity of demand using the midpoint method is equal to
a.
0.71.
b.
0.85.
c.
1.18.
d.
1.40.
259. Refer to Figure 5-13. Between point A and point B on the graph, demand is
a.
perfectly elastic.
b.
inelastic.
c.
unit elastic.
d.
elastic, but not perfectly elastic.
260. Income elasticity of demand measures how
a.
the quantity demanded changes as consumer income changes.
b.
consumer purchasing power is affected by a change in the price of a good.
c.
the price of a good is affected when there is a change in consumer income.
d.
many units of a good a consumer can buy given a certain income level.
261. To determine whether a good is considered normal or inferior, one could examine the value of the
a.
income elasticity of demand for that good.
b.
price elasticity of demand for that good.
c.
price elasticity of supply for that good.
d.
cross-price elasticity of demand for that good.
262. Suppose good X has a positive income elasticity of demand. This implies that good X could be
(i)
a normal good.
(ii)
a necessity.
(iii)
an inferior good.
(iv)
a luxury.
a.
(i) only
b.
(i) and (ii) only
c.
(i), (ii), and (iv) only
d.
(iii) only
263. Suppose good X has a negative income elasticity of demand. This implies that good X is
a.
a normal good.
b.
a necessity.
c.
an inferior good.
d.
a luxury.
264. If an increase in income results in a decrease in the quantity demanded of a good, then for that good, the
a.
cross-price elasticity of demand is negative.
b.
price elasticity of demand is elastic.
c.
income elasticity of demand is negative.
d.
income elasticity of demand is positive.
265. Which of the following should be held constant when calculating an income elasticity of demand?
a.
the quantity of the good demanded
b.
the price of the good
c.
income
d.
All of the above should be held constant.
266. Which of the following should be held constant when calculating an income elasticity of demand?
a.
the price of the good
b.
prices of related goods
c.
tastes
d.
All of the above should be held constant.
267. Necessities such as food and clothing tend to have
a.
high price elasticities of demand and high income elasticities of demand.
b.
high price elasticities of demand and low income elasticities of demand.
c.
low price elasticities of demand and high income elasticities of demand.
d.
low price elasticities of demand and low income elasticities of demand.
268. For which of the following goods is the income elasticity of demand likely highest?
a.
water
b.
diamonds
c.
hamburgers
d.
housing
269. For which of the following goods is the income elasticity of demand likely highest?
a.
natural gas
b.
doctor’s visits
c.
hamburgers
d.
boats
270. For which of the following goods is the income elasticity of demand likely lowest?
a.
subscriptions to premium movie channels through the local cable television provider
b.
hi-definition DVD players
c.
champagne
d.
housing
271. For which of the following goods is the income elasticity of demand likely lowest?
a.
water
b.
sapphire pendant necklaces
c.
filet mignon steaks
d.
fresh fruit
272. For which of the following types of goods would the income elasticity of demand be positive and relatively large?
a.
all inferior goods
b.
all normal goods
c.
goods for which there are many complements
d.
luxuries
273. The income elasticity of demand for caviar tends to be
a.
high because caviar is relatively expensive.
b.
low because caviar is packaged in small containers.
c.
high because buyers generally feel that they can do without it.
d.
low because it is almost always in short supply.
Table 5-7
The following table shows a portion of the demand schedule for a particular good at various levels of income.
Price
Quantity Demanded
(Income = $5,000)
Quantity Demanded
(Income = $7,500)
Quantity Demanded
(Income = $10,000)
$24
2
3
4
$20
4
6
8
$16
6
9
12
$12
8
12
16
$8
10
15
20
$4
12
18
24
274. Refer to Table 5-7. Using the midpoint method, when income equals $7,500, what is the price elasticity of demand
between $16 and $20?
a.
0.56
b.
0.75
c.
1.33
d.
1.80
275. Refer to Table 5-7. Using the midpoint method, when income equals $5,000, what is the price elasticity of demand
between $8 and $12?
a.
0.56
b.
0.75
c.
1.33
d.
1.80
276. Refer to Table 5-7. Using the midpoint method, at a price of $16, what is the income elasticity of demand when
income rises from $5,000 to $10,000?
a.
0.00
b.
0.50
c.
1.00
d.
1.50
277. Refer to Table 5-7. Using the midpoint method, at a price of $8, what is the income elasticity of demand when
income rises from $7,500 to $10,000?
a.
0.00
b.
0.41
c.
1.00
d.
2.45
278. Refer to Table 5-7. Using the midpoint method, at a price of $12, what is the income elasticity of demand when
income rises from $5,000 to $10,000?
a.
0.00
b.
0.41
c.
1.00
d.
2.45
Table 5-8
Income
Quantity of Good X
Purchased
Quantity of Good Y
Purchased
$30,000
2
20
$40,000
6
10
279. Refer to Table 5-8. Using the midpoint method, what is the income elasticity of demand for good X?
a.
-3.5
b.
-0.29
c.
0.29
d.
3.5
280. Refer to Table 5-8. Using the midpoint method, the income elasticity of demand for good Y is
a.
2.33, and good Y is a normal good.
b.
-2.33, and good Y is an inferior good.
c.
-0.43, and good Y is a normal good.
d.
-0.43, and good Y is an inferior good.
281. Suppose the income elasticity of demand is -0.5 for good X. This implies that a 5% decrease in income will cause the
quantity demanded of good X to
a.
increase by 2.5%, and X is an inferior good.
b.
decrease by 2.5% and X is a normal good.
c.
increase by 10% and X is an inferior good.
d.
decrease by 10% and X is a normal good.
282. Last year, Max bought 6 pairs of athletic shoes when his income was $35,000. This year, his income is $42,000, and
he purchased 8 pairs of athletic shoes. Holding other factors constant, it follows that Max
a.
considers athletic shoes to be necessities.
b.
considers athletic shoes to be inferior goods.
c.
considers athletic shoes to be normal goods.
d.
has a low price elasticity of demand for athletic shoes.
283. Last year, Tess bought 5 handbags when her income was $54,000. This year, her income is $60,000, and she
purchased 7 handbags. Holding other factors constant, it follows that Tess’s income elasticity of demand is about
a.
0.32, and Tess regards handbags as inferior goods.
b.
0.32, and Tess regards handbags as normal goods.
c.
3.17, and Tess regards handbags as inferior goods.
d.
3.17, and Tess regards handbags as normal goods.
284. Last year, Jim bought 8 tickets to sporting events when his income was $30,000. This year, his income is $33,000,
and he purchased 10 tickets to sporting events. Holding other factors constant and using the midpoint method, it follows
that Jim’s income elasticity of demand is about
a.
0.43, and Jim regards tickets to sporting events as inferior goods.
b.
0.43, and Jim regards tickets to sporting events as normal goods.
c.
2.33, and Jim regards tickets to sporting events as inferior goods.
d.
2.33, and Jim regards tickets to sporting events as normal goods.
285. Danita rescues dogs from her local animal shelter. When Danita’s income rises by 7 percent, her quantity demanded
of dog biscuits increases by 12 percent. For Danita, the income elasticity of demand for dog biscuits is
a.
negative, and dog biscuits are a normal good.
b.
negative, and dog biscuits are an inferior good.
c.
positive, and dog biscuits are an inferior good.
d.
positive, and dog biscuits are a normal good.
286. Last year, Joan bought 50 pounds of hamburger when her household’s income was $40,000. This year, her household
income was only $30,000 and Joan bought 60 pounds of hamburger. All else constant, Joan’s income elasticity of demand
for hamburger is
a.
positive, so Joan considers hamburger to be an inferior good.
b.
positive, so Joan considers hamburger to be a normal good and a necessity.
c.
negative, so Joan considers hamburger to be an inferior good.
d.
negative, so Joan considers hamburger to be a normal good but not a necessity.
287. You and your college roommate eat three packages of Ramen noodles each week. After graduation last month, both
of you were hired at several times your college income. You still enjoy Ramen noodles very much and buy even more, but
your roommate plans to buy fewer Ramen noodles in favor of foods she prefers more. When looking at income elasticity
of demand for Ramen noodles, yours would
a.
be negative, and your roommate’s would be positive.
b.
be positive, and your roommate’s would be negative.
c.
be zero, and your roommate’s would approach infinity.
d.
approach infinity, and your roommate’s would be zero.
288. You and your college roommate eat three packages of Ramen noodles each week. After graduation last month, both
of you were hired at several times your college income. Your roommate still enjoys Ramen noodles very much and buys
even more, but you plan to buy fewer Ramen noodles in favor of foods you prefer more. When looking at income
elasticity of demand for Ramen noodles, yours would
a.
be negative and your roommate’s would be positive.
b.
be positive and your roommate’s would be negative.
c.
be zero and your roommate’s would approach infinity.
d.
approach infinity and your roommate’s would be zero.
289. While in college, John and Bethany each buy five packages of mac-n-cheese per week. After they graduate and have
full-time jobs, John buys six packages per week, but Bethany buys only two packages per week. When looking at income
elasticity of demand for mac-n-cheese, John’s
a.
is negative, and Bethany’s is positive.
b.
is positive, and Bethany’s is negative.
c.
is zero, and Bethany’s approaches infinity.
d.
approaches infinity, and Bethany’s is zero.
290. While in college, Marty and Laura each buy 15 bus tickets per month. After they graduate and have full-time jobs,
Marty buys 0 bus tickets per month and Laura buys 28 bus tickets per month. Comparing income elasticity of demand for
bus tickets, Marty’s
a.
is negative, and Laura’s is positive.
b.
is positive, and Laura’s is negative.
c.
is zero, and Laura’s is positive.
d.
is zero, and Laura’s is negative.
291. Assume that a 4 percent increase in income results in a 2 percent increase in the quantity demanded of a good. The
income elasticity of demand for the good is
a.
negative, and the good is an inferior good.
b.
negative, and the good is a normal good.
c.
positive, and the good is a normal good.
d.
positive, and the good is an inferior good.