Unlock document.
This document is partially blurred.
Unlock all pages and 1 million more documents.
Get Access
Subjective Short Answer
1. The measure of how willing consumers are to buy less of a good as its price rises is called
2. Suppose that good X has few close substitutes and that good Y has many close substitutes. Which good would you
expect to have more price elastic demand?
3. Suppose that good X has few close substitutes and that good Y has many close substitutes. Which good would you
expect to have more price inelastic demand?
4. Suppose that good X is a luxury and that good Y is a necessity. Which good would you expect to have more price
inelastic demand?
5. Suppose that good X is a luxury and that good Y is a necessity. Which good would you expect to have more price
elastic demand?
6. For which of the following goods would demand be most price elastic: a car, a sedan, a Honda sedan, a Honda Accord,
a black Honda Accord?
7. Suppose the price of natural gas, a typical fuel for heating homes, rises in January in Alaska. Would you expect the
price elasticity of demand for natural gas to more inelastic immediately after the price increase or at some point in the
future?
8. Suppose the price of gas increases by 20%. Will demand be more elastic if consumers have 3 weeks or 3 years to adjust
to this price change?
Table 5-12
Price
Quantity Demanded
$0
50
$2
40
$4
30
$6
20
$8
10
9. Refer to Table 5-12. Using the midpoint method, what is the price elasticity of demand between $2 and $4?
10. Refer to Table 5-12. Using the midpoint method, what is the price elasticity of demand between $6 and $8?
11. Refer to Table 5-12. Between which two quantities listed is demand most inelastic?
12. Refer to Table 5-12. Between which two quantities listed is demand most elastic?
13. Refer to Table 5-12. Between which two quantities listed is demand unit elastic?
Table 5-3
Consider the following demand schedule.
Price
Quantity Demanded
$0
1,000
$3
800
$6
600
$9
400
$12
200
$15
0
14. Refer to Table 5-3. Using the midpoint method, demand is unit elastic when price changes from
15. Refer to Table 5-3. Using the midpoint method, what is the price elasticity of demand between $12 and $15?
16. Refer to Table 5-3. Using the midpoint method, between which two prices is price elasticity of demand most
inelastic?
17. Suppose demand is given by the equation:
Using the midpoint method, what is the price elasticity of demand between $1 and $2?
18. Suppose demand is given by the equation:
Using the midpoint method, what is the price elasticity of demand between $7 and $8?
19. Suppose demand is given by the equation:
Using the midpoint method, what is the price elasticity of demand between $1 and $2?
20. Suppose demand is given by the equation:
Using the midpoint method, what is the price elasticity of demand between $2 and $4?
21. Suppose a market has the demand function Qd=20-0.5P. Using the midpoint method, what is the price elasticity of
demand between $30 and $40?
22. Suppose the price elasticity of demand for good A is 1.25. If the price of good A increases by 20%, what will be the
resulting percentage change in quantity demanded for good A?
23. What is the price elasticity of demand at any point on a perfectly inelastic demand curve?
24. What is the price elasticity of demand at any point on a perfectly elastic demand curve?
25. Adam and Barb go to the store to purchase some lottery tickets. Without looking at the price, Adam says “I’ll take 10
lottery tickets,” and Barb says “I’ll take $10 worth of lottery tickets.” What is each person’s price elasticity of demand for
lottery tickets?
26. Suppose demand is given by the equation:
At what price will total revenue be maximized?
27. Suppose demand is given by the equation:
At what point along this demand curve will total revenue be maximized?
28. Suppose a market has the demand function Qd=20-0.5P. At what price will total revenue be maximized?
29. Suppose the price elasticity of demand for a product is 0.5. If a supplier wants to increase revenue, what change
should it make to price, if any?
30. Suppose the price elasticity of demand for a product is 1. If a supplier wants to increase revenue, what change should
it make to price, if any?
31. Suppose the price elasticity of demand for a product is 1.3. If a supplier wants to increase revenue, what change
should it make to price, if any?
32. Suppose you manage a baseball stadium. To pay the salary for a star player, you would like to increase the total
revenue from ticket sales. Should you increase or decrease the price of a ticket to increase revenue? Explain.
33. If the cross-price elasticity of demand between two goods is negative, what is the relationship between the two goods?
34. If the cross-price elasticity of demand between two goods is positive, what is the relationship between the two goods?
Scenario 5-2
Suppose the demand function for good X is given by: where is the quantity demanded of
good X, is the price of good X, and is the price of good Y, which is related to good X.
35. Refer to Scenario 5-2. Using the midpoint method, if the price of good Y is $10 and the price of good X decreases
from $5 to $3, what is the price elasticity of demand for good X? Is the demand elastic, unitary elastic, or inelastic?
36. Refer to Scenario 5-2. Good X and Good Y are related as
37. Refer to Scenario 5-2. Using the midpoint method, if the price of good X is $10 and the price of good Y increases
from $8 to $10, the cross price elasticity of demand is about
38. If the income elasticity of demand for a good is –1.40, is the good a normal or inferior good?
39. If the income elasticity of demand for a good is 0.56, is the good a normal or inferior good?
Scenario 5-6
Consider the markets for mobile and landline telephone service. Suppose that when the average income of residents of
Plainville is $55,000 per year, the quantity demanded of landline telephone service is 12,500 and the quantity demanded
of mobile service is 28,000. Suppose that when the price of mobile service rises from $100 to $120 per month, the
quantity demanded of landline service decreases to 11,000. Suppose also that when the average income increases to
$60,000, the quantity demanded of mobile service increases to 33,000.
40. Refer to Scenario 5-6. Considering the income elasticity, what type of good is mobile telephone service?
41. Refer to Scenario 5-6. Using the midpoint method, what is the income elasticity of demand for mobile service?
42. Refer to Scenario 5-6. Considering the cross price elasticity of demand for mobile and landline telephone service, is
the cross price elasticity of demand positive or negative and do the consumers of Plainville regard these goods as
substitutes or complements?
43. Refer to Scenario 5-6. Using the midpoint method, what is the cross price elasticity of demand for landline and
mobile service?
44. With regard to elasticity, if a firm has a longer time to adjust to a price increase, supply will be more
45. With regard to elasticity, as a firm nears its production capacity, supply becomes more
46. In the short run, as compared to the long run, both the price elasticity of demand and the price elasticity of supply tend
to be more
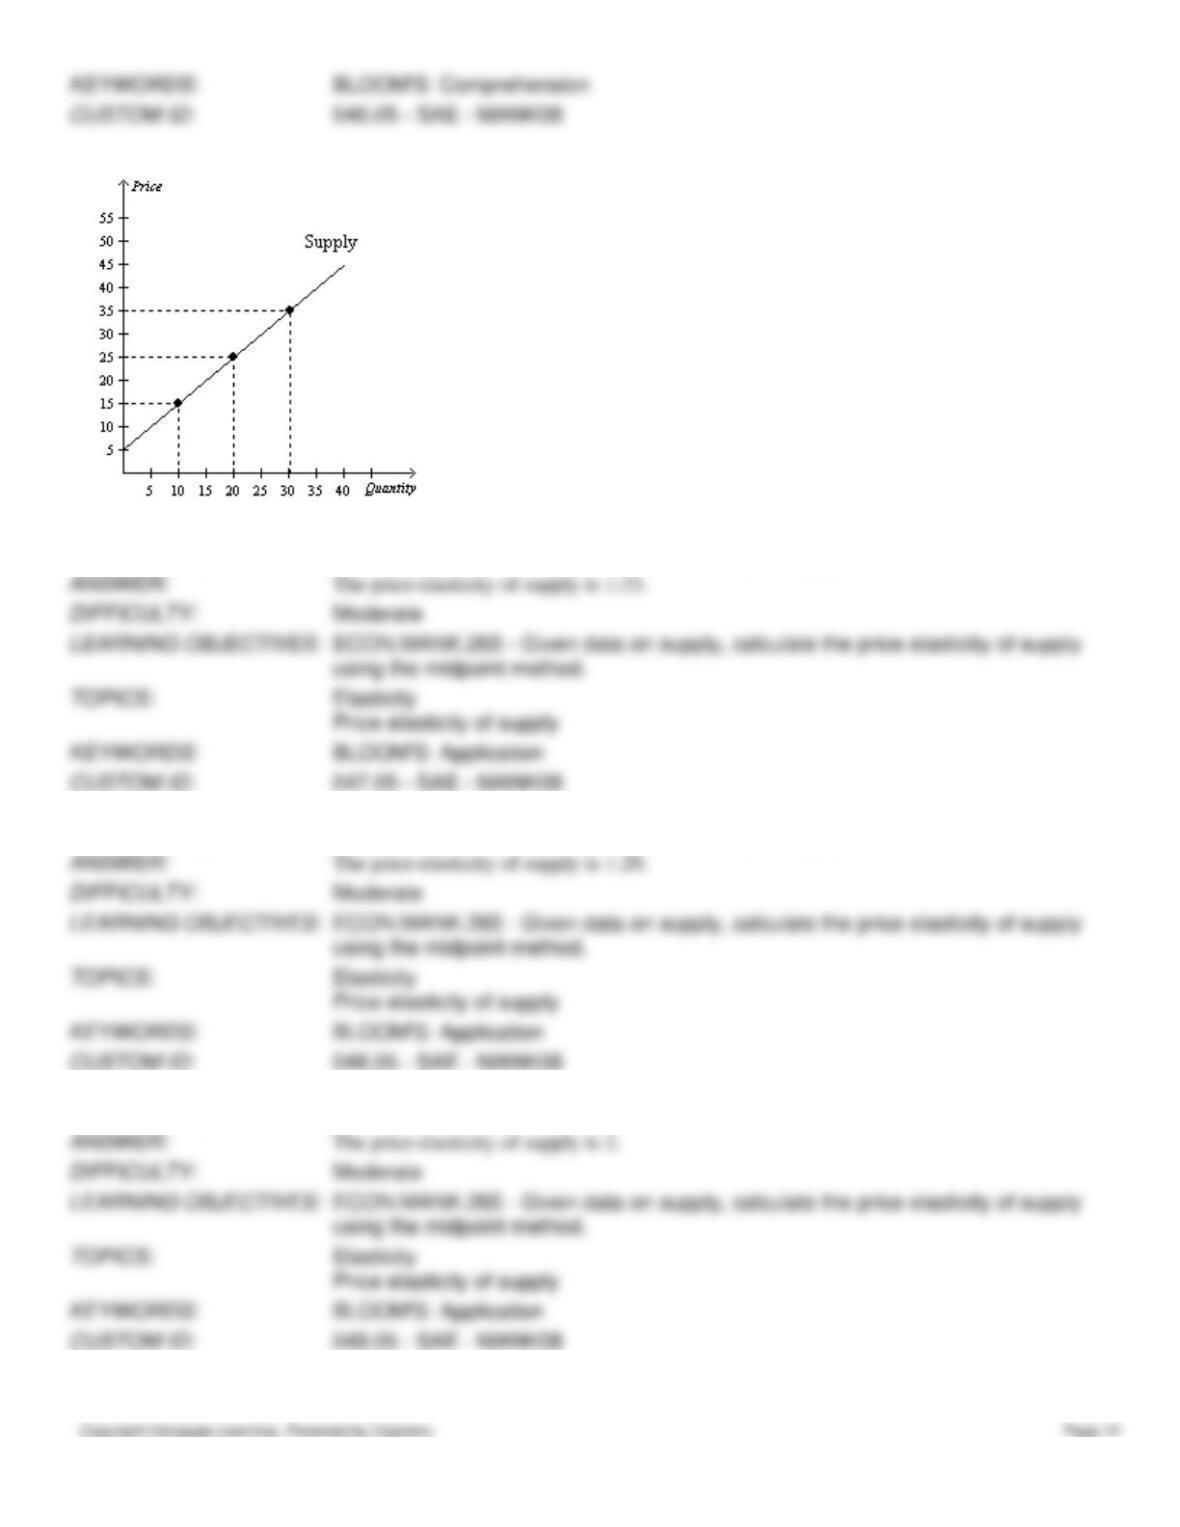
Figure 5-21
47. Refer to Figure 5-21. Using the midpoint method, what is the price elasticity of supply between $15 and $25?
48. Refer to Figure 5-21. Using the midpoint method, what is the price elasticity of supply between $25 and $35?
49. Refer to Figure 5-21. Using the midpoint method, what is the price elasticity of supply between $5 and $15?
50. If the quantity supplied is exactly the same regardless of the price, supply is
51. If a supply curve is perfectly vertical, what is the value of the price elasticity of supply?
52. If a supply curve is perfectly horizontal, what is the value of the price elasticity of supply?
53. Suppose a freeze in Florida significantly reduces the supply of oranges this year. As a result, would you expect the
total revenue from the sale of orange juice to rise or fall? Explain.
54. Suppose a farmer knows that he will be able to harvest and sell 3,000 bushels of wheat. Would he prefer a market in
which conditions are favorable and most farmers harvest large crops or a market in which conditions are unfavorable and
many farmers harvest small crops? Why?
55. Consider the following pairs of goods. For which of the two goods would you expect the demand to be more price
elastic? Why?
a.
water or diamonds
b.
insulin or nasal decongestant spray
c.
food in general or breakfast cereal
d.
gasoline over the course of a week or gasoline over the course of a year
e.
personal computers or IBM personal computers
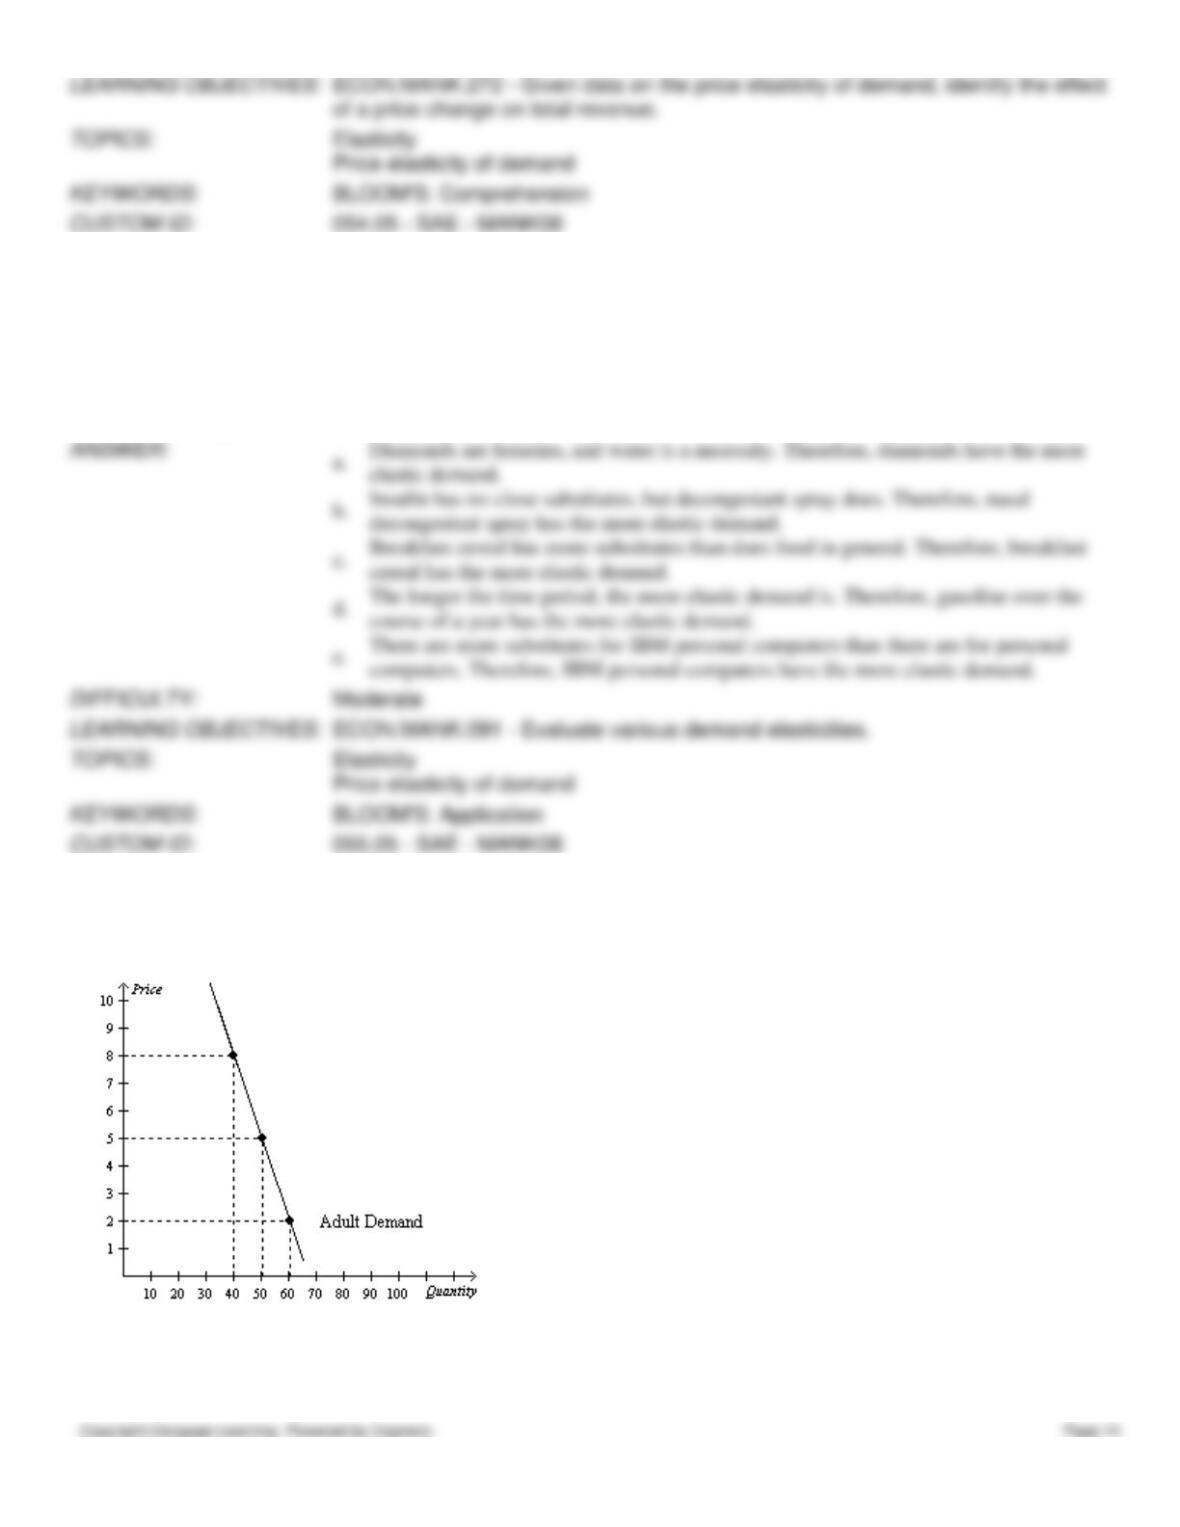
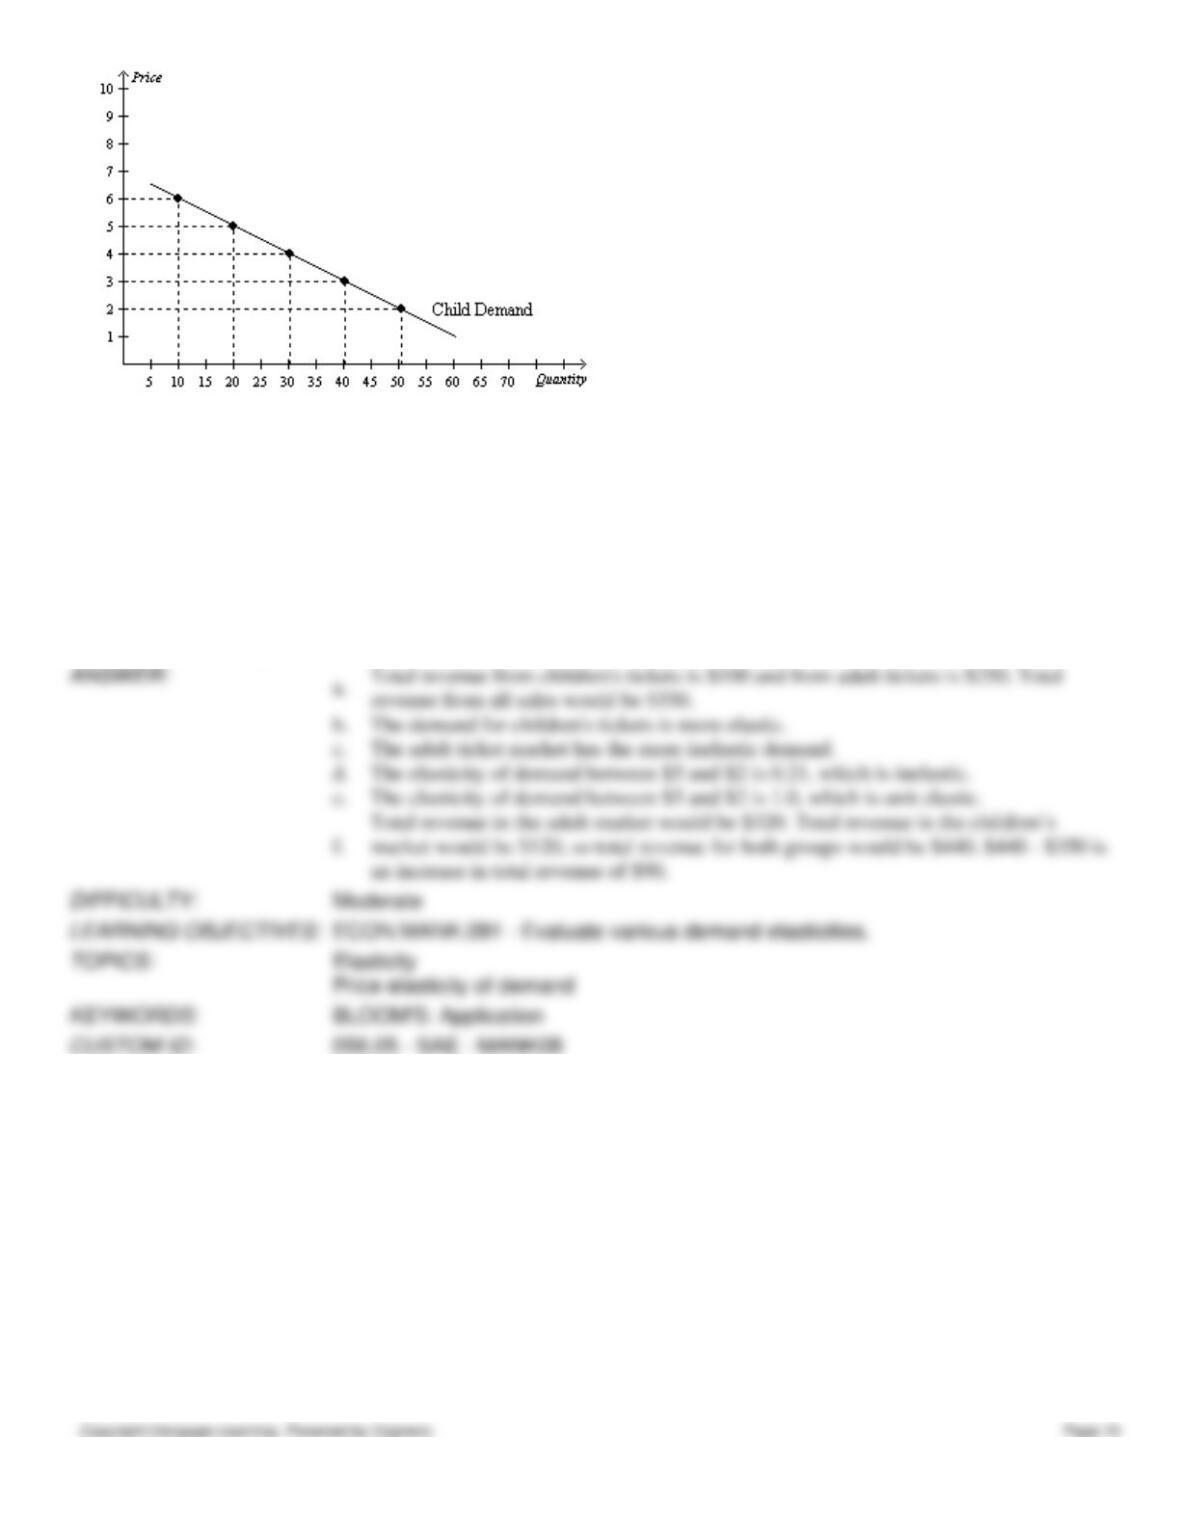
56. You own a small town movie theatre. You currently charge $5 per ticket for everyone who comes to your movies.
Your friend who took an economics course in college tells you that there may be a way to increase your total revenue.
Given the demand curves shown, answer the following questions.
a.
What is your current total revenue for both groups?
b.
The elasticity of demand is more elastic in which market?
c.
Which market has the more inelastic demand?
d.
What is the elasticity of demand between the prices of $5 and $2 in the adult market? Is
this elastic or inelastic?
e.
What is the elasticity of demand between $5 and $2 in the children's market? Is this
elastic or inelastic?
f.
Given the graphs and what your friend knows about economics, he recommends you
increase the price of adult tickets to $8 each and lower the price of a child's ticket to $3.
How much could you increase total revenue if you take his advice?
57. Use the graph shown to answer the following questions. Put the correct letter(s) in the blank.
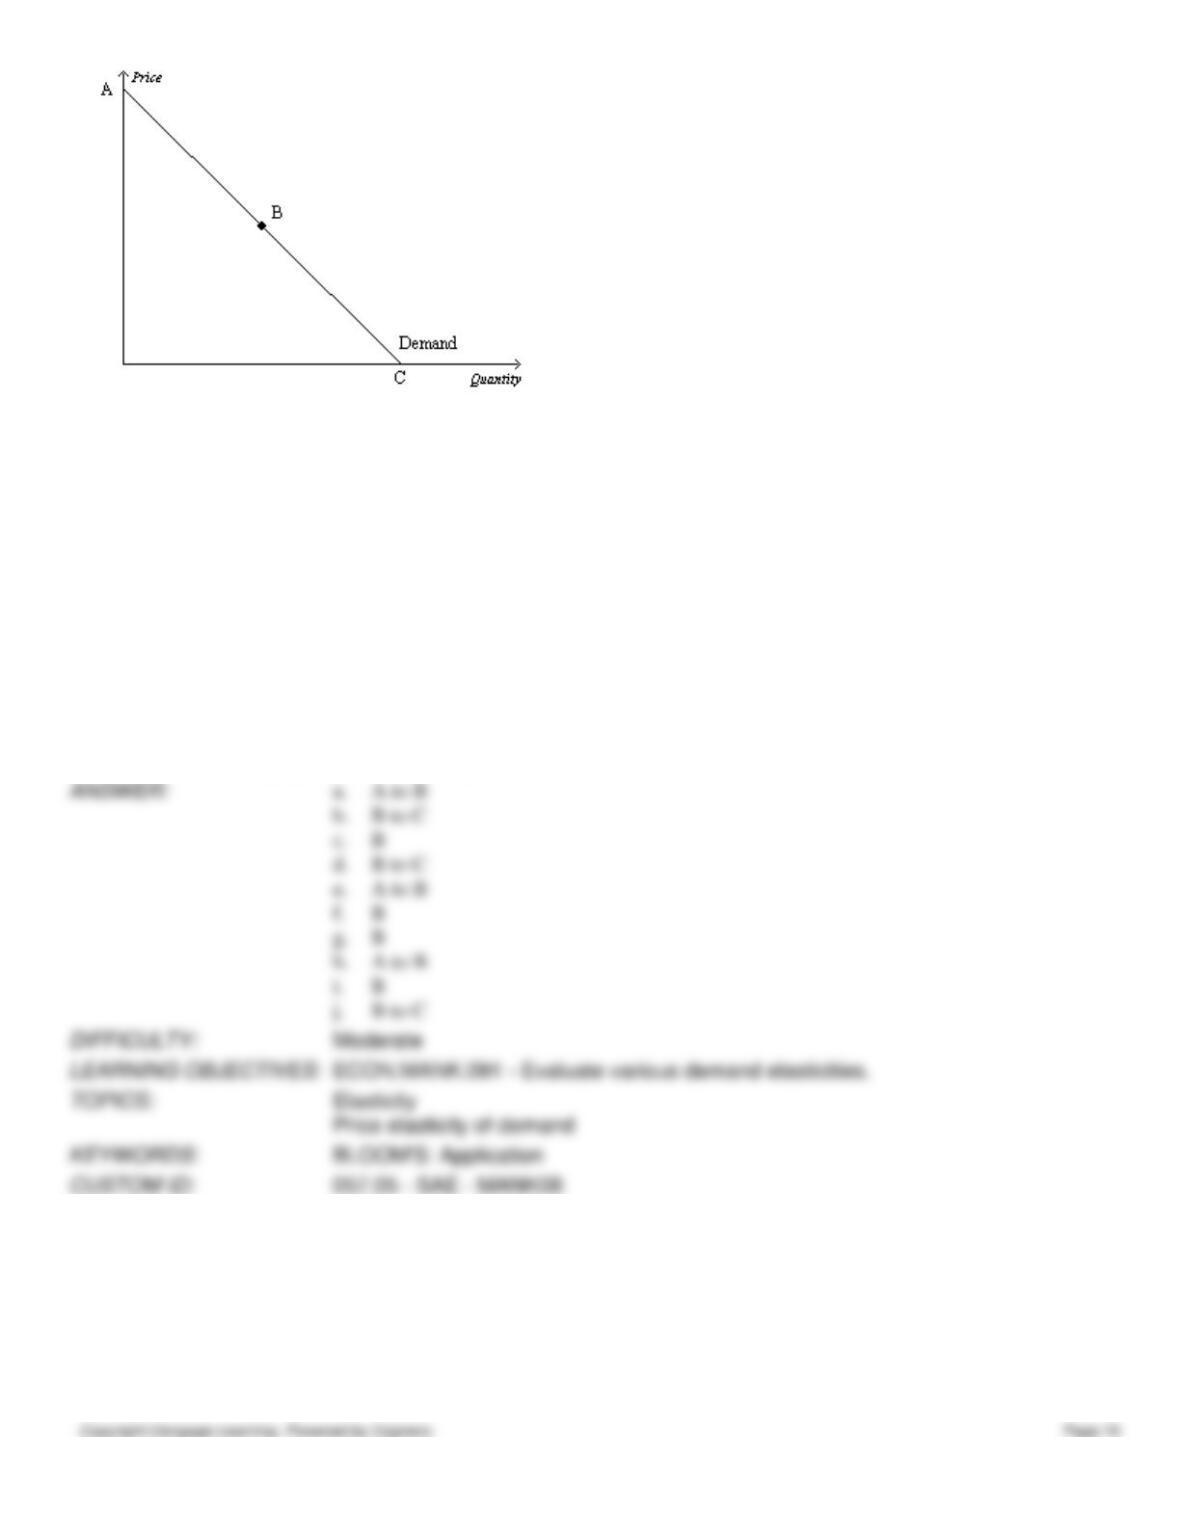
a.
The elastic section of the graph is represented by section _______.
b.
The inelastic section of the graph is represented by section _______.
c.
The unit elastic section of the graph is represented by section _______.
d.
The portion of the graph in which a decrease in price would cause total revenue to fall
would be _________.
e.
The portion of the graph in which a decrease in price would cause total revenue to rise
would be _________.
f.
The portion of the graph in which a decrease in price would not cause a change in total
revenue would be _________.
g.
The section of the graph in which total revenue would be at a maximum would be
_______.
h.
The section of the graph in which elasticity is greater than 1 is _______.
i.
The section of the graph in which elasticity is equal to 1 is ______.
j.
The section of the graph in which elasticity is less than 1 is _______.
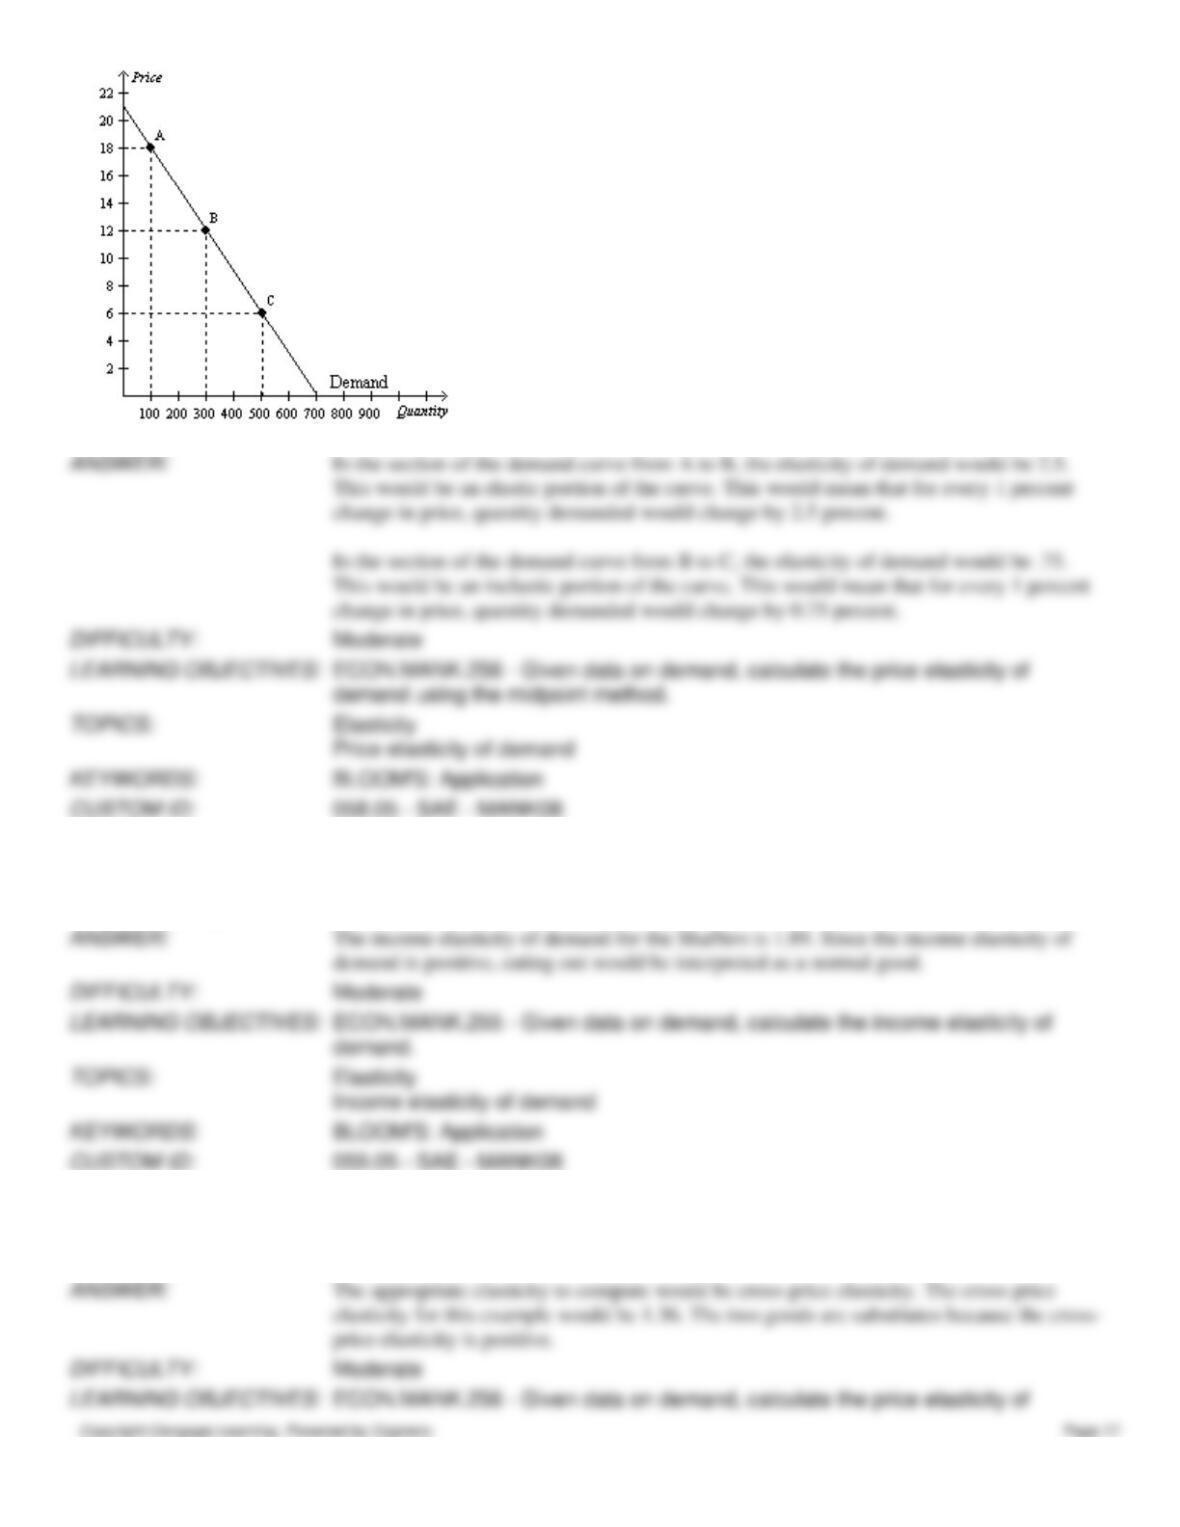
58. Using the midpoint method, compute the elasticity of demand between points A and B. Is demand along this portion
of the curve elastic or inelastic? Interpret your answer with regard to price and quantity demanded. Now compute the
elasticity of demand between points B and C. Is demand along this portion of the curve elastic or inelastic?
59. When the Shaffers had a monthly income of $4,000, they usually ate out 8 times a month. Now that the couple makes
$4,500 a month, they eat out 10 times a month. Compute the couple's income elasticity of demand using the midpoint
method. Explain your answer. Is a restaurant meal a normal or inferior good to the couple?
60. Recently, in Smalltown, the price of Twinkies fell from $0.80 to $0.70. As a result, the quantity demanded of Ho-Ho's
decreased from 120 to 100. What would be the appropriate elasticity to compute? Using the midpoint method, compute
this elasticity. What does your answer tell you?