b.
decrease total revenue of textbook sellers.
c.
not change total revenue of textbook sellers.
d.
There is not enough information to answer this question.
195. Josh mows lawns. If the demand for lawn-mowing service is elastic and Josh wants to increase his total revenue, he
should
a.
increase the price of his lawn-mowing service.
b.
decrease the price of his lawn-mowing service.
c.
reduce the costs of operating his lawn-mowing service.
d.
More than one of the above is correct.
196. Holding all other forces constant, if increasing the price of a good leads to an increase in total revenue, then the
demand for the good must be
a.
unit elastic.
b.
inelastic.
c.
elastic.
d.
None of the above is correct because a price increase always leads to an increase in total revenue.
197. Holding all other forces constant, if increasing the price of a good leads to a decrease in total revenue, then the
demand for the good must be
a.
unit elastic.
b.
inelastic.
c.
elastic.
d.
None of the above is correct because a price increase always leads to an decrease in total revenue.
198. Holding all other forces constant, if decreasing the price of a good leads to an increase in total revenue, then the
demand for the good must be
a.
unit elastic.
b.
inelastic.
c.
elastic.
d.
None of the above is correct because a price decrease never leads to an increase in total revenue.
199. Holding all other forces constant, if decreasing the price of a good leads to a decrease in total revenue, then the
demand for the good must be
a.
unit elastic.
b.
inelastic.
c.
elastic.
d.
None of the above is correct because a price decrease never leads to an decrease in total revenue.
200. Suppose you are in charge of setting prices at a local ice cream shop. The business needs to increase its total revenue,
and your job is on the line. You evaluate the data and determine that the price elasticity of demand for ice cream at your
shop is 1.8. You should
a.
increase the price of ice cream.
b.
decrease the price of ice cream.
c.
decrease the cost of operating the ice cream shop.
d.
increase the price of bottled water also sold at the ice cream shop because its price elasticity of demand is 1.2.
201. Suppose an airline determines that its customers traveling for business have inelastic demand and its customers
traveling for vacations have an elastic demand. If the airline’s objective is to increase total revenue, it should
a.
increase the price charged to vacationers and decrease the price charged to business travelers.
b.
decrease the price charged to vacationers and increase the price charged to business travelers.
c.
decrease the price to both groups of customers.
d.
increase the price for both groups of customers.
202. Your younger sister needs $50 to buy a new bike. She has opened a lemonade stand to make the money she needs.
Your mother is paying for all of the ingredients. She currently is charging 25 cents per cup, but she wants to adjust her
price to earn the $50 faster. If you know that the demand for lemonade is elastic, what is your advice to her?
a.
Leave the price at 25 cents and be patient.
b.
Raise the price to increase total revenue.
c.
Lower the price to increase total revenue.
d.
There isn’t enough information given to answer this question.
203. Suppose the point (Q = 3,400, P = $20) is the midpoint on a certain downward-sloping, linear demand curve. Then
a.
a decrease in price from $18 to $16 will increase total revenue.
b.
a decrease in price from $24 to $22 will decrease total revenue.
c.
a decrease in the price from $21 to $19 will decrease total revenue.
d.
the maximum value of total revenue is $68,000.
204. Suppose a market has the demand function Qd=20-0.5P. At which of the following prices will total revenue be
maximized?
a.
$10
b.
$20
c.
$30
d.
$40
205. Suppose a market has the demand function Qd=20-0.5P. Between which of the following price ranges is demand
most inelastic?
a.
$0 to $10
b.
$10 to $20
c.
$20 to $30
d.
$30 to $40
Table 5-5
Price
Total
Revenue
$5
$70
$6
$78
$7
$84
$8
$88
$9
$90
$10
$90
206. Refer to Table 5-5. As price rises from $5 to $6, the price elasticity of demand using the midpoint method is
approximately
a.
0.07.
b.
0.18.
c.
0.41.
d.
2.45.
207. Refer to Table 5-5. As price rises from $7 to $8, the price elasticity of demand using the midpoint method is
approximately
a.
0.09.
b.
0.58.
c.
0.65.
d.
1.53.
208. Refer to Table 5-5. Demand is unit elastic when quantity demanded changes from
a.
9 to 8.
b.
10 to 9.
c.
10 to 11.
d.
There is not enough information given to determine the correct answer.
209. Refer to Table 5-5. When price is between $5 and $9, demand is
a.
elastic.
b.
unit elastic.
c.
inelastic.
d.
There is not enough information given to determine whether demand is elastic, unit elastic, or inelastic.
Table 5-6
Price
Total
Revenue
$10
$5,000
$15
$6,000
$20
$6,000
$25
$5,000
$30
$3,000
210. Refer to Table 5-6. As price rises from $10 to $15, the price elasticity of demand using the midpoint method is
approximately
a.
0.40.
b.
0.56.
c.
1.80.
d.
2.50.
211. Refer to Table 5-6. Using the midpoint method, demand is unit elastic when quantity demanded changes from
a.
500 to 400.
b.
400 to 300.
c.
300 to 200.
d.
200 to 100.
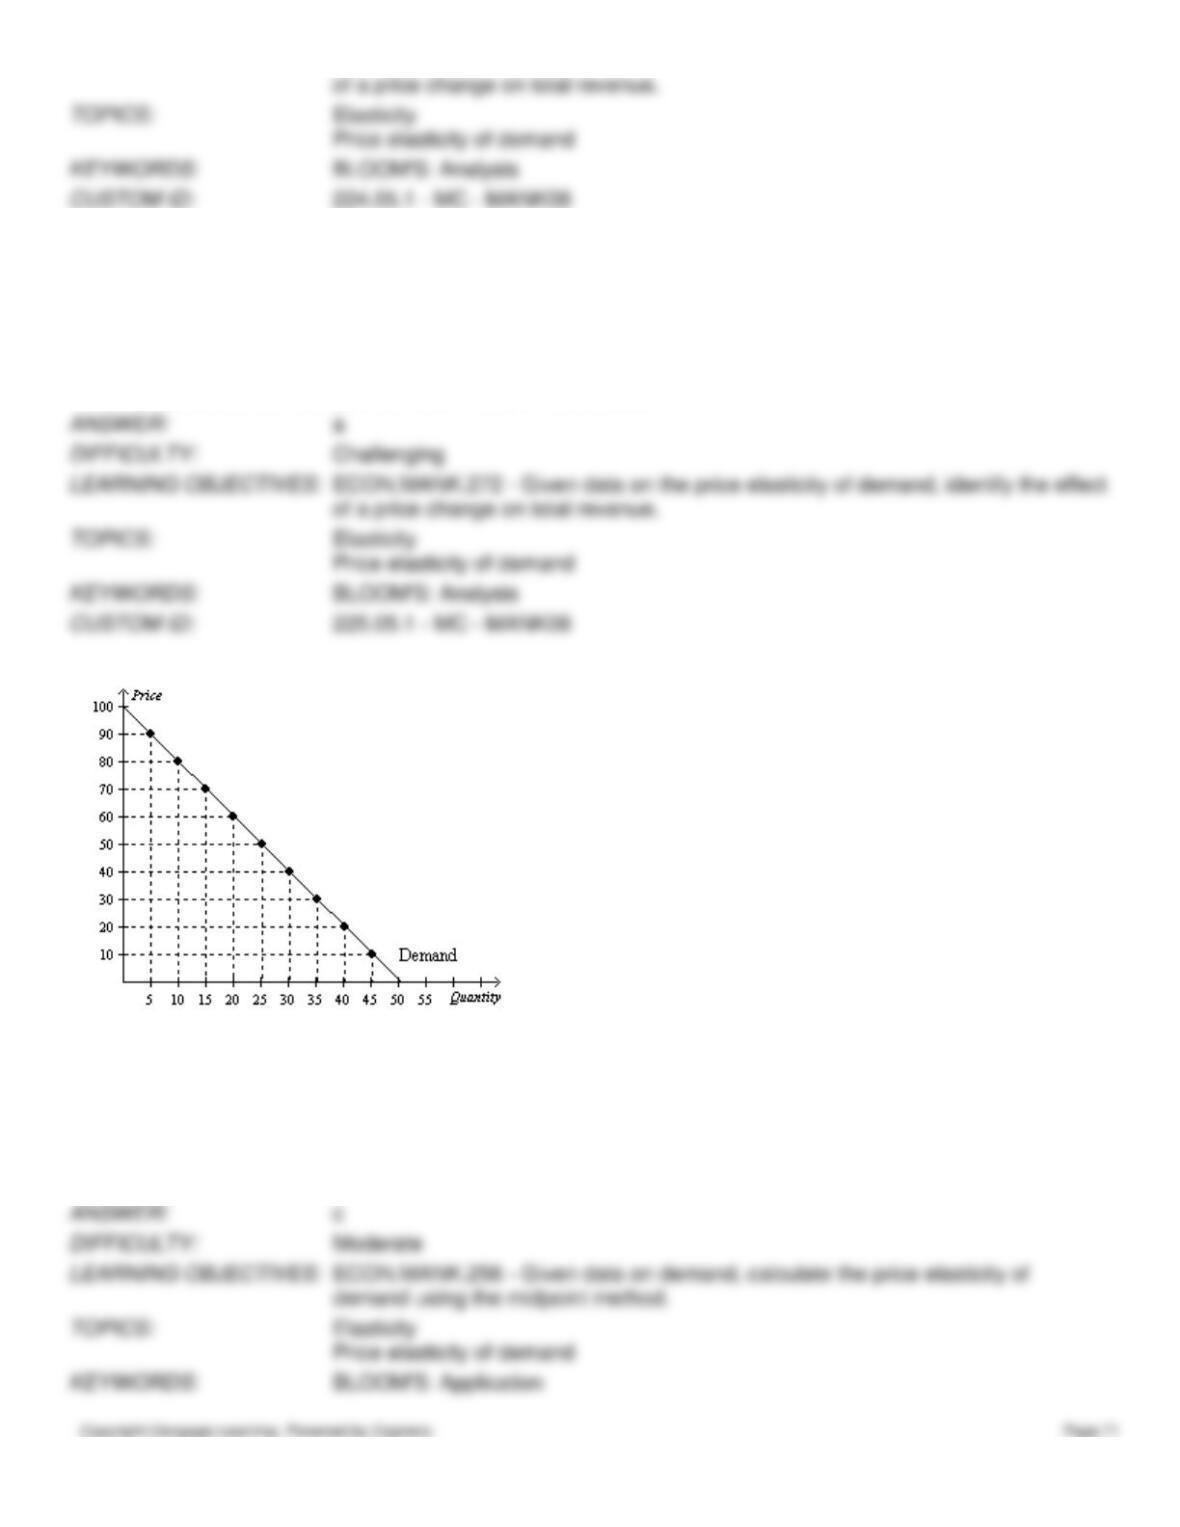
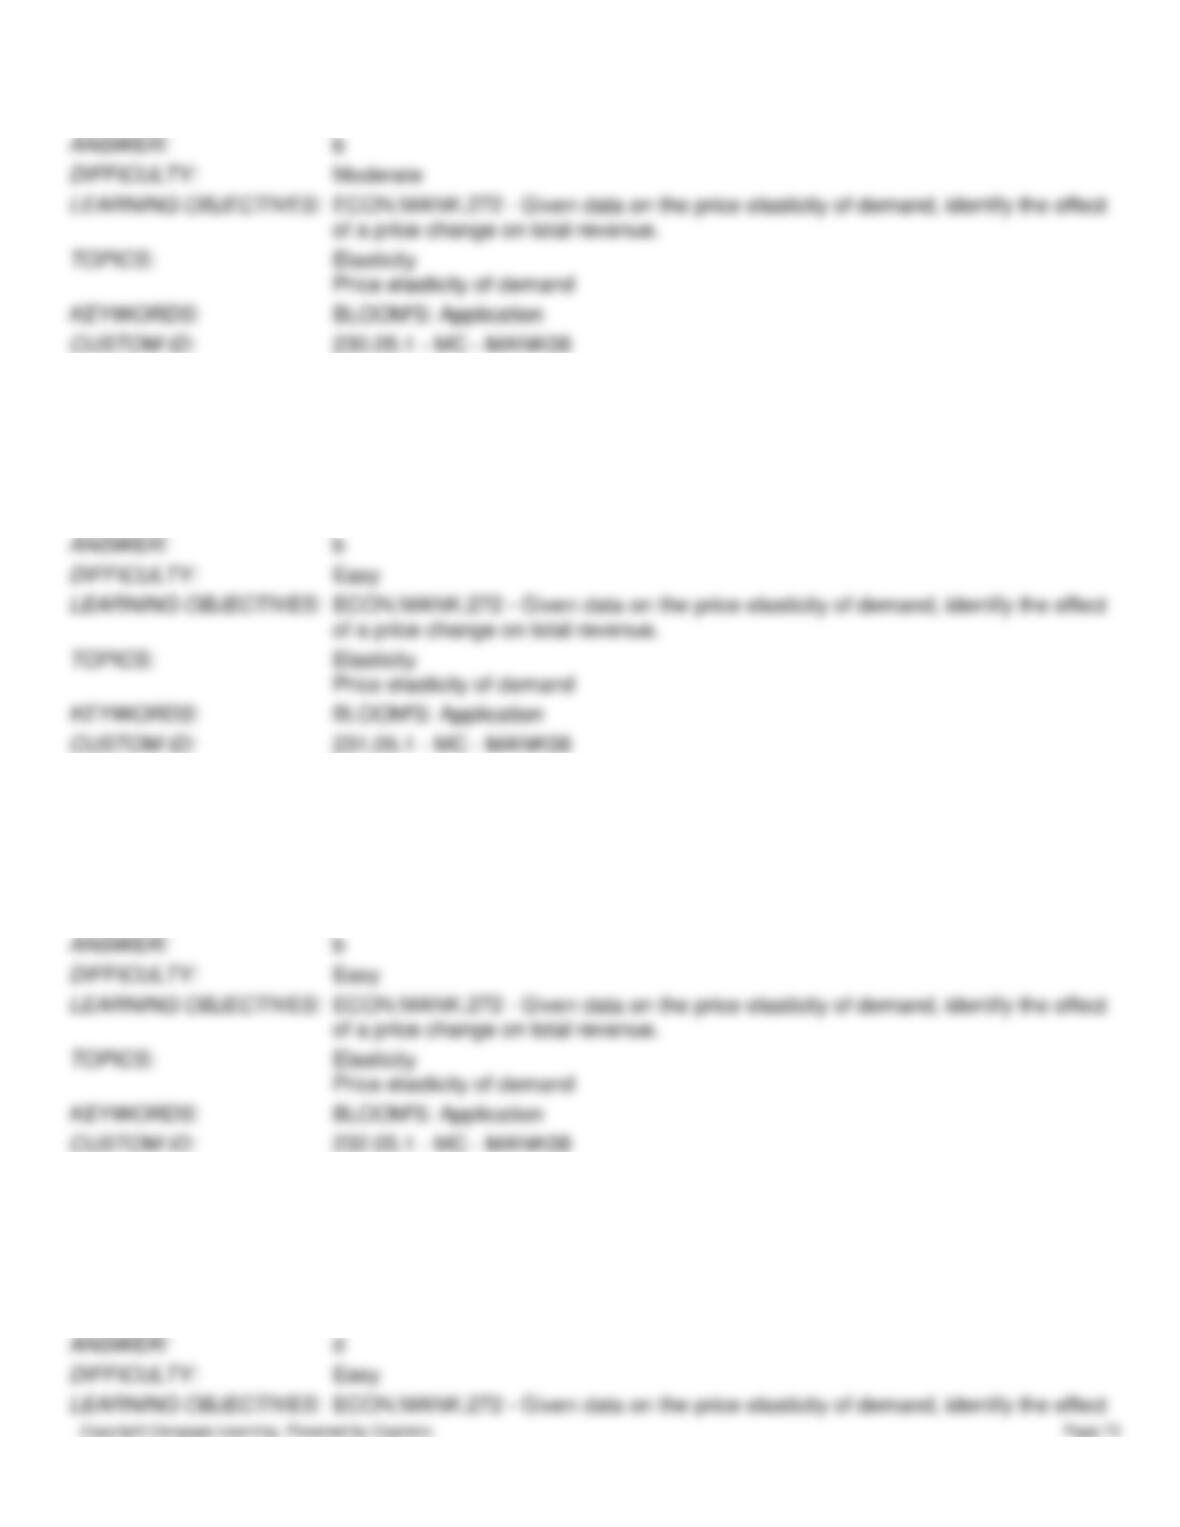
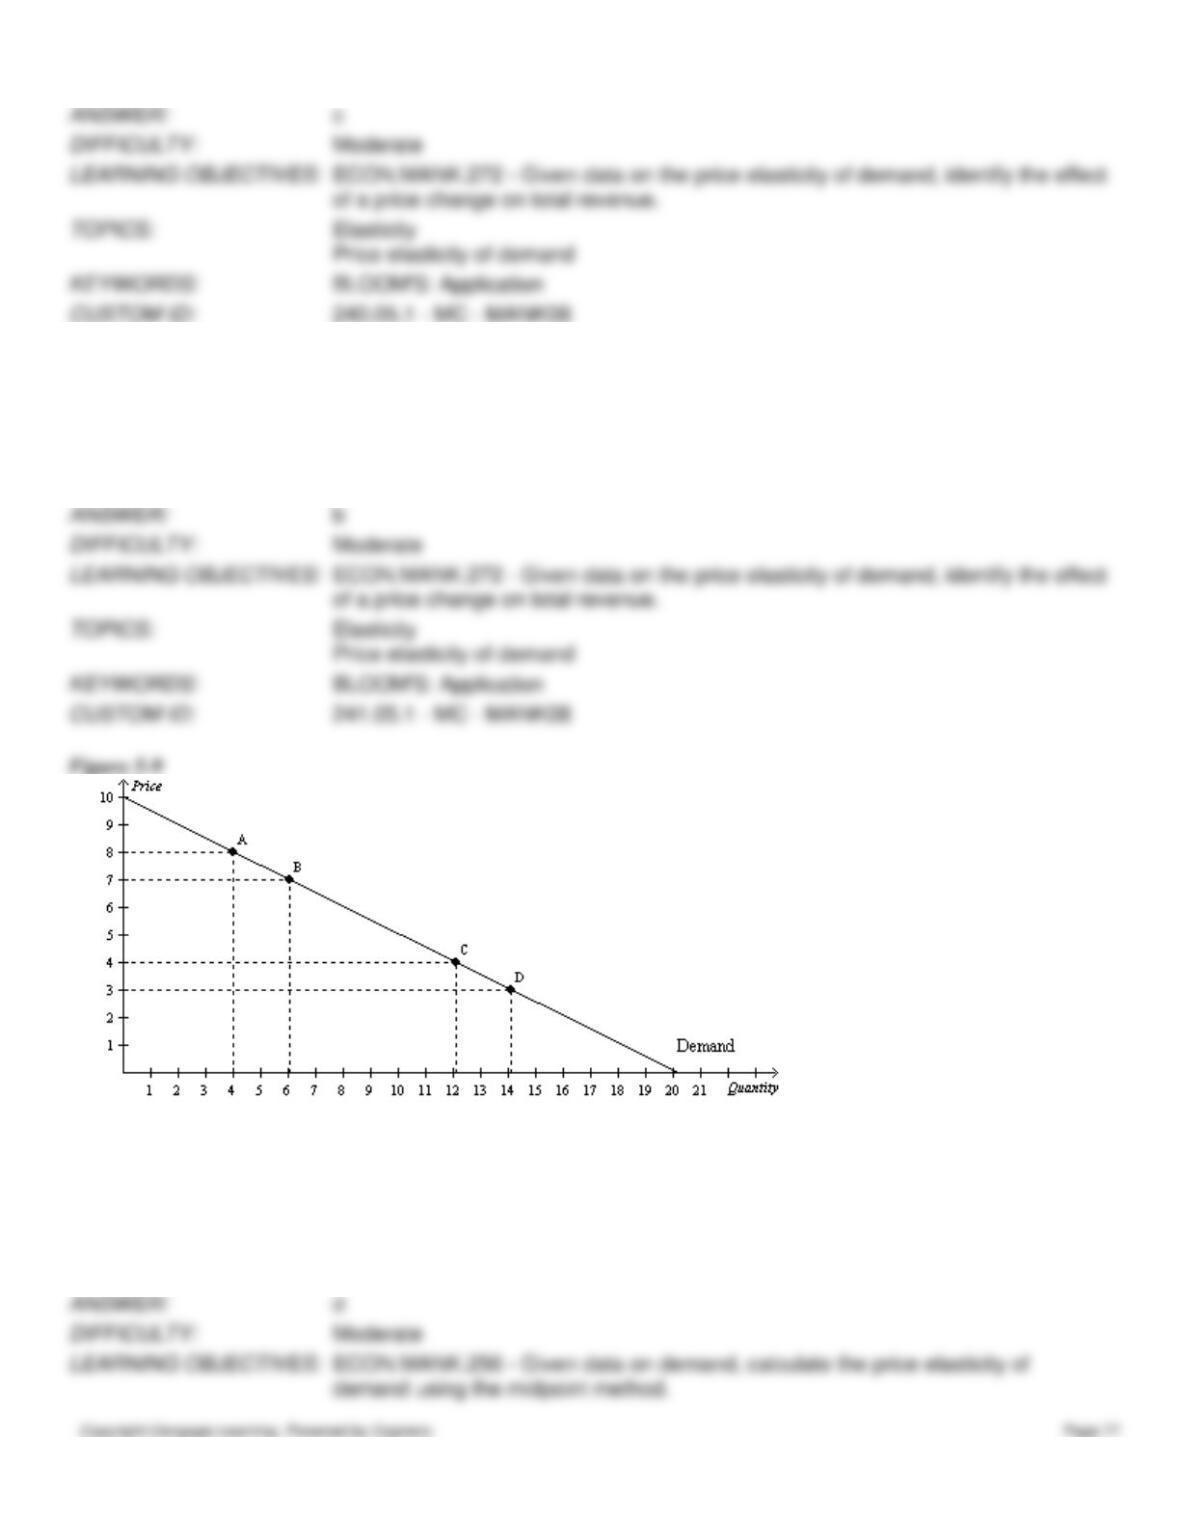
Figure 5-4
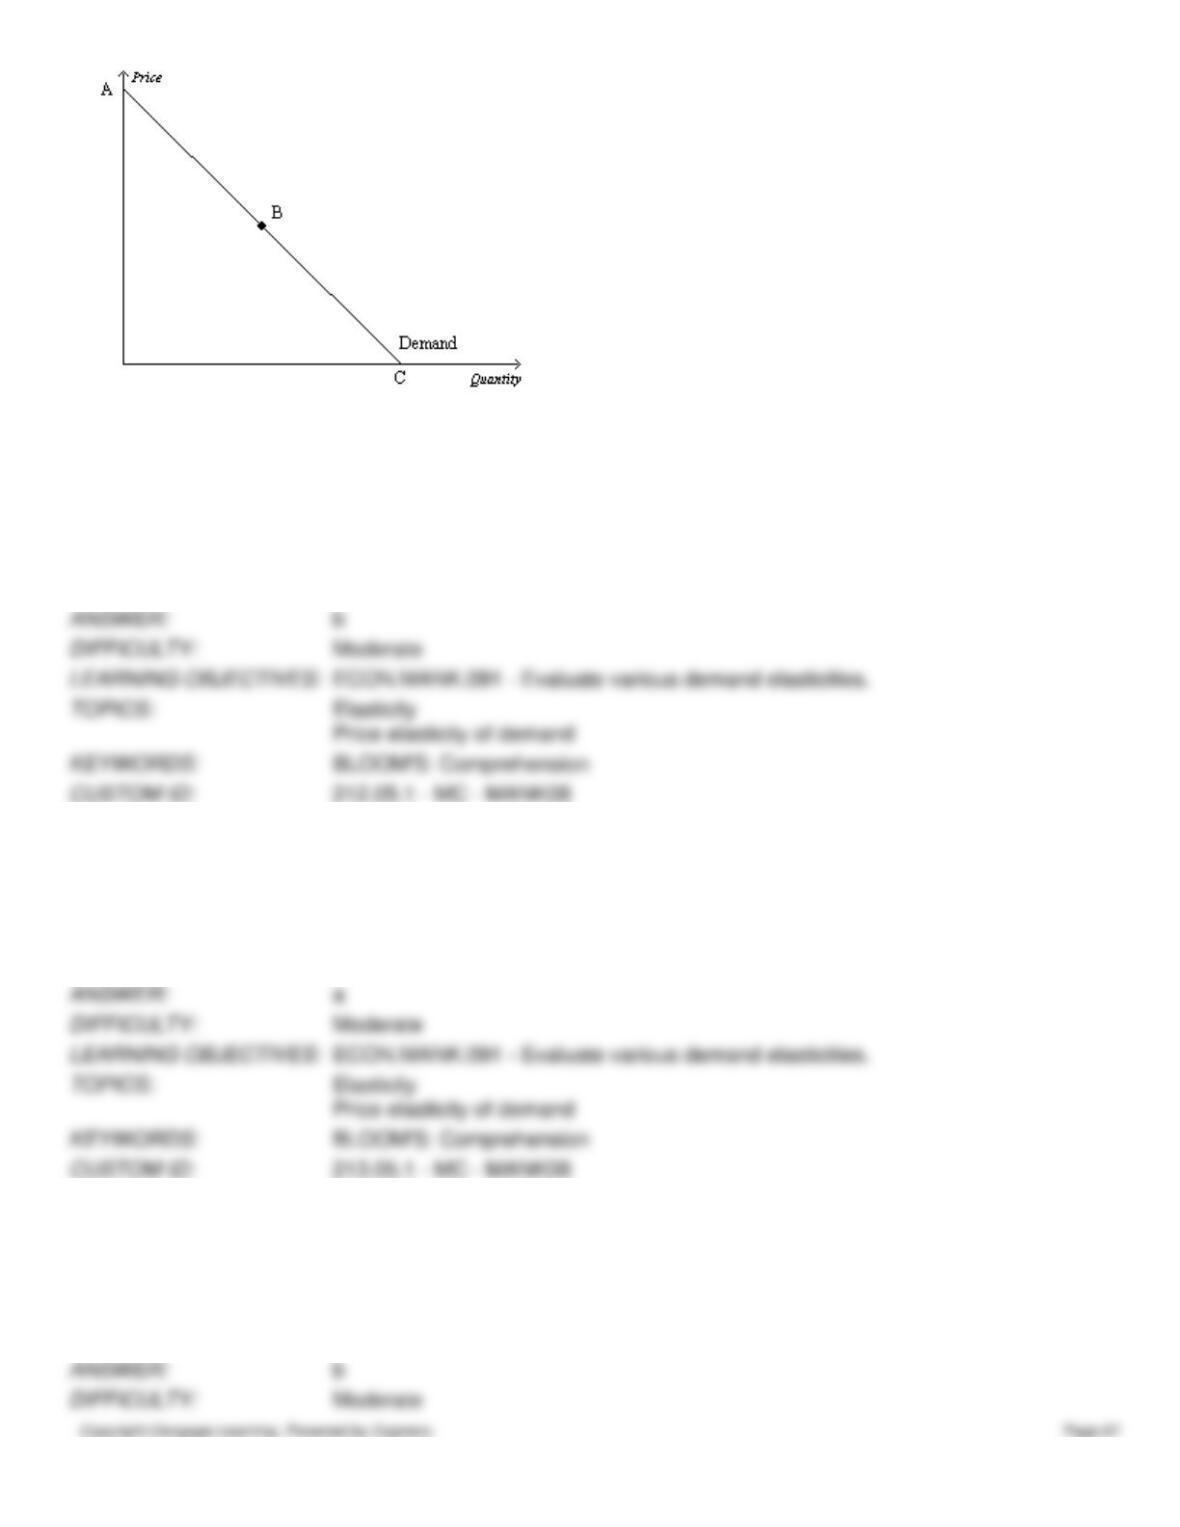
212. Refer to Figure 5-4. Suppose the point labeled B is the “halfway point” on the demand curve and it corresponds to a
price of $5.00. Then, between prices of $4.99 and $5.01, the price elasticity of demand is
a.
less than 1 but greater than zero.
b.
equal to 1.
c.
greater than 1.
d.
equal to zero.
213. Refer to Figure 5-4. The section of the demand curve from A to B represents the
a.
elastic section of the demand curve.
b.
inelastic section of the demand curve.
c.
unit elastic section of the demand curve.
d.
perfectly elastic section of the demand curve.
214. Refer to Figure 5-4. The section of the demand curve from B to C represents the
a.
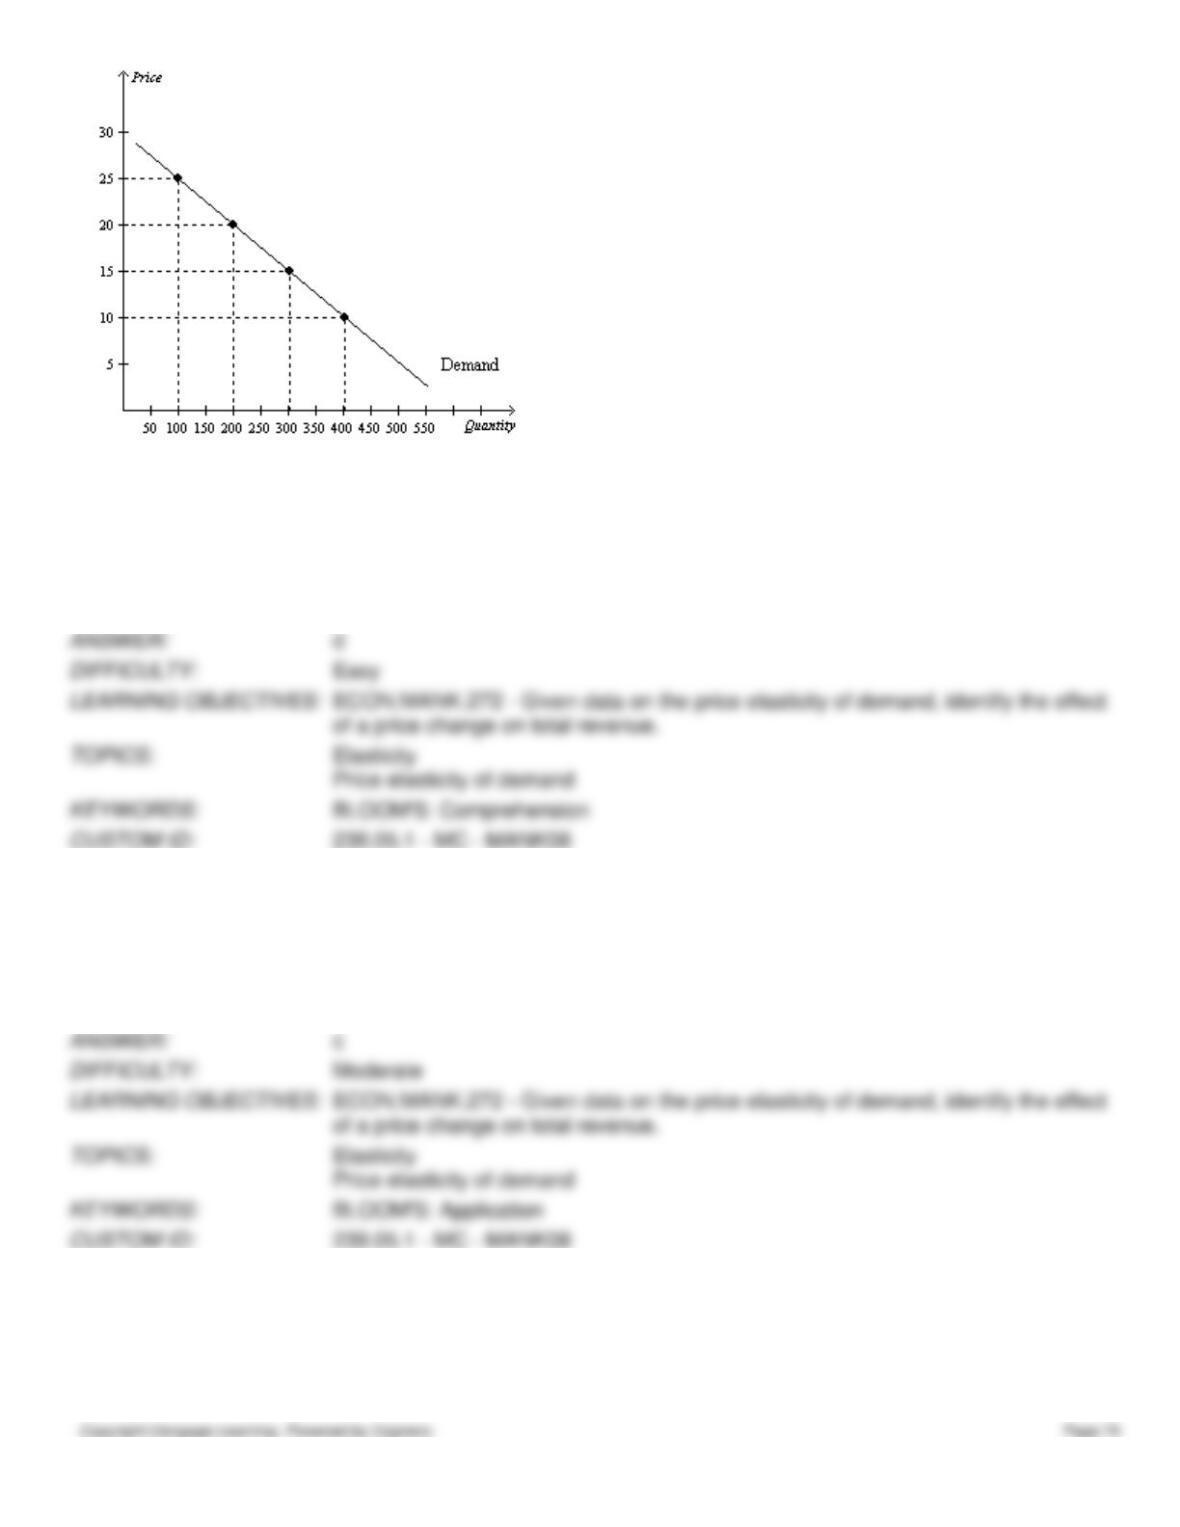
elastic section of the demand curve.
b.
inelastic section of the demand curve.
c.
unit elastic section of the demand curve.
d.
perfectly elastic section of the demand curve.
215. Refer to Figure 5-4. The section of the demand curve at point B represents the
a.
elastic section of the demand curve.
b.
inelastic section of the demand curve.
c.
unit elastic section of the demand curve.
d.
perfectly elastic section of the demand curve.
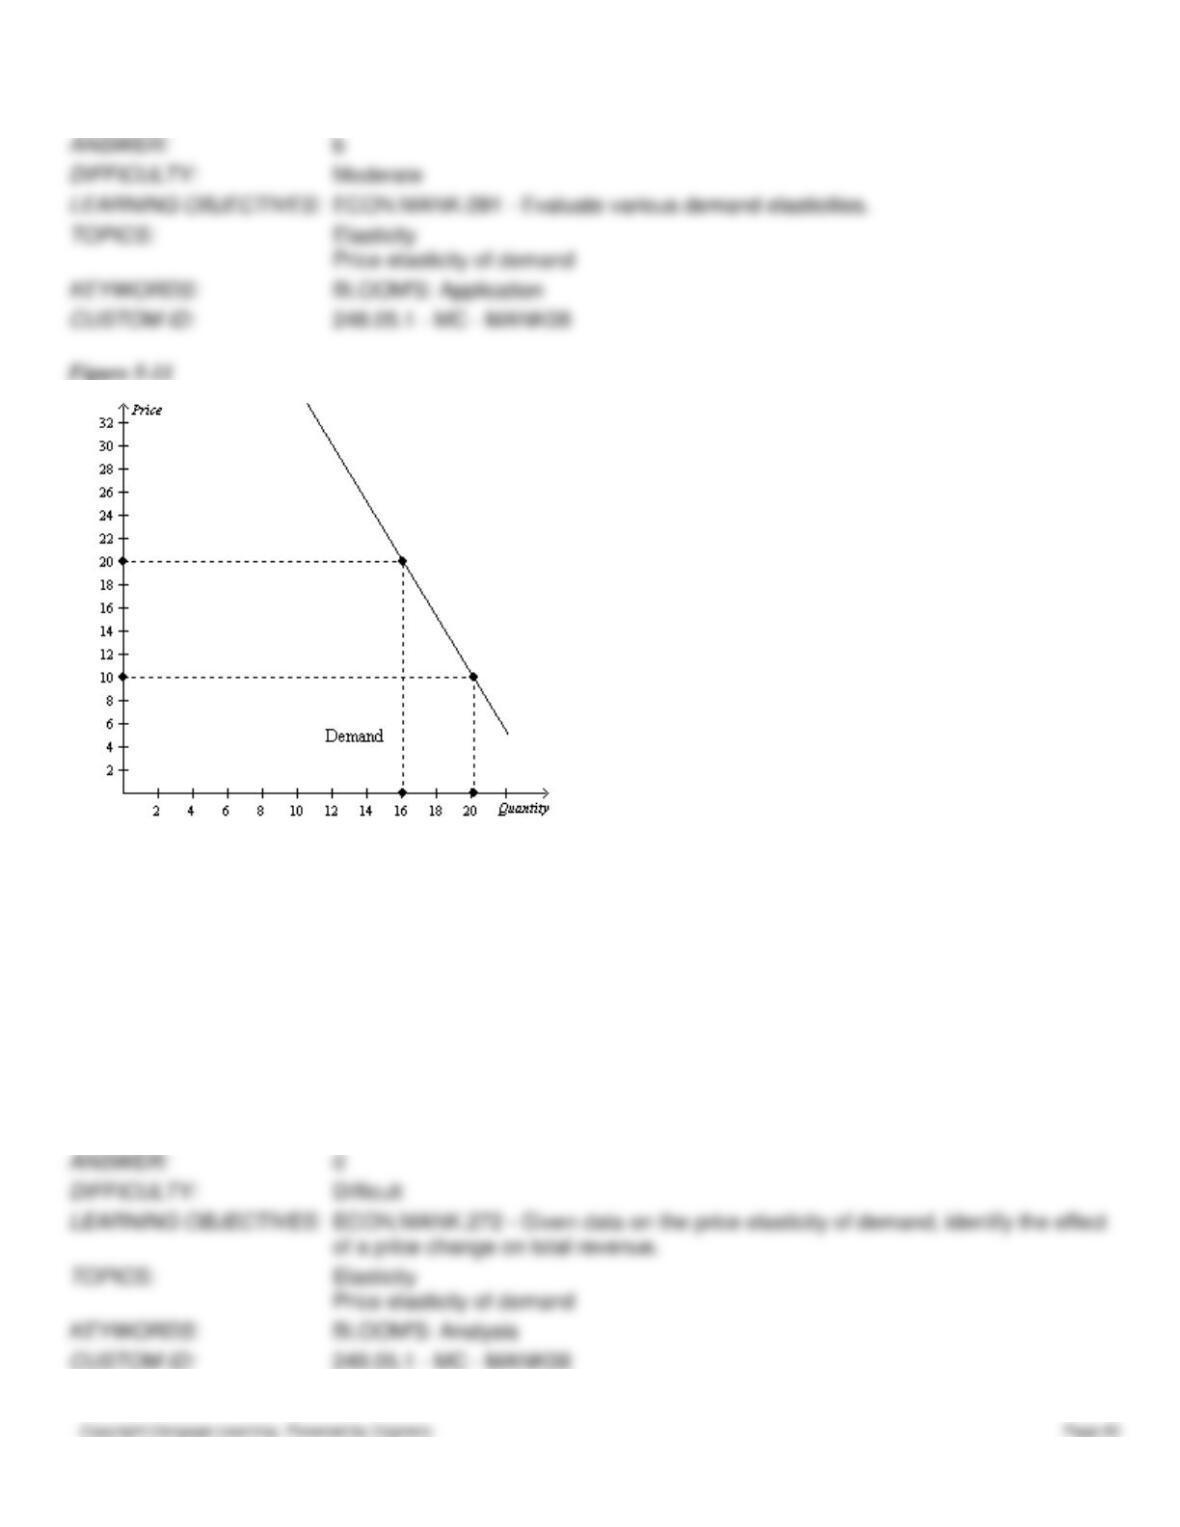
216. Refer to Figure 5-4. Assume the section of the demand curve from A to B corresponds to prices between $8 and
$16. Then, when the price changes between $9 and $10,
a.
quantity demanded changes proportionately less than the price.
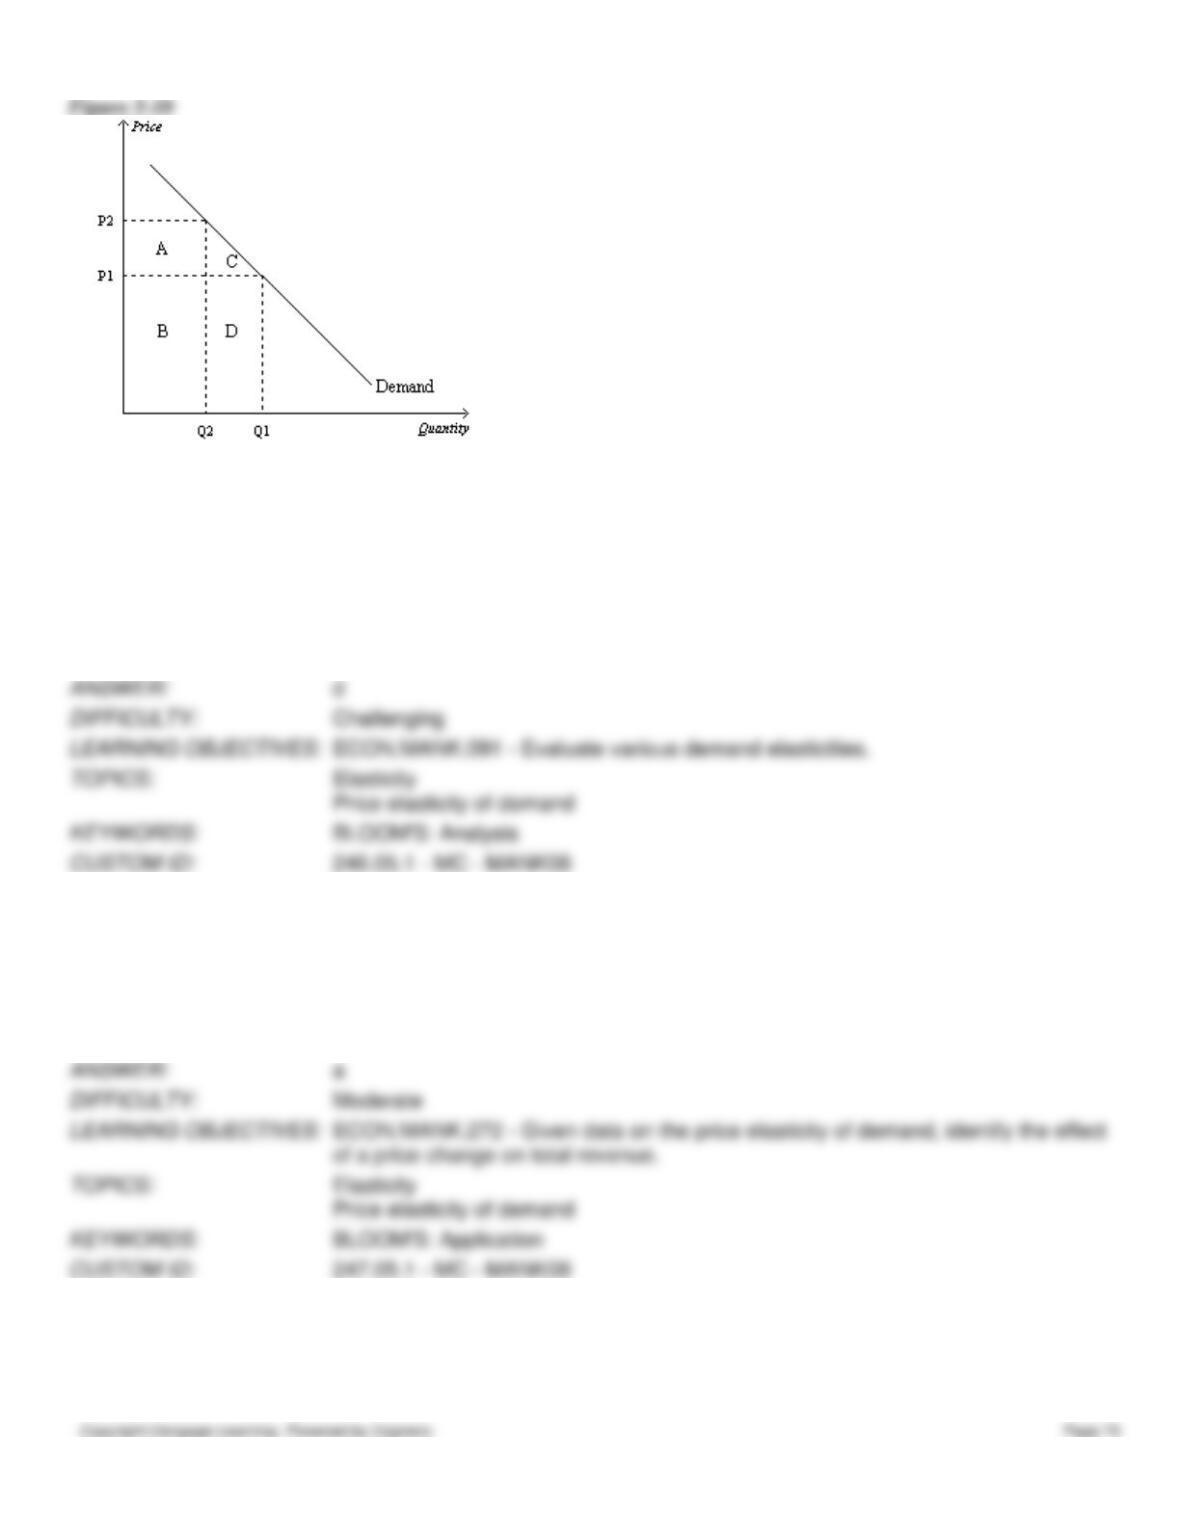
b.
quantity demanded changes proportionately more than the price.
c.
quantity demanded changes the same amount proportionately as price.
d.
the price elasticity of demand equals 1.
217. Refer to Figure 5-4. Assume the section of the demand curve from A to B corresponds to prices between $6 and
$12. Then, when the price increases from $8 to $10,
a.
the percent decrease in the quantity demanded exceeds the percent increase in the price.
b.
the percent increase in the price exceeds the percent decrease in the quantity demanded.
c.
sellers’ total revenue increases as a result.
d.
it is possible that the quantity demanded fell from 550 to 500 as a result.
218. Refer to Figure 5-4. Assume, for the good in question, two specific points on the demand curve are (Q = 1,000, P =
$40) and (Q = 1,500, P = $30). Then which of the following scenarios is possible?
a.
Both of these points lie on the section of the demand curve from B to C.
b.
The vertical intercept of the demand curve is the point (Q = 0, P = $60).
c.
The horizontal intercept of the demand curve is the point (Q = 1,800, P = $0).
d.
Any of these scenarios is possible.
219. Refer to Figure 5-4. The section of the demand curve from B to C represents the
a.
elastic section of the demand curve.
b.
perfectly elastic section of the demand curve.
c.
unit elastic section of the demand curve.
d.
inelastic section of the demand curve.
220. Refer to Figure 5-4. Assume the section of the demand curve from B to C corresponds to prices between $0 and
$15. Then, when the price changes between $7 and $9,
a.
quantity demanded changes proportionately less than the price.
b.
quantity demanded changes proportionately more than the price.
c.
quantity demanded changes the same amount proportionately as price.
d.
the price elasticity of demand equals zero.
221. Refer to Figure 5-4. Assume, for the good in question, two specific points on the demand curve are (Q = 2,000, P =
$15) and (Q = 2,400, P = $12). Then which of the following scenarios is possible?
a.
Both of these points lie on section BC of the demand curve.
b.
The vertical intercept of the demand curve is the point (Q = 0, P = $22).
c.
The horizontal intercept of the demand curve is the point (Q = 5,000, P = $0).
d.
Any of these scenarios is possible.
222. Refer to Figure 5-4. If the price decreases in the region of the demand curve between points A and B, we can expect
total revenue to
a.
increase.
b.
stay the same.
c.
decrease.
d.
first decrease, then increase until total revenue is maximized.
223. Refer to Figure 5-4. If the price increases in the region of the demand curve between points A and B, we can expect
total revenue to
a.
increase.
b.
stay the same.
c.
decrease.
d.
first increase, then decrease until total revenue is maximized.
224. Refer to Figure 5-4. If the price decreases in the region of the demand curve between points B and C, we can expect
total revenue to
a.
increase.
b.
stay the same.
c.
decrease.
d.
first increase, then decrease until total revenue is maximized.
225. Refer to Figure 5-4. If the price increases in the region of the demand curve between points B and C, we can expect
total revenue to
a.
increase.
b.
stay the same.
c.
decrease.
d.
first decrease, then increase until total revenue is maximized.
Figure 5-5
226. Refer to Figure 5-5. Using the midpoint method, demand is unit elastic between prices of
a.
$20 and $40.
b.
$40 and $50.
c.
$40 and $60.
d.
$50 and $70.
227. Refer to Figure 5-5. Using the midpoint method, between prices of $20 and $30, price elasticity of demand is about
a.
0.33.
b.
0.4.
c.
1.33.
d.
3.
228. Refer to Figure 5-5. Using the midpoint method, between prices of $70 and $80, price elasticity of demand is
a.
0.33.
b.
0.4.
c.
1.33.
d.
3.
229. Refer to Figure 5-5. Using the midpoint method, between prices of $50 and $60, price elasticity of demand is about
a.
0.22.
b.
0.82.
c.
1.22.
d.
2.
230. Refer to Figure 5-5. The maximum value of total revenue corresponds to a price of
a.
$20.
b.
$50.
c.
$70.
d.
$100.
231. Refer to Figure 5-5. At a price of $70 per unit, sellers’ total revenue equals
a.
$700.
b.
$1050.
c.
$1250.
d.
$1400.
232. Refer to Figure 5-5. At a price of $10 per unit, sellers’ total revenue equals
a.
$100.
b.
$450.
c.
$500.
d.
$1250.
233. Refer to Figure 5-5. At a price of $50 per unit, sellers’ total revenue equals
a.
$500.
b.
$750.
c.
$1000.
d.
$1250.
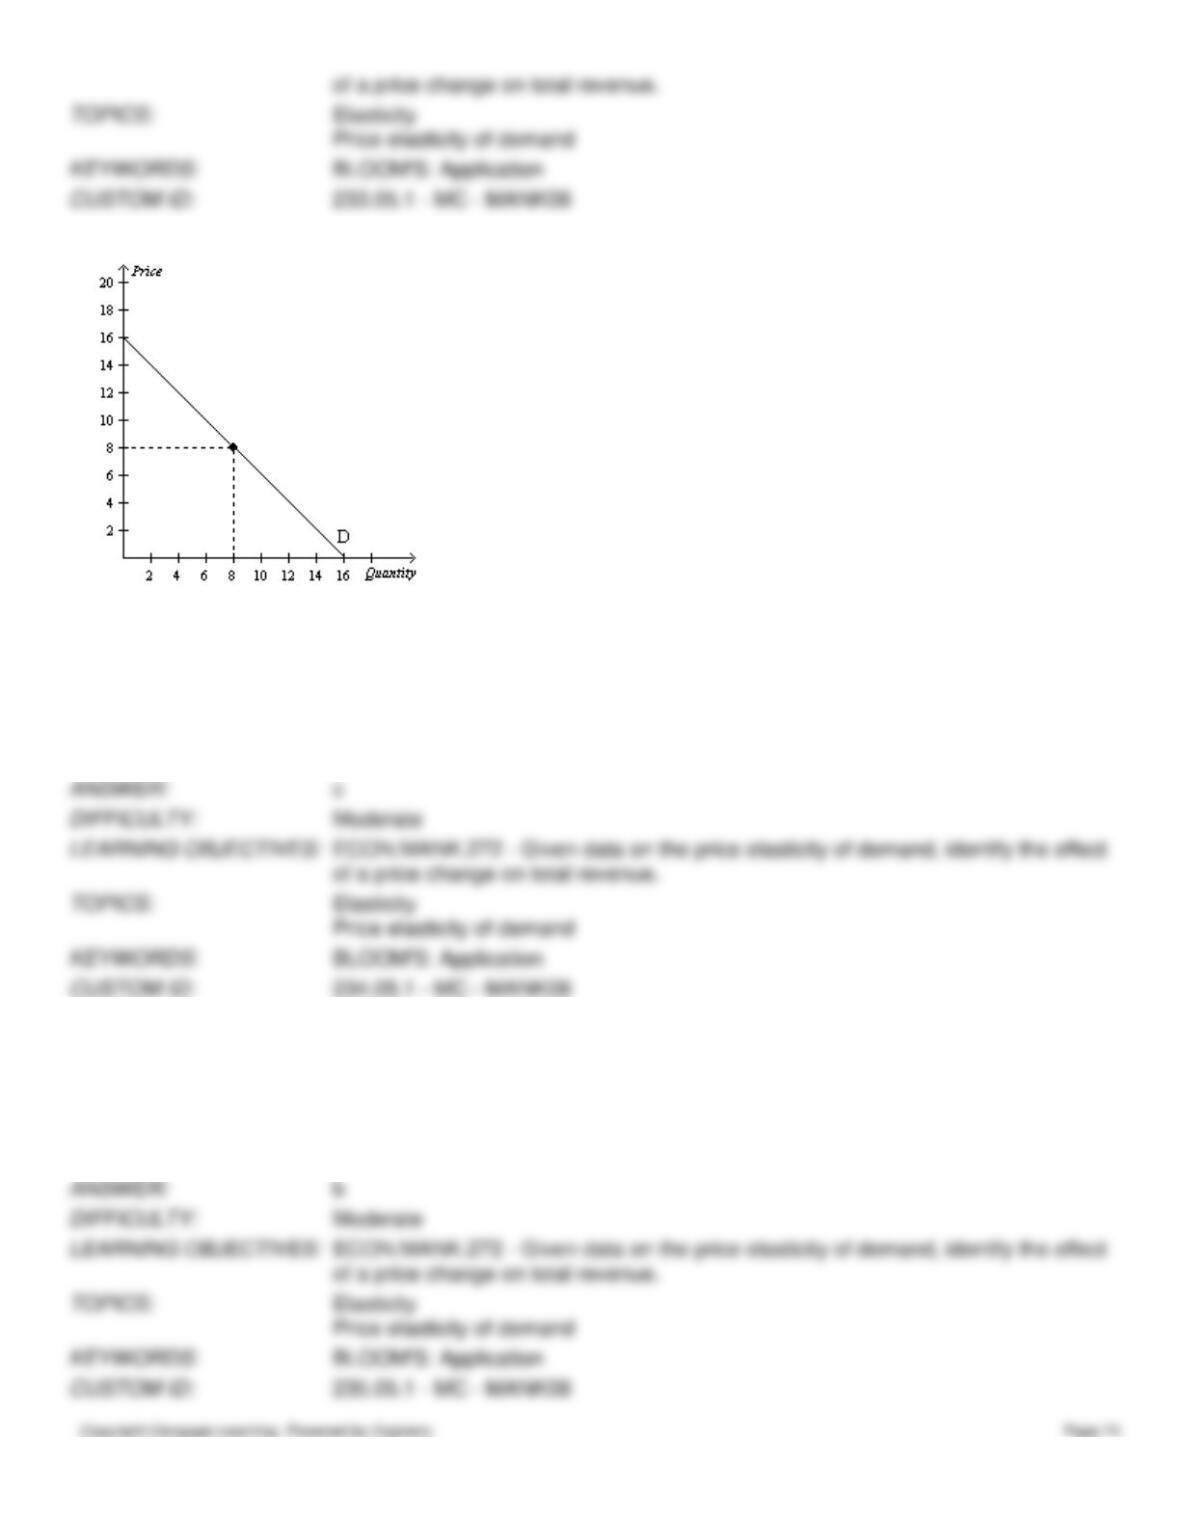
Figure 5-6
234. Refer to Figure 5-6. For prices above $8, demand is price
a.
elastic, and total revenue will rise as price rises.
b.
inelastic, and total revenue will rise as price rises.
c.
elastic, and total revenue will fall as price rises.
d.
inelastic, and total revenue will fall as price rises.
235. Refer to Figure 5-6. For prices below $8, demand is price
a.
elastic, and total revenue will rise as price rises.
b.
inelastic, and total revenue will rise as price rises.
c.
elastic, and total revenue will fall as price rises.
d.
inelastic, and total revenue will fall as price rises.
Figure 5-7
236. Refer to Figure 5-7. For prices above $5, demand is price
a.
elastic, and raising price will increase total revenue.
b.
inelastic, and raising price will increase total revenue.
c.
elastic, and lowering price will increase total revenue.
d.
inelastic, and lowering price will increase total revenue.
237. Refer to Figure 5-7. For prices below $5, demand is price
a.
elastic, and raising price will increase total revenue.
b.
inelastic, and raising price will increase total revenue.
c.
elastic, and lowering price will increase total revenue.
d.
inelastic, and lowering price will increase total revenue.
Figure 5-8
238. Refer to Figure 5-8. When the price is $15, total revenue is
a.
$1,500.
b.
$2,500.
c.
$3,500.
d.
$4,500.
239. Refer to Figure 5-8. When price falls from $25 to $20, demand is
a.
inelastic, since total revenue decreases from $4,000 to $2,500.
b.
inelastic, since total revenue increases from $2,500 to $4,000.
c.
elastic, since total revenue increases from $2,500 to $4,000.
d.
unit elastic, since total revenue does not change.
240. Refer to Figure 5-8. An increase in price from $10 to $15 would
a.
increase total revenue by $1,000.
b.
decrease total revenue by $1,000.
c.
increase total revenue by $500.
d.
decrease total revenue by $500.
241. Refer to Figure 5-8. An increase in price from $15 to $20 would
a.
increase total revenue by $500
b.
decrease total revenue by $500.
c.
increase total revenue by $1,000.
d.
decrease total revenue by $1,000.
242. Refer to Figure 5-9. Using the midpoint method, the price elasticity of demand between point A and point B is
a.
0.33.
b.
0.5.
c.
2.0.
d.
3.0.
243. Refer to Figure 5-9. Using the midpoint method, the price elasticity of demand between point C and point D is
about
a.
0.29.
b.
0.54.
c.
1.86.
d.
2.0.
244. Refer to Figure 5-9. If the price falls from point A to point B, total revenue
a.
increases, and demand is price elastic.
b.
decreases, and demand is price elastic.
c.
increases, and demand is price inelastic.
d.
decreases, and demand is price inelastic.
245. Refer to Figure 5-9. If the price rises from point D to point C, total revenue
a.
increases, and demand is price elastic.
b.
decreases, and demand is price elastic.
c.
increases, and demand is price inelastic.
d.
decreases, and demand is price inelastic.
246. Refer to Figure 5-10. If rectangle D is larger than rectangle A, then
a.
demand is elastic between prices P1 and P2.
b.
a decrease in price from P2 to P1 will cause an increase in total revenue.
c.
the magnitude of the percent change in price between P1 and P2 is smaller than the magnitude of the
corresponding percent change in quantity demanded.
d.
All of the above are correct.
247. Refer to Figure 5-10. Total revenue when the price is P1 is represented by the area(s)
a.
B + D.
b.
A + B.
c.
C + D.
d.
D.
248. Refer to Figure 5-10. Total revenue when the price is P2 is represented by the area(s)
a.
B + D.
b.
A + B.
c.
C + D.
d.
D.
249. Refer to Figure 5-11. Suppose this demand curve is a straight, downward-sloping line all the way from the
horizontal intercept to the vertical intercept. We choose two prices, P1 and P2, and the corresponding quantities
demanded, Q1 and Q2, for the purpose of calculating the price elasticity of demand. Also suppose P2 > P1. In which of the
following cases could we possibly find that (i) demand is elastic and (ii) a decrease in price from P1 to P2 causes an
decrease in total revenue?
a.
0 < P1 < P2 < $10.
b.
$10 < P1 < P2 < $20.
c.
P1 > $20.
d.
None of the above is correct.