Unlock document.
This document is partially blurred.
Unlock all pages and 1 million more documents.
Get Access
1. The quantity demanded of a good is the amount that buyers are
a.
willing to purchase.
b.
willing and able to purchase.
c.
willing, able, and need to purchase.
d.
able to purchase.
2. An increase in quantity demanded
a.
results in a movement downward and to the right along a demand curve.
b.
results in a movement upward and to the left along a demand curve.
c.
shifts the demand curve to the left.
d.
shifts the demand curve to the right.
3. A decrease in quantity demanded
a.
results in a movement downward and to the right along a demand curve.
b.
results in a movement upward and to the left along a demand curve.
c.
shifts the demand curve to the left.
d.
shifts the demand curve to the right.
4. A movement upward and to the left along a demand curve is called a(n)
a.
increase in demand.
b.
decrease in demand.
c.
decrease in quantity demanded.
d.
increase in quantity demanded.
5. A movement downward and to the right along a demand curve is called a(n)
a.
increase in demand.
b.
decrease in demand.
c.
decrease in quantity demanded.
d.
increase in quantity demanded.
6. An increase in the price of a good will
a.
increase demand.
b.
decrease demand.
c.
increase quantity demanded.
d.
decrease quantity demanded.
7. A decrease in the price of a good will
a.
increase demand.
b.
decrease demand.
c.
increase quantity demanded.
d.
decrease quantity demanded.
8. When the price of a good or service changes,
a.
the supply curve shifts in the opposite direction.
b.
the demand curve shifts in the opposite direction.
c.
the demand curve shifts in the same direction.
d.
there is a movement along a given demand curve.
9. A decrease in the price of a good would
a.
increase the supply of the good.
b.
increase the quantity demanded of the good.
c.
give producers an incentive to produce more to keep profits from falling.
d.
shift the supply curve for the good to the left.
CUSTOM ID:
009.04.2 - MC - MANK08
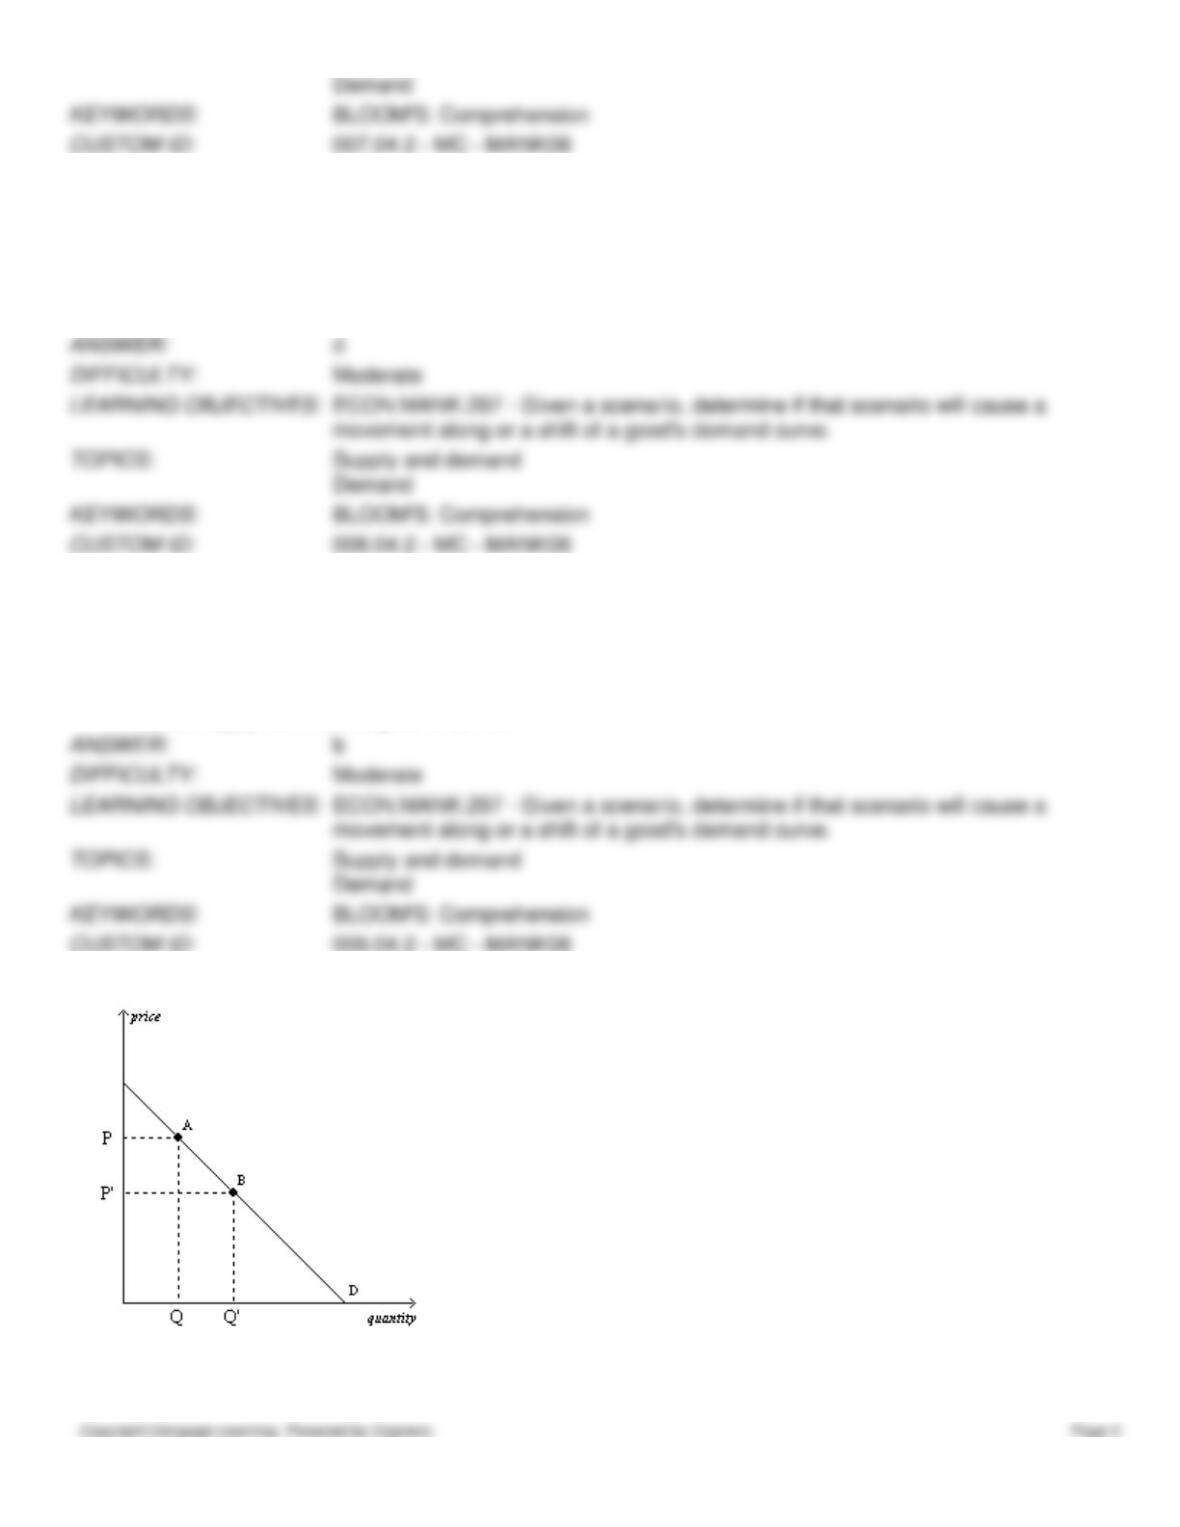
Figure 4-1
10. Refer to Figure 4-1. The movement from point A to point B on the graph shows a(n)
a.
decrease in demand.
b.
increase in demand.
c.
decrease in quantity demanded.
d.
increase in quantity demanded.
11. Refer to Figure 4-1. The movement from point A to point B on the graph is caused by a(n)
a.
increase in price.
b.
decrease in price.
c.
decrease in the price of a substitute good.
d.
increase in income.
12. Refer to Figure 4-1. It is apparent from the figure that the
a.
good is inferior.
b.
demand for the good decreases as income increases.
c.
demand for the good conforms to the law of demand.
d.
All of the above are correct.
13. “Other things equal, when the price of a good rises, the quantity demanded of the good falls, and when the price falls,
the quantity demanded rises.” This relationship between price and quantity demanded
a.
applies to most goods in the economy.
b.
is represented by a downward-sloping demand curve.
c.
is referred to as the law of demand.
d.
All of the above are correct.
14. The law of demand states that, other things equal, when the price of a good
a.
falls, the demand for the good rises.
b.
rises, the quantity demanded of the good rises.
c.
rises, the demand for the good falls.
d.
falls, the quantity demanded of the good rises.
15. The law of demand states that, other things equal, an increase in
a.
price causes quantity demanded to increase.
b.
price causes quantity demanded to decrease.
c.
quantity demanded causes price to increase.
d.
quantity demanded causes price to decrease.
16. Which of these statements best represents the law of demand?
a.
When buyers’ tastes for a good increase, they purchase more of the good.
b.
When income levels increase, buyers purchase more of most goods.
c.
When the price of a good decreases, buyers purchase more of the good.
d.
When buyers’ demands for a good increase, the price of the good increases.
17. A downward-sloping demand curve illustrates
a.
that demand decreases over time.
b.
that prices fall over time.
c.
the relationship between income and quantity demanded.
d.
the law of demand.
18. Kari downloads 7 songs per month when the price is $1.29 per song and 10 songs per month when the price is $0.99
per song. Kari’s behavior demonstrates the law of
a.
price.
b.
supply.
c.
demand.
d.
income.
19. Which of the following demonstrates the law of demand?
a.
After Jon got a raise at work, he bought more pretzels at $1.50 per pretzel than he did before his raise.
b.
Melissa buys fewer muffins at $0.75 per muffin than at $1 per muffin, other things equal.
c.
Dave buys more donuts at $0.25 per donut than at $0.50 per donut, other things equal.
d.
Kendra buys fewer Snickers at $0.60 per Snickers after the price of Milky Ways falls to $0.50 per Milky Way.
20. The following table contains a demand schedule for a good.
Price
Quantity Demanded
$10
100
$20
Q1
If the law of demand applies to this good, then Q1 could be
a.
0.
b.
100.
c.
200.
d.
400.
21. The following table contains a demand schedule for a good.
Price
Quantity Demanded
$30
A
$50
300
If the law of demand applies to this good, then A could be
a.
0.
b.
100.
c.
200.
d.
400.
22. The following table contains a monthly demand schedule for large, single-topping, carry-out pizzas.
Price
Quantity Demanded
$15
A
$20
25
If the law of demand applies to these pizzas, then A could be
a.
0.
b.
15.
c.
25.
d.
30.
23. The following table contains a monthly demand schedule for large, single-topping, carry-out pizzas.
Price
Quantity Demanded
$15
A
$20
25
If the law of demand applies to these pizzas, then A could be
a.
40.
b.
35.
c.
30.
d.
All of the above could be correct.
24. Suppose that when the price of a 16 oz. to-go cup of gourmet coffee is $4.25, students purchase 750 cups per day. If
the price decreases to $3.75 per cup, which of the following is the most likely outcome?
a.
Students would purchase fewer than 750 cups per day.
b.
Student would continue to purchase 750 cups per day.
c.
Students would purchase more than 750 cups per day.
d.
We do not have enough information to answer this question.
25. If the price of ice cream rose to $30 per gallon, consumers would purchase fewer gallons of ice cream than if the price
were $4 per gallon. If the price of chocolate sauce fell to $0.50 per can, consumers would purchase more chocolate sauce
than if the price were $5 per can. These relationships illustrate the
a.
law of supply.
b.
law of demand.
c.
difference between normal and inferior goods.
d.
difference between substitute and complement goods.
26. A table that shows the relationship between the price of a good and the quantity demanded of that good is called a
a.
price-quantity schedule.
b.
buyer schedule.
c.
demand schedule.
d.
demand curve.
27. A demand schedule is a table that shows the relationship between
a.
quantity demanded and quantity supplied.
b.
income and quantity demanded.
c.
price and quantity demanded.
d.
price and income.
28. Which of the following is not held constant in a demand schedule?
a.
income
b.
tastes
c.
price
d.
expectations
29. The demand curve for a good is a line that relates
a.
price and quantity demanded.
b.
income and quantity demanded.
c.
quantity demanded and quantity supplied.
d.
price and income.
30. The line that relates the price of a good and the quantity demanded of that good is called the demand
a.
schedule, and it usually slopes upward.
b.
schedule, and it usually slopes downward.
c.
curve, and it usually slopes upward.
d.
curve, and it usually slopes downward.
31. When drawing a demand curve,
a.
demand is measured along the vertical axis, and price is measured along the horizontal axis.
b.
quantity demanded is measured along the vertical axis, and price is measured along the horizontal axis.
c.
price is measured along the vertical axis, and demand is measured along the horizontal axis.
d.
price is measured along the vertical axis, and quantity demanded is measured along the horizontal axis.
32. When we move along a given demand curve,
a.
only price is held constant.
b.
income and price are held constant.
c.
all nonprice determinants of demand are held constant.
d.
all determinants of quantity demanded are held constant.
33. Once the demand curve for a product or service is drawn, it
a.
remains stable over time.
b.
can shift either rightward or leftward.
c.
is possible to move along the curve, but the curve will not shift.
d.
tends to become steeper over time.
34. If something happens to alter the quantity demanded at any given price, then
a.
the demand curve becomes steeper.
b.
the demand curve becomes flatter.
c.
the demand curve shifts.
d.
we move along the demand curve.
35. When quantity demanded decreases at every possible price, the demand curve has
a.
shifted to the left.
b.
shifted to the right.
c.
not shifted; rather, we have moved along the demand curve to a new point on the same curve.
d.
not shifted; rather, the demand curve has become flatter.
36. When quantity demanded increases at every possible price, the demand curve has
a.
shifted to the left.
b.
shifted to the right.
c.
not shifted; rather, we have moved along the demand curve to a new point on the same curve.
d.
not shifted; rather, the demand curve has become steeper.
37. The market demand curve
a.
is found by vertically adding the individual demand curves.
b.
slopes upward.
c.
represents the sum of the prices that all the buyers are willing to pay for a given quantity of the good.
d.
represents the sum of the quantities demanded by all the buyers at each price of the good.
38. The market demand curve
a.
is the sum of all individual demand curves.
b.
is the demand curve for every product in an industry.
c.
shows the average quantity demanded by individual demanders at each price.
d.
is always flatter than an individual demand curve.
39. To obtain the market demand curve for a product, sum the individual demand curves
a.
vertically.
b.
diagonally.
c.
horizontally.
d.
and then average them.
40. A market demand curve shows
a.
the relationship between price and the number of buyers in a market.
b.
how quantity demanded changes when the number of sellers changes.
c.
the sum of all prices that individual buyers are willing and able to pay for each possible quantity of the good.
d.
how much of a good all buyers are willing and able to buy at each possible price.
41. A market demand curve shows how the total quantity demanded of a good varies as
a.
income varies.
b.
price varies.
c.
price of the nearest substitute good varies.
d.
supply varies.
42. The sum of all the individual demand curves for a product is called
a.
income demand.
b.
equilibrium demand.
c.
complementary demand.
d.
market demand.
43. Which of the following is not an expression for the sum of all the individual demand curves for a product?
a.
total demand
b.
market demand
c.
equilibrium demand
d.
aggregate demand
Table 4-1
Price
Quantity Demanded
by Michelle
Quantity Demanded
by Laura
Quantity Demanded
by Hillary
$5
5
4
11
$4
6
6
13
$3
7
8
15
$2
8
10
17
$1
9
12
19
$0
10
14
21
44. Refer to Table 4-1. If the market consists of Michelle, Laura, and Hillary and the price falls by $1, the quantity
demanded in the market increases by
a.
2 units.
b.
3 units.
c.
4 units.
d.
5 units.
45. Refer to Table 4-1. If the market consists of Michelle and Laura only and the price falls by $1, the quantity demanded
in the market increases by
a.
2 units.
b.
3 units.
c.
4 units.
d.
5 units.
46. Refer to Table 4-1. If the market consists of Michelle and Hillary only and the price falls by $1, the quantity
demanded in the market increases by
a.
2 units.
b.
3 units.
c.
4 units.
d.
5 units.
47. Refer to Table 4-1. If the market consists of Laura and Hillary only and the price falls by $1, the quantity demanded
in the market increases by
a.
2 units.
b.
3 units.
c.
4 units.
d.
5 units.
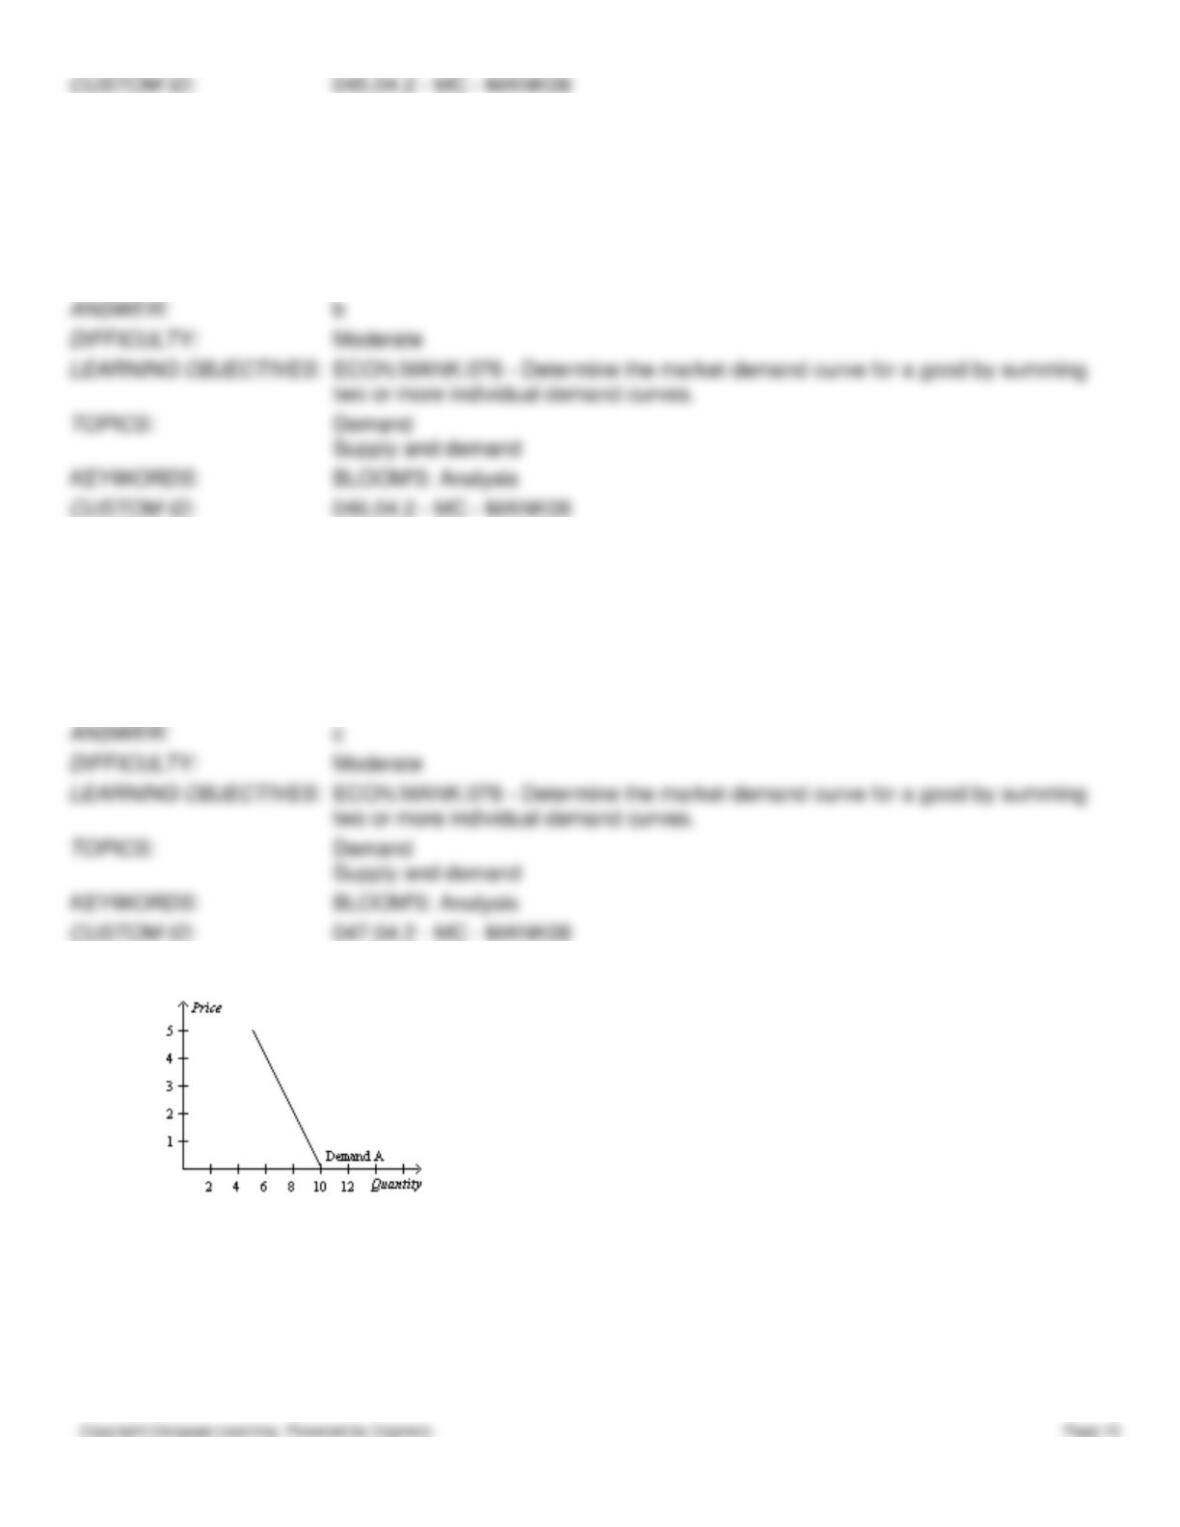
48. Refer to Table 4-1. Which of the following illustrates the market demand curve?
a.
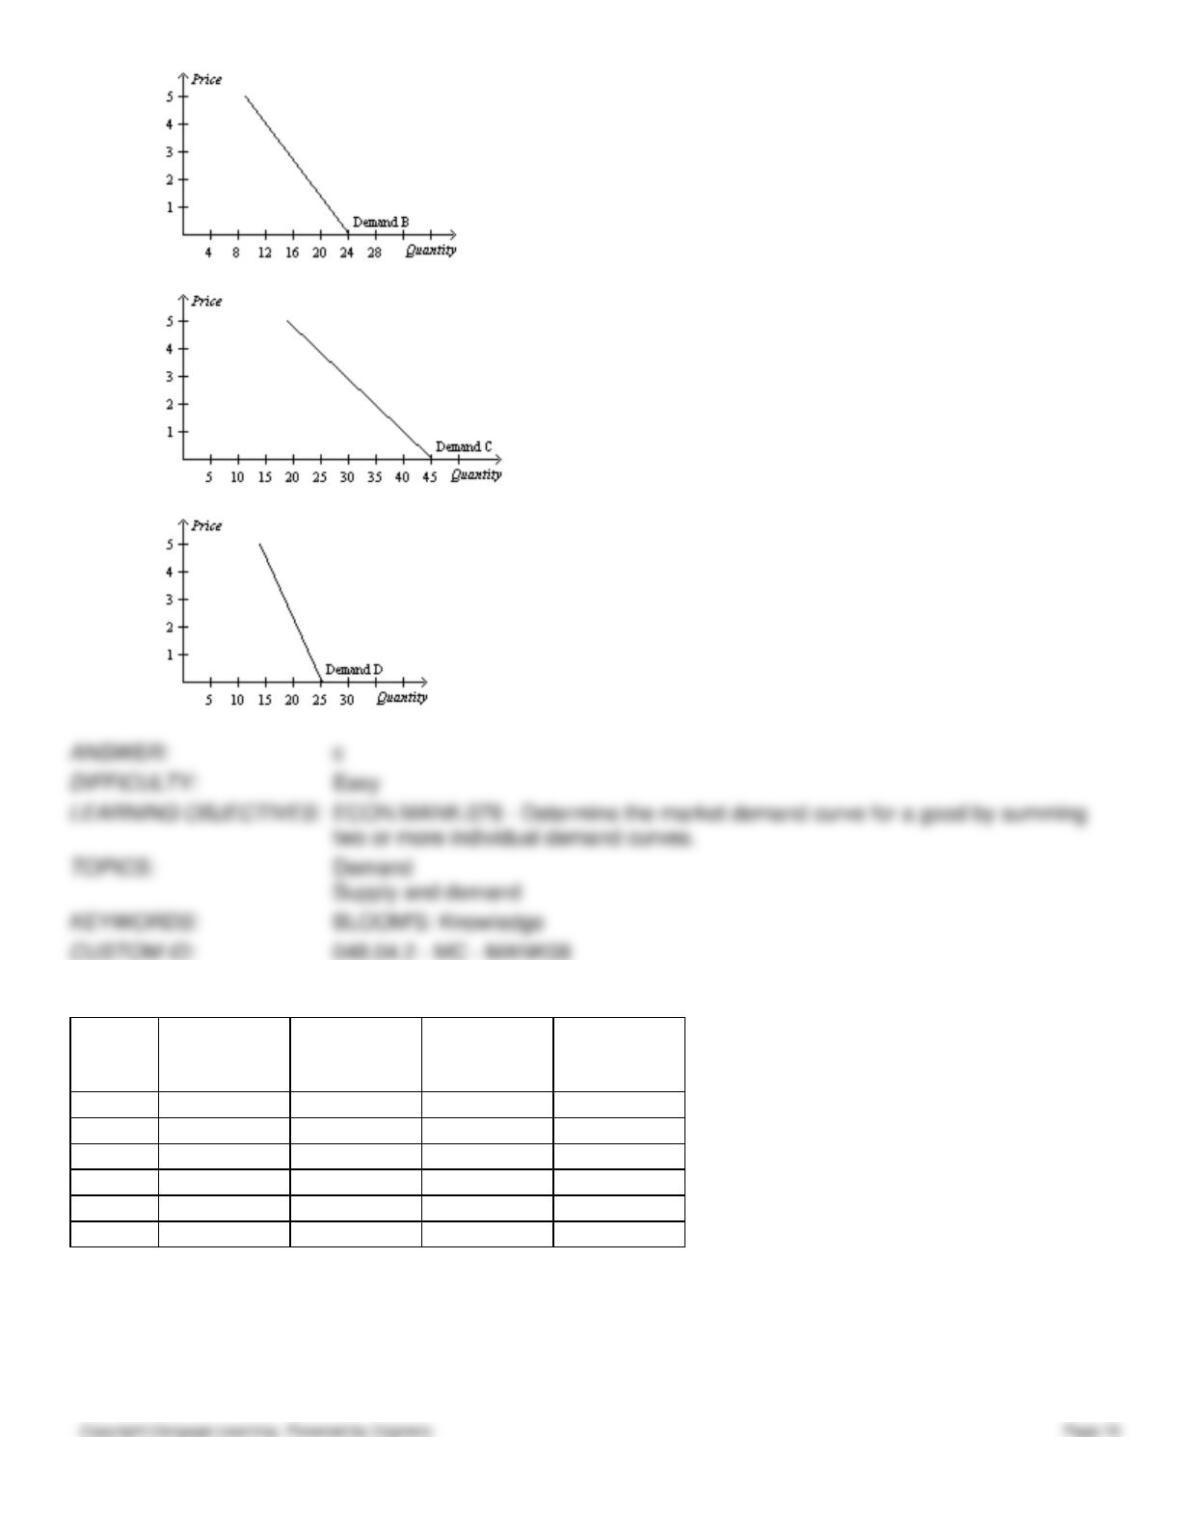
b.
c.
d.
Table 4-2
Price
Abby’s
Quantity
Demanded
Brandi’s
Quantity
Demanded
Carrie’s
Quantity
Demanded
DeeDee’s
Quantity
Demanded
$12
2
1
3
4
$10
4
4
4
5
$8
6
7
5
6
$6
8
8
4
7
$4
10
9
3
8
$2
12
10
2
9
49. Refer to Table 4-2. Whose demand does not obey the law of demand?
a.
Abby’s
b.
Brandi’s
c.
Carrie’s
d.
DeeDee’s
50. Refer to Table 4-2. Suppose Abby, Brandi, Carrie, and DeeDee are the only four buyers in the market. If the price is
$8, then the market quantity demanded is
a.
4 units.
b.
6 units.
c.
24 units.
d.
32 units.
51. Refer to Table 4-2. Suppose Abby, Brandi, Carrie, and DeeDee are the only four buyers in the market. When the
price decreases from $6 to $4, the market quantity demanded
a.
increases by 0.75 units.
b.
increases by 3 units.
c.
increases by 4 units.
d.
decreases by 27 units.
Table 4-3
Price
Bert’s
Quantity
Demanded
Ernie’s
Quantity
Demanded
Grover’s
Quantity
Demanded
Oscar’s
Quantity
Demanded
$0.00
20
16
4
8
$0.50
18
12
6
6
$1.00
14
10
2
5
$1.50
12
8
0
4
$2.00
6
6
0
2
$2.50
0
4
0
0
52. Refer to Table 4-3. Whose demand does not obey the law of demand?
a.
Bert’s
b.
Ernie’s
c.
Grover’s
d.
Oscar’s
53. Refer to Table 4-3. If these are the only four buyers in the market, then the market quantity demanded at a price of $1
is
a.
4 units.
b.
7.75 units.
c.
14 units.
d.
31 units.
54. Refer to Table 4-3. If these are the only four buyers in the market, then the market quantity demanded at a price of $2
is
a.
0 units.
b.
3.5 units.
c.
12 units.
d.
14 units.
55. Refer to Table 4-3. If these are the only four buyers in the market, then when the price increases from $1.00 to $1.50,
the market quantity demanded
a.
decreases by 1.75 units.
b.
increases by 2 units.
c.
decreases by 7 units.
d.
decreases by 24 units.
56. Refer to Table 4-3. For whom is the good a normal good?
a.
Bert only
b.
Grover only
c.
Bert, Ernie, Grover, and Oscar
d.
This cannot be determined from the table.
Table 4-4
Price
Quantity Demanded
by Adam
Quantity Demanded
by Barb
Quantity Demanded
by Carl
$10
10
8
22
$8
12
12
26
$6
14
16
30
$4
16
20
34
$2
18
24
38
$0
20
28
42
57. Refer to Table 4-4. Suppose the market consists of Adam, Barb, and Carl. If the price falls by $2, the quantity
demanded in the market increases by
a.
4 units.
b.
6 units.
c.
8 units.
d.
10 units.
58. Refer to Table 4-4. Suppose the market consists of Barb and Carl only. If the price falls by $2, the quantity demanded
in the market increases by
a.
4 units.
b.
6 units.
c.
8 units.
d.
10 units.
59. Refer to Table 4-4. Suppose the market consists of Adam and Barb only. If the price rises by $2, the quantity
demanded in the market falls by
a.
4 units.
b.
6 units.
c.
8 units.
d.
10 units.
Table 4-5
The table below shows the quantities demanded of cases of Mt. Dew per month by four families at various prices.
Price of Case of
Mr. Dew
The Adams
Family
The Jones Family
The Smith
Family
The Williams
Family
$7
9
15
12
14
$8
8
12
10
10
$9
7
9
8
6
$10
6
6
6
2
60. Refer to Table 4-5. Suppose the four families listed in the table are the only demanders of Mt. Dew in the market. If
the price of a case of Mt. Dew decreases by $1, the
a.
market quantity demanded decreases by 10.
b.
market quantity demanded increases by 10.
c.
Adams family increases its quantity demanded by more than the Smith family.
d.
Jones family increases its quantity demanded by more than the Williams family.


