1. The short-run relationship between inflation and unemployment is often called
a.
the Classical Dichotomy.
b.
Money Neutrality.
c.
the Phillips curve.
d.
None of the above is correct.
2. Economist A.W. Phillips found a negative correlation between
a.
output and unemployment.
b.
unemployment and the interest rate.
c.
output and the interest rate.
d.
wage inflation and unemployment.
3. The economist A.W. Phillips published a famous article in 1958 in which he showed a
a.
negative correlation between the rate of unemployment and the rate of inflation.
b.
positive correlation between the rate of unemployment and the rate of inflation.
c.
negative correlation between the rate of unemployment and the rate of interest.
d.
positive correlation between the rate of unemployment and the rate of interest
4. A.W. Phillips found a
a.
positive relation between unemployment and inflation in the United Kingdom.
b.
positive relation between unemployment and inflation in the United States.
c.
negative relation between unemployment and inflation in the United States.

d.
negative relation between unemployment and inflation in the United Kingdom.
5. A. W. Phillips’ findings were based on data
a.
from 1861-1957 for the United Kingdom.
b.
from 1861-1957 for the United States.
c.
mostly from the post-World War II period in the United Kingdom.
d.
mostly from the post-World War II period in the United States.
6. In his famous article published in an economics journal in 1958, A.W. Phillips
a.
used data for the United States to show a negative relationship between the rate of change of the U.S.
consumer price index and the U.S. unemployment rate.
b.
used data for the United States to show a negative relationship between the rate of change of wages in the U.S.
and the U.S. unemployment rate.
c.
used data for the United Kingdom to show a negative relationship between the rate of change of the U.K.
consumer price index and the U.K. unemployment rate.
d.
used data for the United Kingdom to show a negative relationship between the rate of change of wages in the
U.K. and the U.K. unemployment rate.
7. A.W. Phillips’s discovery of a particular relationship between unemployment and inflation for the United Kingdom
a.
could not be extended to other countries, despite many researchers’ attempts to provide that extension.
b.
was quickly extended to other countries by researchers.
c.
was extended to only one other country — the United States.
d.
was harshly criticized by the American economists Paul Samuelson and Robert Solow on the grounds that
Phillips’s study was fundamentally flawed.
8. Samuelson and Solow argued that when unemployment is high, there is
a.
upward pressure on wages and prices.
b.
upward pressure on wages and downward pressure on prices.
c.
upward pressure on prices and downward pressure on wages.
d.
downward pressure on wages and prices.
9. Samuelson and Solow reasoned that when aggregate demand was high, unemployment was
a.
low, so there was upward pressure on wages and prices.
b.
low, so there was downward pressure on wages and prices.
c.
high, so there was upward pressure on wages and prices.
d.
high, so there was downward pressure on wages and prices.
10. Samuelson and Solow reasoned that when aggregate demand was low, unemployment was
a.
high, so there was upward pressure on wages and prices.
b.
high, so there was downward pressure on wages and prices.
c.
low, so there was upward pressure on wages and prices.
d.
low, so there was downward pressure on wages and prices.
11. Samuelson and Solow believed that the Phillips curve
a.
implied that low unemployment was associated with low inflation.
b.
indicated that the aggregate supply and aggregate demand model was incorrect.
c.
offered policymakers a menu of possible economic outcomes from which to choose.
d.
All of the above are correct.
12. Samuelson and Solow argued that when unemployment is high,
a.
aggregate demand is high, which puts upward pressure on wages and prices.
b.
aggregate demand is high, which puts downward pressure on wages and prices.
c.
aggregate demand is low, which puts upward pressure on wages and prices.
d.
aggregate demand is low, which puts downward pressure on wages and prices.
13. Samuelson and Solow argued that a combination of low unemployment and low inflation
a.
was impossible given the historical data as summarized by the Phillips curve.
b.
could be achieved with an “appropriate” fiscal policy.
c.
could be achieved with an “appropriate” monetary policy.
d.
could be achieved with an “appropriate” mix of monetary and fiscal policies.
14. According to the Phillips curve, policymakers could reduce both inflation and unemployment by
a.
increasing the money supply.
b.
increasing government expenditures.
c.
raising taxes.
d.
None of the above is correct.
15. According to the Phillips curve, policymakers would reduce inflation but raise unemployment if they
a.
decreased the money supply.
b.
increased government expenditures.
c.
decreased taxes.
d.
None of the above is correct.
16. According to the Phillips curve, policymakers can reduce inflation by
a.
contracting aggregate demand. This contraction results in a temporarily higher unemployment rate.
b.
contracting aggregate demand. This contraction results in a temporarily lower unemployment rate.
c.
expanding aggregate demand. This expansion results in a temporarily lower unemployment rate.
d.
expanding aggregate demand. This expansion results in a temporarily higher unemployment rate.
17. The short-run Phillips curve shows the combinations of
a.
unemployment and inflation that arise in the short run as aggregate demand shifts the economy along the
short-run aggregate supply curve.
b.
unemployment and inflation that arise in the short run as short-run aggregate supply shifts the economy along
the aggregate demand curve.
c.
real GDP and the price level that arise in the short run as short-run aggregate supply shifts the economy along
the aggregate demand curve.
d.
None of the above is correct.
18. When aggregate demand shifts rightward along the short-run aggregate-supply curve, inflation
a.
increases and unemployment increases.
b.
increases and unemployment decreases.
c.
decreases and unemployment increases.
d.
decreases and unemployment decreases.
19. When aggregate demand shifts right along the short-run aggregate supply curve, unemployment
a.
falls, so there are upward pressures on wages and prices.
b.
falls, so there are downward pressures on wages and prices.
c.
rises, so there are upward pressures on wages and prices.
d.
rises, so there are downward pressures on wages and prices.
20. There is a
a.
short-run tradeoff between inflation and unemployment.
b.
short-run tradeoff between the actual unemployment rate and the natural rate of unemployment.
c.
long-run tradeoff between inflation and unemployment.
d.
long-run tradeoff between the actual unemployment rate and the natural rate of unemployment.
21. In the short run, policy that changes aggregate demand changes
a.
both unemployment and the price level.
b.
neither unemployment nor the price level.
c.
only unemployment.
d.
only the price level.
22. If policymakers decrease aggregate demand, then in the short run the price level
a.
falls and unemployment rises.
b.
and unemployment fall.
c.
and unemployment rise.
d.
rises and unemployment falls.
23. If policymakers increase aggregate demand, then in the short run the price level
a.
falls and unemployment rises.
b.
and unemployment fall.
c.
and unemployment rise.
d.
rises and unemployment falls.
24. Unemployment would decrease and prices would increase if
a.
aggregate demand shifted right.
b.
aggregate demand shifted left.
c.
aggregate supply shifted right.
d.
aggregate supply shifted left.
25. If the government raises government expenditures, then in the short run prices
a.
rise and unemployment falls.
b.
fall and unemployment rises.
c.
and unemployment rise.
d.
and unemployment fall.
26. If the central bank decreases the money supply, then in the short run prices
a.
rise and unemployment falls.
b.
fall and unemployment rises.
c.
and unemployment rise.
d.
and unemployment fall.

27. If the central bank increases the money supply, then in the short run prices
a.
rise and unemployment falls.
b.
fall and unemployment rises.
c.
and unemployment rise.
d.
and unemployment fall.
28. If the central bank increases the money supply, in the short run, output
a.
rises so unemployment rises.
b.
rises so unemployment falls.
c.
falls so unemployment rises.
d.
falls so unemployment falls.
29. If a central bank decreases the money supply, then
a.
prices, output, and unemployment rise.
b.
prices and output rise and unemployment falls.
c.
prices rise and output and unemployment fall.
d.
prices and output fall and unemployment rises.

30. Suppose that the money supply increases. In the short run, this increases prices according to
a.
both the short-run Phillips curve and the aggregate demand and aggregate supply model.
b.
neither the short-run Phillips curve nor the aggregate demand and aggregate supply model.
c.
the short-run Phillips curve, but not according to the aggregate demand and aggregate supply model.
d.
the aggregate demand and aggregate supply model but not according to the short-run Phillips curve.
31. Suppose that the money supply decreases. In the short run, this increases prices according to
a.
both the short-run Phillips curve and the aggregate demand and aggregate supply model.
b.
neither the short-run Phillips curve nor the aggregate demand and aggregate supply model.
c.
the short-run Phillips curve, but not according to the aggregate demand and aggregate supply model.
d.
the aggregate demand and aggregate supply model but not according to the short-run Phillips curve.
32. Suppose that the money supply increases. In the short run this decreases unemployment according to
a.
both the short-run Phillips curve and the aggregate demand and aggregate supply model.
b.
neither the short-run Phillips curve nor the aggregate demand and aggregate supply model.
c.
the short-run Phillips curve, but not according to the aggregate demand and supply model.
d.
the aggregate demand and aggregate supply model, but not according to the short-run Phillips curve.
33. In the long run, policy that changes aggregate demand changes

a.
both unemployment and the price level.
b.
neither unemployment nor the price level.
c.
only unemployment.
d.
only the price level.
34. If policymakers expand aggregate demand, then in the long run
a.
prices will be higher and unemployment will be lower.
b.
prices will be higher and unemployment will be unchanged.
c.
prices and unemployment will be unchanged.
d.
None of the above is correct.
35. If policymakers decrease aggregate demand, then in the long run
a.
prices will be lower and unemployment will be higher.
b.
prices will be lower and unemployment will be unchanged.
c.
prices and unemployment will be unchanged.
d.
None of the above is correct.

36. In 2001, Congress and President Bush instituted tax cuts. According to the short-run Phillips curve, in the short run
this change should have
a.
reduced inflation and unemployment.
b.
raised inflation and unemployment.
c.
reduce inflation and raised unemployment.
d.
raised inflation and reduced unemployment.
37. According to the short-run Phillips curve, if the central bank increases the money supply, then
a.
inflation and unemployment will both fall.
b.
inflation and unemployment will both rise.
c.
inflation will fall and unemployment will rise.
d.
inflation will rise and unemployment will fall.
38. The economy will move to a point on the short-run Phillips curve where unemployment is higher if
a.
the inflation rate decreases.
b.
the government increases its expenditures.
c.
the Fed increases the money supply.
d.
None of the above is correct.
39. If the short-run Phillips curve were stable, which of the following would be unusual?
a.
an increase in government spending and a fall in unemployment
b.
an increase in inflation and a decrease in output
c.
a decrease in the inflation rate and a rise in the unemployment rate
d.
a decrease in the money supply and a rise in the unemployment rate.
40. Which of the following would we not expect if government policy moved the economy up along a given short-run
Phillips curve?
a.
Teresa reads in the newspaper that the central bank recently raised the money supply.
b.
Jackie gets fewer job offers.
c.
Miguel makes larger increases in the prices at his health food store.
d.
Julie’s nominal wage increase is larger.
41. The government of Blenova considers two policies. Policy A would shift AD right by 500 units while policy B would
shift AD right by 300 units. According to the short-run Phillips curve, policy A will lead
a.
to a lower unemployment rate and a lower inflation rate than policy B.
b.
to a lower unemployment rate and a higher inflation rate than policy B.
c.
to a higher unemployment rate and lower inflation rate than policy B.
d.
to a higher unemployment rate and higher inflation rate than policy B.
Figure 35–1. The left-hand graph shows a short-run aggregate-supply (SRAS) curve and two aggregate-demand (AD)
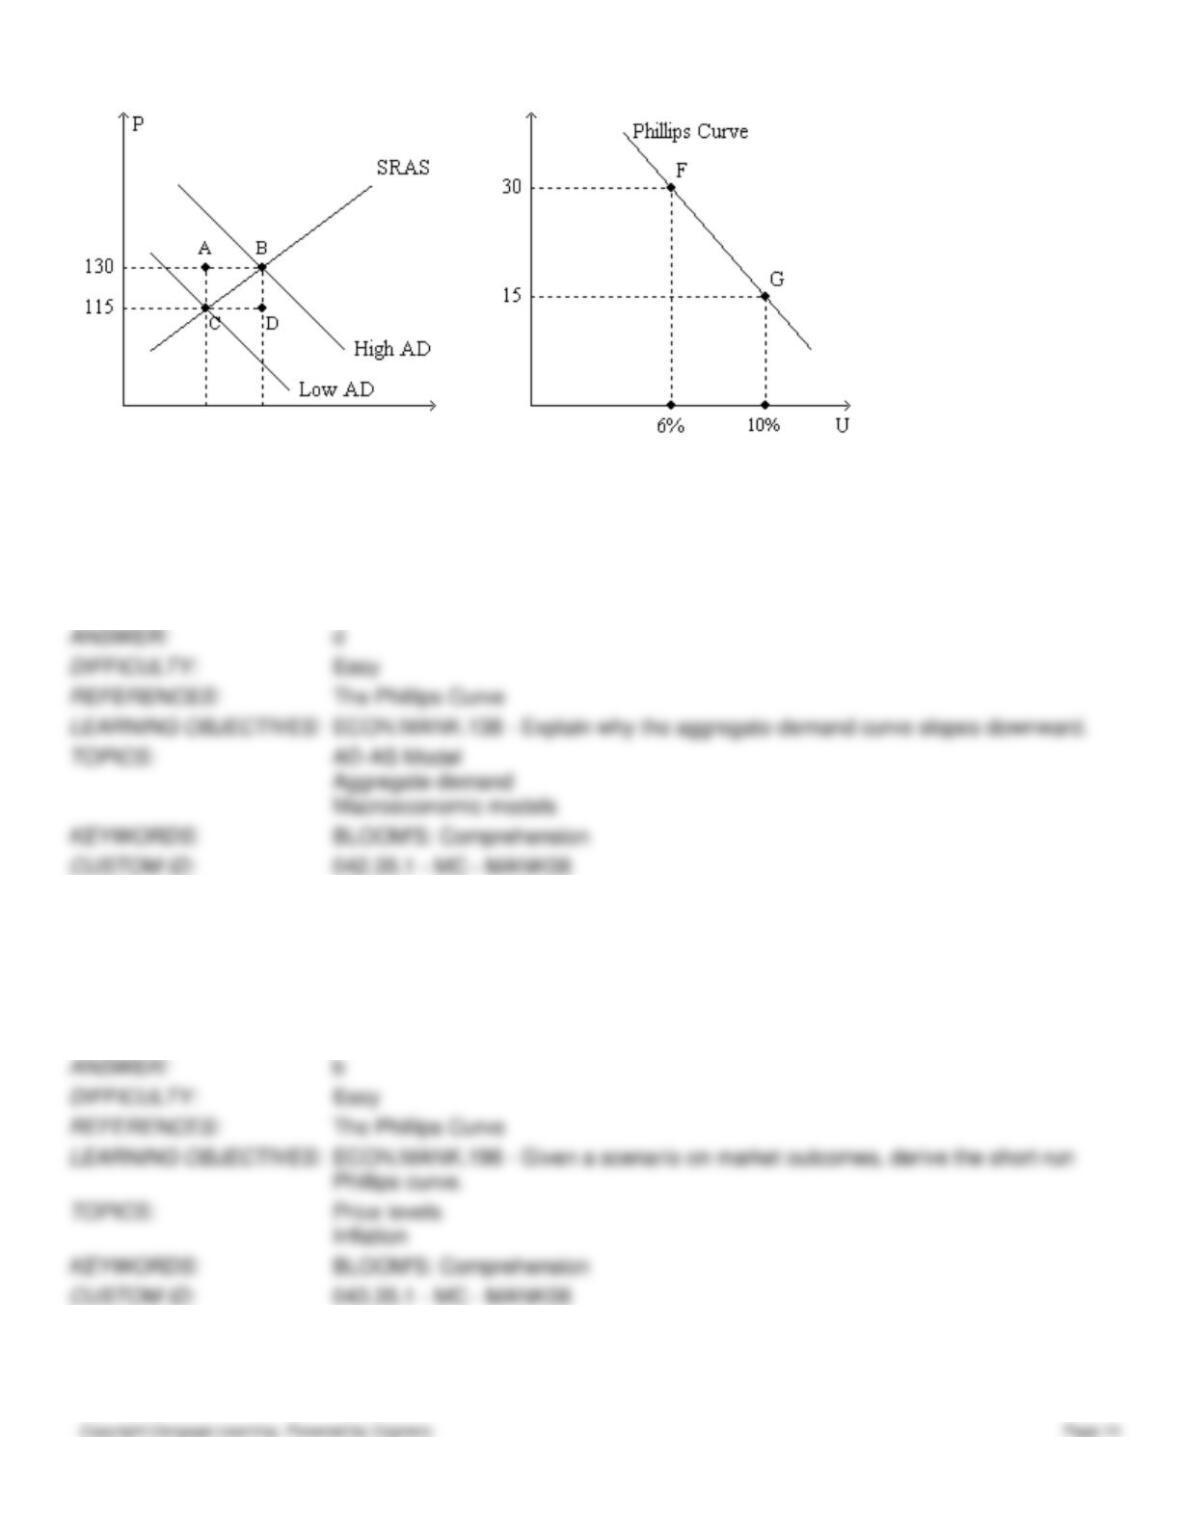
curves. On the right-hand diagram, U represents the unemployment rate.
42. Refer to Figure 35–1. What is measured along the horizontal axis of the left-hand graph?
a.
the wage rate
b.
the inflation rate
c.
employment
d.
output
43. Refer to Figure 35–1. What is measured along the vertical axis of the right-hand graph?
a.
the interest rate
b.
the inflation rate
c.
the wage rate
d.
the growth rate of the nominal money supply
44. Refer to Figure 35–1. Assuming the price level in the previous year was 100, point F on the right-hand graph
corresponds to
a.
point A on the left-hand graph.
b.
point B on the left-hand graph.
c.
point C on the left-hand graph.
d.
point D on the left-hand graph.
45. Refer to Figure 35–1. Assuming the price level in the previous year was 100, point G on the right-hand graph
corresponds to
a.
point A on the left-hand graph.
b.
point B on the left-hand graph.
c.
point C on the left-hand graph.
d.
point D on the left-hand graph.
46. Refer to Figure 35–1. Suppose points F and G on the right-hand graph represent two possible outcomes for an
imaginary economy in the year 2012, and those two points correspond to points B and C, respectively, on the left-hand
graph. Then it is apparent that the price index equaled
a.
130 in 2011.
b.
115 in 2011.
c.
110 in 2011.
d.
100 in 2011.

47. Refer to Figure 35–1. Suppose points F and G on the right-hand graph represent two possible outcomes for an
imaginary economy in the year 2012, and those two points correspond to points B and C, respectively, on the left-hand
graph. Also suppose we know that the price index equaled 120 in 2011. Then the numbers 115 and 130 on the vertical
axis of the left-hand graph would have to be replaced by
a.
155 and 175, respectively.
b.
138 and 156, respectively.
c.
137.5 and 154.75, respectively.
d.
135 and 150, respectively.
48. Refer to Figure 35–1. The curve that is depicted on the right-hand graph offers policymakers a “menu” of
combinations
a.
that applies both in the short run and in the long run.
b.
that is relevant to choices involving fiscal policy, but not to choices involving monetary policy.
c.
of inflation and unemployment.
d.
All of the above are correct.