178. Refer to Figure 3-18. The opportunity cost of 1 bowl for Bintu is
a.
1/4 cup.
b.
1/2 cup.
c.
2 cups.
d.
4 cups.
179. Refer to Figure 3-18. The opportunity cost of 1 bowl for Juba is
a.
1/4 cup.
b.
2/3 cup.
c.
3/2 cups.
d.
4 cups.
180. Refer to Figure 3-18. The opportunity cost of 1 cup for Bintu is
a.
1/8 bowl.
b.
1/4 bowl.
c.
4 bowls.
d.
8 bowls.
181. Refer to Figure 3-18. The opportunity cost of 1 cup for Juba is
a.
1/6 bowl.
b.
2/3 bowl.
c.
3/2 bowls.
d.
6 bowls.
182. Refer to Figure 3-18. Suppose Juba is willing to trade one bowl to Bintu for every two cups that Bintu makes and
sends to Juba. Which of the following combinations of bowls and cups could Bintu then consume, assuming Bintu
specializes in making cups and Juba specializes in making bowls?
a.
1 bowl and 7 cups
b.
2 bowls and 4 cups
c.
3 bowls and 3 cups
d.
4 bowls and 1 cup
183. Refer to Figure 3-18. Bintu has an absolute advantage in the production of
a.
bowls and Juba has an absolute advantage in the production of cups.
b.
cups and Juba has an absolute advantage in the production of bowls.
c.
both goods and Juba has an absolute advantage in the production of neither good.
d.
neither good and Juba has an absolute advantage in the production of both goods.
184. Refer to Figure 3-18. Bintu has a comparative advantage in the production of
a.
bowls and Juba has a comparative advantage in the production of cups.
b.
cups and Juba has a comparative advantage in the production of bowls.
c.
both goods and Juba has a comparative advantage in the production of neither good.
d.
neither good and Juba has a comparative advantage in the production of both goods.
185. Refer to Figure 3-18. If Bintu and Juba switch from each person dividing her time equally between the production
of cups and bowls to each person spending all of her time producing the good in which she has a comparative advantage,
then total production will increase by
a.
1 bowl and 1 cup.
b.
2 bowls and 4 cups.
c.
3 bowls and 5 cups.
d.
4 bowls and 8 cups.
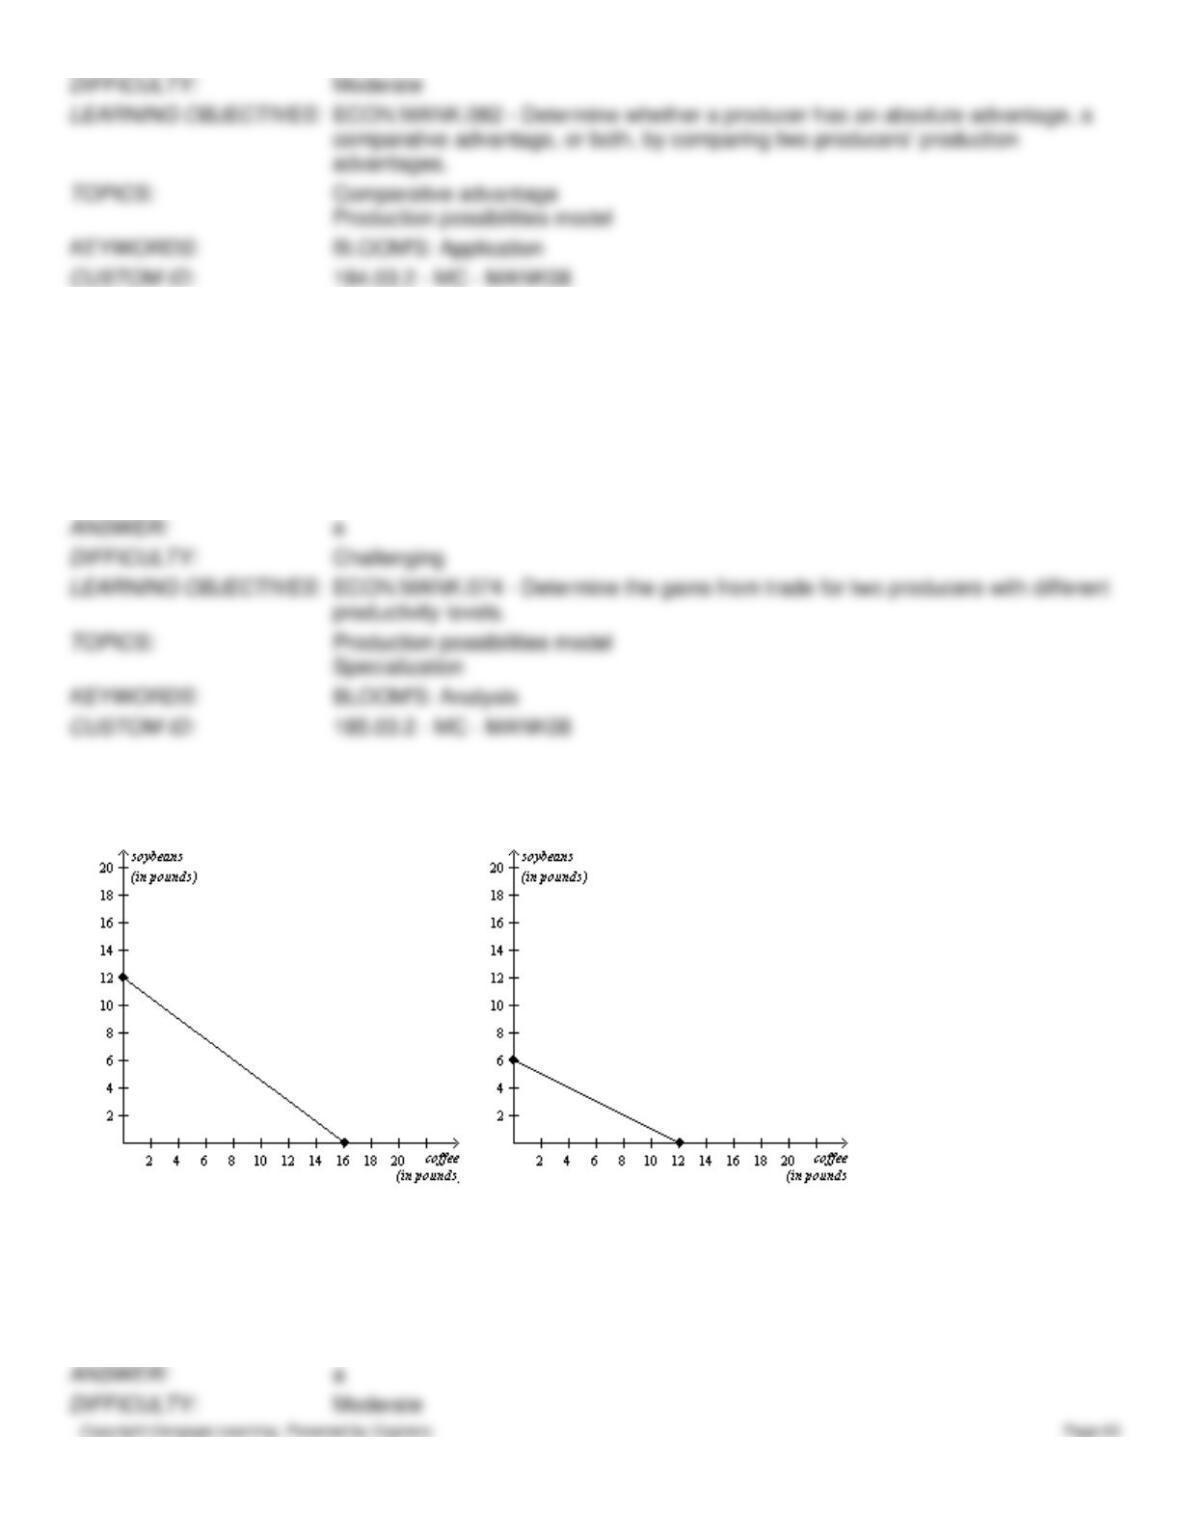
Figure 3-19
Chile’s Production Possibilities Frontier
Colombia’s Production Possibilities Frontier
186. Refer to Figure 3-19. Chile’s opportunity cost of one pound of coffee is
a.
3/4 pound of soybeans and Colombia’s opportunity cost of one pound of coffee is 1/2 pound of soybeans.
b.
3/4 pound of soybeans and Colombia’s opportunity cost of one pound of coffee is 2 pounds of soybeans.
c.
4/3 pounds of soybeans and Colombia’s opportunity cost of one pound of coffee is 1/2 pound of soybeans.
d.
4/3 pounds of soybeans and Colombia’s opportunity cost of one pound of coffee is 2 pounds of soybeans.
187. Refer to Figure 3-19. Chile’s opportunity cost of one pound of soybeans is
a.
3/4 pound of coffee and Colombia’s opportunity cost of one pound of soybeans is 1/2 pound of coffee.
b.
3/4 pound of coffee and Colombia’s opportunity cost of one pound of soybeans is 2 pounds of coffee.
c.
4/3 pounds of coffee and Colombia’s opportunity cost of one pound of soybeans is 1/2 pound of coffee.
d.
4/3 pounds of coffee and Colombia’s opportunity cost of one pound of soybeans is 2 pounds of coffee.
188. Refer to Figure 3-19. Chile would incur an opportunity cost of 36 pounds of coffee if it increased its production of
soybeans by
a.
12 pounds.
b.
27 pounds.
c.
30 pounds.
d.
48 pounds.
189. Refer to Figure 3-19. Colombia would incur an opportunity cost of 24 pounds of coffee if it increased its production
of soybeans by
a.
12 pounds.
b.
18 pounds.
c.
36 pounds.
d.
48 pounds.
190. Refer to Figure 3-19. Chile has an absolute advantage in the production of
a.
coffee and Colombia has an absolute advantage in the production of soybeans.
b.
soybeans and Colombia has an absolute advantage in the production of coffee.
c.
both goods and Colombia has an absolute advantage in the production of neither good.
d.
neither good and Colombia has an absolute advantage in the production of both goods.
191. Refer to Figure 3-19. Chile has a comparative advantage in the production of
a.
coffee and Colombia has a comparative advantage in the production of soybeans.
b.
soybeans and Colombia has a comparative advantage in the production of coffee.
c.
both goods and Colombia has a comparative advantage in the production of neither good.
d.
neither good and Colombia has a comparative advantage in the production of both goods.
192. Refer to Figure 3-19. If Chile and Colombia switch from each country dividing its time equally between the
production of coffee and soybeans to each country spending all of its time producing the good in which it has a
comparative advantage, then total production of soybeans will increase by
a.
3 pounds.
b.
6 pounds.
c.
9 pounds.
d.
12 pounds.
193. Refer to Figure 3-19. At which of the following prices would both Chile and Colombia gain from trade with each
other?
a.
6 pounds of soybeans for 9 pounds of coffee
b.
8 pounds of soybeans for 20 pounds of coffee
c.
11 pounds of soybeans for 33 pounds of coffee
d.
Chile and Colombia could not both gain from trade with each other at any price.
194. Refer to Figure 3-19. If Chile and Colombia each spends all of its time producing the good in which it has a
comparative advantage and the countries agree to trade 7 pounds of coffee for 5 pounds of soybeans, then Chile will
consume
a.
7 pounds of coffee and 7 pounds of soybeans and Colombia will consume 5 pounds of coffee and 5 pounds of
soybeans.
b.
7 pounds of coffee and 7 pounds of soybeans and Colombia will consume 5 pounds of coffee and 11 pounds of
soybeans.
c.
23 pounds of coffee and 7 pounds of soybeans and Colombia will consume 5 pounds of coffee and 5 pounds of
soybeans.
d.
23 pounds of coffee and 7 pounds of soybeans and Colombia will consume 5 pounds of coffee and 11 pounds
of soybeans.
195. Refer to Figure 3-19. Chile and Colombia would not be able to gain from trade if Colombia’s opportunity cost of
one pound of soybeans changed to
a.
1/2 pound of coffee.
b.
3/4 pound of coffee.
c.
4/3 pounds of coffee.
d.
2 pounds of coffee.
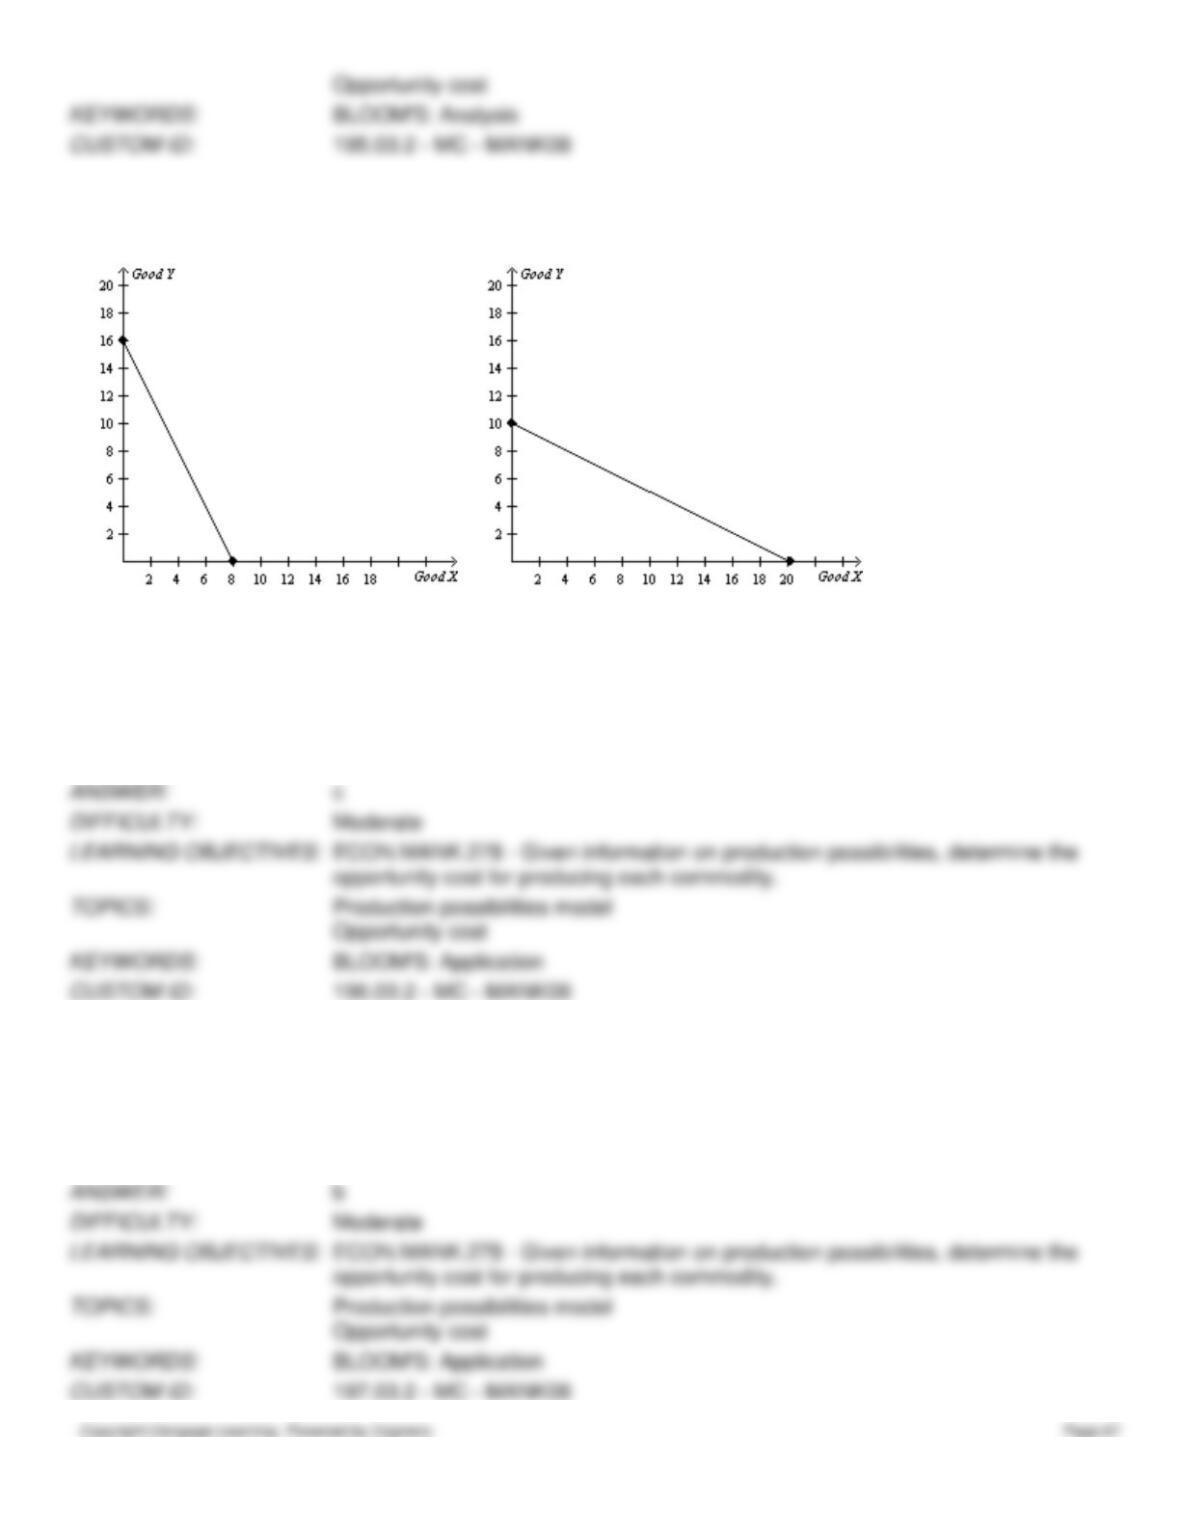
Figure 3-20
Canada’s Production Possibilities Frontier
Mexico’s Production Possibilities Frontier
196. Refer to Figure 3-20. Canada’s opportunity cost of one unit of Good X is
a.
1/2 unit of Good Y and Mexico’s opportunity cost of one unit of Good X is 1/2 unit of Good Y.
b.
1/2 unit of Good Y and Mexico’s opportunity cost of one unit of Good X is 2 units of Good Y.
c.
2 units of Good Y and Mexico’s opportunity cost of one unit of Good X is 1/2 unit of Good Y.
d.
2 units of Good Y and Mexico’s opportunity cost of one unit of Good X is 2 units of Good Y.
197. Refer to Figure 3-20. Canada’s opportunity cost of one unit of Good Y is
a.
1/2 unit of Good X and Mexico’s opportunity cost of one unit of Good Y is 1/2 unit of Good X.
b.
1/2 unit of Good X and Mexico’s opportunity cost of one unit of Good Y is 2 units of Good X.
c.
2 units of Good X and Mexico’s opportunity cost of one unit of Good Y is 1/2 unit of Good X.
d.
2 units of Good X and Mexico’s opportunity cost of one unit of Good Y is 2 units of Good X.
198. Refer to Figure 3-20. Canada would incur an opportunity cost of 6 units of Good X if it increased its production of
Good Y by
a.
3 units.
b.
6 units.
c.
9 units.
d.
12 units.
199. Refer to Figure 3-20. Mexico would incur an opportunity cost of 8 units of Good X if it increased its production of
Good Y by
a.
2 units.
b.
4 units.
c.
6 units.
d.
8 units.
200. Refer to Figure 3-20. Canada has an absolute advantage in the production of
a.
Good X and Mexico has an absolute advantage in the production of Good Y.
b.
Good Y and Mexico has an absolute advantage in the production of Good X.
c.
both goods and Mexico has an absolute advantage in the production of neither good.
d.
neither good and Mexico has an absolute advantage in the production of both goods.
201. Refer to Figure 3-20. Canada has a comparative advantage in the production of
a.
Good X and Mexico has a comparative advantage in the production of Good Y.
b.
Good Y and Mexico has a comparative advantage in the production of Good X.
c.
both goods and Mexico has a comparative advantage in the production of neither good.
d.
neither good and Mexico has a comparative advantage in the production of both goods.
202. Refer to Figure 3-20. If Canada and Mexico switch from each country dividing its time equally between the
production of Good X and Good Y to each country spending all of its time producing the good in which it has a
comparative advantage, then total production of Good X will increase by
a.
3 units.
b.
6 units.
c.
9 units.
d.
12 units.
203. Refer to Figure 3-20. If Canada and Mexico switch from each country dividing its time equally between the
production of Good X and Good Y to each country spending all of its time producing the good in which it has a
comparative advantage, then total production of Good Y will increase by
a.
3 units.
b.
6 units.
c.
9 units.
d.
12 units.
204. Refer to Figure 3-20. At which of the following prices would both Canada and Mexico gain from trade with each
other?
a.
9 units of Good Y for 6 units of Good X
b.
8 units of Good Y for 20 units of Good X
c.
70 units of Good Y for 30 units of Good X
d.
Canada and Mexico could not both gain from trade with each other at any price.
Figure 3-21
Uzbekistan’s Production Possibilities Frontier
Azerbaijan’s Production Possibilities Frontier
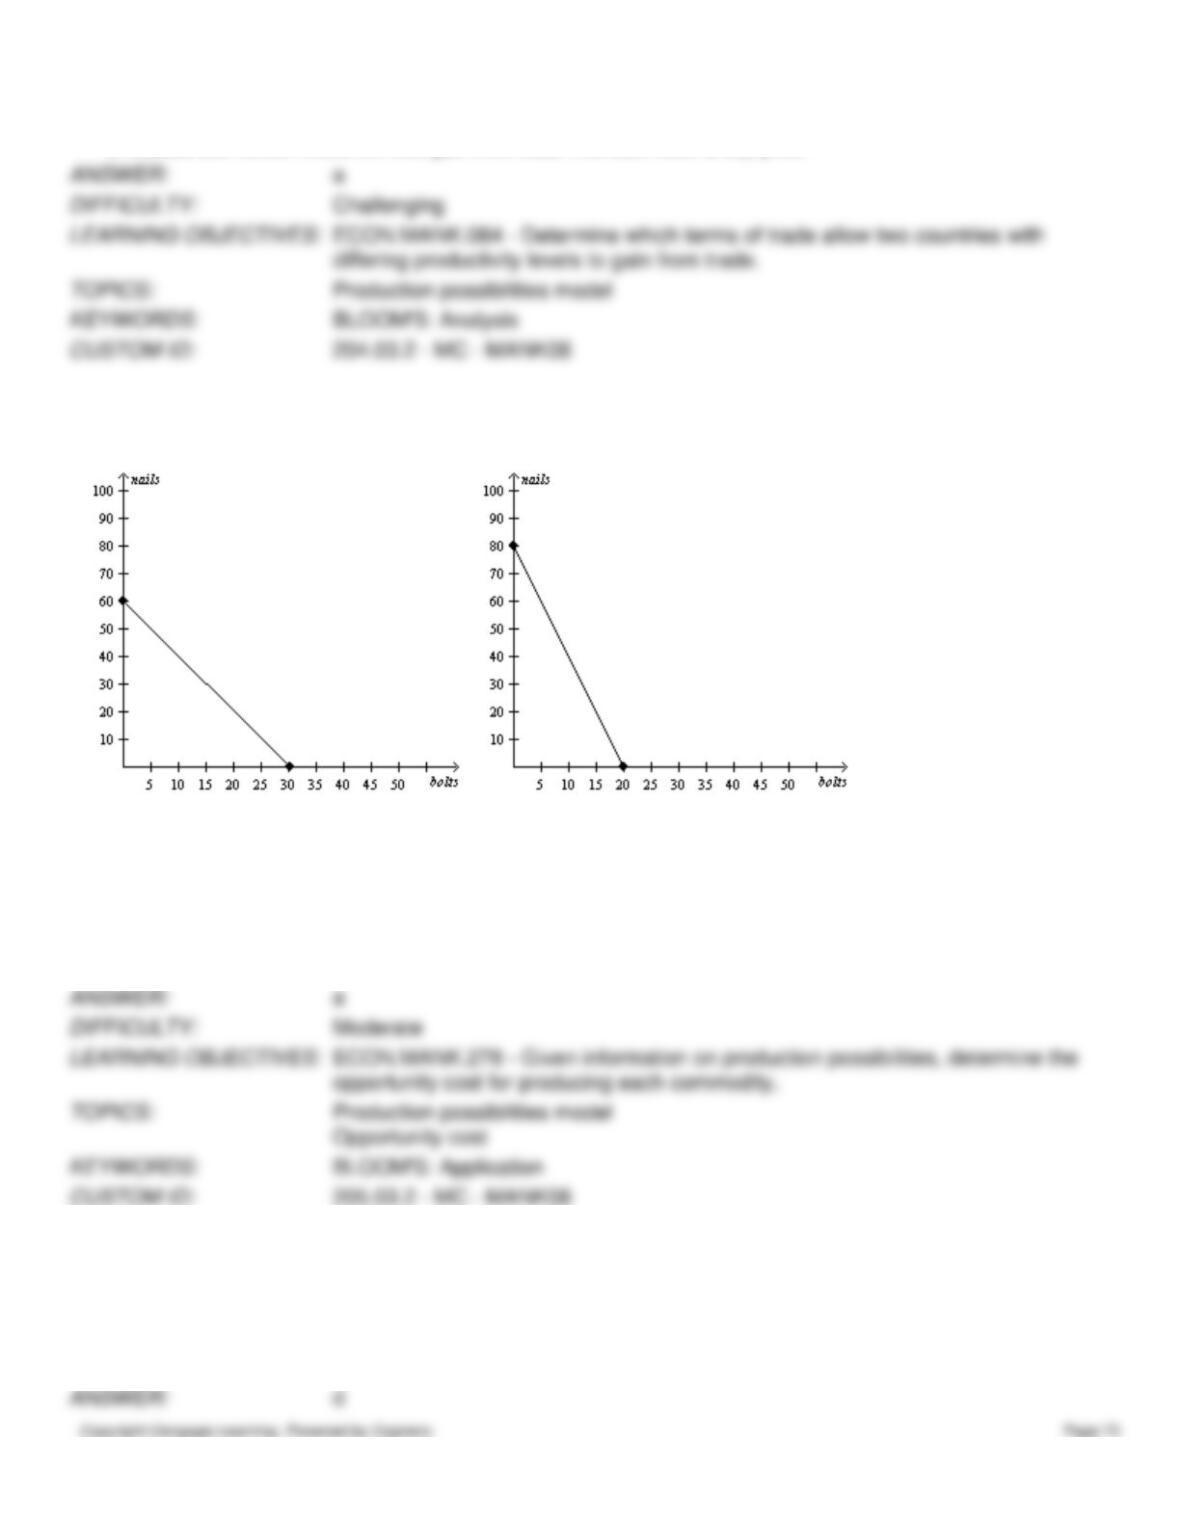
205. Refer to Figure 3-21. Azerbaijan’s opportunity cost of one nail is
a.
1/4 bolt and Uzbekistan’s opportunity cost of one nail is 1/2 bolt.
b.
1/4 bolt and Uzbekistan’s opportunity cost of one nail is 2 bolts.
c.
4 bolts and Uzbekistan’s opportunity cost of one nail is 1/2 bolt.
d.
4 bolts and Uzbekistan’s opportunity cost of one nail is 2 bolts.
206. Refer to Figure 3-21. Azerbaijan’s opportunity cost of one bolt is
a.
1/4 nail and Uzbekistan’s opportunity cost of one bolt is 1/2 nail.
b.
1/4 nail and Uzbekistan’s opportunity cost of one bolt is 2 nails.
c.
4 nails and Uzbekistan’s opportunity cost of one bolt is 1/2 nail.
d.
4 nails and Uzbekistan’s opportunity cost of one bolt is 2 nails.
207. Refer to Figure 3-21. Suppose Uzbekistan decides to increase its production of bolts by 10. What is the opportunity
cost of this decision?
a.
1/2 nail
b.
2 nails
c.
5 nails
d.
20 nails
208. Refer to Figure 3-21. Suppose Azerbaijan decides to increase its production of nails by 20. What is the opportunity
cost of this decision?
a.
1/4 bolt
b.
4 bolts
c.
5 bolts
d.
80 bolts
209. Refer to Figure 3-21. Suppose Azerbaijan is willing to trade 3 nails to Uzbekistan for every bolt that Uzbekistan
makes and sends to Azerbaijan. Which of the following combinations of bolts and nails could Azerbaijan then consume,
assuming Uzbekistan specializes in making bolts and Azerbaijan specializes in making nails?
a.
8 bolts and 56 nails
b.
14 bolts and 44 nails
c.
18 bolts and 32 nails
d.
20 bolts and 26 nails
210. Refer to Figure 3-21. Suppose Azerbaijan is willing to trade 3 nails to Uzbekistan for every bolt that Uzbekistan
makes and sends to Azerbaijan. Which of the following combinations of bolts and nails could Uzbekistan then consume,
assuming Uzbekistan specializes in making bolts and Azerbaijan specializes in making nails?
a.
7 bolts and 70 nails
b.
12 bolts and 56 nails
c.
17 bolts and 40 nails
d.
25 bolts and 15 nails
211. Refer to Figure 3-21. Azerbaijan has an absolute advantage in the production of
a.
bolts and a comparative advantage in the production of bolts.
b.
bolts and a comparative advantage in the production of nails.
c.
nails and a comparative advantage in the production of bolts.
d.
nails and a comparative advantage in the production of nails.
212. Refer to Figure 3-21. If Uzbekistan and Azerbaijan switch from each country dividing its time equally between the
production of bolts and nails to each country spending all of its time producing the good in which it has a comparative
advantage, then total production will increase by
a.
5 bolts and 10 nails.
b.
15 bolts and 40 nails.
c.
20 bolts and 50 nails.
d.
30 bolts and 80 nails.
213. Refer to Figure 3-21. If Uzbekistan and Azerbaijan each spends all its time producing the good in which it has a
comparative advantage and trade takes place at a price of 12 bolts for 36 nails, then
a.
neither Uzbekistan nor Azerbaijan will gain from this trade.
b.
Uzbekistan will gain from this trade, but Azerbaijan will not.
c.
Azerbaijan will gain from this trade, but Uzbekistan will not.
d.
both Uzbekistan and Azerbaijan will gain from this trade.
214. Refer to Figure 3-21. Without trade, Uzbekistan produced and consumed 12 bolts and 36 nails and Azerbaijan
produced and consumed 14 bolts and 24 nails. Then, each country agreed to specialize in the production of the good in
which it has a comparative advantage and trade 16 bolts for 38 nails. As a result, Uzbekistan gained
a.
2 bolts and 2 nails and Azerbaijan gained 2 bolts and 18 nails.
b.
4 bolts and 2 nails and Azerbaijan gained 2 bolts and 14 nails.
c.
14 bolts and 38 nails and Azerbaijan gained 16 bolts and 42 nails.
d.
16 bolts and 38 nails and Azerbaijan gained 16 bolts and 38 nails.
Figure 3-22
Alice and Betty’s Production Possibilities in one 8-hour day.
Alice’s Production Possibilities Frontier
Betty’s Production Possibilities Frontier
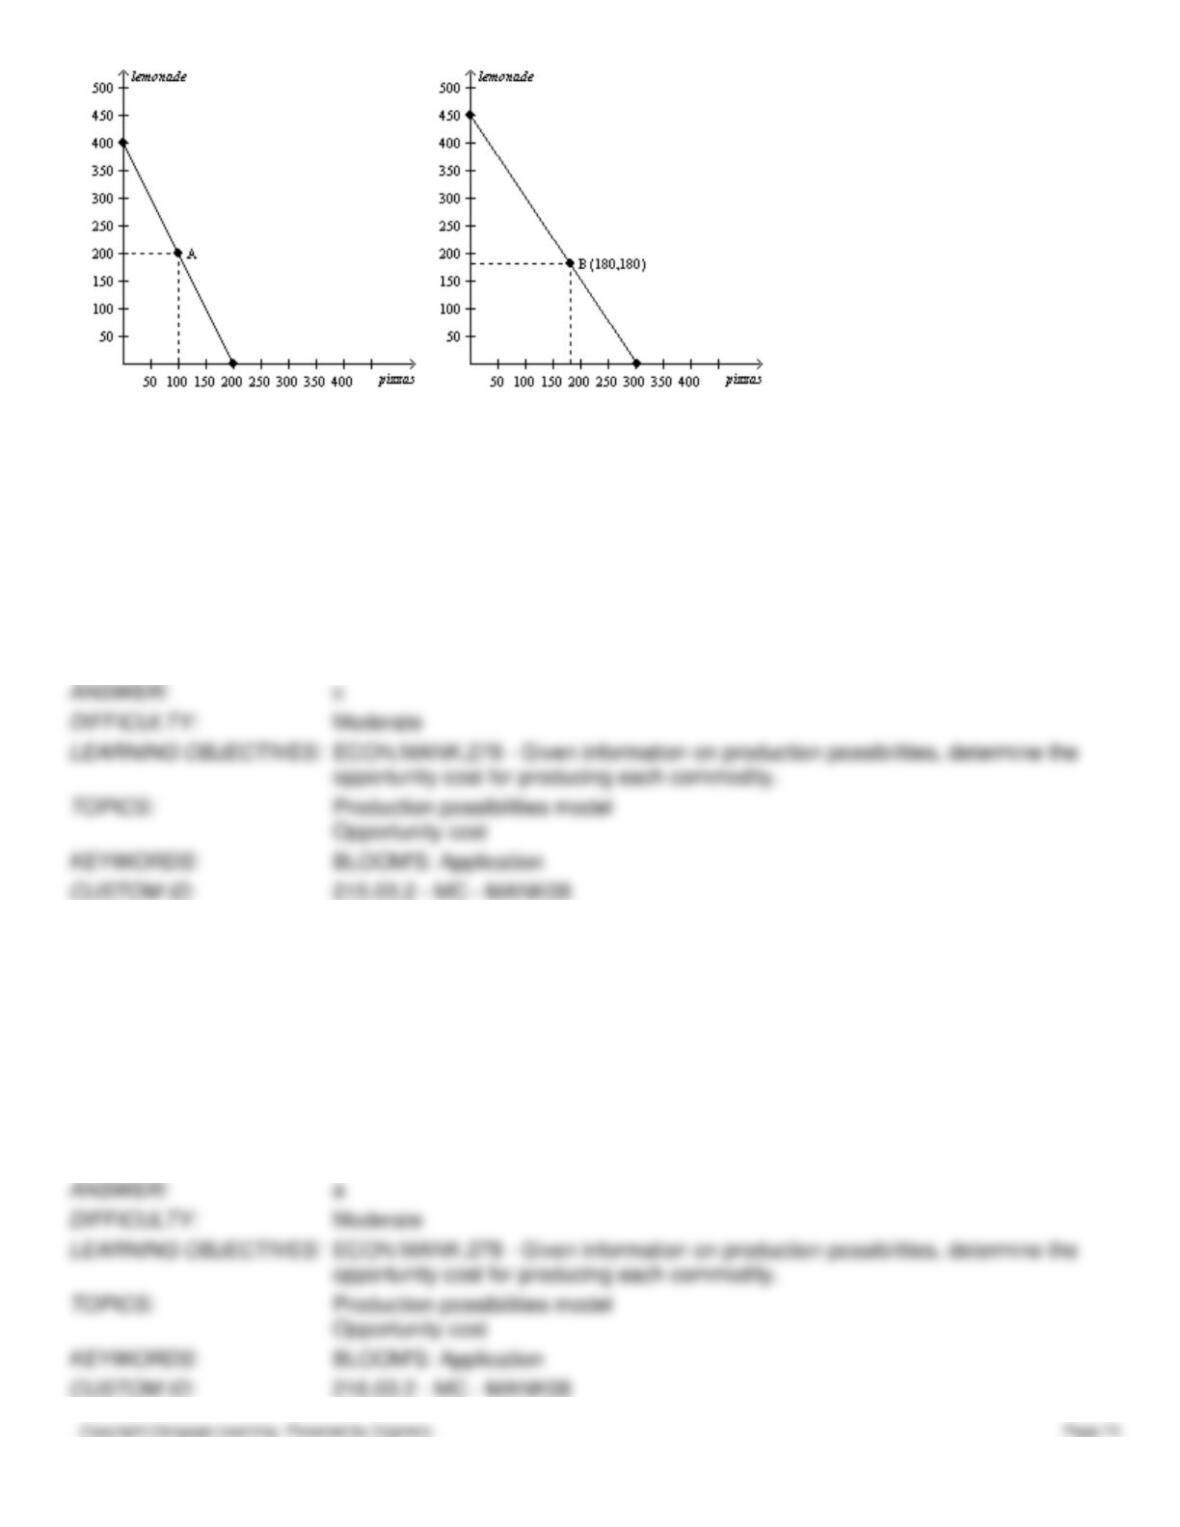
215. Refer to Figure 3-22. What are Alice and Betty’s opportunity costs of 1 pizza?
a.
Alice’s opportunity cost of 1 pizza is 1/2 of a pitcher of lemonade and Betty’s opportunity cost of 1 pizza is
2/3 of a pitcher of lemonade.
b.
Alice’s opportunity cost of 1 pizza is 1 pitcher of lemonade and Betty’s opportunity cost of 1 pizza is 3
pitchers of lemonade.
c.
Alice’s opportunity cost of 1 pizza is 2 pitchers of lemonade and Betty’s opportunity cost of 1 pizza is 1.5
pitchers of lemonade.
d.
Alice’s opportunity cost of 1 pizza is 400 pitchers of lemonade and Betty’s opportunity cost of 1 pizza is 450
pitchers of lemonade.
216. Refer to Figure 3-22. What are Alice and Betty’s opportunity costs of 1 pitcher of lemonade?
a.
Alice’s opportunity cost of 1 pitcher of lemonade is 1/2 of a pizza and Betty’s opportunity cost of 1 pitcher of
lemonade is 2/3 of a pizza.
b.
Alice’s opportunity cost of 1 pitcher of lemonade is 2 pizzas and Betty’s opportunity cost of 1 pitcher of
lemonade is 1.5 pizzas.
c.
Alice’s opportunity cost of 1 pitcher of lemonade is 10 pizzas and Betty’s opportunity cost of 1 pitcher of
lemonade is 10 pizzas.
d.
Alice’s opportunity cost of 1 pitcher of lemonade is 200 pizzas and Betty’s opportunity cost of 1 pitcher of
lemonade is 300 pizzas.
217. Refer to Figure 3-22. Which of the following statements is correct regarding absolute advantage?
a.
Alice has an absolute advantage in the production of both lemonade and pizzas.
b.
Betty has an absolute advantage in the production of both lemonade and pizzas.
c.
Alice has an absolute advantage in the production of pizzas while Betty has an absolute advantage in the
production of lemonade.
d.
Alice has an absolute advantage in the production of lemonade while Betty has an absolute advantage in the
production of pizzas.
218. Refer to Figure 3-22. Which of the following statements is correct regarding comparative advantage?
a.
Alice has a comparative advantage in the production of both lemonade and pizzas.
b.
Betty has a comparative advantage in the production of both lemonade and pizzas.
c.
Alice has a comparative advantage in the production of pizzas while Betty has a comparative advantage in the
production of lemonade.
d.
Alice has a comparative advantage in the production of lemonade while Betty has a comparative advantage in
the production of pizzas.
219. Refer to Figure 3-22. Which of the following prices would result in an mutually advantageous trade for Alice and
Betty?
a.
100 pizzas for 100 pitchers of lemonade
b.
100 pizzas for 125 pitchers of lemonade
c.
100 pizzas for 180 pitchers of lemonade
d.
100 pizzas for 220 pitchers of lemonade
Table 3-31
Labor Hours Needed to Make 1 Pound of:
Amount Produced in 40 hours
Meat
Potatoes
Meat
Potatoes
Farmer
8 hours/pound
5 hours/pound
5 pounds
8 pounds
Rancher
4 hours/pound
10 hours/pound
10 pounds
4 pounds
220. Refer to Table 3-31. For the farmer, the opportunity cost of 1 pound of meat is
a.
0.625 pound of potatoes.
b.
1.6 pounds of potatoes.
c.
5 pounds of potatoes.
d.
8 pounds of potatoes.
221. Refer to Table 3-31. For the farmer, the opportunity cost of 15 pounds of meat is
a.
12 pounds of potatoes.
b.
16 pounds of potatoes.
c.
20 pounds of potatoes.
d.
24 pounds of potatoes.
222. Refer to Table 3-31. For the rancher, the opportunity cost of 1 pound of meat is
a.
0.4 pound of potatoes.
b.
2.5 pounds of potatoes.
c.
4 pounds of potatoes.
d.
10 pounds of potatoes.
223. Refer to Table 3-31. For the rancher, the opportunity cost of 16 pounds of meat is
a.
4.0 pounds of potatoes.
b.
5.2 pounds of potatoes.
c.
6.4 pounds of potatoes.
d.
9.6 pounds of potatoes.
224. Refer to Table 3-31. For the farmer, the opportunity cost of 1 pound of potatoes is
a.
0.625 pound of meat.
b.
1.0 pounds of meat.
c.
1.6 pounds of meat.
d.
3.2 pounds of meat.
225. Refer to Table 3-31. For the farmer, 12.8 pounds of
a.
meat is the opportunity cost of 10.6 pounds of potatoes.
b.
meat is the opportunity cost of 16.0 pounds of potatoes.
c.
potatoes is the opportunity cost of 6.8 pounds of meat.
d.
potatoes is the opportunity cost of 8.0 pounds of meat.
226. Refer to Table 3-31. In 10 hours,
a.
the rancher could produce 2.5 pounds of meat and 1.0 pound of potatoes.
b.
the rancher could produce 1.0 pound of meat and 1.0 pound of potatoes.
c.
the farmer could produce 0.25 pounds of meat and 1.6 pounds of potatoes.
d.
the farmer could produce 0.75 pounds of meat and 1.25 pounds of potatoes.
227. Refer to Table 3-31. Relative to the farmer, the rancher has an absolute advantage in the production of
a.
meat, but not in the production of potatoes.
b.
potatoes, but not in the production of meat.
c.
both meat and potatoes.
d.
neither meat nor potatoes.
228. Refer to Table 3-31. Relative to the rancher, the farmer has a comparative advantage in the production of
a.
meat, but not in the production of potatoes.
b.
potatoes, but not in the production of meat.
c.
both meat and potatoes.
d.
neither meat nor potatoes.
229. Refer to Table 3-31. Relative to the rancher, the farmer has
a.
a comparative advantage in the production of meat, because the farmer’s opportunity cost of a pound of meat
is lower than the rancher’s opportunity cost of a pound of meat.
b.
a comparative advantage in the production of potatoes, because the rancher requires less time than the farmer
to produce a pound of potatoes.
c.
a comparative advantage in the production of potatoes; relative to the farmer, the rancher has a comparative
advantage in the production of meat.