d.
an absolute advantage in the production of both meat and potatoes.
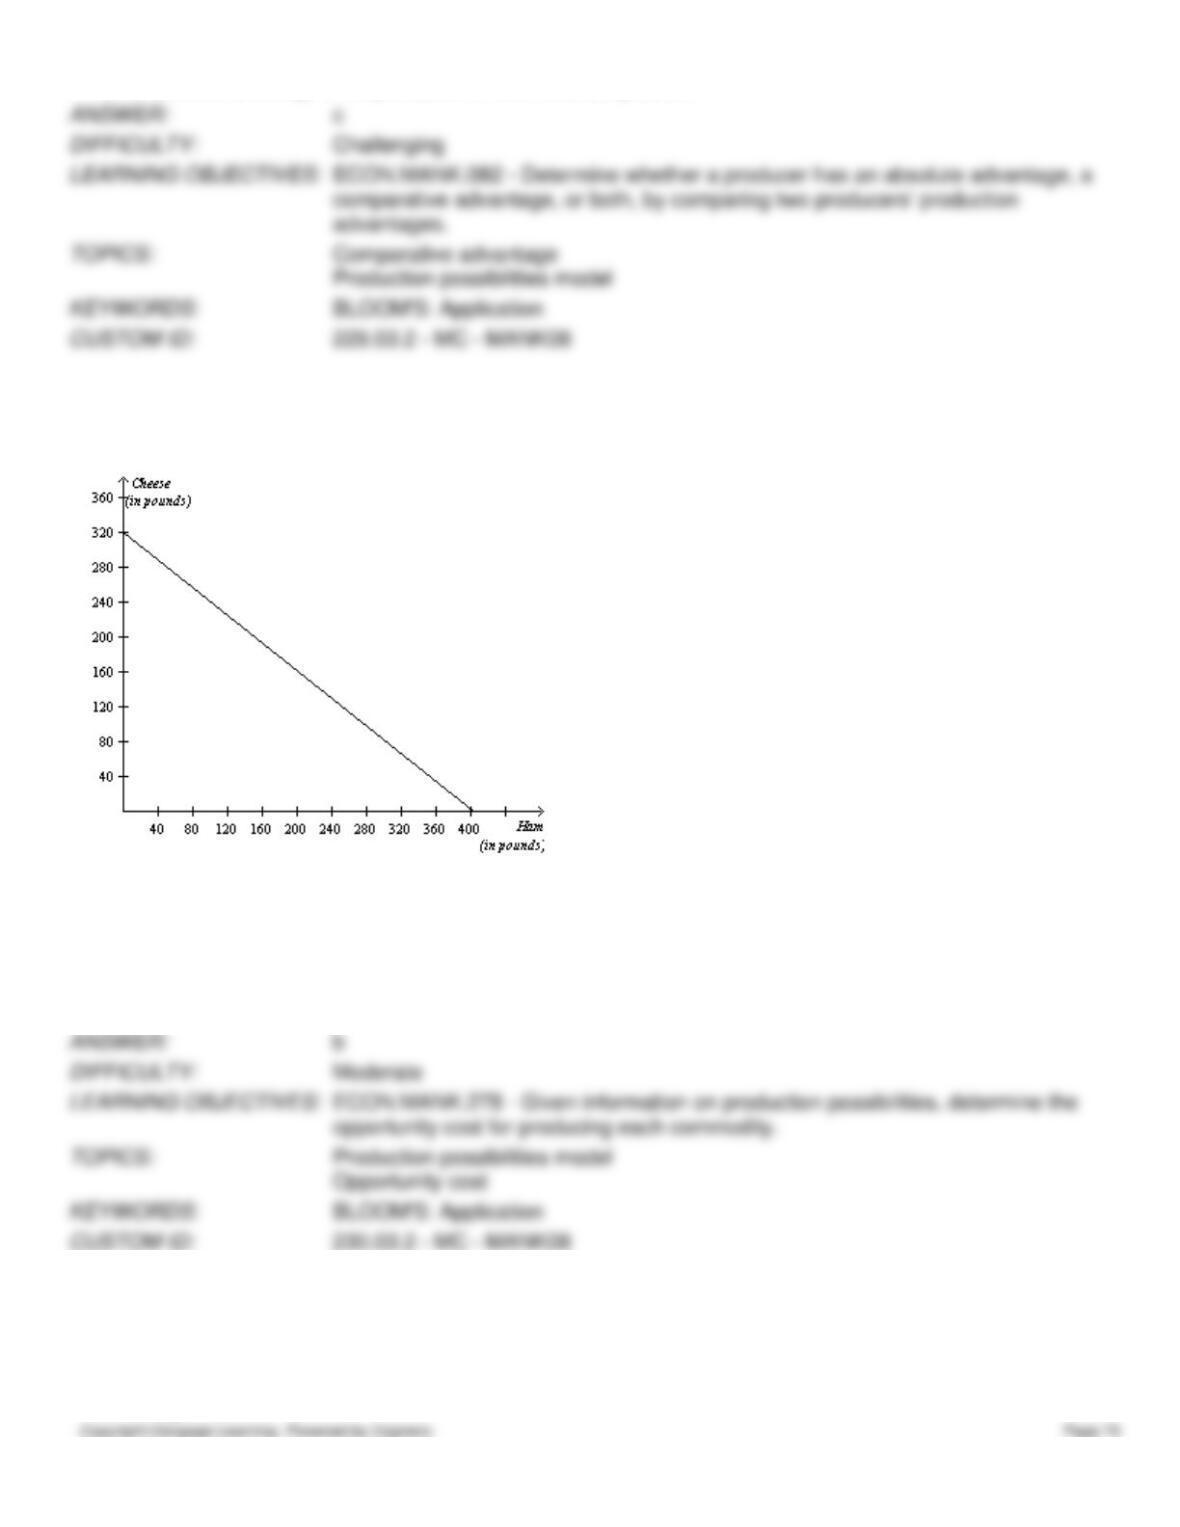
Figure 3-23
The graph below represents the various combinations of ham and cheese (in pounds) that the nation of Bonovia could
produce in a given month.
230. Refer to Figure 3-23. For Bonovia, what is the opportunity cost of a pound of cheese?
a.
0.8 pounds of ham
b.
1.25 pounds of ham
c.
8 pounds of ham
d.
16 pounds of ham
231. Refer to Figure 3-23. Whenever Bonovia increases its production of ham by 1 pound per month, then it must
decrease its production of cheese by
a.
0.75 pound.
b.
0.80 pound.
c.
1.00 pounds.
d.
1.25 pounds.
232. Refer to Figure 3-23. The nation of Cropitia has a comparative advantage over Bonovia in producing ham if
a.
Cropitia can produce more than 400 pounds of ham per month.
b.
Cropitia can produce more than 320 pounds of cheese per month.
c.
Cropitia’s opportunity cost of producing a pound of ham is less than 0.8 pounds of cheese.
d.
Cropitia’s opportunity cost of producing a pound of ham is greater than 0.8 pounds of cheese.
233. Refer to Figure 3-23. In the nation of Cropitia, the opportunity cost of a pound of cheese is 1.5 pounds of ham.
Bonovia and Cropitia both can gain from trading with one another if one pound of cheese trades for
a.
1.0 pound of ham.
b.
1.4 pounds of ham.
c.
2.1 pounds of ham.
d.
All of the above are correct.
234. Refer to Figure 3-23. In the nation of Cropitia, the opportunity cost of a pound of ham is 0.3 pounds of cheese.
Bonovia and Cropitia both can gain from trading with one another if one pound of ham trades for
a.
0.40 pounds of cheese.
b.
0.55 pounds of cheese.
c.
0.75 pounds of cheese.
d.
All of the above are correct.
Table 3-32
US and French Production Opportunities
Wine (in millions of gallons)
Cheese (in millions of lbs.)
US
16
32
France
8
4
235. Refer to Table 3-32 The US has a comparative advantage in the production of
a.
wine.
b.
cheese.
c.
both wine and cheese.
d.
neither wine nor cheese.
236. Refer to Table 3-32 France has an absolute advantage in the production of
a.
wine.
b.
cheese.
c.
both wine and cheese.
d.
neither wine nor cheese.
237. Refer to Table 3-32 The opportunity costs for the US and France are as follows:
a.
In the US 1 million gallons of wine costs 1/2 million pounds of cheese and in France 1 million gallons of wine
costs 2 million pounds of cheese.
b.
In the US 1 million gallons of wine costs 2 million pounds of cheese and in France 1 million gallons of wine
costs 1/2 million pounds of cheese.
c.
In the US 1 million pounds of cheese costs 1/2 million gallons of wine and in France 1 million pounds of
cheese costs 2 million gallons of wine.
d.
In the US 1 million pounds of cheese costs 16 million gallons of wine and in France 1 million pounds of
cheese costs 8 million gallons of wine.
Table 3-33
Chris and Tony’s Production Opportunities
Tomatoes
Pasta Sauce
Chris
10 lbs
300 jars
Tony
14 lbs
280 jars
238. Refer to Table 3-33 Chris and Tony both produce tomatoes and pasta sauce. The table shows their possible
production per month if both work the same number of 8 hour days. Given this information, Chris’s opportunity cost of 1
lb. of tomatoes is
a.
2 jars of sauce and Tony’s opportunity cost of 1 lb. of tomatoes is 3 jars of sauce.
b.
3 jars of sauce and Tony’s opportunity cost of 1 lb. of tomatoes is 2 jars of sauce.
c.
20 jars of sauce and Tony’s opportunity cost of 1 lb. of tomatoes is 30 jars of sauce.
d.
30 jars of sauce and Tony’s opportunity cost of 1 lb. of tomatoes is 20 jars of sauce.
239. Refer to Table 3-33 Chris and Tony both produce tomatoes and pasta sauce. The table shows their possible
production per month if both work the same number of 8 hour days. If Chris and Tony both decide to specialize and
produce only the good in which they have a comparative advantage, then
a.
Chris will produce only sauce and Tony will produce only tomatoes.
b.
Chris will produce only tomatoes and Tony will produce only sauce.
c.
Both Chris and Tony will produce only sauce.
d.
Both Chris and Tony will produce only tomatoes.
240. Refer to Table 3-33 Chris and Tony both produce tomatoes and pasta sauce. The table shows their possible
production per month if both work the same number of 8 hour days. Which of the following statements is correct?
a.
Tony has a comparative advantage in the production of sauce.
b.
Chris has a comparative advantage in the production of tomatoes.
c.
Tony has an absolute advantage in the production of tomatoes.
d.
Chris has an absolute advantage in the production of tomatoes.
241. Refer to Table 3-33 Chris and Tony both produce tomatoes and pasta sauce. The table shows their possible
production per month if both work the same number of 8 hour days. Which of the following prices would result in a
mutually advantageous trade between Chris and Tony?
a.
1 lb. of tomatoes for 23 jars of sauce
b.
1 lb. of tomatoes for 27 jars of sauce
c.
1 lb. of tomatoes for 33 jars of sauce
d.
.Both a and b are correct.
242. Adam Smith
a.
and David Ricardo both opposed free trade.
b.
opposed free trade, but David Ricardo supported it.
c.
supported free trade, but David Ricardo opposed it.
d.
and David Ricardo both supported free trade.
243. Adam Smith asserted that a person should never attempt to make at home
a.
what it will cost him more to make than to buy.
b.
any good in which that person does not have an absolute advantage.
c.
any luxury good.
d.
any necessity.
244. Which famous economist developed the principle of comparative advantage as we know it today?
a.
Adam Smith
b.
David Ricardo
c.
John Maynard Keynes
d.
Milton Friedman
245. Which of the following is not correct?
a.
Economists are generally united in their support of free trade.
b.
The conclusions of Adam Smith and David Ricardo on the gains from trade have held up well over time.
c.
David Ricardo argued that Britain should not restrict imports of grain.
d.
Economists’ opposition to trade restrictions is still based largely on the principle of absolute advantage.
246. Economists generally support
a.
trade restrictions.
b.
government management of trade.
c.
export subsidies.
d.
free international trade.
d
Moderate
BLOOM’S: Comprehension
246.03.2 – MC – MANK08
Table 3-34
Assume that Indonesia and India can switch between producing rice and bananas at a constant rate.
Labor Hours Needed to Make 1 Unit of
Number of Units Produced in 40 Hours
Rice
Bananas
Rice
Bananas
Indonesia
2
5
20
8
India
4
2
10
20
247. Refer to Table 3-34. Indonesia’s opportunity cost of producing bananas is
a.
2.5 units of rice. This is higher than India’s opportunity cost of producing bananas.
b.
2.5 units of rice. This is lower than India’s opportunity cost of producing bananas.
c.
2/5 units of rice. This is higher than India’s opportunity cost of producing bananas.
d.
2/5 units of rice. This is lower than India’s opportunity cost of producing bananas.
a
Moderate
BLOOM’S: Application
247.03.2 – MC – MANK08
248. Refer to Table 3-34. India’s opportunity cost of producing rice is
a.
1/2 units of bananas. This is higher than Indonesia’s opportunity cost of producing rice.
b.
1/2 units of bananas. This is lower than Indonesia’s opportunity cost of producing rice.
c.
2 units of bananas. This is higher than Indonesia’s opportunity cost of producing rice.
d.
2 units of bananas. This is lower than Indonesia’s opportunity cost of producing rice.
Moderate
BLOOM’S: Application
249. Refer to Table 3-34. For which good(s) does Indonesia have a comparative advantage
a.
rice and bananas.
b.
rice but not bananas.
c.
bananas but not rice.
d.
nether rice nor bananas.
250. Refer to Table 3-34. At which of the following prices, if any, can India and Indonesia both gain from trade?
a.
1/5 units of bananas per unit of rice.
b.
1/3 units of bananas per unit of rice.
c.
3/5 units of bananas per unit of rice.
d.
None of the above.
Table 3-35
Labor Hours Needed
to Produce
1 Dozen Eggs
1 Pound Ham
Denmark
10
8
Finland
6
4
251. Refer to Table 3-35. Denmark’s opportunity cost of producing 1dozen eggs is
a.
5/4 pounds of ham. This is higher than Finland’s opportunity cost of producing 1dozen eggs.
b.
5/4 pounds of ham. This is lower than Finland’s opportunity cost of producing 1 dozen eggs.
c.
4/5 pounds of ham. This is higher than Finland’s opportunity cost of producing 1 dozen eggs.
d.
4/5 pounds of ham. This is lower than Finland’s opportunity cost of producing 1 dozen eggs.
252. Refer to Table 3-35. Finland’s opportunity cost of producing 1 unit of ham is
a.
3/2 dozen eggs. This is higher than Denmark’s opportunity cost.
b.
3/2 dozen eggs. This is lower than Denmark’s opportunity cost.
c.
2/3 dozen eggs. This is higher than Denmark’s opportunity cost.
d.
2/3 dozen eggs. This is lower than Denmark’s opportunity cost.
253. Refer to Table 3-35. Which good(s) does Denmark have an absolute advantage producing?
a.
both eggs and ham.
b.
eggs but not ham.
c.
ham but not eggs.
d.
neither ham nor eggs.
254. Refer to Table 3-35. Which good(s) does Finland have an absolute advantage producing?
a.
both eggs and ham.
b.
eggs but not ham.
c.
ham but not eggs.
d.
neither ham nor eggs.
255. Refer to Table 3-35. At which of the following prices, if any, could both Denmark and Finland gain from trade?
a.
2/3 pounds of ham per dozen eggs.
b.
1 pound of ham per dozen eggs.
c.
1.4 pounds of ham per dozen eggs.
d.
None of the above are correct.
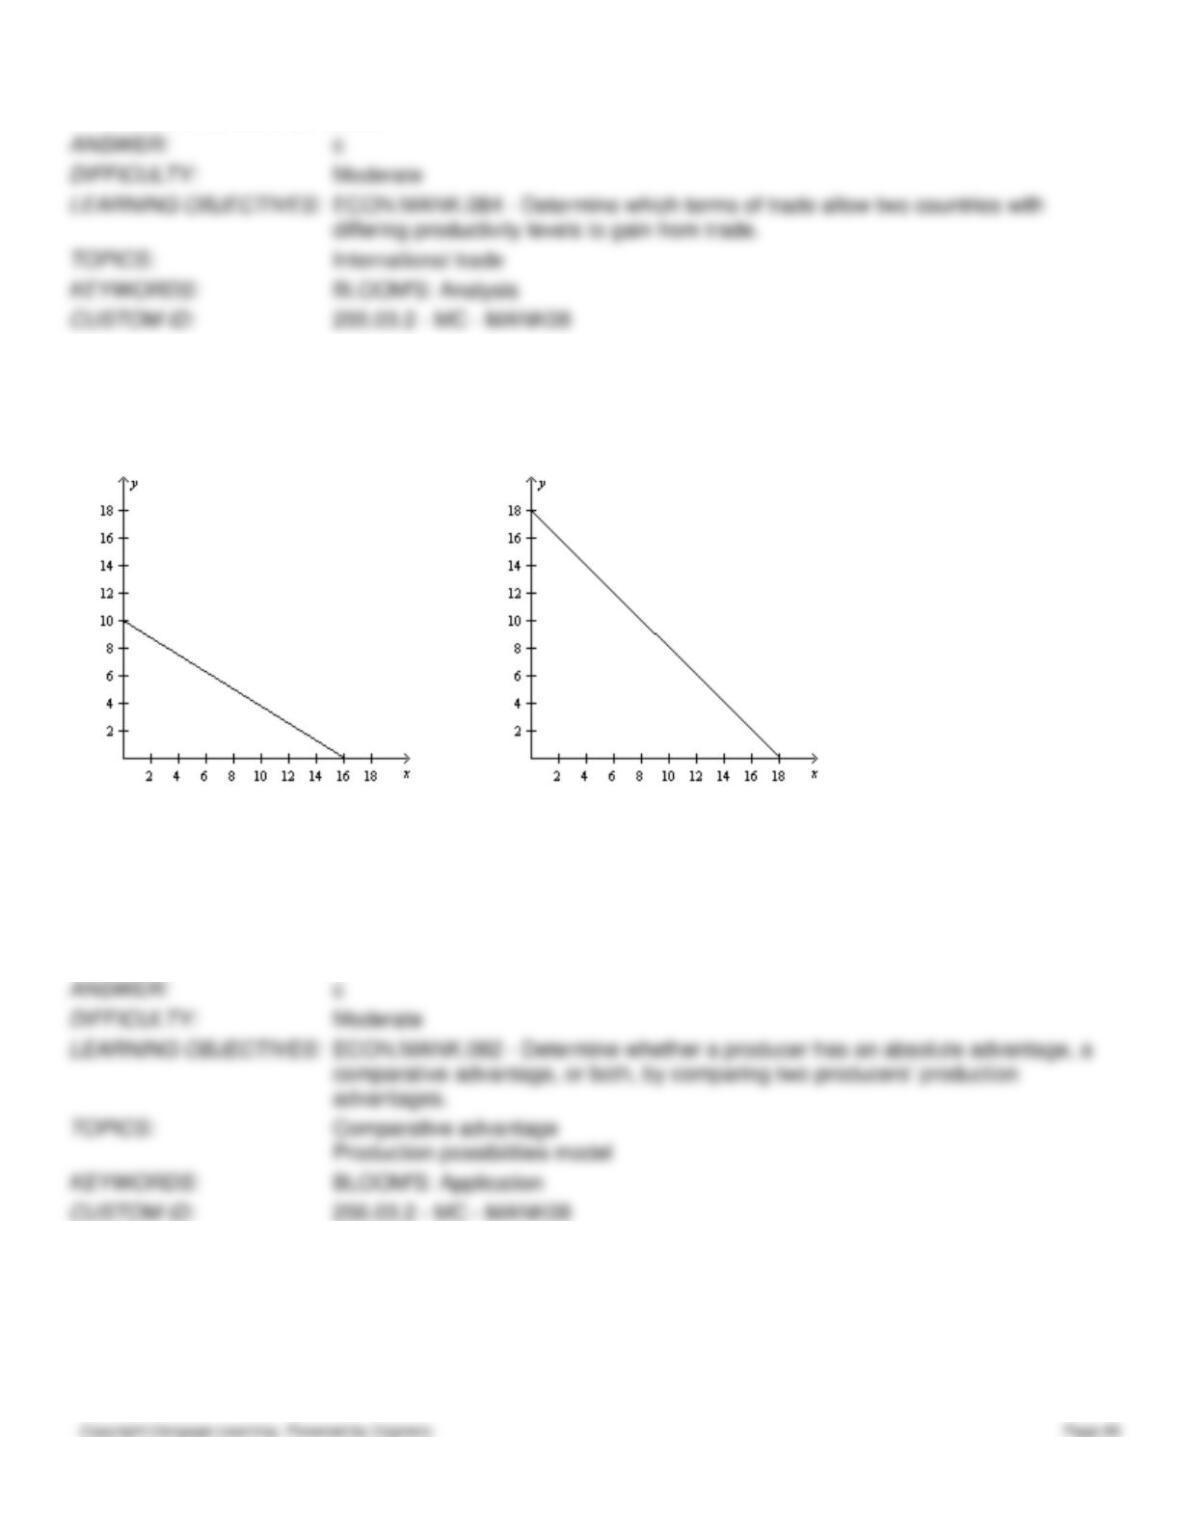
Figure 3-24
The production possibilities frontiers below show how much Bob and Betty can each produce in 8 hours of time.
Bob’s Production Possibilities Frontier
Betty’s Production Possibilities Frontier
256. Refer to Figure 3-24. Bob has
a.
an absolute and comparative advantage producing good x.
b.
an absolute but not a comparative advantage producing good x.
c.
a comparative but not an absolute advantage producing good x.
d.
neither a comparative nor an absolute advantage producing good x.
257. Refer to Figure 3-24. Betty has
a.
an absolute and comparative advantage producing good x.
b.
an absolute but not a comparative advantage producing good x.
c.
a comparative but not an absolute advantage producing good x.
d.
neither a comparative nor an absolute advantage producing good x.
Table 3-36
Minutes Needed
to Make 1
Towel
Umbrella
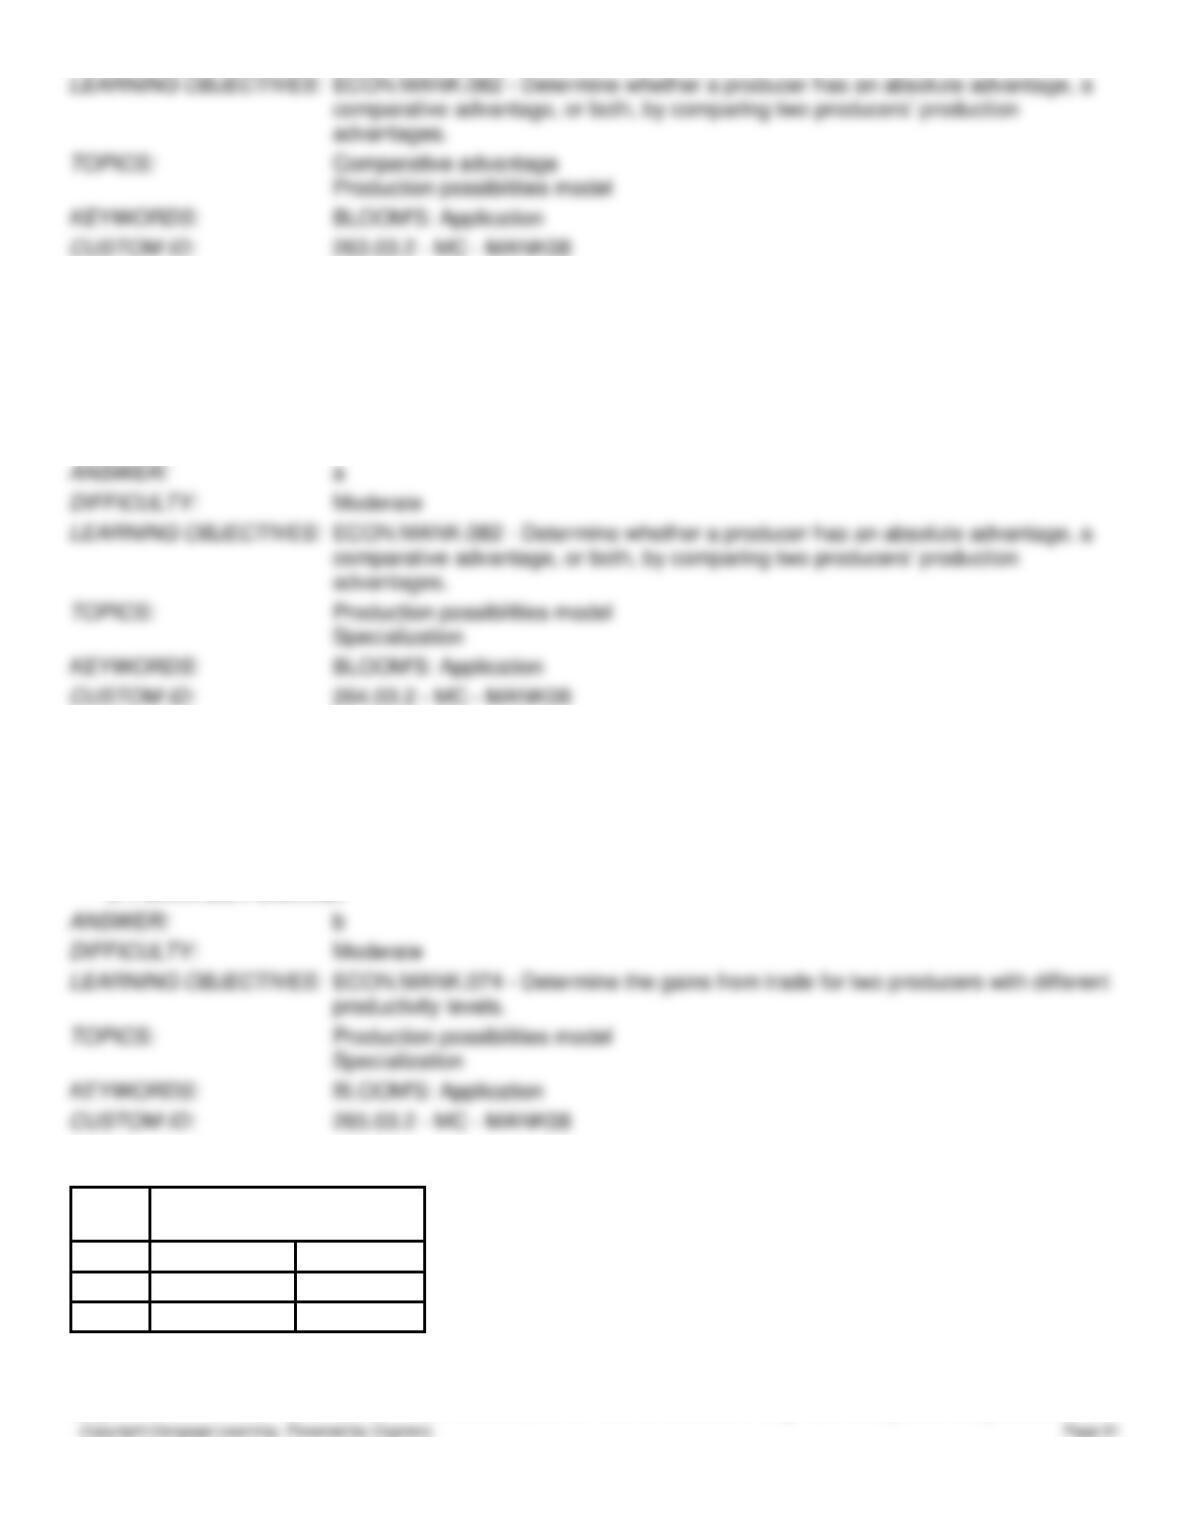
Antigua
12
20
Barbuda
15
10
258. Refer to Table 3-36. What is Antigua’s opportunity cost of one towel?
a.
3/5 umbrellas
b.
2/3 umbrellas
c.
3/2 umbrellas
d.
5/3 umbrellas
259. Refer to Table 3-36. What is Antigua’s opportunity cost of one umbrella?
a.
3/5 towels
b.
2/3 towels
c.
3/2 towels
d.
5/3 towels
260. Refer to Table 3-36. What is Barbuda’s opportunity cost of one towel?
a.
3/5 umbrellas
b.
2/3 umbrellas
c.
3/2 umbrellas
d.
5/3 umbrellas
261. Refer to Table 3-36. What is Barbuda’s opportunity cost of one umbrella?
a.
3/5 towels
b.
2/3 towels
c.
3/2 towels
d.
5/3 towels
262. Refer to Table 3-36. Antigua has an absolute advantage in the production of
a.
towels and Barbuda has an absolute advantage in the production of umbrellas.
b.
umbrellas and Barbuda has an absolute advantage in the production of towels.
c.
both goods and Barbuda has an absolute advantage in the production of neither good.
d.
neither good and Barbuda has an absolute advantage in the production of both goods.
263. Refer to Table 3-36. Antigua has a comparative advantage in the production of
a.
towels and Barbuda has a comparative advantage in the production of umbrellas.
b.
umbrellas and Barbuda has a comparative advantage in the production of towels.
c.
both goods and Barbuda has a comparative advantage in the production of neither good.
d.
neither good and Barbuda has a comparative advantage in the production of both goods.
264. Refer to Table 3-36. If Antigua and Barbuda decide to trade with each other, Antigua should specialize in the
production of
a.
towels and Barbuda should specialize in the production of umbrellas.
b.
umbrellas and Barbuda should specialize in the production of towels.
c.
both goods and Barbuda should specialize in the production of neither good.
d.
neither good and Barbuda should specialize in the production of both goods.
265. Refer to Table 3-36. Assume that Antigua and Barbuda each has 60 minutes available. If each island spends all its
time producing the good in which it has a comparative advantage, then total production is
a.
4 towels and 3 umbrellas.
b.
5 towels and 6 umbrellas.
c.
8 towels and 10 umbrellas.
d.
9 towels and 9 umbrellas.
Table 3-37
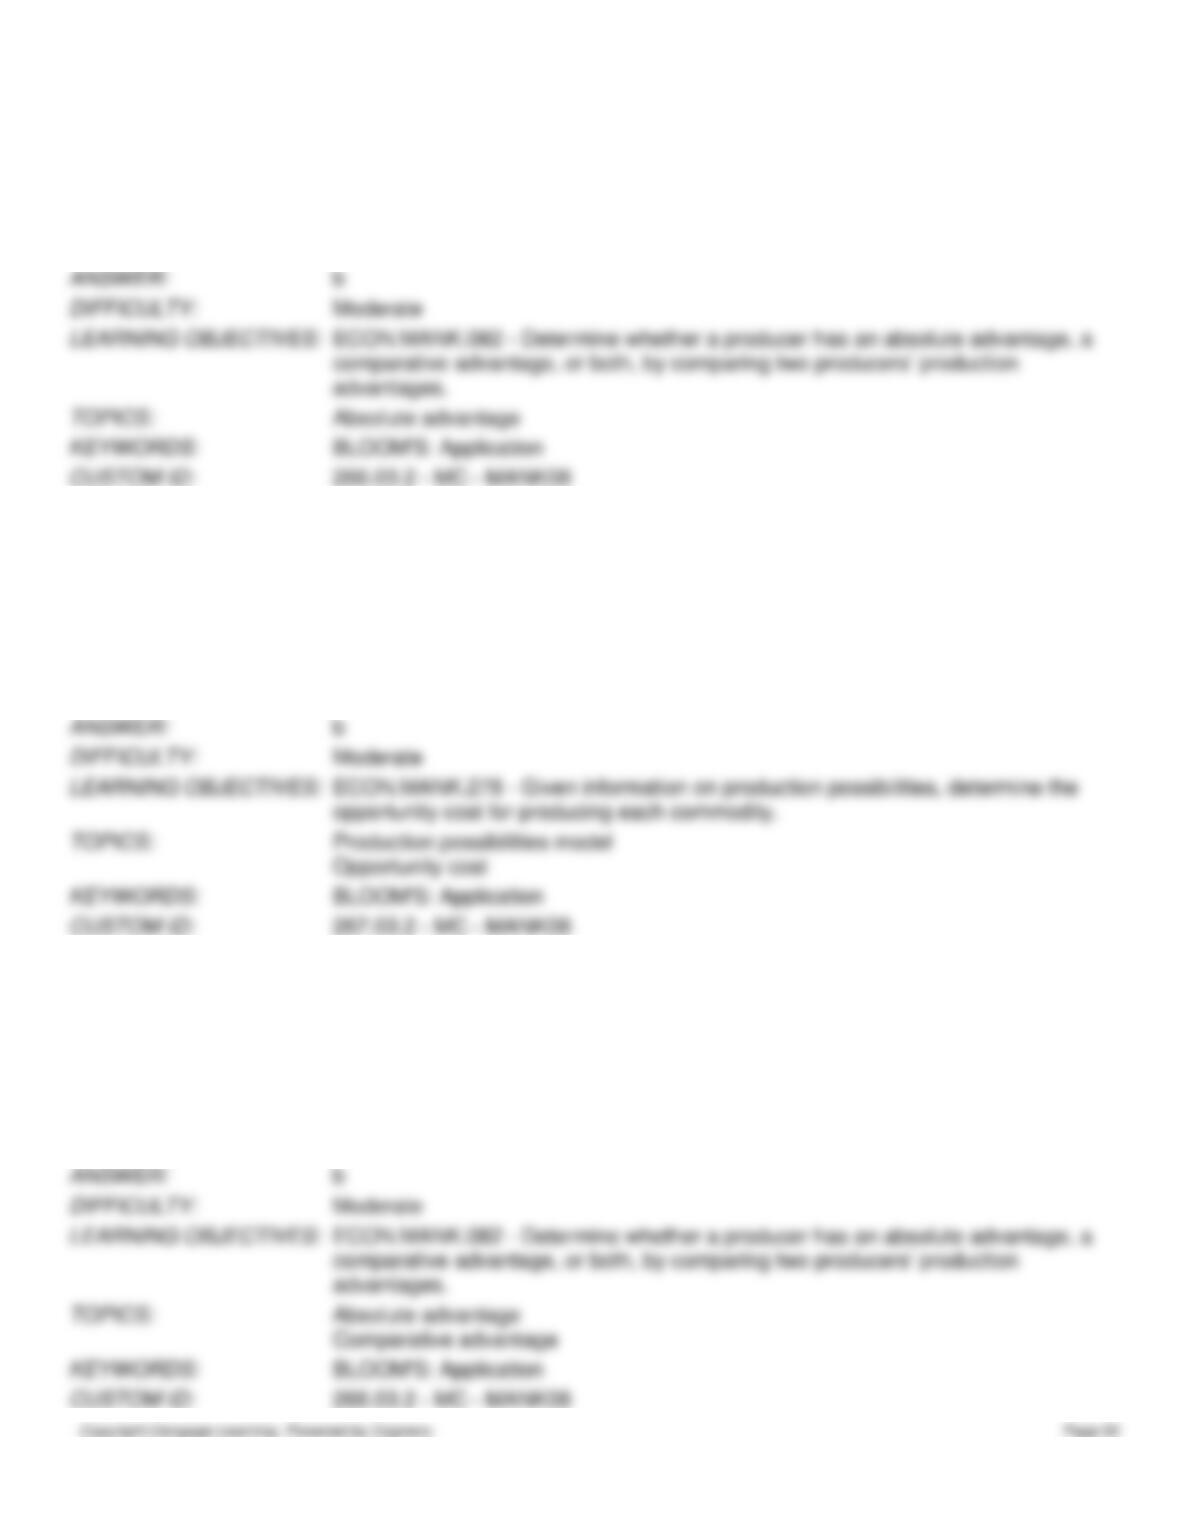
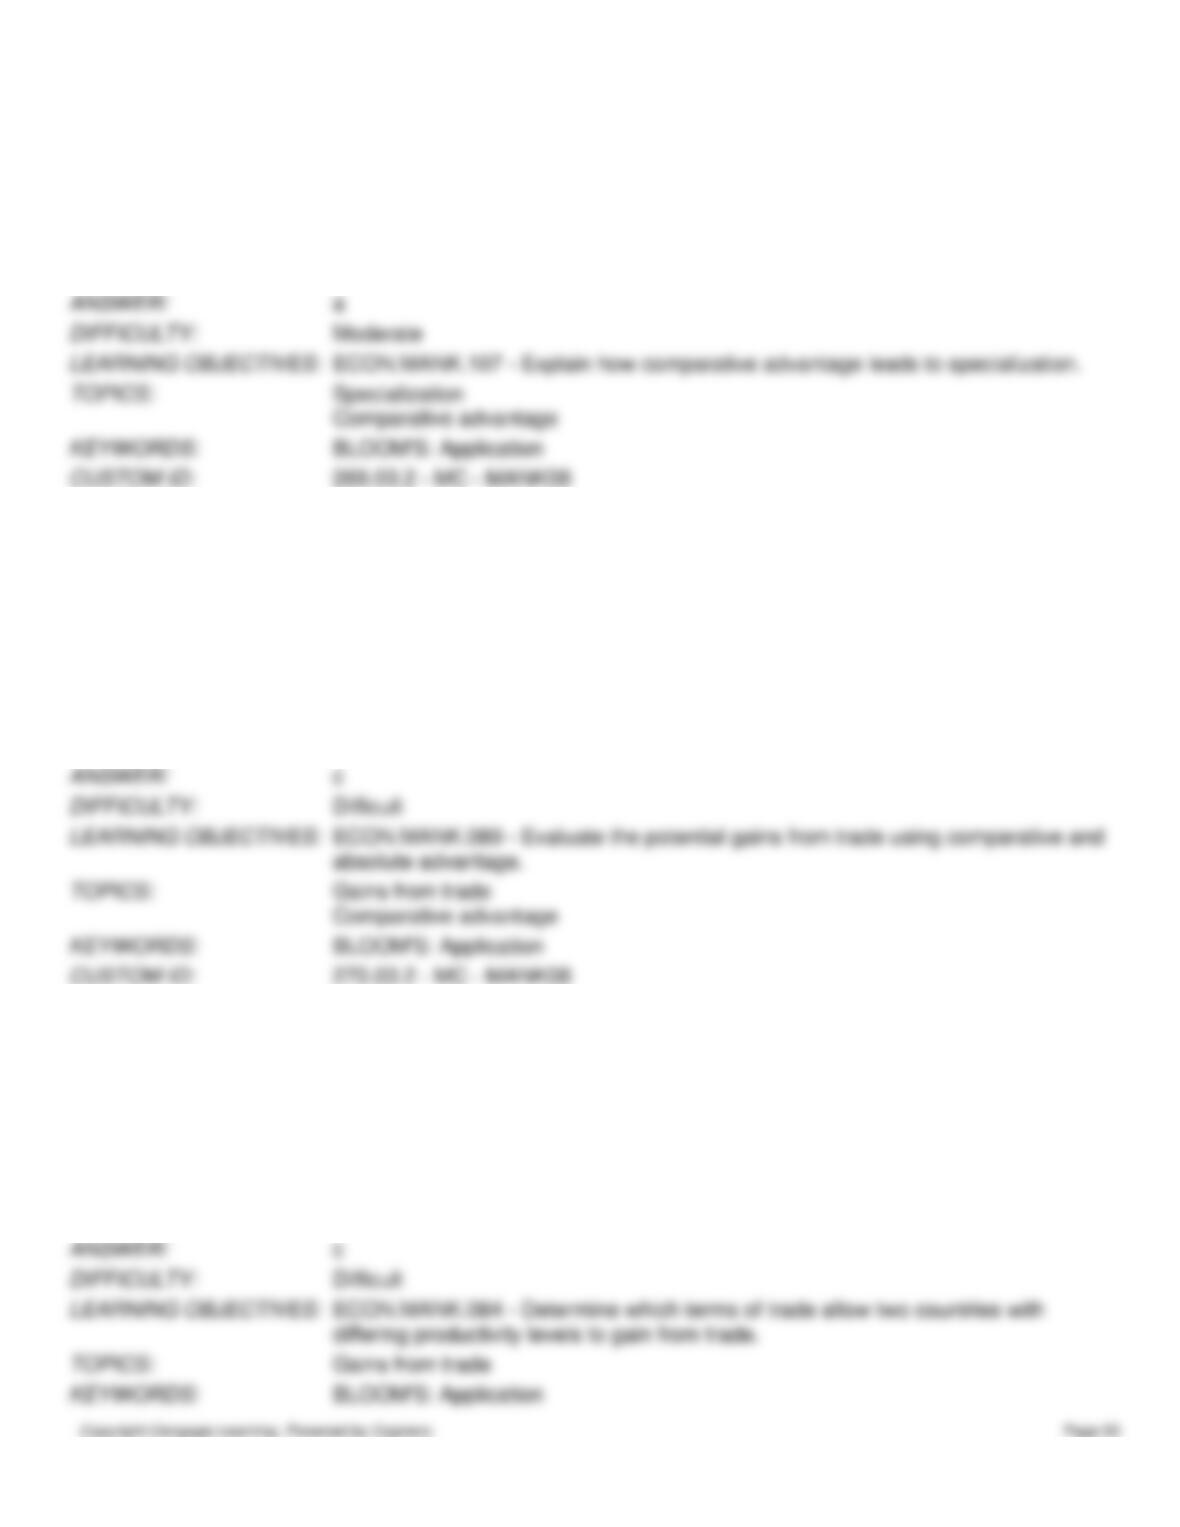
Output of pottery in one six-
hour session
Vases
Mugs
Sarah
8
32
Charles
10
25
266. Refer to Table 3-37. Sarah and Charles are both potters and each can switch between the production of vases and
mugs at a constant rate. The table shows the total number of vases or decorative mugs that each person can produce in a
six-hour session of producing pottery.
a.
Sarah has an absolute advantage in the production of vases and Charles has an absolute advantage in the
production of mugs.
b.
Sarah has an absolute advantage in the production of mugs and Charles has an absolute advantage in the
production of vases.
c.
Charles has an absolute advantage of both vases and mugs.
d.
Sarah has an absolute advantage in both vases and mugs.
267. Refer to Table 3-37. Sarah and Charles are both potters and each can switch between the production of vases and
mugs at a constant rate. The table shows the total number of vases or decorative mugs that each person can produce in a
six-hour session of producing pottery. Sarah’s opportunity cost to produce one vase is
a.
0.25 mugs and Charles’s opportunity cost of producing one vase is 2.5 mugs
b.
4 mugs and Charles’s opportunity cost of producing one vase is 2.5 mugs
c.
0.25 mugs and Charles’s opportunity cost of producing one vase is 0.40 mugs
d.
4 mugs and Charles’s opportunity cost of producing one vase is 0.40 mugs
268. Refer to Table 3-37. Sarah and Charles are both potters and each can switch between the production of vases and
mugs at a constant rate. The table shows the total number of vases or decorative mugs that each person can produce in a
six-hour session of producing pottery. Sarah has an absolute advantage in
a.
the production of vases and a comparative advantage in the production of vases.
b.
the production of mugs and a comparative advantage in the production of mugs.
c.
the production of neither good and a comparative advantage in the production of vases.
d.
the production of both goods and a comparative advantage in the production of mugs.
269. Refer to Table 3-37. Sarah and Charles are both potters and each can switch between the production of vases and
mugs at a constant rate. The table shows the total number of vases or decorative mugs that each person can produce in a
six-hour session of producing pottery. Sarah should specialize in the production of
a.
mugs and Charles should specialize in the production of vases.
b.
vases and Charles should specialize in the production of mugs.
c.
both goods and Charles should specialize in the production of neither good.
d.
neither good and Charles should specialize in the production of both good.
270. Refer to Table 3-37. Sarah and Charles are both potters and each can switch between the production of vases and
mugs at a constant rate. The table shows the total number of vases or decorative mugs that each person can produce in a
six-hour session of producing pottery. Suppose that Sarah and Charles produce for two 6-hour sessions and they split this
time equally between the production of vases and mugs. If they then produce for two 6-hour sessions and produce only
the good that each person has the comparative advantage for, then total production of
a.
vases would rise by 20 and total production of mugs would rise by 32.
b.
vases would rise by 2 and total production of mugs would rise by 27.
c.
vases would rise by 2 and total production of mugs would rise by 7.
d.
vases would rise by 18 and total production of mugs would rise by 25.
271. Refer to Table 3-37. Sarah and Charles are both potters and each can switch between the production of vases and
mugs at a constant rate. The table shows the total number of vases or decorative mugs that each person can produce in a
six-hour session of producing pottery. Sarah and Charles could benefit from trading with each other if they traded at a
price of
a.
5 vases per mug
b.
0.5 mugs per vase
c.
3 mugs per vase
d.
1.5 vases per mug
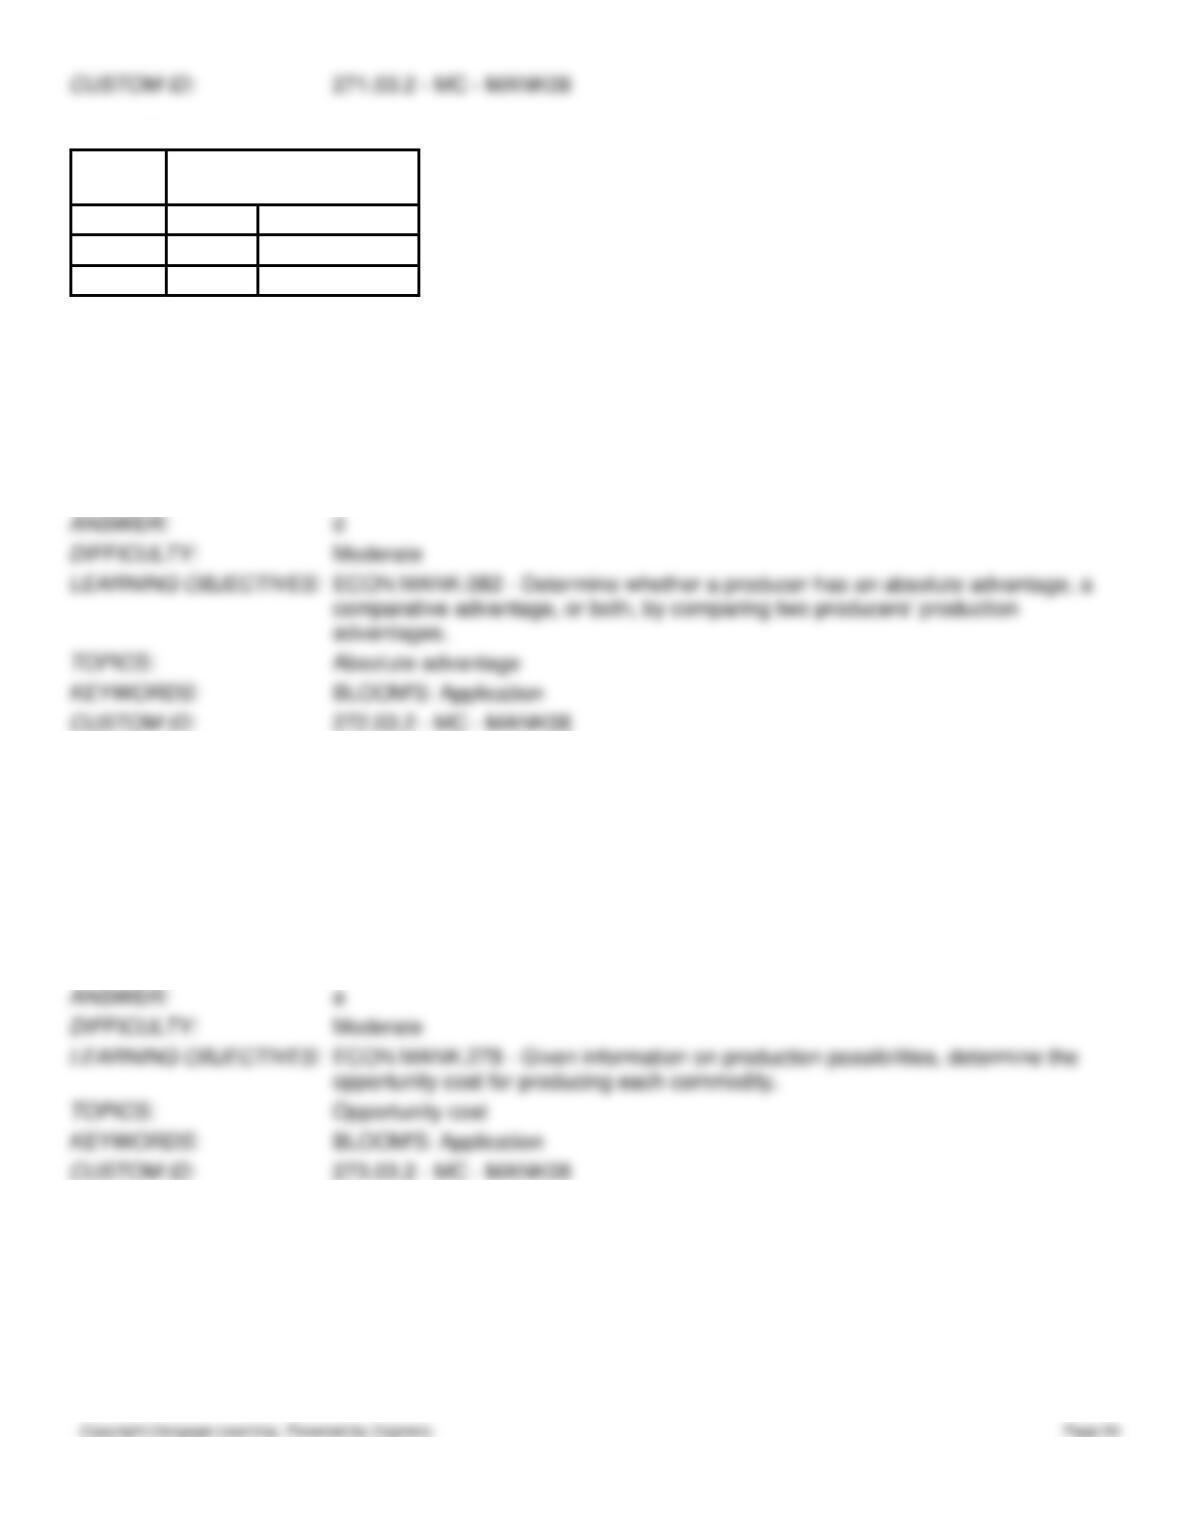
Table 3-38
Output produced in one
growing season
Corn
Soybeans
Iowa
30
45
Nebraska
40
80
272. Refer to Table 3-38. Iowa and Nebraska can both produce corn and soybeans, and can switch between the
production of corn and soybeans at a constant rate. The table illustrates the amount of corn or soybeans each state can
produce in one growing season. Based upon the information in the table, we can determine that
a.
Iowa has an absolute advantage in corn and Nebraska has an absolute advantage in soybeans.
b.
Nebraska has an absolute advantage in corn and Iowa has an absolute advantage in soybeans.
c.
Iowa has an absolute advantage in both corn and soybeans.
d.
Nebraska has an absolute advantage in both corn and soybeans.
273. Refer to Table 3-38. Iowa and Nebraska can both produce corn and soybeans, and can switch between the
production of corn and soybeans at a constant rate. The table illustrates the amount of corn or soybeans each state can
produce in one growing season. Using the information from the table, Iowa’s opportunity cost of producing one bushel of
corn is
a.
1.5 bushels of soybeans and Nebraska’s is 2 bushels of soybeans.
b.
1.5 bushels of soybeans and Nebraska’s is 0.5 bushels of soybeans.
c.
0.67 bushels of soybeans and Nebraska’s is 2 bushels of soybeans.
d.
0.67 bushels of soybeans and Nebraska’s is 0.5 bushels of soybeans.
274. Refer to Table 3-38. Iowa and Nebraska can both produce corn and soybeans, and can switch between the
production of corn and soybeans at a constant rate. The table illustrates the amount of corn or soybeans each state can
produce in one growing season. From the table we know that Iowa has a
a.
comparative advantage in the production of soybeans and Nebraska has a comparative advantage in the
production of corn.
b.
comparative advantage in the production of corn and Nebraska has a comparative advantage in the production
of soybeans.
c.
comparative advantage in both goods and Nebraska has a comparative advantage in neither good.
d.
comparative advantage in neither good and Nebraska has a comparative advantage in both goods.
275. Refer to Table 3-38. Iowa and Nebraska can both produce corn and soybeans, and can switch between the
production of corn and soybeans at a constant rate. The table illustrates the amount of corn or soybeans each state can
produce in one growing season. From the table we know that Nebraska has a
a.
comparative advantage in the production of soybeans and Iowa has a comparative advantage in the production
of corn.
b.
comparative advantage in the production of corn and Iowa has a comparative advantage in the production of
soybeans.
c.
comparative advantage in both goods and Iowa has a comparative advantage in neither good.
d.
comparative advantage in neither good and Iowa has a comparative advantage in both goods.
276. Refer to Table 3-38. Iowa and Nebraska can both produce corn and soybeans, and can switch between the
production of corn and soybeans at a constant rate. The table illustrates the amount of corn or soybeans each state can
produce in one growing season. From this table, we know that Nebraska has an absolute advantage in the production of
a.
corn and a comparative advantage in the production of soybean.
b.
both goods and a comparative advantage in the production of soybeans.
c.
corn and a comparative advantage in the production of corn.
d.
both goods and a comparative advantage in the production of corn.
277. Refer to Table 3-38. Iowa and Nebraska can both produce corn and soybeans, and can switch between the
production of corn and soybeans at a constant rate. The table illustrates the amount of corn and soybeans each state can
produce in one growing season. From this table, we can conclude that Iowa should specialize in the production of
a.
both goods and Nebraska should specialize in the production of neither good.
b.
neither good and Iowa should specialize in the production of both goods.
c.
corn and Nebraska should specialize in the production of soybeans.
d.
soybeans and Nebraska should specialize in the production of corn.
278. Refer to Table 3-38. Iowa and Nebraska can both produce corn and soybeans, and can switch between the
production of corn and soybeans at a constant rate. The table illustrates the amount of corn or soybeans each state can
produce in one growing season. At which of the following prices would both Iowa and Nebraska be able to gain from
trade with each other?
a.
1 bushel of soybeans for 1.7 bushels of corn.
b.
2.5 bushels of soybeans for 1 bushel of corn,
c.
3 bushels of corn for 1 bushel of soybeans.
d.
1.8 bushels of soybeans for 1 bushel of corn.