64. Sheamous loses his job and decides to sit on the beach rather than look for work during the next few months. Other
things the same, the unemployment rate
a.
increases, and the labor-force participation rate decreases.
b.
increases, and the labor-force participation rate is unaffected.
c.
is unaffected, and the labor-force participation rate decreases.
d.
and the labor-force participation rate are both unaffected.
65. Sirius has just finished high school and started looking for his first job, but has not yet found one. Other things the
same, the unemployment rate
a.
and the labor-force participation rate both increase.
b.
increases, and the labor-force participation rate is unaffected.
c.
is unaffected, and the labor-force participation rate increases.
d.
and the labor-force participation rate are both unaffected.
66. If an unemployed person quits looking for work, then, eventually the unemployment rate
a.
decreases, and the labor-force participation rate is unaffected.
b.
and the labor-force participation rate both decrease.
c.
is unaffected, and the labor-force participation rate decreases.
d.
and the labor-force participation rate are both unaffected.
67. President Bigego is running for re-election against Senator Pander. Bigego proclaims that more people are working
now than when he took office. Pander says that the unemployment rate is higher now than when Bigego took office. You
conclude that
a.
one of them must be lying.
b.
both of them could be telling the truth if the labor force, and employment grew at the same rate.
c.
both of them could be telling the truth if the labor force grew slower than employment.
d.
both of them could be telling the truth if the labor force grew faster than employment.
68. Suppose that a well-respected study published in Child Psychology Today finds that a very high proportion of children
raised by stay-at-home fathers are accepted to Harvard University. If a large number of previously working fathers quit
their jobs and become stay-at-home dads, which of the following will occur, all else equal?
(i)
The unemployment rate will decrease.
(ii)
The size of the labor force will decrease.
(iii)
The number of unemployed people will increase.
(iv)
The unemployment rate will increase.
a.
(i) and (ii) only
b.
(ii) and (iv) only
c.
(i), (ii), and (iii) only
d.
(ii), (iii), and (iv) only
69. All else equal, which of the following would increase the unemployment rate?
(i)
an increase in the number of women who return to work after being stay-at-home
mothers
(ii)
a preference among older men to retire early
(iii)
an increase in the maximum number of weeks for which someone can receive
government unemployment benefits
(iv)
an increase in the number of previously unemployed women who stop looking for work
and become discouraged workers
a.
(i) and (ii) only
b.
(iii) only
c.
(ii) and (iii) only
d.
(ii), (iii), and (iv) only
70. Data on the unemployment rate in the U.S. since 1960 show that the unemployment rate is
a.
always zero.
b.
sometimes zero.
c.
rarely zero.
d.
never zero.
71. In June 2009 the Bureau of Labor Statistics reported an adult population of 234.9 million, a labor force of 154 million
and employment of 141.6 million. Based on these numbers the unemployment rate was
a.
93.3/234.9.
b.
12.4/234.9.
c.
93.3/154.
d.
12.4/154.
72. In June 2009 the Bureau of Labor Statistics reported an adult population of 234.9 million, unemployment of 12.4
million, and employment of 141.6 million. Based on these numbers the labor-force participation rate was
a.
154/234.9.
b.
141.6/234.9.
c.
141.6/154.
d.
None of the above is correct.
73. In June 2009 the Bureau of Labor Statistics reported a U.S. foreign-born population of 35.3 million. Of these, 22.7
million were employed and 1.4 million were unemployed. Based on these numbers what were the unemployment rate and
the labor-force participation rate of the foreign-born U.S. population?
a.
1.4/35.3 and 22.7/35.3
b.
1.4/35.3 and 24.1/35.3
c.
1.4/24.1 and 22.7/24.1
d.
None of the above is correct.
74. The adult population in the town of Shelbyville is 150 thousand. If 100 thousand people are employed and 20
thousand are unemployed, then the labor force participation rate is approximately
a.
67%.
b.
80%.
c.
16%.
d.
13%.
75. In 2015 the Japanese adult non-institutionalized population was 110.7 million, the labor force was 66 million, and the
number of people employed was 63.7 million. According to these numbers, the Japanese labor-force participation rate and
unemployment rate were about
a.
57.5% and 2.1%
b.
57.5% and 3.5%
c.
59.6% and 2.1%
d.
59.6% and 3.5%
76. In 2014, the Italian adult non-institutionalized population was 38.8 million, the labor force was 25.4 million, and the
number of people employed was 22 million. According to these numbers, the Italian labor-force participation rate and
unemployment rate were about
a.
65.5% and 13.4%
b.
65.5% and 8.8%
c.
56.7% and 13.4%
d.
56.7% and 8.8%
77. In 2016 based on people ages 15–74 the Swedish adult non-institutionalized population was about 7.3 million, the
labor force was 5.2 million, and the number of people employed was 4.8 million. According to these numbers, the
Swedish labor-force participation rate and unemployment rate were about
a.
71.2% and 7.7%
b.
71.2% and 5.5%
c.
65.8% and 7.7%
d.
65.8% and 5.5%
78. In 2016 the Bureau of Labor Statistics reported that there were 62.2 million people over age 25 whose highest level of
education was a high school degree or equivalent. Of these, 33.7 million were employed and 1.8 million were
unemployed. What were the labor-force participation rate and the unemployment rate for this group?
a.
54.2% and 2.9%
b.
54.2% and 5.1%
c.
57% and 2.9%
d.
57% and 5.1%
79. In 2016 the Bureau of Labor Statistics reported that there were 23.5 million people over age 25 who had no high
school degree or its equivalent. Of these 9.7 million were employed and .75 million were unemployed. What were the
labor-force participation rate and the unemployment rate for this group?
a.
41.3% and 3.2%
b.
41.3% and 7.2%
c.
44.5% and 3.2%
d.
44.5% and 7.2%
80. In 2016 the Bureau of Labor Statistics reported that there were 57.1 million people over age 25 whose highest level of
education was some college or an associate degree. Of these, 36.4 million were employed and 1.5 million were
unemployed. What were the labor-force participation rate and the unemployment rate for this group?
a.
66.4% and 2.6%
b.
66.4% and 4.0%
c.
63.7% and 2.6%
d.
63.7% and 4.0%
81. In 2016 the Bureau of Labor Statistics reported that there were 71.9 million people over age 25 who had at least a
bachelor’s degree. Of these 52.1 million were employed and 1.3 million were unemployed. What were the labor-force
participation rate and the unemployment rate for this group?
a.
72.5% and 1.8%
b.
72.5% and 2.4%
c.
74.3% and 1.8%
d.
74.3% and 2.4%
82. Suppose that the adult population is 4 million, the number of unemployed is 0.25 million, and the labor-force
participation rate is 75%. What is the unemployment rate?
a.
6.25%
b.
8.3%
c.
9.1%
d.
18.75%
83. Suppose that the adult population is 6 million, the number of employed is 3.8 million, and the labor-force participation
rate is 70%. What is the unemployment rate?
a.
6.7%
b.
9.5%
c.
10.5%
d.
28%
84. Suppose that some country had an adult population of about 50 million, a labor-force participation rate of 60 percent,
and an unemployment rate of 5 percent. How many people were employed?
a.
1.5 million
b.
28.5 million
c.
30 million
d.
47.5 million
85. Suppose that some country had an adult population of about 25 million, a labor-force participation rate of 60 percent,
and an unemployment rate of 6 percent. How many people were employed?
a.
0.9 million
b.
14.1 million
c.
15 million
d.
23.5 million
86. Suppose that some country had an adult population of about 46 million, a labor-force participation rate of 75 percent,
and an unemployment rate of 8 percent. How many people were employed?
a.
2.76 million
b.
31.74 million
c.
34.5 million
d.
42.32 million
87. Suppose that some country had an adult population of about 50 million, a labor-force participation rate of 60 percent,
and an unemployment rate of 5 percent. How many people were unemployed?
a.
1.425 million
b.
1.5 million
c.
2.5 million
d.
5 million
88. Suppose that some country had an adult population of about 25 million, a labor-force participation rate of 60 percent,
and an unemployment rate of 6 percent. How many people were unemployed?
a.
0.846 million
b.
0.9 million
c.
1.5 million
d.
6 million
89. Suppose that some country had an adult population of about 46 million, a labor-force participation rate of 75 percent,
and an unemployment rate of 8 percent. How many people were unemployed?
a.
2.54 million
b.
2.76 million
c.
3.68 million
d.
8 million
90. Recent entrants into the labor force account for about
a.
1/5 of those who are unemployed.
b.
1/4 of those who are unemployed.
c.
1/3 of those who are unemployed.
d.
1/2 of those who are unemployed.
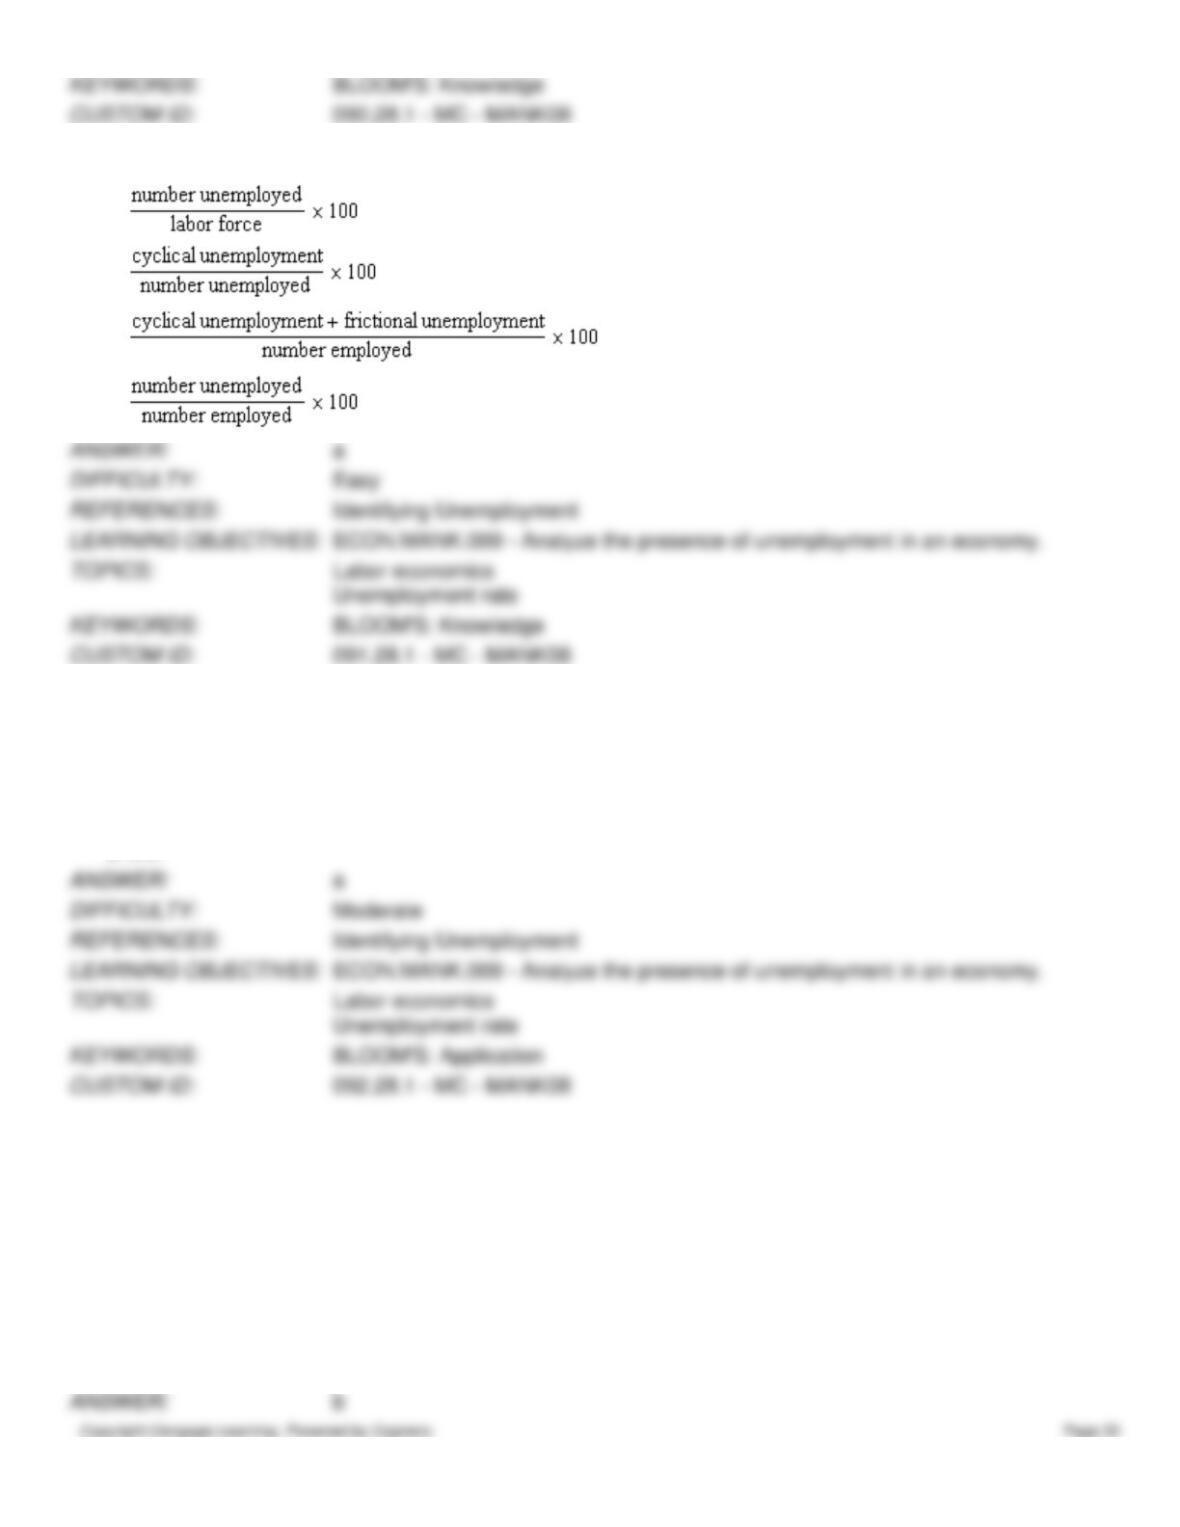
91. Which of the following is the correct formula for calculating the unemployment rate?
a.
b.
c.
d.
92. Suppose that the adult population in some country is 225 million. If 40 million are unemployed and 100 million are
employed, then the unemployment rate is approximately
a.
29%.
b.
18%.
c.
24%.
d.
6%.
Scenario 28-1
Suppose that the Bureau of Labor Statistics reports that the entire adult population of Mankiwland can be categorized as
follows: 25 million people employed, 3 million people unemployed, 1 million discouraged workers, and 1 million people
who are either students, homemakers, retirees, or other people not seeking employment.
93. Refer to Scenario 28–1. What is the total labor force?
a.
25 million
b.
28 million
c.
29 million
d.
30 million
94. Refer to Scenario 28–1. What is the labor-force participation rate?
a.
83.3%
b.
86.7%
c.
93.3%
d.
96.7%
95. Refer to Scenario 28–1. How many people are unemployed?
a.
1 million
b.
3 million
c.
4 million
d.
5 million
96. Refer to Scenario 28–1. What is the unemployment rate?
a.
3.3%
b.
6.7%
c.
10.7%
d.
12%
Table 28-2
Labor Data for Aridia
Year
2010
2011
2012
Adult population
2,000
3,000
3,200
Number of employed
1,400
1,300
1,600
Number of unemployed
200
600
200
97. Refer to Table 28–2. The labor force of Aridia in 2010 was
a.
1,400.
b.
1,600.
c.
1,800.
d.
2,000.
98. Refer to Table 28–2. The labor force of Aridia in 2011 was
a.
1,300.
b.
1,900.
c.
2,400.
d.
3,000.
99. Refer to Table 28–2. The labor force of Aridia in 2012 was
a.
1,600.
b.
1,800.
c.
3,000.
d.
3,200.
100. Refer to Table 28–2. The labor force of Aridia
a.
increased both from 2010 to 2011 and from 2011 to 2012.
b.
increased from 2010 to 2011 but decreased from 2011 to 2012.
c.
decreased from 2010 to 2011 but increased from 2011 to 2012.
d.
decreased both from 2010 to 2011 and from 2011 to 2012.
101. Refer to Table 28–2. The number of adults not in the labor force of Aridia in 2010 was
a.
200.
b.
400.
c.
600.
d.
1,800.
102. Refer to Table 28–2. The number of adults not in the labor force of Aridia in 2011 was
a.
600.
b.
1,100.
c.
1,700.
d.
2,400.
103. Refer to Table 28–2. The number of adults not in the labor force of Aridia in 2012 was
a.
200.
b.
1,400.
c.
1,600.
d.
3,000.
104. Refer to Table 28–2. The number of adults not in the labor force of Aridia
a.
increased both from 2010 to 2011 and from 2011 to 2012.
b.
increased from 2010 to 2011 but decreased from 2011 to 2012.
c.
decreased from 2010 to 2011 but increased from 2011 to 2012.
d.
decreased both from 2010 to 2011 and from 2011 to 2012.
105. Refer to Table 28–2. The unemployment rate in Aridia in 2010 was
a.
10%.
b.
12.5%.
c.
14.3%.
d.
80%.
106. Refer to Table 28–2. The unemployment rate of Aridia in 2011 was
a.
20%.
b.
31.6%.
c.
46.2%.
d.
63.3%.
107. Refer to Table 28–2. The unemployment rate of Aridia in 2012 was
a.
6.25%.
b.
11.1%.
c.
12.5%.
d.
56.25%.
108. Refer to Table 28–2. The unemployment rate of Aridia
a.
increased both from 2010 to 2011 and from 2011 to 2012.
b.
increased from 2010 to 2011 but decreased from 2011 to 2012.
c.
decreased from 2010 to 2011 but increased from 2011 to 2012.
d.
decreased both from 2010 to 2011 and from 2011 to 2012.
109. Refer to Table 28–2. The labor-force participation rate of Aridia in 2010 was
a.
70%.
b.
77.8%.
c.
80%.
d.
87.5%.
110. Refer to Table 28–2. The labor-force participation rate of Aridia in 2011 was
a.
43.3%.
b.
54.2%.
c.
63.3%.
d.
68.4%.
111. Refer to Table 28–2. The labor-force participation rate of Aridia in 2012 was
a.
50%.
b.
53.3%.
c.
56.25%.
d.
88.9%.
112. Refer to Table 28–2. The labor-force participation rate of Aridia
a.
increased both from 2010 to 2011 and from 2011 to 2012.
b.
increased from 2010 to 2011 but decreased from 2011 to 2012.
c.
decreased from 2010 to 2011 but increased from 2011 to 2012.
d.
decreased both from 2010 to 2011 and from 2011 to 2012.
Table 28-3
2009 Labor Data for Baltivia
Number of adults
20,000
Number of adults who are paid employees
8,000
Number of adults who work in their own businesses
1,600
Number of adults who are unpaid workers in a family member’s business
1,000
Number of adults who were temporarily absent from their jobs because of an earthquake
400
Number of adults who were waiting to be recalled to a job from which they had been laid
off
200
Number of adults who do not have a job, are available for work, and have tried to find a
job within the past four weeks
1,400
Number of adults who do not have a job, are available for work, but have not tried to find
a job within the past four weeks
780
Number of adults who are full-time students
3,000
Number of adults who are homemakers or retirees
3,620
113. Refer to Table 28–3. How many people were employed in Baltivia in 2009?
a.
9,600
b.
10,600
c.
11,000
d.
11,200
114. Refer to Table 28–3. How many people were unemployed in Baltivia in 2009?
a.
1,400
b.
1,600
c.
2,000
d.
2,780
115. Refer to Table 28–3. How many people were in Baltivia’s labor force in 2009?
a.
11,000
b.
12,600
c.
13,380
d.
20,000
116. Refer to Table 28–3. How many adults were not in Baltivia’s labor force in 2009?
a.
4,400
b.
6,620
c.
7,400
d.
8,690
117. Refer to Table 28–3. What was Baltivia’s unemployment rate in 2009?
a.
8.0%
b.
12.7%
c.
15.9%
d.
22.1%
118. Refer to Table 28–3. What was Baltivia’s labor-force participation rate in 2009?
a.
55%
b.
63%
c.
66.9%
d.
87.3%
119. According to 2014 data on the U.S. population, which of the following was correct for the adult population of prime
working age, ages 25–54?
a.
Black males had higher labor-force participation rates and lower unemployment rates compared to white
males.
b.
Black males had both higher labor-force participation rates and higher unemployment rates compared to white
males.
c.
Black males had both lower labor-force participation rates and lower unemployment rates compared to white
males.
d.
Black males had lower labor-force participation rates and higher unemployment rates compared to white
males.
120. According to 2014 data on the U.S. population, which of the following was correct for the adult population of prime
working age, ages 25–54?
a.
Black females had higher labor-force participation rates and lower unemployment rates compared to white
females.
b.
Black females had similar labor-force participation rates and higher unemployment rates compared to white
females.
c.
Black females had both lower labor-force participation rates and lower unemployment rates compared to white
females.
d.
Black females had lower labor-force participation rates and higher unemployment rates compared to white
females.
121. According to 2014 data on the U.S. population, which of the following was correct?
a.
Adults of prime working age (ages 25–54) had both higher labor-force participation rates and higher rates of
unemployment compared to teenagers.
b.
Adults of prime working age (ages 25–54) had higher labor-force participation rates and lower rates of
unemployment compared to teenagers.
c.
Adults of prime working age (ages 25–54) had both lower labor-force participation rates and lower rates of
unemployment compared to teenagers.
d.
Adults of prime working age (ages 25–54) had lower labor-force participation rates and higher rates of
unemployment compared to teenagers.
122. According to 2014 data on the U.S. population, which of the following groups of adults of prime working age (ages
25–54) had the highest labor-force participation rate?
a.
white males
b.
white females
c.
black males
d.
black females
123. According to 2014 data on the U.S. population, which of the following groups of adults of prime working age (ages
25–54) had the lowest labor-force participation rate?
a.
white males
b.
white females
c.
black males
d.
black females
124. According to 2014 data on the U.S. population, which of the following groups of adults of prime working age (ages
25–54) had the highest unemployment rate?
a.
white males