202. Refer to Figure 2-7. What is the opportunity cost of moving from point M to point L?
a.
zero
b.
15 tvs
c.
20 engines and 15 tvs
d.
20 engines
Figure 2-8
203. Refer to Figure 2-8. Point K represents an outcome in which
a.
production is inefficient.
b.
some of the economy’s resources are unemployed.
c.
the economy is using all of its resources to produce hammers.
d.
the economy is using all of its nails to produce hammers.
204. Refer to Figure 2-8. Which point on the graph best represents the fact that, because resources are scarce, not every
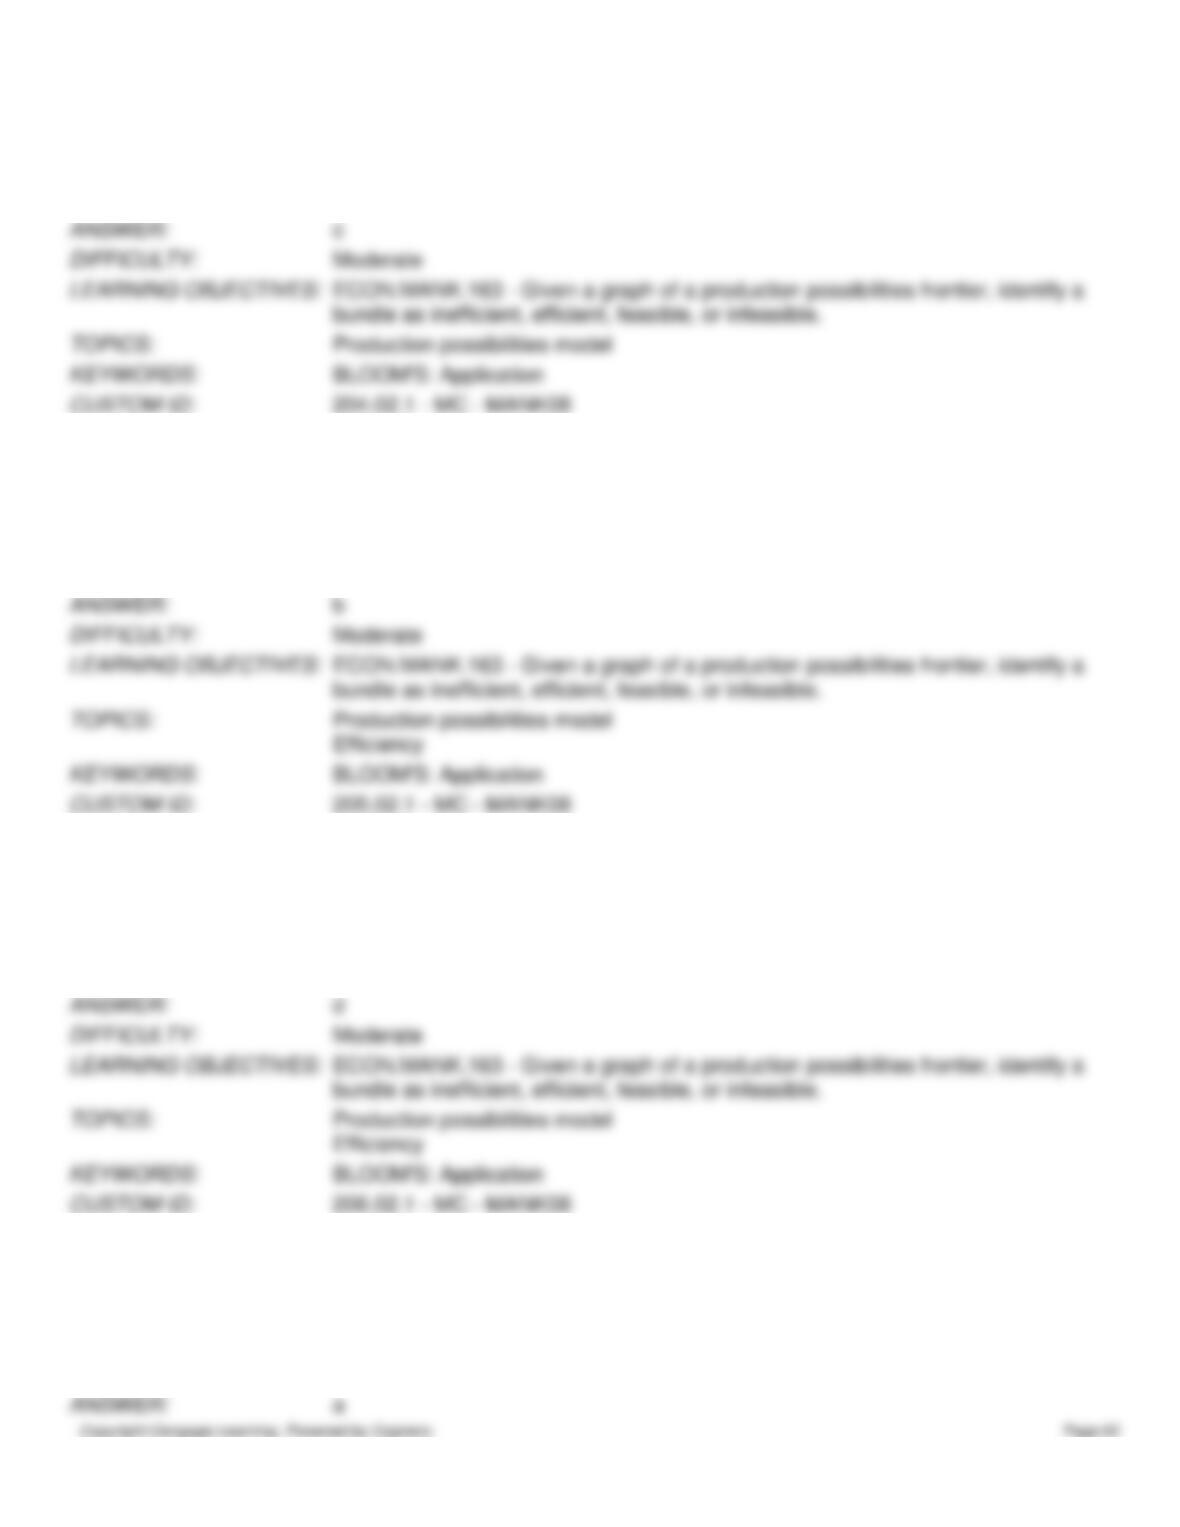
conceivable outcome is feasible?
a.
point J
b.
point K
c.
point L
d.
point M
205. Refer to Figure 2-8. Efficient production is represented by which point(s)?
a.
J
b.
J, K
c.
J, K, L
d.
J, K, M
206. Refer to Figure 2-8. Inefficient production is represented by which point(s)?
a.
K, M
b.
L
c.
L, M
d.
M
207. Refer to Figure 2-8. To reach point L, the economy would have to
a.
acquire more resources or experience a technological advance.
b.
begin using its available resources more efficiently than it is currently using them.
c.
shift resources away from the production of nails and toward the production of hammers.
d.
None of the above are correct; the economy will never be able to reach point L.
208. Refer to Figure 2-8. For this economy, as more and more hammers are produced, the opportunity cost of an
additional hammer produced, in terms of nails,
a.
remains constant.
b.
increases.
c.
decreases.
d.
This answer cannot be determined from the graph.
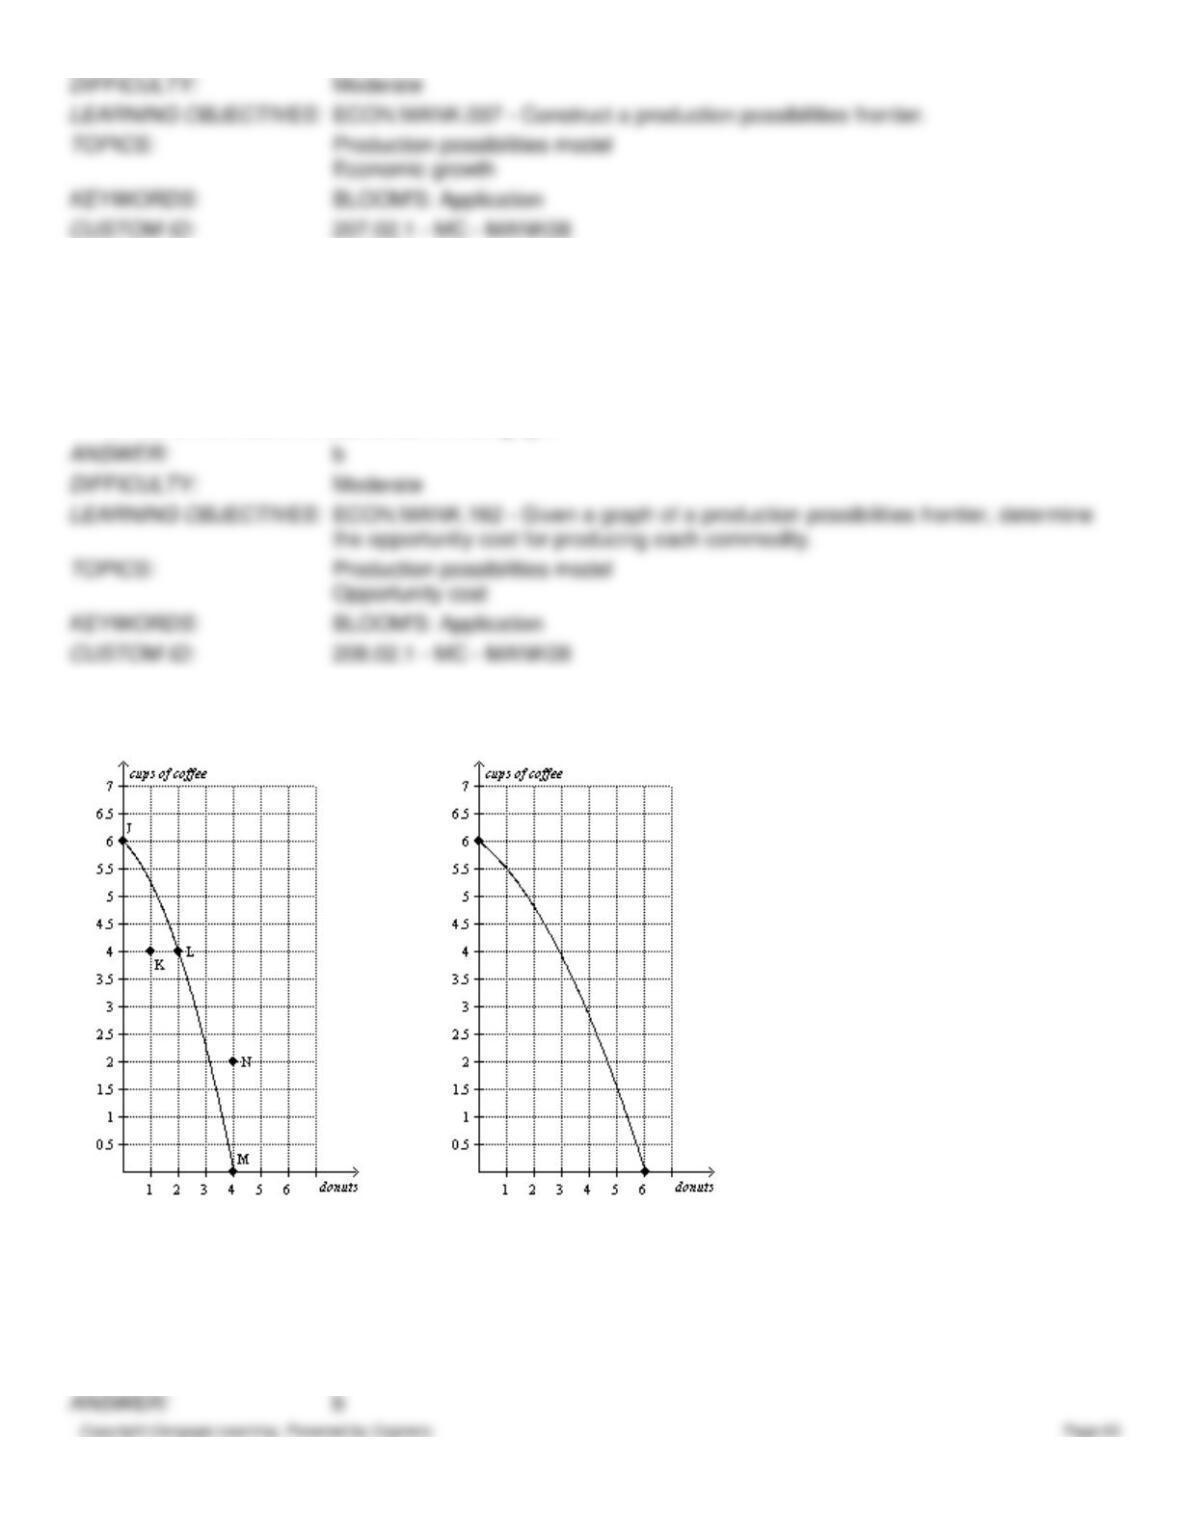
Figure 2-9
Panel (a)
Panel (b)
209. Refer to Figure 2-9, Panel (a). Production at point K is
a.
possible and efficient.
b.
possible but inefficient.
c.
impossible but efficient.
d.
impossible and inefficient.
210. Refer to Figure 2-9, Panel (a). Production is
a.
possible at points J, K, L, and M, but efficient only at points J, L, and M.
b.
possible at points J, K, L, and M, but efficient only at point K.
c.
possible at points J, L, M, and N, but efficient only at points J, L, and M.
d.
possible at points J, L, M, and N, but efficient only at point N.
211. Refer to Figure 2-9, Panel (a). The movement from point M to point K could be caused by
a.
an advance in production technology.
b.
an improvement in efficiency.
c.
economic growth.
d.
unemployment.
212. Refer to Figure 2-9, Panel (a). The opportunity cost of moving from point J to point L is
a.
2 donuts.
b.
2 donuts and 2 cups of coffee.
c.
2 cups of coffee.
d.
6 cups of coffee.
213. Refer to Figure 2-9, Panel (a). The opportunity cost of moving from point M to point L is
a.
2 donuts.
b.
2 donuts and 4 cups of coffee.
c.
4 donuts.
d.
4 cups of coffee.
214. Refer to Figure 2-9, Panel (a). The opportunity cost of moving from point K to point L is
a.
0 cups of coffee.
b.
1 donut.
c.
2 donuts.
d.
4 cups of coffee.
215. Refer to Figure 2-9, Panel (a). The opportunity cost of one cup of coffee is highest when the economy produces
a.
0 cups of coffee.
b.
2 cups of coffee.
c.
4 cups of coffee.
d.
6 cups of coffee.
216. Refer to Figure 2-9, Panel (a). To gain 2 donuts by moving from point L to point M, society must sacrifice
a.
efficiency.
b.
employment.
c.
4 cups of coffee.
d.
More than one of the above is correct.
217. Refer to Figure 2-9, Panel (a) and Panel (b). A shift of the economy’s production possibilities frontier from Panel
(a) to Panel (b) could be caused by
a.
unemployment.
b.
an improvement in donut production technology.
c.
an improvement in coffee production technology.
d.
an improvement in both donut and coffee production technology.
218. Refer to Figure 2-9, Panel (a) and Panel (b). Which of the following is not a result of the shift of the economy’s
production possibilities frontier from Panel (a) to Panel (b)?
a.
the tradeoff between the production of donuts and coffee changes
b.
the opportunity cost of a cup of coffee is higher at all levels of coffee production
c.
production of 4 donuts and 2 cups of coffee becomes possible
d.
production of 1 donut and 4 cups of coffee becomes efficient
Figure 2-10
Panel (a)
Panel (b)
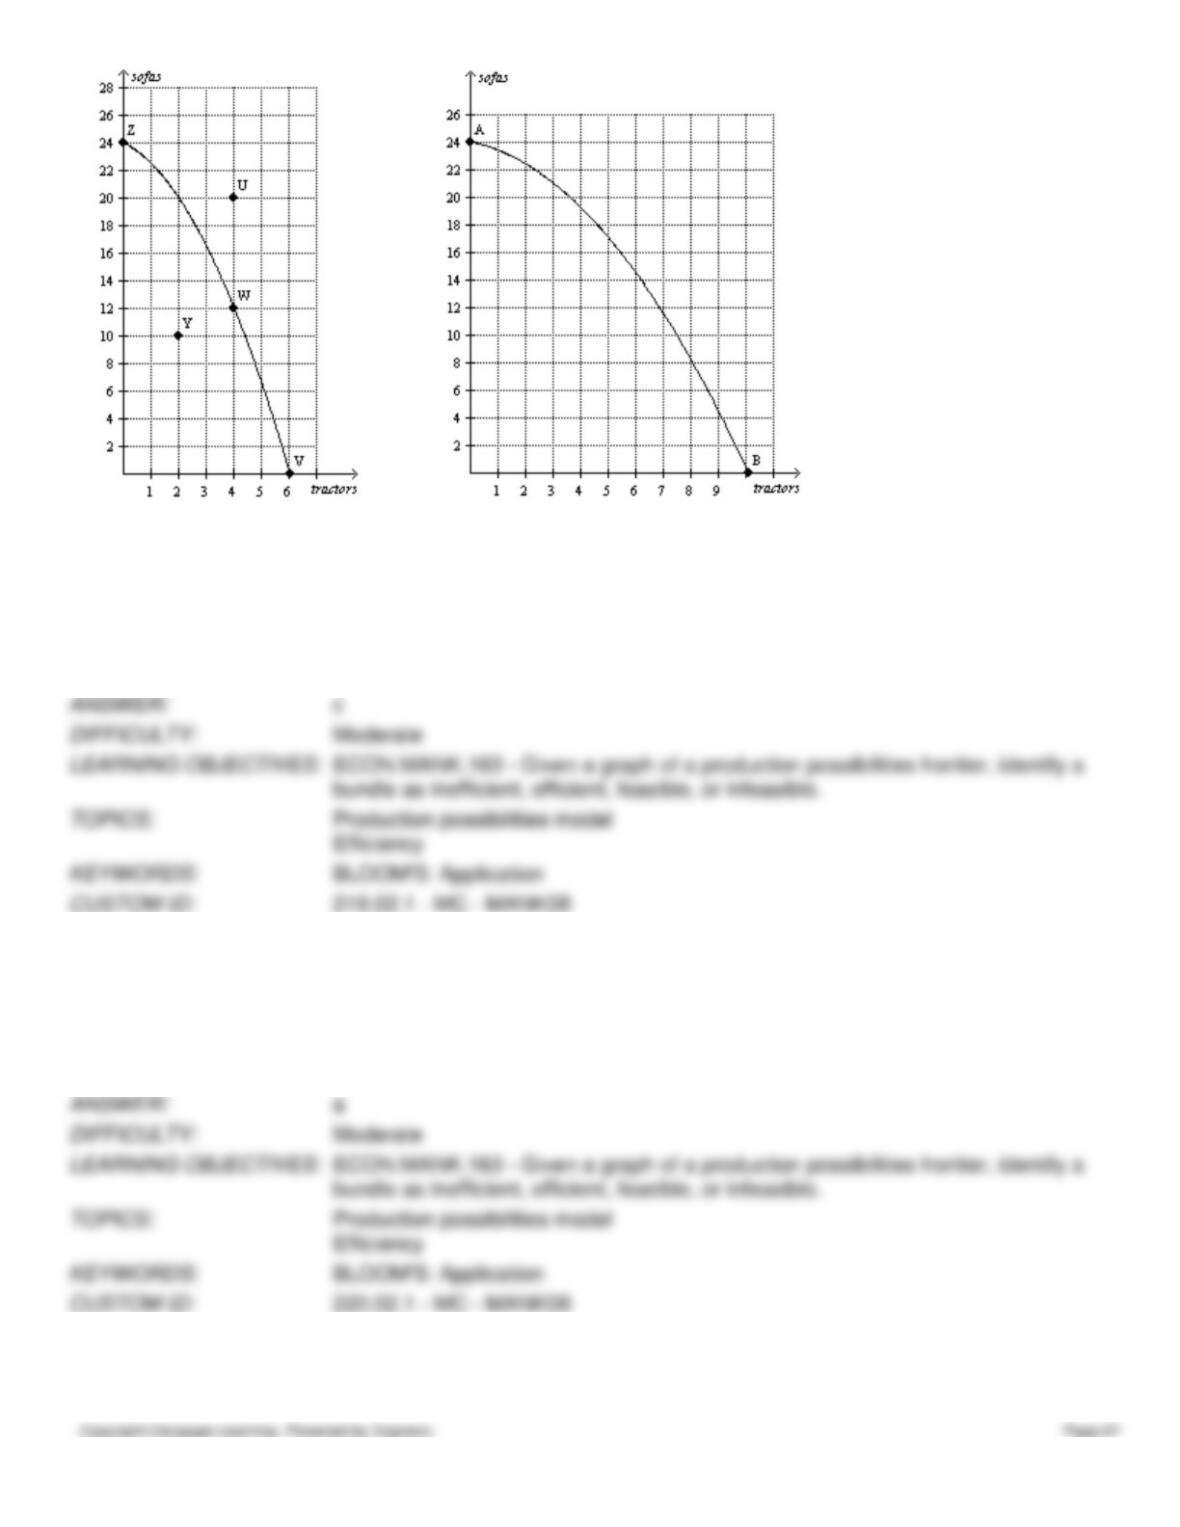
219. Refer to Figure 2-10, Panel (a). Production at point Y is
a.
impossible and inefficient.
b.
impossible but efficient.
c.
possible but inefficient.
d.
possible and efficient.
220. Refer to Figure 2-10, Panel (a). Production is
a.
possible at points V, W, Y, and Z, but efficient only at points V, W, and Z.
b.
possible at points V, W, Y, and Z, but efficient only at point Y.
c.
possible at points U, V, W, and Z, but efficient only at points V, W, and Z.
d.
possible at points U, V, W, and Z, but efficient only at point U.
221. Refer to Figure 2-10, Panel (a). The movement from point W to point Y could be caused by
a.
economic growth.
b.
unemployment.
c.
an improvement in efficiency.
d.
an advance in production technology.
222. Refer to Figure 2-10, Panel (a). The opportunity cost of one sofa is highest when the economy produces
a.
0 sofas.
b.
12 sofas.
c.
20 sofas.
d.
24 sofas.
223. Refer to Figure 2-10, Panel (a). To gain 2 tractors by moving from point W to point V, society must sacrifice
a.
12 sofas.
b.
employment.
c.
efficiency.
d.
More than one of the above is correct.
224. Refer to Figure 2-10, Panel (a) and Panel (b). A shift of the economy’s production possibilities frontier from Panel
(a) to Panel (b) could be caused by
a.
unemployment.
b.
an improvement in sofa production technology.
c.
an improvement in tractor production technology.
d.
an improvement in both sofa and tractor production technology.
225. Refer to Figure 2-10, Panel (a) and Panel (b). Which of the following is not a result of the shift of the economy’s
production possibilities frontier from Panel (a) to Panel (b)?
a.
The tradeoff between the production of tractors and sofas changes.
b.
Production of 2 tractors and 10 sofas becomes efficient.
c.
Production of 6 tractors and 14 sofas becomes possible.
d.
The opportunity cost of a sofa is higher at all levels of sofa production.
Figure 2-11
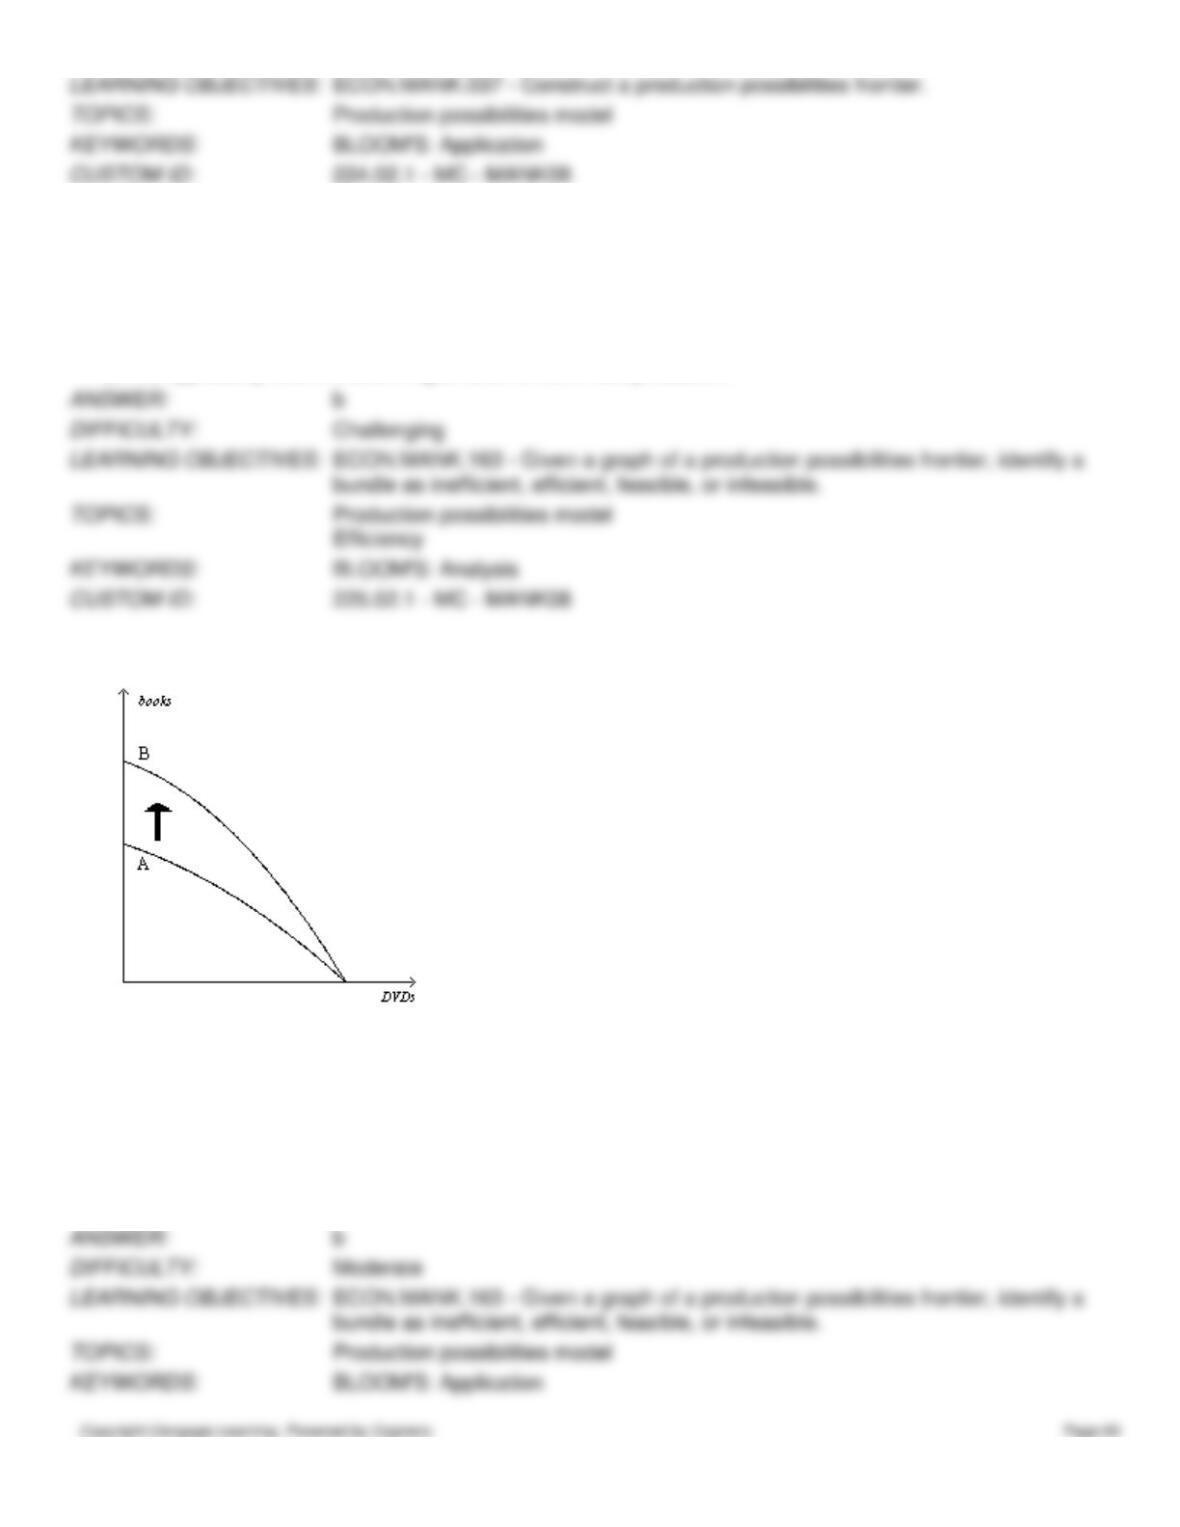
226. Refer to Figure 2-11. Which of the following events would explain the shift of the production possibilities frontier
from A to B?
a.
The economy’s citizens developed an enhanced taste for books.
b.
The economy experienced a technological advance in the production of books.
c.
More capital became available in the economy.
d.
More labor became available in the economy.
227. Refer to Figure 2-11. The shift of the production possibilities frontier from A to B illustrates
a.
simultaneous technological advances in the book and DVD industries.
b.
a reallocation of resources away from the production of DVDs and toward the production of books.
c.
economic growth.
d.
All of the above are correct.
Figure 2-12
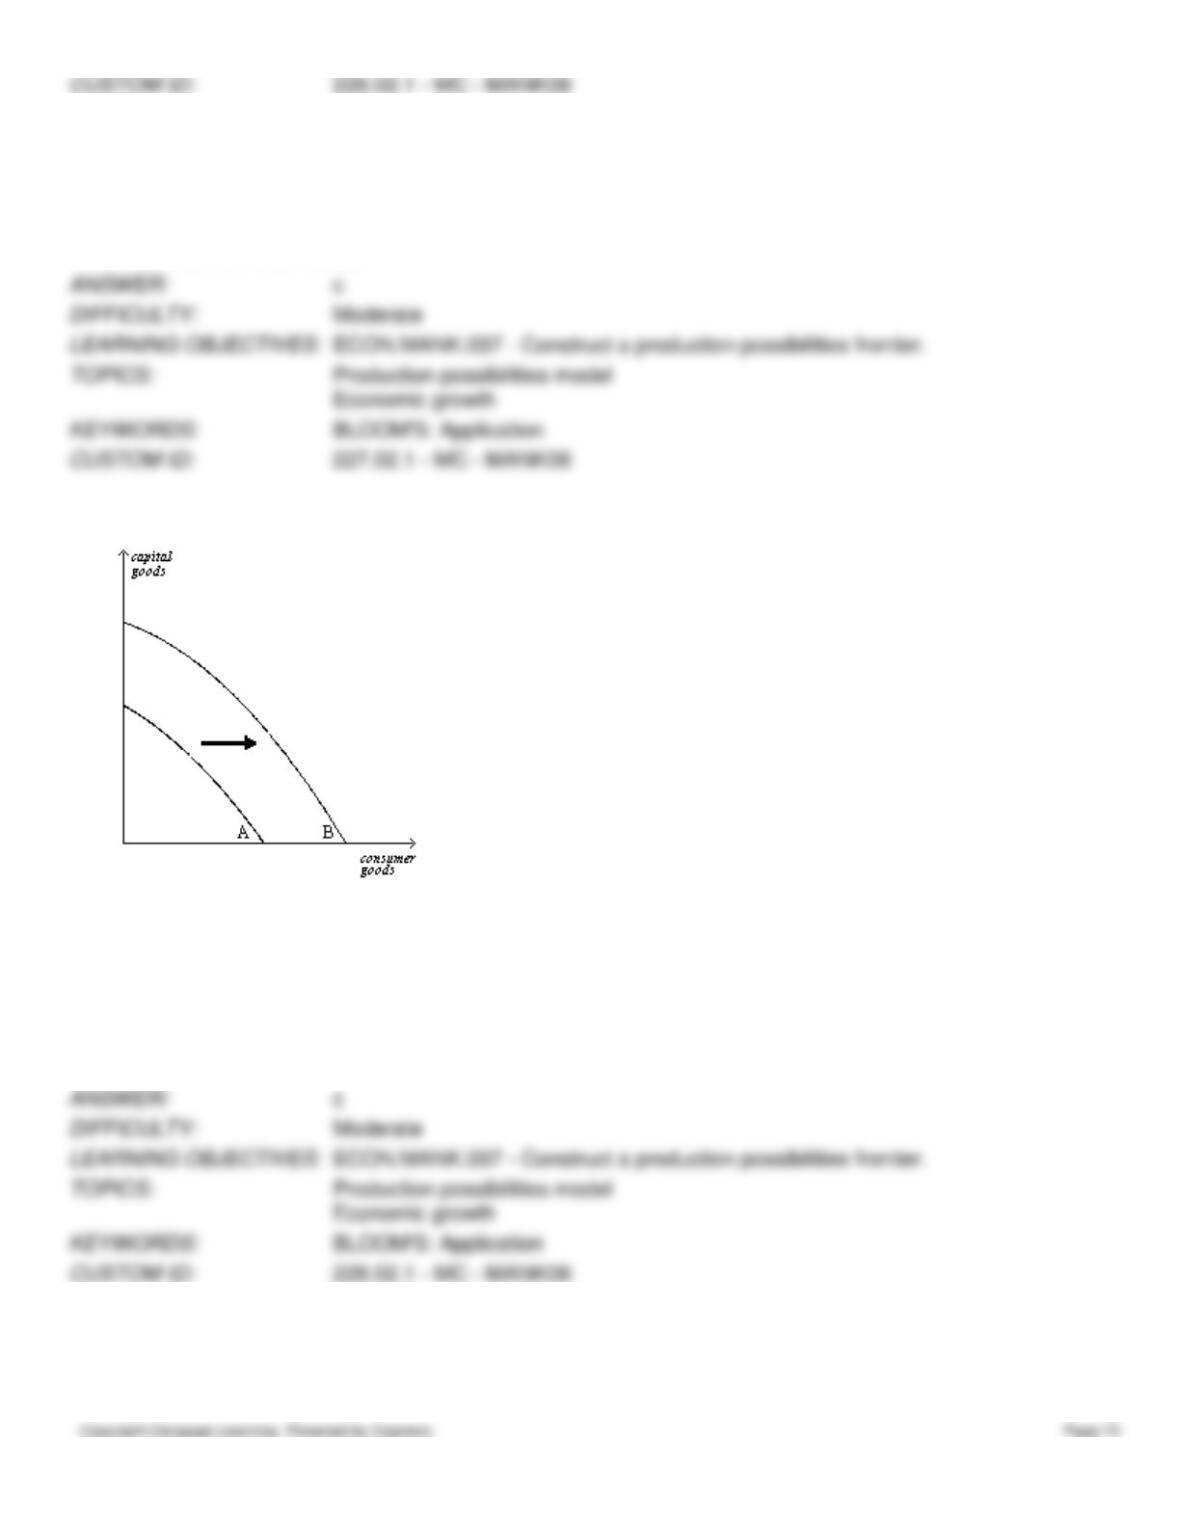
228. Refer to Figure 2-12. Which of the following would most likely have caused the production possibilities frontier to
shift outward from A to B?
a.
a decrease in unemployment
b.
a technological advance in the consumer goods industries
c.
a general technological advance
d.
an increase in the availability of capital-producing resources
229. Refer to Figure 2-12. The shift of the production possibilities frontier from A to B can best be described as
a.
a downturn in the economy.
b.
economic growth.
c.
an enhancement of equality.
d.
an improvement in the allocation of resources.
Figure 2-13
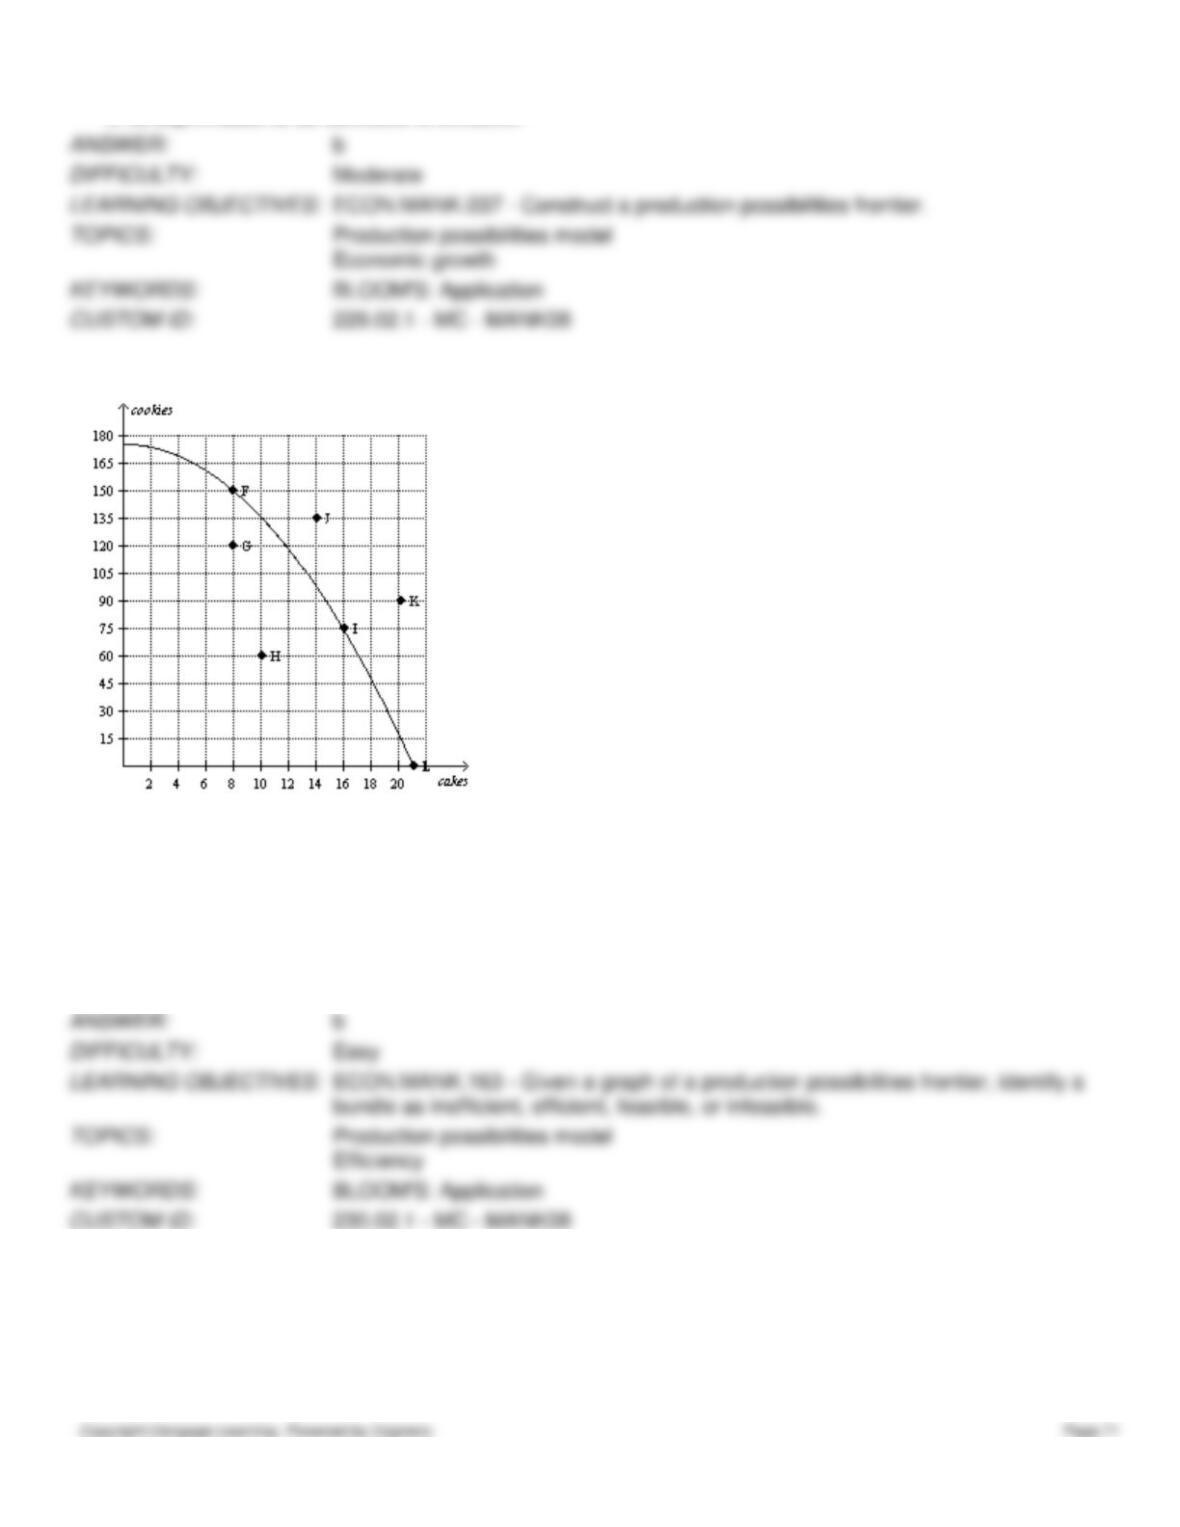
230. Refer to Figure 2-13. Which of the following combinations of points are both efficient and attainable for this
economy?
a.
G, H
b.
F, I, L
c.
F, G, H, I, L
d.
J, K
231. Refer to Figure 2-13. Which of the following statements is true about point G for this economy?
a.
Point G is currently unattainable.
b.
Point G is efficient.
c.
At point G, more cakes are produced than cookies.
d.
There is unemployment at point G.
232. Refer to Figure 2-13. Which points are not currently attainable but could become achievable for this economy if
there is an improvement in technology?
a.
I, L
b.
G, H
c.
J, K
d.
F, G
233. Refer to Figure 2-13. One difference between points F and G is that
a.
Point G is unattainable with current resources, but point F is attainable.
b.
All resources are fully employed at point F but there is unemployment at point G.
c.
More output can be produced at point F but no additional output can be produced at point G.
d.
This economy produces more cookies at point G than at point F.
Table 2-5
Corn (in bushels)
Wheat (in bushels)
2000
0
1600
700
1200
1300
800
1800
400
2200
0
2500
234. Refer to Table 2-5. Table 2-5 shows one set of production possibilities. What is the opportunity cost of increasing
the production of corn from 400 bushels to 800 bushels?
a.
200 bushels of wheat
b.
400 bushels of wheat
c.
600 bushels of wheat
d.
800 bushels of wheat
235. Refer to Table 2-5. Table 2-5 shows one set of production possibilities. What is the opportunity cost of an increase
in the production of wheat from 700 bushels to 1300 bushels?
a.
800 bushels of corn
b.
600 bushels of corn
c.
400 bushels of corn
d.
400 bushels of wheat
236. Refer to Table 2-5. Table 2-5 shows one set of production possibilities. Which of the following statements is
correct?
a.
The opportunity cost of a bushel of corn does not depend on how many bushels of wheat are being produced.
b.
The opportunity cost of a bushel of corn increases as more corn is produced.
c.
The opportunity cost of a bushel of corn decreases as more corn is produced.
d.
The opportunity cost of a bushel of wheat decreases as more wheat is produced.
237. Refer to Table 2-5. Table 2-5 shows one set of production possibilities. Based on the values in the table, the
production possibilities frontier is
a.
bowed outward indicating increasing opportunity costs.
b.
bowed outward indicating decreasing opportunity costs.
c.
a straight line indicating constant opportunity costs.
d.
bowed inward indicating increasing opportunity costs.