41. The slope of a line is equal to
a.
the change in the value of x divided by the change in the value of y.
b.
the change in the value of y divided by the change in the value of x.
c.
the horizontal distance divided by the vertical distance.
d.
the value of y divided by the value of x.
42. The slope of a line is equal to
a.
rise divided by run.
b.
run divided by rise.
c.
rise minus run.
d.
rise plus run.
43. Which of the following is not correct?
a.
The slope of a line will be a small positive number for a fairly flat upward-sloping line.
b.
The slope of a line will be a large positive number for a steep upward-sloping line.
c.
The slope of a line will be a negative number for a downward-sloping line.
d.
The slope of a line will be infinite for a horizontal line.
44. Which of the following is correct?
a.
A horizontal line has an infinite slope, and a vertical line has a zero slope.
b.
A horizontal line has a slope of 1, and a vertical line has a slope of –1.
c.
A horizontal line has a zero slope, and a vertical line has an infinite slope.
d.
A horizontal line has a slope of –1, and a vertical line has a slope of 1.
45. The slope of a fairly flat upward-sloping line will be a
a.
small positive number.
b.
large positive number.
c.
small negative number.
d.
large negative number.
46. The slope of a steep upward-sloping line will be a
a.
small positive number.
b.
large positive number.
c.
small negative number.
d.
large negative number.
47. The slope of a line that passes through the points (20, 30) and (40, 14) is
a.
-5/4.
b.
-4/5.
c.
4/5.
d.
5/4.
48. The slope of a line that passes through the points (5, 8) and (12, 12) is
a.
-7/4.
b.
-4/7.
c.
4/7.
d.
7/4.
49. The slope of a line passing through the points (15, 3) and (10, 6) is
a.
-3/5.
b.
3/5.
c.
-5/3.
d.
5/3.
50. A relatively steep demand curve indicates that
a.
quantity demanded will adjust only slightly to a price change.
b.
quantity demanded will adjust significantly to a price change.
c.
quantity demanded will not adjust to a price change.
d.
the change in quantity demanded will exactly equal a change in price.
51. A relatively flat demand curve indicates that
a.
quantity demanded will adjust only slightly to a price change.
b.
quantity demanded will adjust significantly to a price change.
c.
quantity demanded will not adjust to a price change.
d.
the change in quantity demanded will exactly equal a change in price.
52. When income increases the slope of an individual’s demand curve, the demand curve
a.
turns positive.
b.
becomes undefined.
c.
remains negative.
d.
becomes infinite.
Figure 2-18
Relationship between Price and Restaurant Meals
53. Refer to Figure 2-18. In the ordered pair (8, 24)
a.
the x-coordinate is 8 and the y-coordinate is 24.
b.
the x-coordinate is 24 and the y-coordinate is 8.
c.
the numbers tell the location of the origin.
d.
the 8 represents the price and the 24 represents the number of restaurant meals.
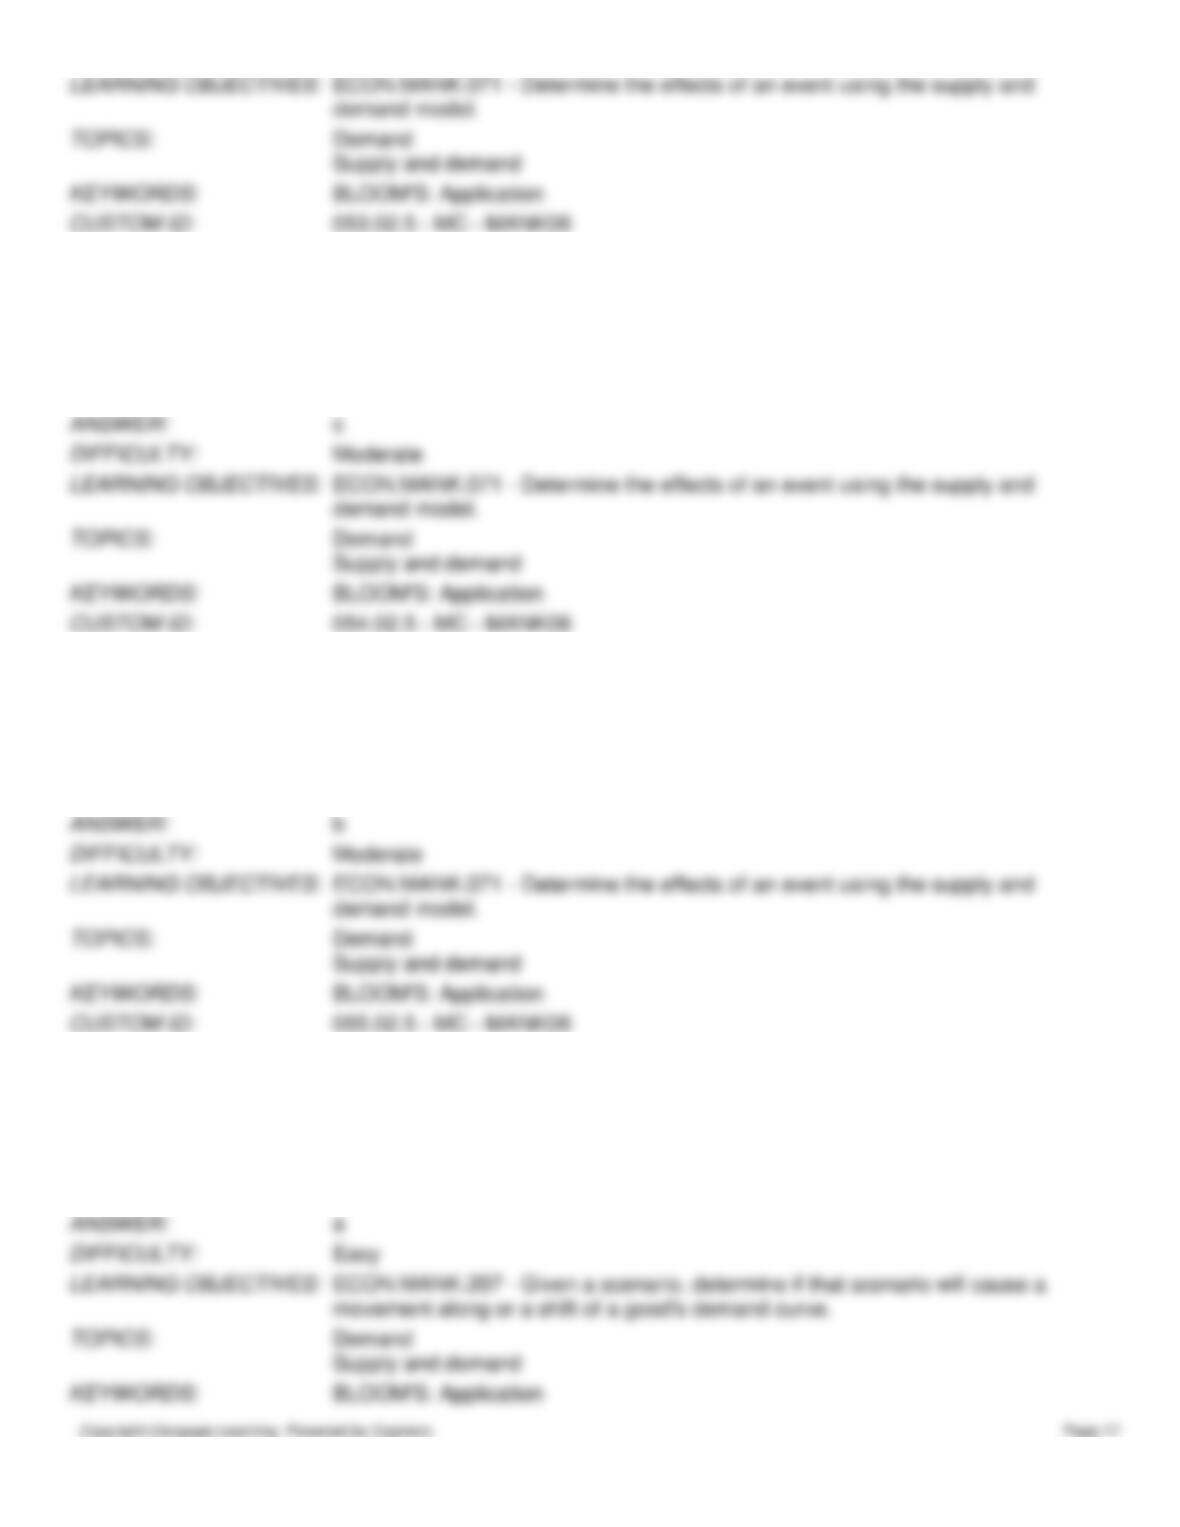
54. Refer to Figure 2-18. The slope of the line containing points Y and Z is
a.
-0.5.
b.
–1.
c.
–2.
d.
–4.
55. Refer to Figure 2-18. The slope of the line containing points A and B is
a.
-1/2.
b.
–2.
c.
1/2.
d.
2.
56. Refer to Figure 2-18. A movement from point A to point Z is called
a.
a shift in demand.
b.
a movement along the demand curve.
c.
a shift in supply.
d.
a movement along the supply curve.
57. Refer to Figure 2-18. A movement from point A to point B is called
a.
a shift in demand.
b.
a movement along the demand curve.
c.
a shift in supply.
d.
a movement along the supply curve.
58. Refer to Figure 2-18. Which of the following could result in a movement from point A to point B?
a.
a change in income
b.
a change in the cost of producing a restaurant meal
c.
a change in the price of restaurant meals
d.
a change in the price of movies
59. Refer to Figure 2-18. Which of the following could result in a movement from point B to point Z?
a.
a change in the price of a restaurant meal
b.
a change in the number of restaurant meals demanded
c.
a change in income
d.
Both a and b are correct.
60. Suppose that someone makes the argument that because empty alcohol containers are found at many accidents, the
containers cause accidents. This would be an example of
a.
sound logic.
b.
reverse causality.
c.
omitted variables.
d.
bias.
61. Alfonso has noticed that increases in unemployment insurance claims are associated with recessions, and therefore he
advocates limits on unemployment insurance so as to prevent recessions. Mary has noticed that most drug addicts once
attended schools, and therefore she advocates getting rid of schools so as to prevent drug addiction.
a.
The reasoning of both Alfonso and Mary suffers from the omitted variable problem.
b.
The reasoning of both Alfonso and Mary suffers from the reverse causality problem.
c.
Alfonso’s reasoning suffers from the reverse causality problem, and Mary’s reasoning suffers from the omitted
variable problem.
d.
Mary’s reasoning suffers from the reverse causality problem, and Alfonso’s reasoning suffers from the omitted
variable problem.
62. In the early 19th century, the Russian government sent doctors to southern Russian villages to provide assistance
during a cholera epidemic. The villagers noticed that wherever doctors appeared, people died. Therefore, many doctors
were chased away from villages, and some were even killed. This reaction to the correlation between doctors and deaths is
most likely a problem of
a.
omitted variables.
b.
reverse causality.
c.
government propaganda.
d.
medical incompetence.
63. The argument that purchases of minivans cause large families is an example of
a.
omitted variables.
b.
normative statements.
c.
reverse causality.
d.
bias.
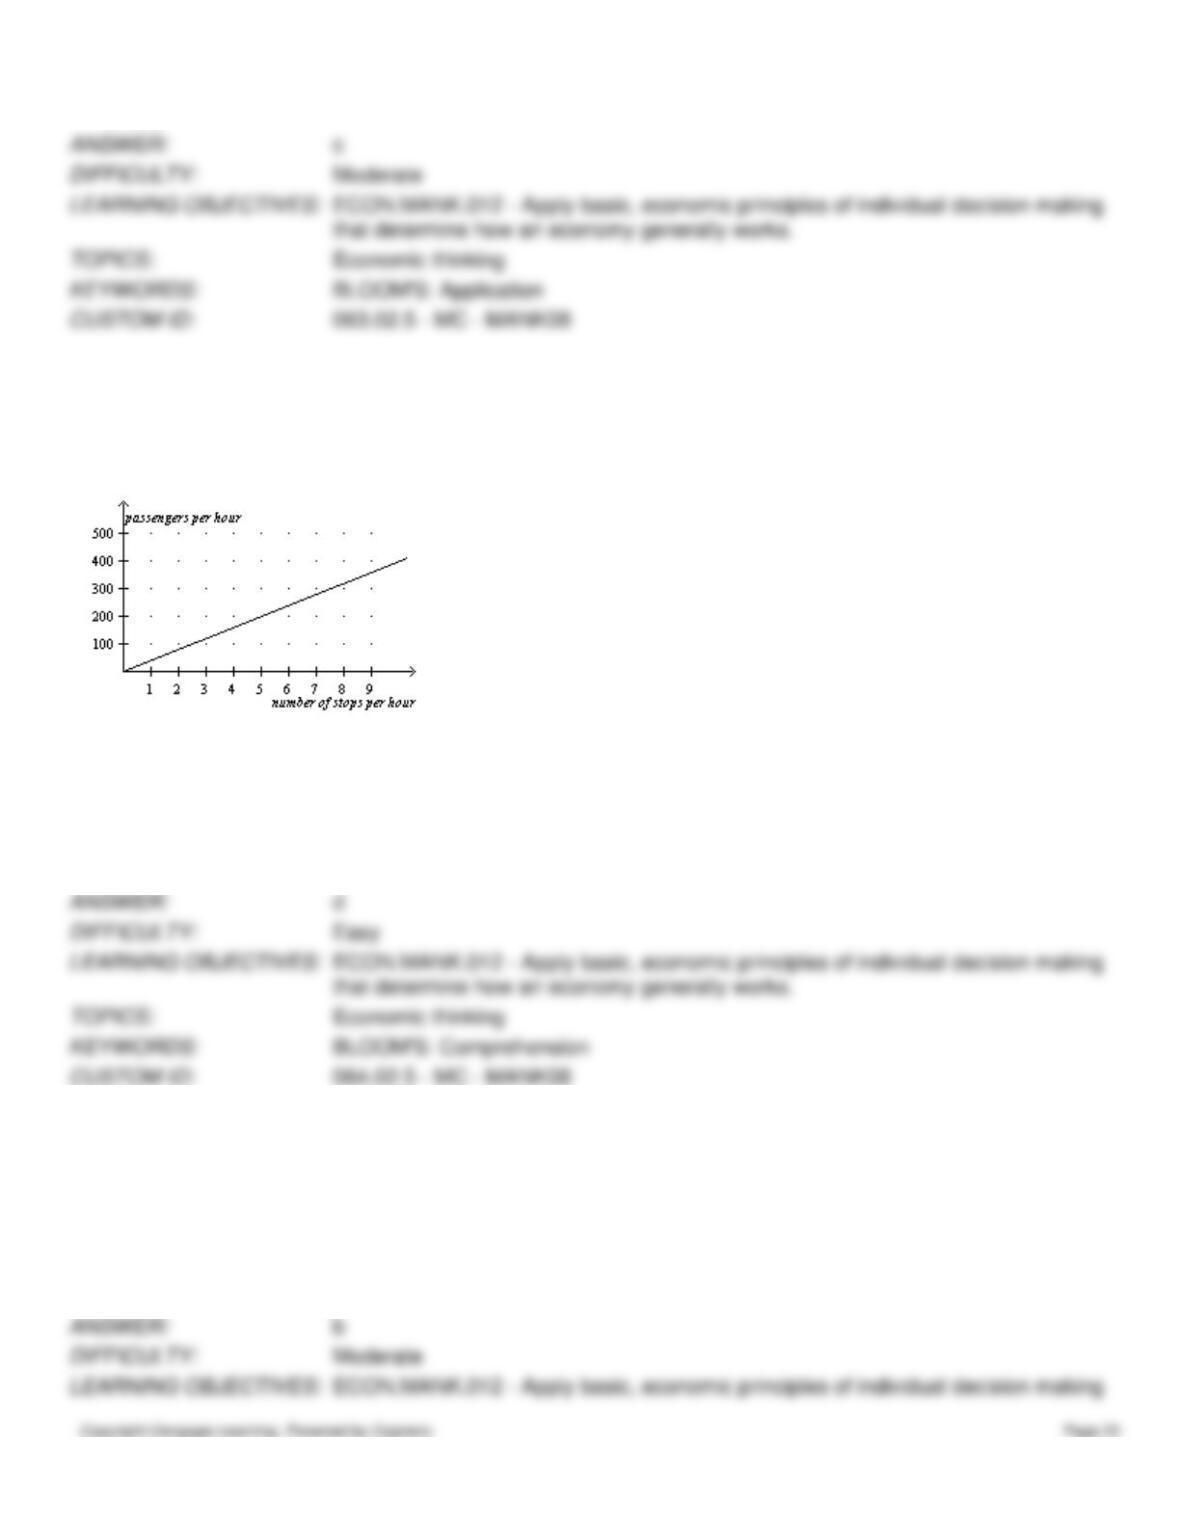
Figure 2-19
In the following graph the x-axis shows the number of times a commuter rail train stops at a station per hour and the y-
axis shows the number of commuter rail passengers per hour.
Commuter Rail Passengers by Frequency of Service
64. Refer to Figure 2-19. Which of the following conclusions should not be drawn from observing this graph?
a.
There is a positive correlation between the frequency of service and the number of passengers.
b.
When there are 5 stops per hour, there are approximately 200 passengers.
c.
More stops per hour is associated with more passengers per hour.
d.
No other factors besides the frequency of service affect the number of passengers.
65. Refer to Figure 2-19. A policymaker observes this graph and concludes that increasing the frequency of commuter
rail service is a certain way to get more commuters to choose the commuter rail instead of driving their own cars. You
warn the policymaker about making a reverse causality mistake with which of the following statements?
a.
Higher gas prices are causing more people to choose the commuter rail over driving.
b.
The service frequency was increased in response to an increase in the number of passengers per hour.
c.
There is a positive relationship between frequency of stops and number of passengers.
d.
None of the above is correct.
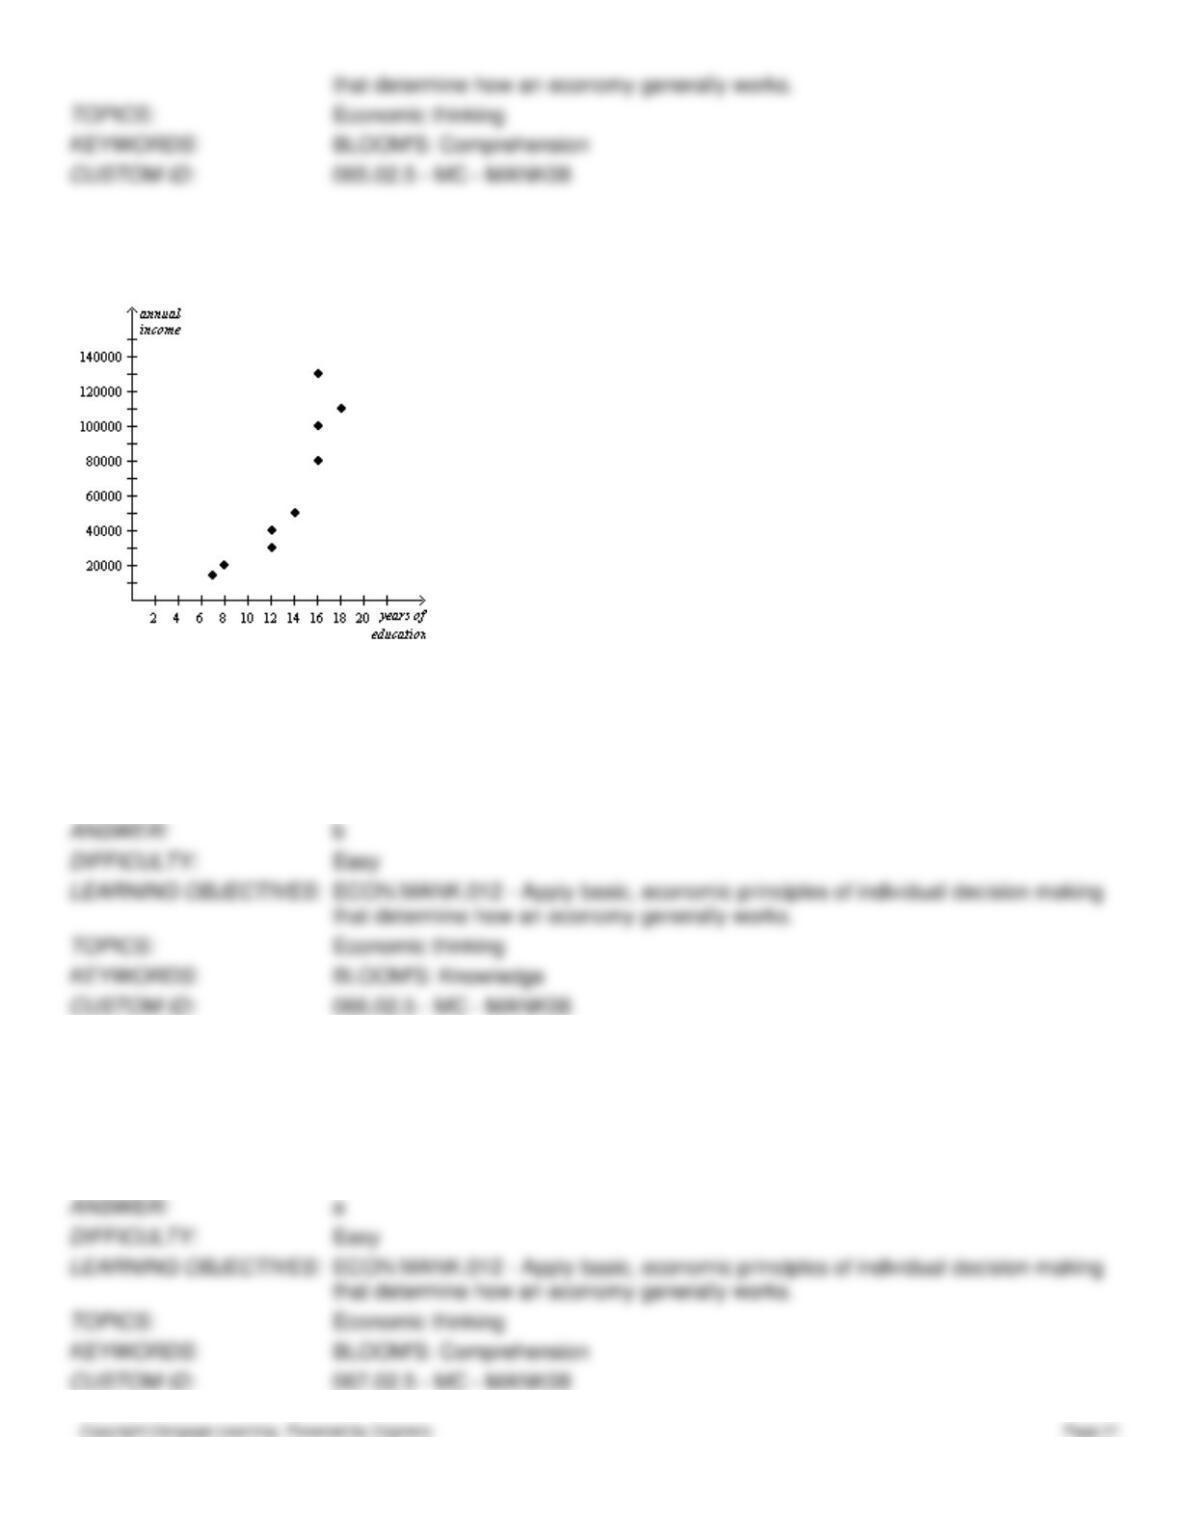
Figure 2-20
Relationship Between Years of Education and Annual Income
66. Refer to Figure 2-20. The graph above is a
a.
bar graph
b.
scatterplot
c.
pie chart
d.
time series analysis
67. Refer to Figure 2-20. According to the graph, the correlation between years of education and annual income is
a.
positive
b.
negative
c.
inverse
d.
normative
68. Refer to Figure 2-20. Senator Smith observes the graph and concludes that people who earn higher incomes attend
school for more years. Senator Jones observes the graph and concludes that people who attend school for more years earn
higher incomes. Who is correct?
a.
Senator Smith is correct.
b.
Senator Jones is correct.
c.
It is difficult to say which senator might be correct due to the reverse causality problem.
d.
It is difficult to say which senator might be correct due to omitted variable bias.
69. In the ordered pair (3, 6), 3 is the
a.
x-coordinate.
b.
y-coordinate.
c.
origin.
d.
slope.
70. Between the two ordered pairs (3, 6) and (7, 18), the slope is
a.
1/3
b.
-1/3.
c.
3.
d.
–3.
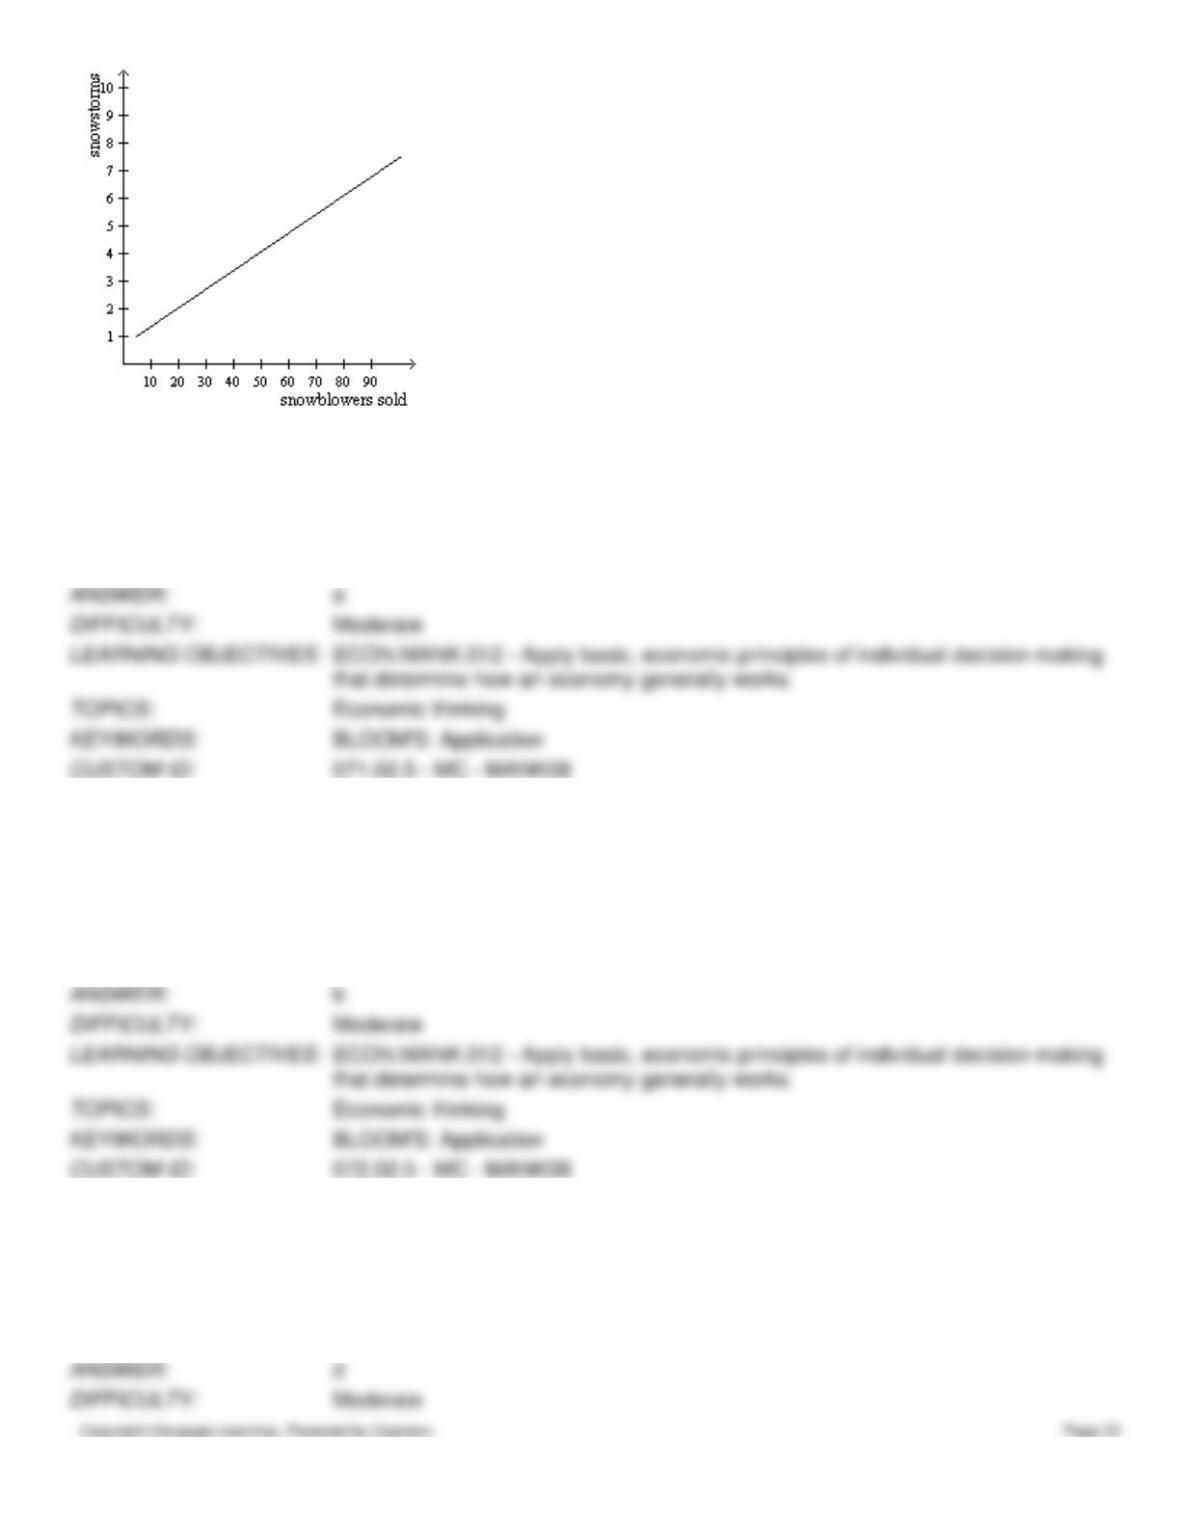
71. Refer to Figure 2-21. According to the graph, snowstorms
a.
and snowblowers sold are positively correlated.
b.
and snowblowers sold are negatively correlated
c.
and snowblowers sold are uncorrelated.
d.
are caused by more snowblowers being sold.
72. Refer to Figure 2-21. Your friend John created the graph above to illustrate that snowstorms are caused by more
snowblowers being sold. You inform him that his interpretation is incorrect due to
a.
omitted variable bias.
b.
reverse causality.
c.
slope mismatch.
d.
shifting versus moving along a curve.
73. Refer to Figure 2-21. Which of the following could be an omitted variable in the graph?
a.
the price of snowblowers
b.
a change in consumers’ incomes
c.
a change in the seasons
d.
All of the above are correct.