Name:
Class:
Date:
Chapter 10: Managing Data and Using Graphics
Multiple Choice
1. Fractions, ratios, and percentages are examples of _____.
a.
common language
b.
data distortion
c.
diverse language
d.
qualitative interpretation
2. Identify a true statement about communicating quantitative data.
a.
Proportions or ratios paint a confusing picture for readers.
b.
When tabulating research results of people’s opinions and preferences, statistics should be rounded off to the
most accurate decimal point.
c.
Common language reduces difficult figures to the common denominators of language and ideas.
d.
The breakdown of quantitative information reduces the effectiveness of the information.
3. Identify a true statement about the use of graphics.
a.
Visual data cannot be distorted easily.
b.
A few pages of graphics can effectively convey several hundred pages of text.
c.
Use of graphics eliminates the need of reading the text.
d.
Extreme use of graphics adds to the impact of the material presented.
4. One of the purposes of using graphics in a written discussion is to _____ data.
a.
eliminate
b.
reinforce
c.
understate
d.
decentralize
5. Which of the following is a guideline you should follow to ensure the effective use of graphics?
a.
Save graphics for data that can be easily communicated in words.
b.
Incorporate a wide selection of typefaces and colors while using graphics.
c.
Use graphics to contribute to the overall understanding of the idea under discussion.
d.
Make sure the graphics used exceed the text significantly.
6. Linda is preparing a report on the interest rates on loans charged by banks in the United States. In this case, which of
the following is an effective talking title for her report?
a.
Interest Rates on Loans Charged by Banks in the United States
b.
U.S. Rates of Interest on Loans Charged by Banks from January–April
c.
U.S. Interest Rates Decreased on Loans Charged by Banks During January–April
d.
News on Interest Rates on Loans Charged by Banks

Name:
Class:
Date:
Chapter 10: Managing Data and Using Graphics
7. Lumeria is a state in Karlinton. The Board of Education of Lumeria is compiling information on the number of high
school graduates who attended the state’s public universities the previous year. In this case, which of the following
graphics will best represent the data?
a.
A flowchart
b.
A blueprint
c.
A table
d.
A line chart
8. Which of the following is a guideline you should follow for preparing an effective table?
a.
Avoid using numbers to refer to the table.
b.
Use titles that compel readers to review the table.
c.
Indent the second line of a label for the rows two or three spaces.
d.
Avoid adding source notes and explanatory notes beneath the table.
9. For preparing an effective table, you should:
a.
give the table a title that forces the reader to review the table.
b.
place a superscript symbol beside an entry that requires additional explanation.
c.
refer to the table as “the following table” or “the figure on the following page.”
d.
document the source of the data presented by adding source notes above the table.
10. Thomas is preparing a report on the cost of living in the seven most populous cities in the world. He decides
to include a graphic that will help his readers compare the cost of living in all the seven cities. In this case,
which of the following graphics will best represent the data?
a.
An organizational chart
b.
A flowchart
c.
A bar chart
d.
The Gantt chart
11. A segmented bar chart is also called a_____.
a.
surface chart
b.
stacked bar chart
c.
clustered bar chart
d.
cumulative chart
12. Logan is compiling data on the sales of video game consoles for four age categories over the last five years. He wants
to use a graphic to depict how the four age categories contribute to the total sales every year. In this scenario, _____ will
best represent the data.

Name:
Class:
Date:
Chapter 10: Managing Data and Using Graphics
a.
a segmented bar chart
b.
a flow chart
c.
the Gantt chart
d.
a scatter plot chart
13. In the context of pictograms, the term _____ is specific to interfaces on computers or other electronic devices.
a.
hologram
b.
barcode
c.
icon
d.
database
14. Which of the following is a variation of the bar chart?
a.
An area chart
b.
The Gantt chart
c.
A flowchart
d.
A pie chart
b
15. To avoid visual distortion in a bar chart, _____.
a.
keep the labeling elaborate
b.
begin the quantitative axis at one or more than one
c.
use bars of equal width
d.
divide the bars into increasing increments
16. Which of the following is a suggestion that you should follow for constructing effective bar charts?
a.
Use gridlines to avoid visual distortion.
b.
Avoid frills such as 3D formatting.
c.
Use elaborate labeling for better understanding.
d.
Avoid positioning the bars chronologically.
b
17. The director of human resources at Perlis Inc., an automobile manufacturing company, wants to chart
employee absenteeism over a two-year period. He wants to represent this data graphically. In this scenario, the
data will be best represented by a _____.
a.
flowchart
b.
pie chart
c.
line chart

Name:
Class:
Date:
Chapter 10: Managing Data and Using Graphics
18. Which of the following statements is true of pie charts?
a.
They are ineffective in showing percentages.
b.
They make it easier to understand processes.
c.
They are ineffective in showing quantitative totals.
d.
They present data in columns and rows.
19. Which of the following is a guideline you should follow when constructing pie charts?
a.
Position the smallest slice or the slice that needs less emphasis at the 12 o’clock position.
b.
Avoid labeling all the slices.
c.
While labeling the slices, exclude information about the quantitative size, such as percentage, dollars, of each
slice.
d.
A legend should be used if it is not possible to place the appropriate labeling information beside each slice.
20. Allen is an intern at Changing Lives, a child service organization. He is preparing a pie chart to show how the
organization’s administrative overhead expenditure is lower than the children’s service expenditure. To make the chart
easy to understand, Allen should:
a.
avoid using legends to identify the slices.
b.
explode the slices that need to be emphasized.
c.
label only those slices that reflect service programs.
d.
use 3D-type formatting.
21. Identify a true statement about maps.
a.
They are less concise than written messages.
b.
They are less confusing than written messages.
c.
They are less interesting than written messages.
d.
They are less visual than written messages.
22. Illumination Apparel is a fashion retailer chain. In 2001, it opened 126 outlets in different cities. Stacy, a
sales manager at Illumination Apparel, has to present the data on the total revenue generated in these 126 outlets
in the last 10 years. In this case, which of the following graphics is best suited for Stacy’s presentation?
a.
A photograph
b.
A pictogram
c.
A map
d.
A flowchart
23. Angela wants to teach her employees how to handle customer service complaints efficiently. She creates a procedure
manual that includes a step-by-step diagram with written instructions. In this case, the graphic used in the procedure
manual is a _____.
a.
bar chart

Name:
Class:
Date:
Chapter 10: Managing Data and Using Graphics
b.
flowchart
c.
pictogram
d.
pie chart
b
24. Including a flowchart with written instructions:
a.
helps illustrate the trends in quantitative data.
b.
is effective for showing geographic relationships of data.
c.
minimizes the chance of errors in work tasks.
d.
helps show quantitative totals or comparisons.
25. Organizational charts are an example of _____.
a.
line charts
b.
flowcharts
c.
pie charts
d.
bar charts
b
26. Which of the following statements is true of organizational charts?
a.
They must be revised when businesses change.
b.
They are difficult to revise if they are prepared using word-processing software.
c.
They are a form of line charts.
d.
They make narrative discussions unwieldy.
27. _____ are graphics that can be incorporated into reports.
a.
Cartoons
b.
Index cards
c.
Anecdotes
d.
Bibliographies
28. In a written report, if graphics appear before readers have been informed, _____.
a.
the graphics will reduce clutter and increase readability
b.
the readers will begin to study the graphics and draw their own inferences
c.
the readers will take less time to accurately interpret the data
d.
the graphics will lead to visual distortion
b
29. When interpreting and analyzing a graphic, _____.
a.
avoid placing the graphic after its introduction
b.
ensure that the graphic follows a dual numbering system in the text

Name:
Class:
Date:
Chapter 10: Managing Data and Using Graphics
c.
avoid a mere restatement of what the graphic obviously shows
d.
use fancy formatting such as 3D
30. Madison is preparing a report on war fatalities in three different war zones. She has designed a bar chart that
compares the number of fatalities in each war zone and wants to include the bar chart in her report. In this
scenario, which of the following guidelines should Madison follow?
a.
She should insert the bar chart in the report immediately after introducing it and then include an analysis after
it.
b.
She should use more of color highlights and 3D formatting in the bar chart to reduce clutter and increase
readability.
c.
She should place the interpretation and analysis of the bar chart before it appears in the report.
d.
She should place the analysis of the bar chart in the references section of the report.
31. Which of the following numbering systems is recommended when incorporating graphs, pictures, and tables in a
written report?
a.
Number the graphs as “Graph 1,” and so on, the pictures as “Figure 1,” and so on, and the tables as “Table 1,”
and so on.
b.
Number the graphs and the pictures as “Figure 1,” and so on, and the tables as “Table 1,” and so on.
c.
Number all the graphs, pictures, and tables in a single numbering system—that is, “Figure 1,” “Figure 2,” and
so on.
d.
Use only Roman numerals while numbering the graphics.
32. Which of the following should you do when interpreting and analyzing a graphic presented within text?
a.
Restate what the graphic shows.
b.
Emphasize the main point you are making.
c.
Include additional graphics to reiterate what the main graphic states.
d.
List all the statistics presented in the text to emphasize their importance.
33. Which of the following is true of a talking title?
a.
It often leads to misinterpretation of information.
b.
It should be avoided as it takes up too much space and gives a graphic a cluttered look.
c.
It helps save a manager time in understanding the data in a graphic.
d.
It includes the same amount of information as a descriptive title.
34. _____, a variation of the bar chart, is useful for tracking progress toward completing a series of events over time.
a.
An area chart
b.
The Gantt chart
c.
A flowchart
d.
A pie chart

Name:
Class:
Date:
Chapter 10: Managing Data and Using Graphics
35. Julius, a manager in a data analytics company, has assigned five of his team members to a particular project. At the
end of every week, he is required to submit a progress report to his supervisor. For this, he needs to create a chart that will
allow him to efficiently track his team members’ progress by scheduling different activities and plotting the planned and
actual hours put into those tasks. In this case, which of the following charts would best fulfill Julius’s requirement?
a.
An area chart
b.
The Gantt chart
c.
A flowchart
d.
The Pournelle chart
b
True / False
36. As people tend to make comparisons during analysis from a tabulation, the totals are helpful in communicating
quantitative information.
a.
True
b.
False
True
37. Common language does not involve the use of indicators or actual counts.
a.
True
b.
False
False
38. When tabulating research results, exact statistics rather than rounded off fractions and percentages help paint
a clear picture for readers.
a.
True
b.
False
False
39. The use of graphics is generally avoided in reports because they are complicated and difficult to understand.
a.
True
b.
False
False
40. Graphics must be saved for data that are difficult to communicate in words alone.
a.
True
b.
False
True
41. In the context of effective use of graphics, ample use of color, symbols and art techniques, and unusual combinations
of typefaces reduce the impact of the material presented.
a.
True
b.
False
True

Name:
Class:
Date:
Chapter 10: Managing Data and Using Graphics
42. Visual data can be distorted easily, leading the reader to form incorrect opinions about the data.
a.
True
b.
False
True
43. Electronic presentations, flip charts, whiteboards, and overhead transparencies are the visual means most
often used to accompany presentations.
a.
True
b.
False
True
44. Selecting the graphic type that will depict data in the most effective manner is the first decision you must make when
preparing presentations.
a.
True
b.
False
True
45. When preparing a table, if more than one source was used to prepare a visual, superscripts should not be used.
a.
True
b.
False
False
46. When constructing bar charts, position the bars chronologically or in some other logical order.
a.
True
b.
False
True
47. A line chart is an effective graphic for comparing housing prices in a particular region with housing prices in
another region.
a.
True
b.
False
False
48. A line chart is similar to an area chart.
a.
True
b.
False
False
49. When constructing line charts, the vertical or quantity increments must be the same as the horizontal or time
increments so that the line or lines drawn will have reasonable slopes.
a.
True
b.
False
False

Name:
Class:
Date:
Chapter 10: Managing Data and Using Graphics
50. A pie chart is the best type of graphic aid that can be used to show the percentage of total sales contributed by
salesperson for an organization.
a.
True
b.
False
True
51. When constructing pie charts, label each slice and include information about the quantitative size, such as
percentage, dollars, etc., of each slice.
a.
True
b.
False
True
52. When reorganization of units takes place in a business, the organizational charts must be revised.
a.
True
b.
False
True
53. Revisions to organizational charts become complex when prepared using word-processing or graphics software.
a.
True
b.
False
False
54. The use of photographs in annual reports makes it difficult for the general audience to understand complex
concepts.
a.
True
b.
False
False
55. An introduction and a brief explanation of a graphic in a report should appear after the graphic is shown.
a.
True
b.
False
False
56. When an effective graphic is used in a report, there is no need for additional interpretation and analysis of
the data.
a.
True
b.
False
False
57. A graphic that will not fit on the page where it is introduced should be placed in the appendix.
a.
True
b.
False
False
58. Arbitrary changes in the design of graphics (e.g., use of colors, typefaces, three-dimensional, or flat designs) within a
Name:
Class:
Date:
Chapter 10: Managing Data and Using Graphics
single organizational report make the report look interesting and hold the readers’ attention.
a.
True
b.
False
False
59. Grouped bar charts are also called 100% bar charts.
a.
True
b.
False
False
Essay
60. Explain why quantitative data from a research study must be condensed into a manageable size before you
can interpret it.
tabulated data. REJ: Please see the section “Communicating Quantitative Information” for more information.
61. What is common language? How does common language help professionals manage quantities of data
efficiently?
more information.
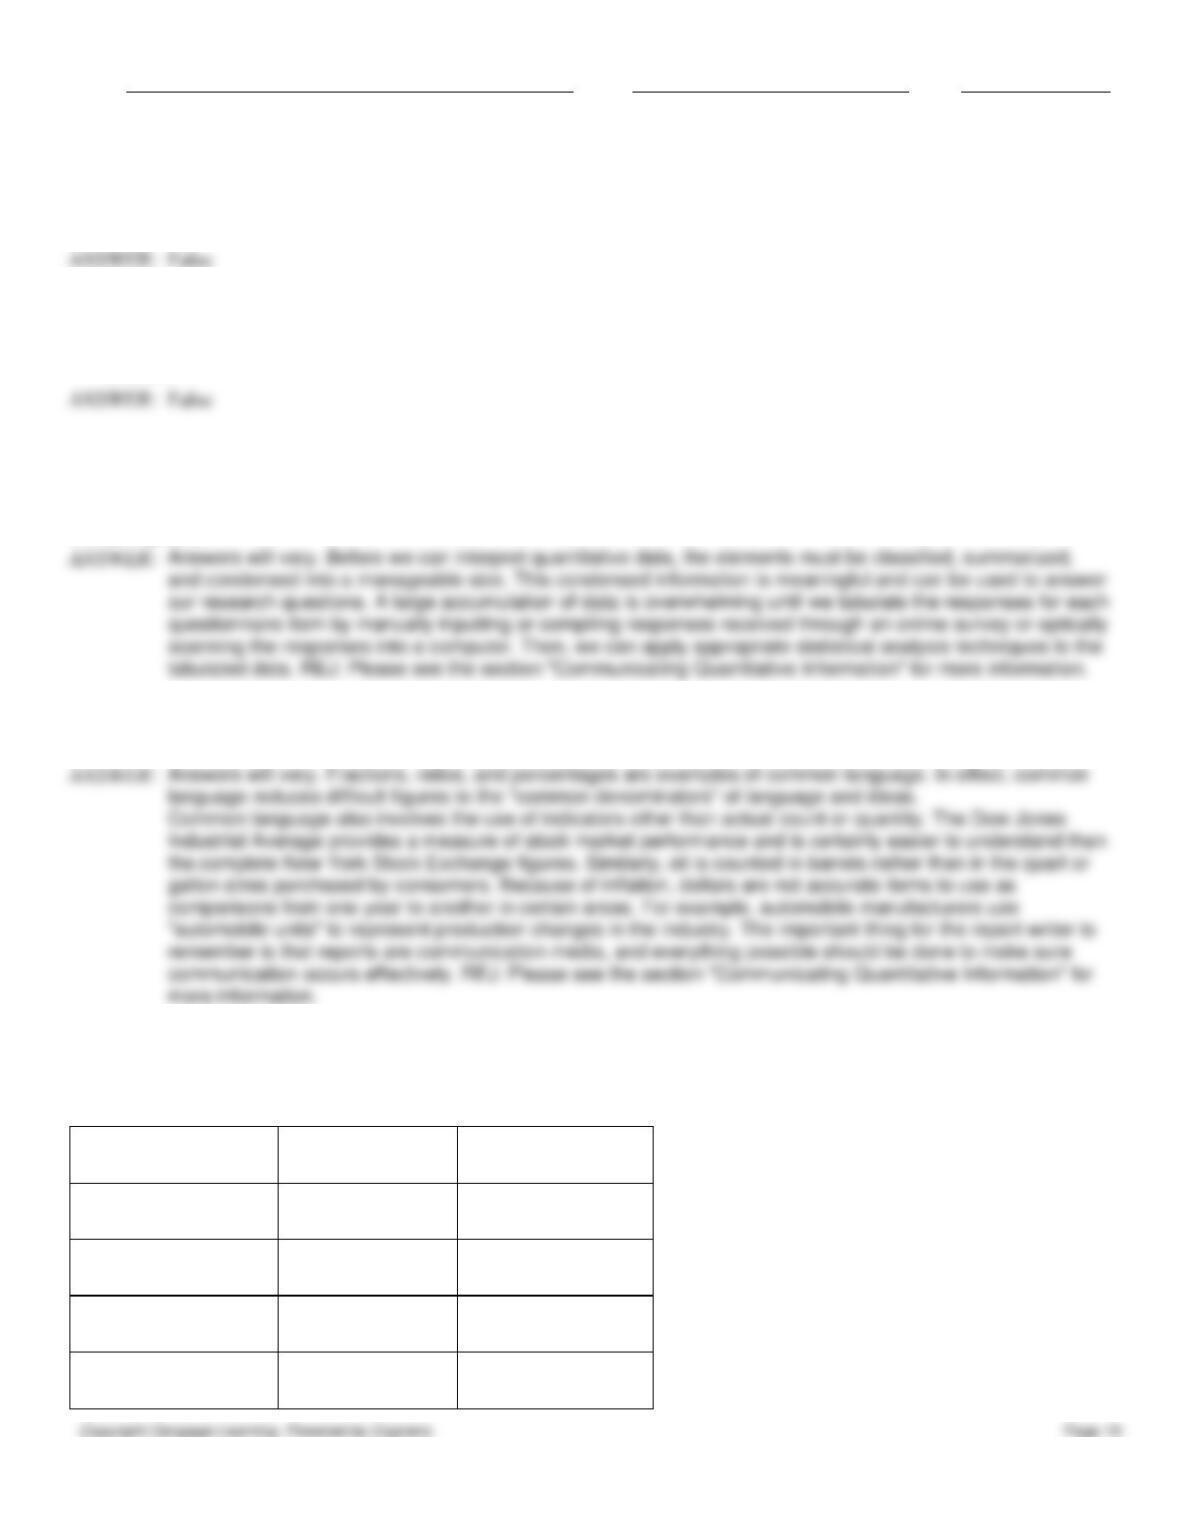
62. Rancorps Inc. conducts a survey of its employees to determine their interest in learning about financial planning. The
given table shows the data of the responses. The results of this survey will be reported to the director of human resources
and will be used to develop a financial planning training seminar for the employees.
Personal
Development Need
Number
Percentage
Retirement Annuity
128
32
Traditional and Roth
IRA
104
26
Mutual Funds
80
20
Internet Stock
Trading
52
13
Name:
Class:
Date:
Chapter 10: Managing Data and Using Graphics
Effective Charitable
Giving
36
9
Total
400
100
Write an analysis of this data, and explain the results of the survey. The analysis will be included in the written report that
will be sent to the director of human resources.
63. Explain the term graphics. Discuss the purpose of using graphics with a written discussion.
REJ: Please see the section “Using Graphics” for more information.
64. Explain the difference between a talking title and a descriptive title.
65. List seven graphic aids that can be used for data illustration and interpretation.
Name:
Class:
Date:
Chapter 10: Managing Data and Using Graphics
REJ: Please see the section “Types of Graphic Aids” for more information.
66. List and discuss five suggestions related to constructing bar charts.
more information.
67. List the general guidelines for constructing pie charts.
“Types of Graphic Aids” for more information.
68. Susan, an accounts manager at Westbrin Inc., has been asked to give a presentation on budgeting to help the
employees of the company understand where and how they should spend their money. From the data gathered from her
research, she has discovered that typical households spend their income in the following areas:
35% Housing
20% Transportation
20% Food
10% Health care and health insurance
5% Clothing
5% Credit card debt and interest
5% Entertainment
Select an appropriate visual that can help Susan represent this information in her presentation, and explain why the visual
will be appropriate for the presentation.
69. Explain organizational charts.
Name:
Class:
Date:
Chapter 10: Managing Data and Using Graphics
70. Explain the pattern for including graphics in text.
see the section “Including Graphics in Text” for more information.
71. Discuss the guidelines for interpreting and analyzing a graphic.
Graphics in Text” for more information.
72. The following are poor examples of introductions of graphics. Rewrite each of these sentences to effectively introduce
the graphic in the text. Provide any additional information that may be needed.
a. Figure 1 shows preferences for shopping locations.
b. Figure 1 shows enrollment for software training programs.
c. Figure 1 shows the response of managers about working hours.
d. Figure 1 shows the breakdown of cell phone users.
73. Discuss some of the important design principles that need to be followed while creating a graphic.