
The cashier service time at the local branch of the Rivertown bank has an exponential
distribution with a mean of 2.5 minutes. What is the probability that the service time
exceeds 3 minutes?
A. .3012
B. .6988
C. .4346
D. .5654
E. .0821
How well a process is able to meet the requirements set forth by the process design is
called
A. process leeway.
B. quality of conformance.
C. quality of performance.
D. quality of design.
The flying time of a drone airplane has a normal distribution with mean 4.76 hours and
standard deviation of .04 hours. What is the probability that the drone will fly less than
4.66 hours?
A. −.0062

B. .5062
C. .0062
D. .9938
What value of the Durbin-Watson statistic indicates that there is no autocorrelation
present in time-ordered data?
A. 1
B. −1
C. 2
D. −2
E. 0
In a survey of 1,000 people, 420 are opposed to an income tax increase. Construct a 95
percent confidence interval for the proportion of people in the population opposed to
this tax increase.
A. [.394, .446]
B. [.389, .451]
C. [.380, .460]

D. [.399, .441]
A card is drawn from a standard deck. Given that a face card is drawn, what is the
probability it will be a king?
A. 1/3
B. 1/13
C. 4/13
D. 1/12
E. 1/4
The flying time of a drone airplane has a normal distribution with mean 4.76 hours and
standard deviation of .04 hours. What is the probability that the drone will fly more than
4.80 hours?
A. .1587
B. .8413
C. .6587
D. .3413

The state highway department is studying traffic patterns on one of the busiest
highways in the state. As part of the study, the department needs to estimate the average
number of vehicles that pass an intersection each day. A random sample of 64 days
gives us a sample mean of 14,205 cars and a sample standard deviation of 1,010 cars.
After calculating the confidence interval, the highway department officials decide that
the precision is too low for their needs. They feel the precision should be 300 cars.
Given this precision, and needing to be 99 percent confident, how many days do they
need to sample?
A. 109
B. 80
C. 79
D. 62
E. 9
At an oceanside nuclear power plant, seawater is used as part of the cooling system.
This raises the temperature of the water that is discharged back into the ocean. The
amount that the water temperature is raised has a uniform distribution over the interval
from 10 to 25 C. What is the standard deviation of the temperature increase?
A. 10.12
B. 4.33

C. 7.50
D. 1.25
Researchers studied the role that the age of workers has in determining the hours per
month spent on personal tasks. A sample of 1,686 adults were observed for one month.
The data follow.
Construct a 93 percent confidence interval for the mean hours spent on personal tasks
for 45- to 64-year-olds.
A. [4.26, 4.36]
B. [4.25, 4.37]
C. [4.27, 4.35]
D. [4.28, 4.34]
E. [2.83, 5.79]

It has been reported that the average time to download the home page from a
government website was 0.9 seconds. Suppose that the download times were normally
distributed with a standard deviation of 0.3 seconds. If random samples of 36 download
times are selected, what is the probability that the sample mean will be less than 0.84
seconds?
A. .1151
B. .4522
C. .8849
D. .5478
The Securities and Exchange Commission has determined that the number of
companies listed on the NYSE declaring bankruptcy is approximately a Poisson
distribution with a mean of 2.6 per month. Find the probability that more than 1
bankruptcy occurs next month.
A. .1931
B. .9257
C. .7326
D. .4816
E. .2674

A manufacturing company produces part QV2Y for the aerospace industry. This
particular part can be manufactured using 3 different production processes. The
management wants to know if the quality of the units of part QV2Y is the same for all
three processes. The production supervisor obtained the following data: Process 1 had
29 defective units in 240 items, Process 2 produced 12 defective units in 180 items, and
Process 3 manufactured 9 defective units in 150 items. At a significance level of .05, we
performed a chi-square test to determine whether the quality of the items produced
appears to be the same for all three processes. What is the null hypothesis?
A. H0: The number of defectives produced is independent of the production process
used.
B. H0: The row and column variables are associated with each other.
C. H0: The proportion of defective units produced by the three production processes is
the same.
D. Both “H0: The number of defectives produced is independent of the production
process used.” and “H0: The proportion of defective units produced by the three
production processes is the same.” are correct or at least acceptable ways of stating the
null hypothesis.
E. All of the other choices are acceptable ways of stating the null hypothesis.
When comparing two independent population variances, the correct test statistic to use
is __________.
A. z
B. t
C. F
D. t2

A random sample of size 1,000 is taken from a population where p = .20. Describe the
sampling distribution of .
A. cannot be determined
B. approximately normal
C. skewed to the left
D. skewed to the right
A total of 50 raffle tickets are sold for a contest to win a car. If you purchase one ticket,
what are your odds against winning?
A. 49 to 1
B. 50 to 1
C. .05
D. .01

Decision makers in business organizations make most decisions in environments that
involve some degree of ___________________.
A. risk
B. utility
C. certainty
D. uncertainty
A real estate company is analyzing the selling prices of residential homes in a given
community. 140 homes that have been sold in the past month are randomly selected and
their selling prices are recorded. The statistician working on the project has stated that
in order to perform various statistical tests, the data must be distributed according to a
normal distribution. In order to determine whether the selling prices of homes included
in the random sample are normally distributed, the statistician divides the data into 6
classes of equal size and records the number of observations in each class. She then
performs a chi-square goodness-of-fit test for normal distribution. The results are
summarized in the following table.
What is the appropriate null hypothesis?

A. H0: The residential home selling prices are distributed according to a normal
distribution.
B. H0: The residential home selling prices are not distributed according to a normal
distribution.
C. H0: The distribution of residential home selling prices is either right or left skewed.
D. H0: The distribution of the residential home selling prices is symmetric.
E. None of the other answers is correct.
A control chart on which subgroup ranges are plotted versus time is a(n) _____ chart.
A.
B. R
C. p
D. C
The local amusement park was interested in the average wait time at their most popular
roller coaster at the peak park time (2 p.m.). They selected 13 patrons and had them get
in line between 2 and 3 p.m. Each was given a stopwatch to record the time they spent
in line. The times recorded were as follows (in minutes).
118, 124, 108, 116, 99, 120, 148, 118, 119, 121, 45, 130, 118

What are the lower and upper limits?
A. 80.5, 154.00
B. 108.5, 128.5
C. 127.75, 138.25
D. 80.5, 154.00
E. 143.50, 154.00
The ____________________criterion for choosing among alternative actions assumes
that the state of nature with the best payoff will be experienced.
A. maximin
B. certainty
C. maximax
D. decision

Which one of the following nonparametric methods requires that we carry out a paired
difference experiment?
A. Wilcoxon signed ranks test
B. sign test
C. Kruskal-Wallis test
D. Wilcoxon rank sum test
In a manufacturing process, a machine produces bolts that have an average length of 3
inches with a variance of .03. If we randomly select three bolts from this process, What
is the probability the mean length of the bolt is at least 3.16 inches?
A. 97.72%
B. 5.48%
C. 94.52%
D. 44.52%
E. 2.28%
The normal approximation of the binomial distribution is appropriate when

A. np ≥ 5.
B. n(1 − p) ≥ 5.
C. np ≤ 5.
D. n(1 − p) ≤ 5 and np ≤ 5.
E. np ≥ 5 and n(1 − p) ≥ 5.
If the mean, median, and mode for a given population all equal 25, then we know that
the shape of the distribution of the population is ____________.
A. bimodal
B. skewed to the right
C. symmetrical
D. skewed to the left
Jersey numbers of soccer players is an example of a(n) ___________ variable.
A. nominative
B. ordinal
C. interval
D. ratio

In general, the shape of the F distribution is _________.
A. skewed right
B. skewed left
C. normal
D. binomial
In a manufacturing process, a machine produces bolts that have an average length of 3
inches with a variance of .03. If we randomly select three bolts from this process, what
is the probability the mean length of the bolt is at most 3.1 inches?
A. 84.13%
B. 100%
C. 71.57%
D. 28.43%
E. 15.87%

The __________________ is a nonparametric counterpart of a small-sample t test for
comparing two independent population locations.
A. Wilcoxon rank sum test
B. Kruskal-Wallis H test
C. Wilcoxon signed ranks test
D. sign test
The Securities and Exchange Commission has determined that the number of
companies listed on the NYSE declaring bankruptcy is approximately a Poisson
distribution with a mean of 2.6 per month. Find the probability that no more than one
bankruptcy occurs next month.
A. .1931
B. .9257
C. .7326
D. .4816
E. .2674
A sustained long-term change in the level of the variable that is being forecasted per
unit of time is
A. a trend.
B. a time series.
C. seasonality.
D. a change due to business cycles.
Find a 95 percent confidence interval for μ1 − μ2, where n1 = 9, n2 = 6, = 64, =
59, s12 = 6, and s22 = 3. (Assume equal population variances.)
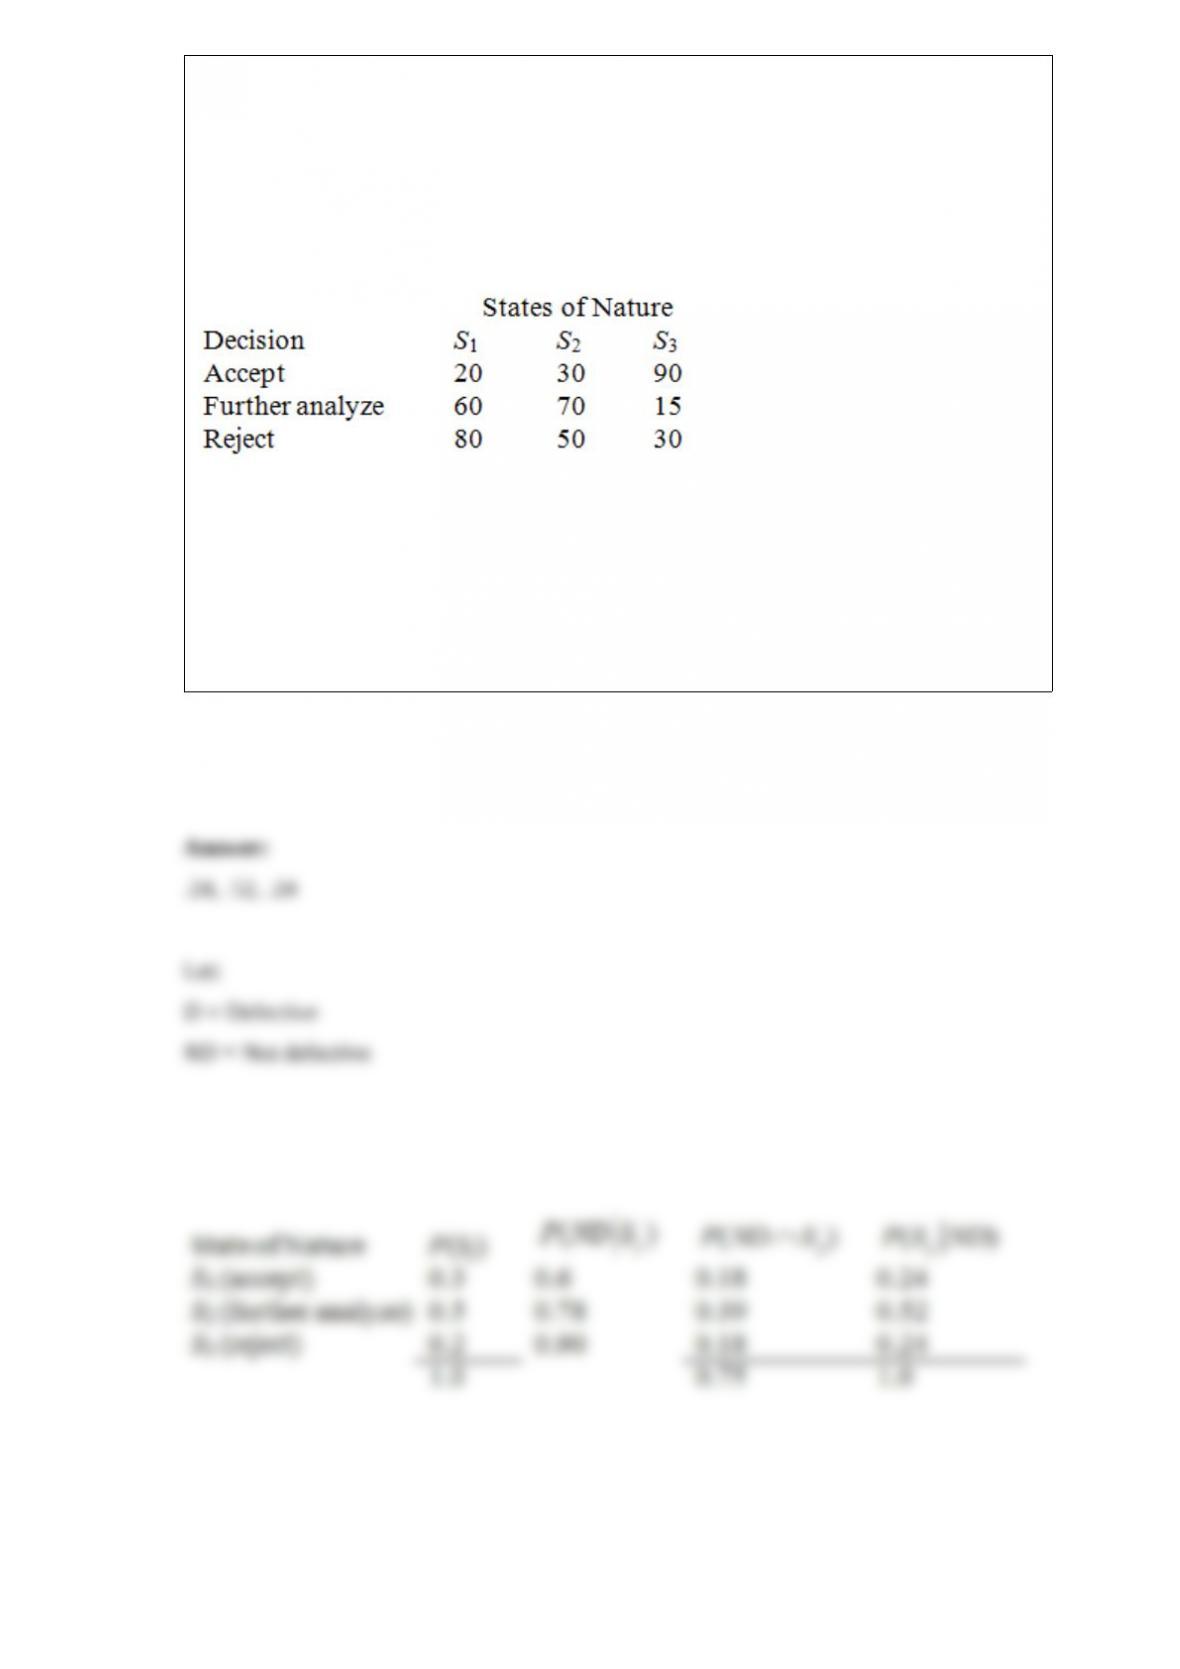
The quality control manager for NKA Inc. must decide whether to accept (alternative
1), further analyze (alternative 2), or reject (alternative 3) an incoming shipment (lot) of
microchips. The historical data indicate that there is a 30 percent chance that the lot is
poor quality (S1), 50 percent chance that the lot is fair quality (S2), and 20 percent
chance that the lot is good quality (S3). Assume the following payoff table is available.
The values in the payoff table are in thousands of dollars.
Based on historical data, if the lot is poor quality, 40 percent of the items are defective.
If the lot is fair quality, 22 percent of the items are defective. If the lot is good quality,
10 percent of the items are defective. The quality control manager inspects one unit
from a recent shipment. After inspecting it, he determines that the unit is not defective.
Based on this additional information, determine the revised (posterior) probabilities for
each of the three states of nature.
The quality control manager for NKA Inc. must decide whether to accept (alternative
1), further analyze (alternative 2), or reject (alternative 3) an incoming shipment (lot) of
microchips. The historical data indicate that there is a 30 percent chance that the lot is
poor quality (S1), 50 percent chance that the lot is fair quality (S2), and 20 percent
chance that the lot is good quality (S3). Assume the following payoff table is available.
The values in the payoff table are in thousands of dollars.
What is the maximum amount that the quality control manager would be willing to pay
for perfect information?
In an early study, researchers at Ivy University found that 33 percent of the freshmen
had received at least one A in their first semester. Administrators are concerned that
grade inflation has caused this percentage to increase. In a more recent study, of a
random sample of 500 freshmen, 185 had at least one A in their first semester. Calculate
the p-value associated with the test statistic and test the claim at α = .05 using the
p-value rule.
Two hospital emergency rooms use different procedures for triage of their patients. We
want to test the claim that the mean waiting time of patients is the same for both
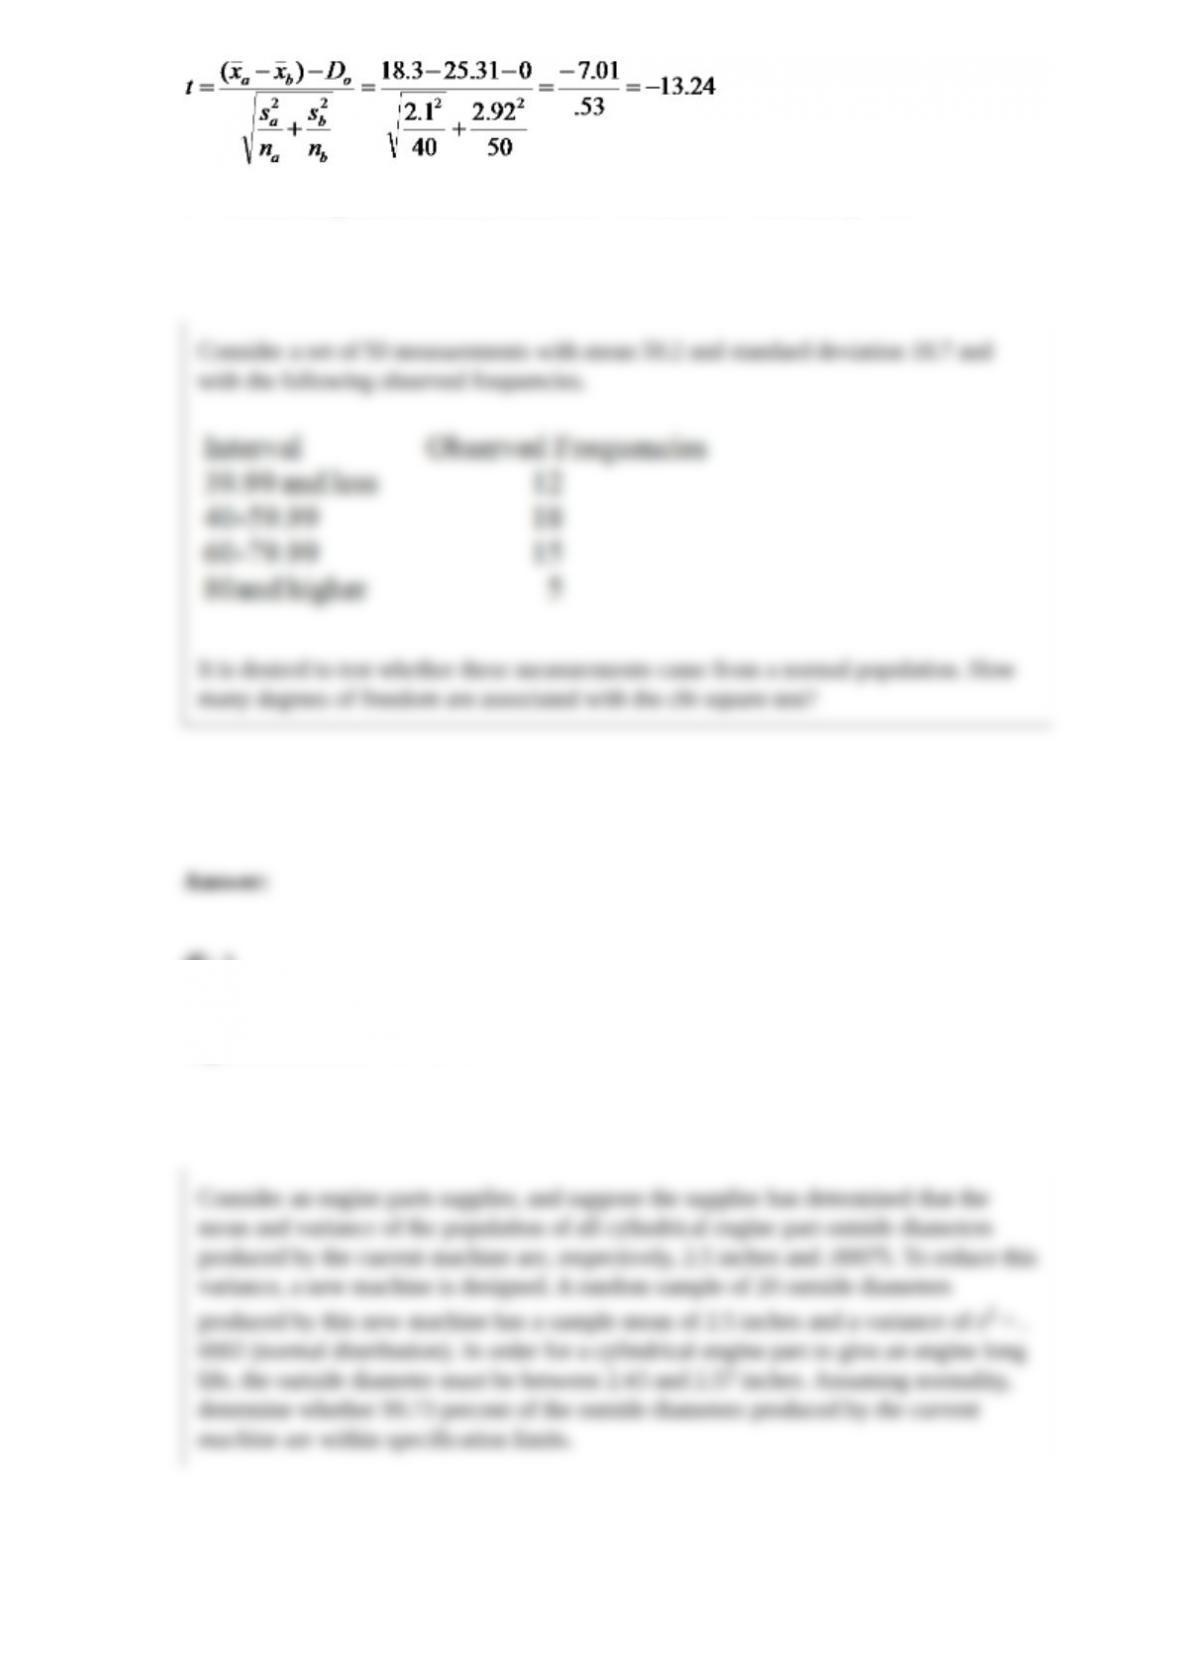
hospitals. The 40 randomly selected subjects from hospital A produce a mean of 18.3
minutes. The 50 randomly selected patients from hospital B produce a mean of 25.31
minutes. Assume sa = 2.1 minutes and sb =2.92 minutes. What do you conclude about
the waiting time for patients in the two hospitals, testing at α = .001?
Consider a set of 50 measurements with mean 50.2 and standard deviation 18.7 and
with the following observed frequencies.
It is desired to test whether these measurements came from a normal population. How
many degrees of freedom are associated with the chi-square test?
Consider an engine parts supplier, and suppose the supplier has determined that the
mean and variance of the population of all cylindrical engine part outside diameters
produced by the current machine are, respectively, 2.5 inches and .00075. To reduce this
variance, a new machine is designed. A random sample of 20 outside diameters
produced by this new machine has a sample mean of 2.5 inches and a variance of s2 = .
0002 (normal distribution). In order for a cylindrical engine part to give an engine long
life, the outside diameter must be between 2.43 and 2.57 inches. Assuming normality,
determine whether 99.73 percent of the outside diameters produced by the current
machine are within specification limits.
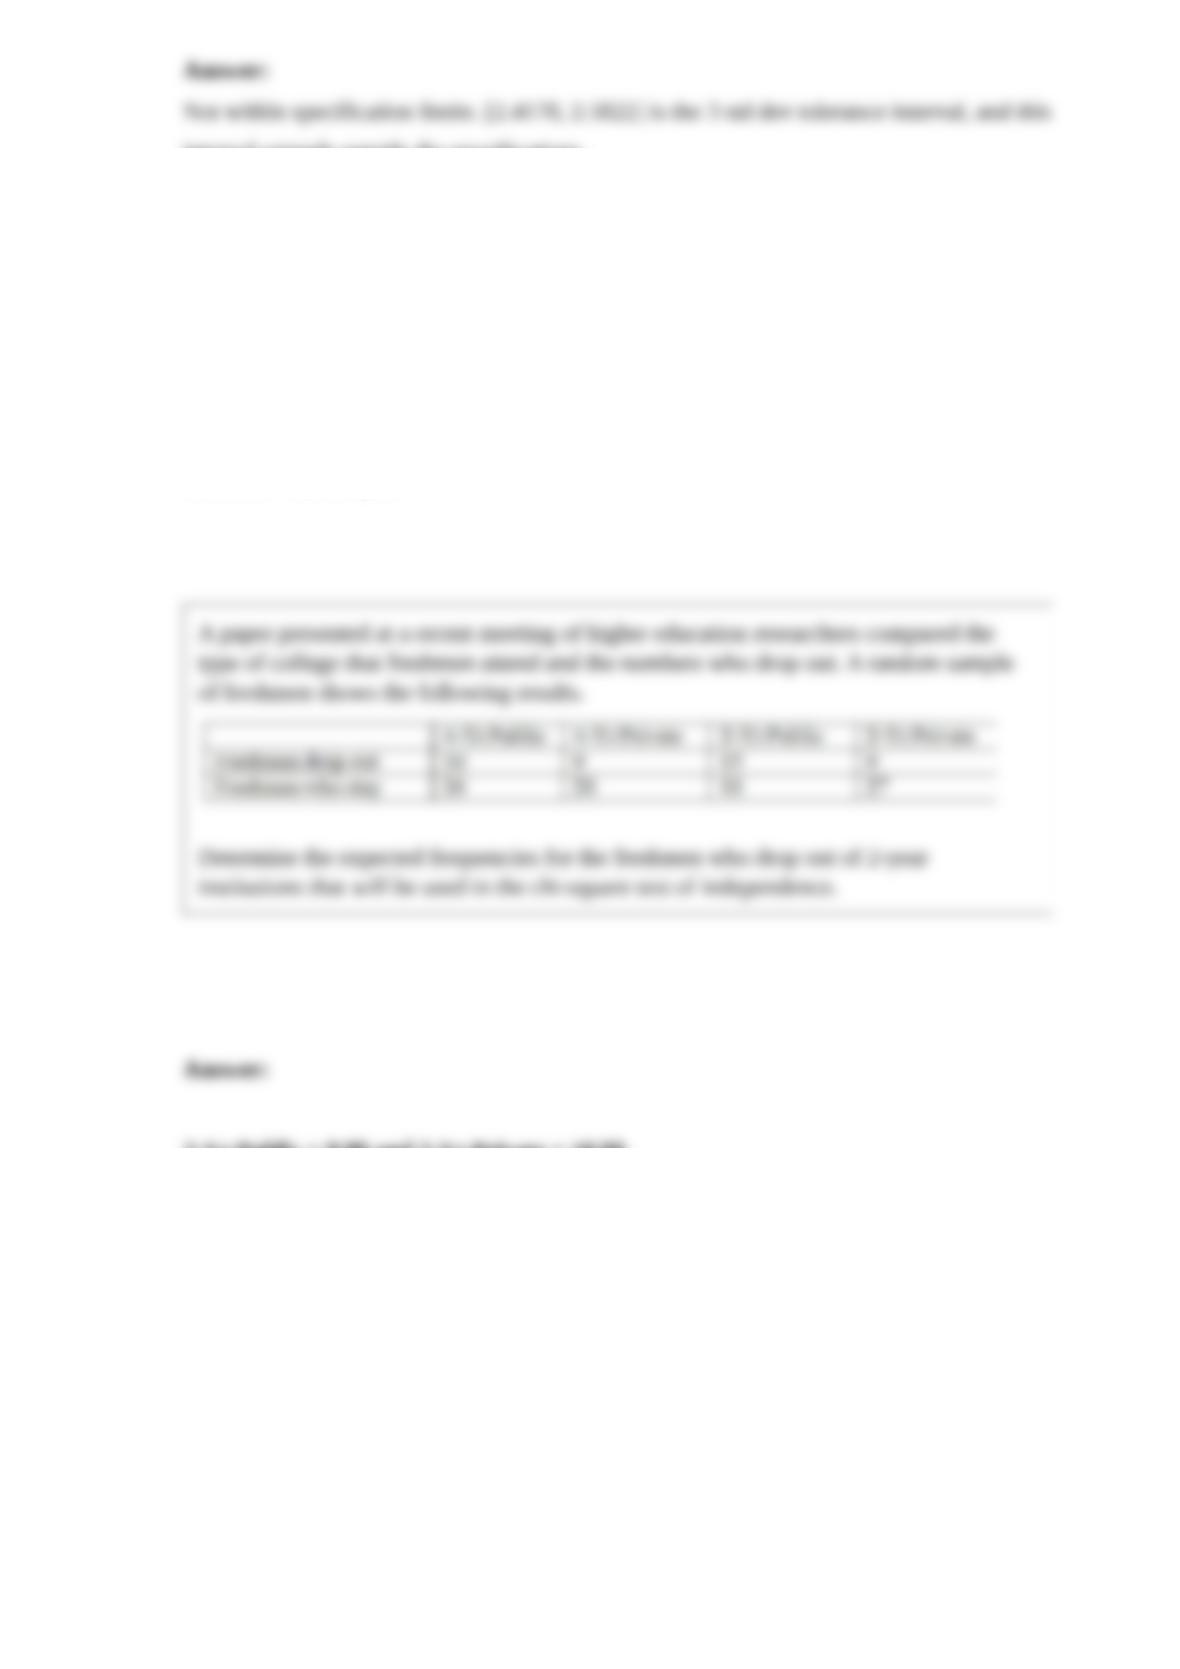
A paper presented at a recent meeting of higher education researchers compared the
type of college that freshmen attend and the numbers who drop out. A random sample
of freshmen shows the following results.
Determine the expected frequencies for the freshmen who drop out of 2-year
institutions that will be used in the chi-square test of independence.

Looking at four different diets, a researcher randomly assigned 20 equally overweight
individuals into each of the four diets. What are the degrees of freedom for the
individual confidence intervals?
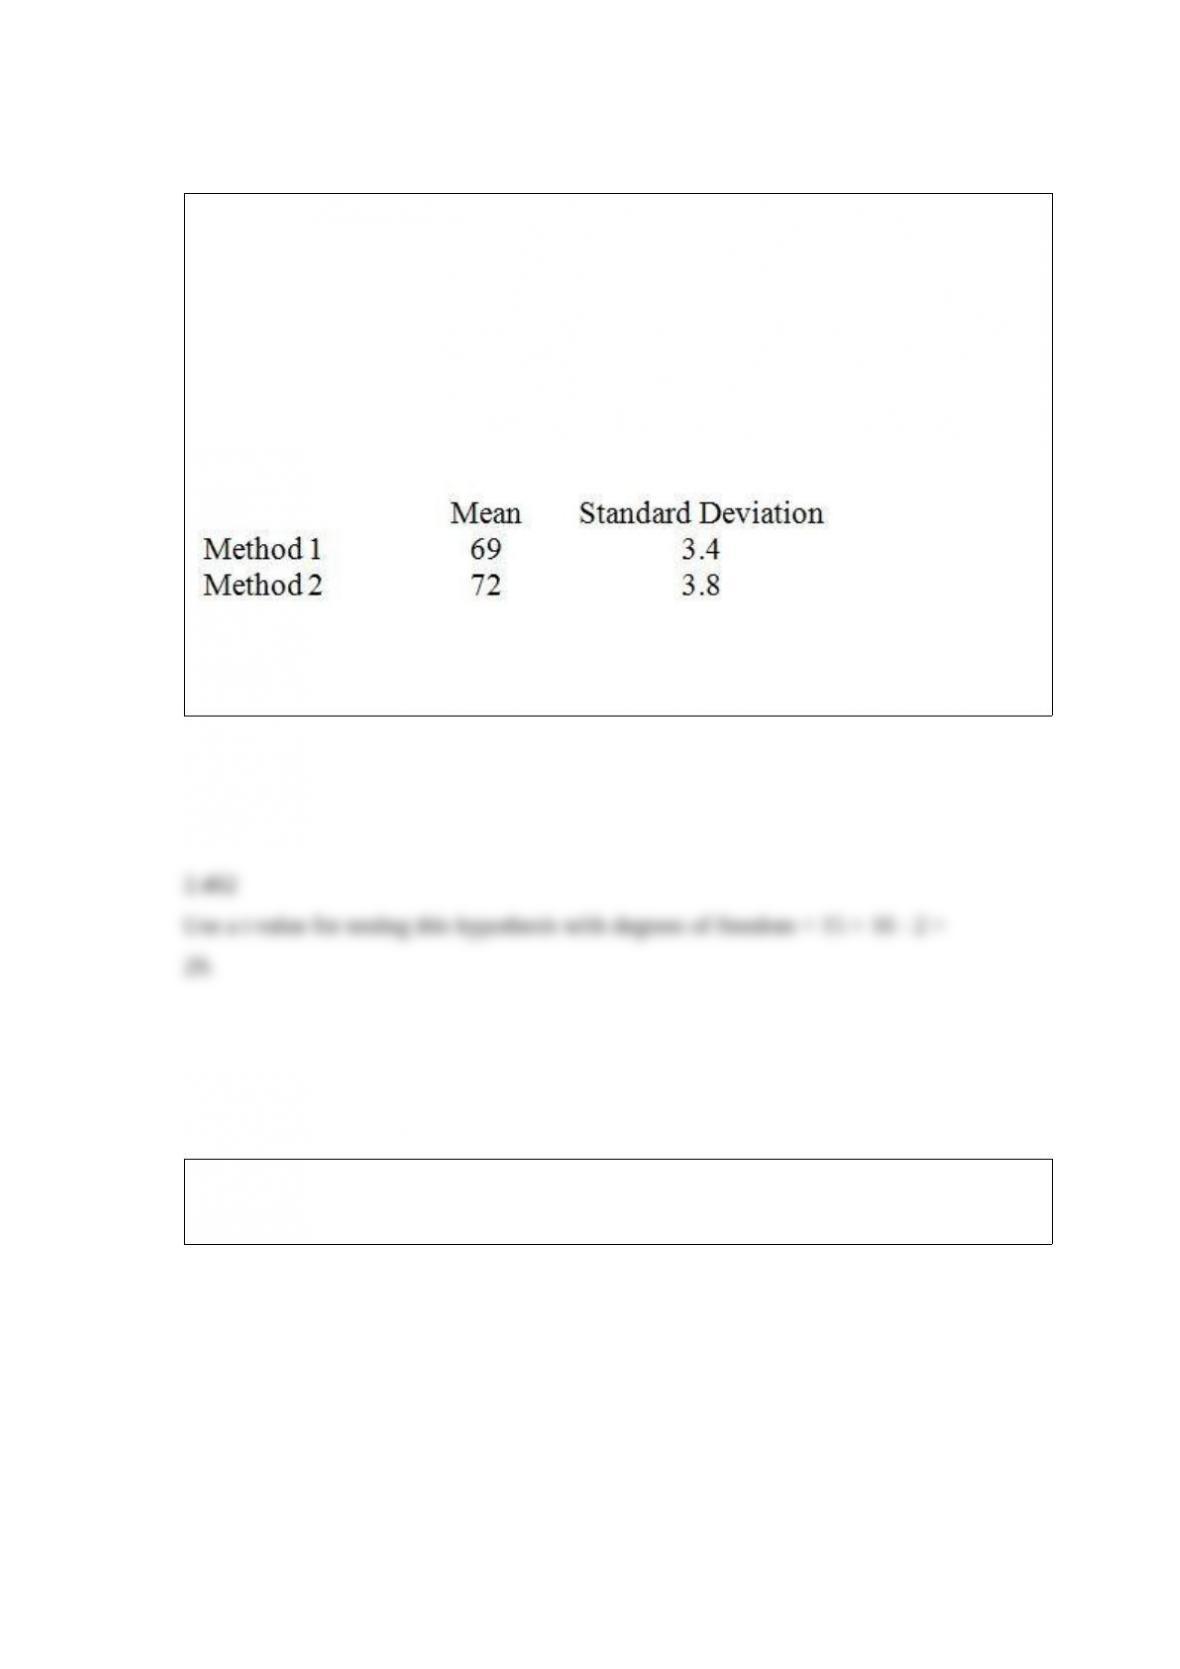
A fast food company uses two management-training methods. Method 1 is a traditional
method of training, and Method 2 is a new and innovative method. The company has
just hired 31 new management trainees. 15 of the trainees are randomly selected and
assigned to the first method, and the remaining 16 trainees are assigned to the second
training method. After three months of training, the management trainees take a
standardized test. The test was designed to evaluate their performance and learning
from training. The sample mean score and sample standard deviation of the two
methods are given below. The management wants to determine if the company should
implement the new training method.
What is the absolute value of the rejection point (critical value of the test statistic) at α
= .01?
A test of driving ability is given to a random sample of 10 student drivers before and
after they complete a formal driver education course. Results follow.
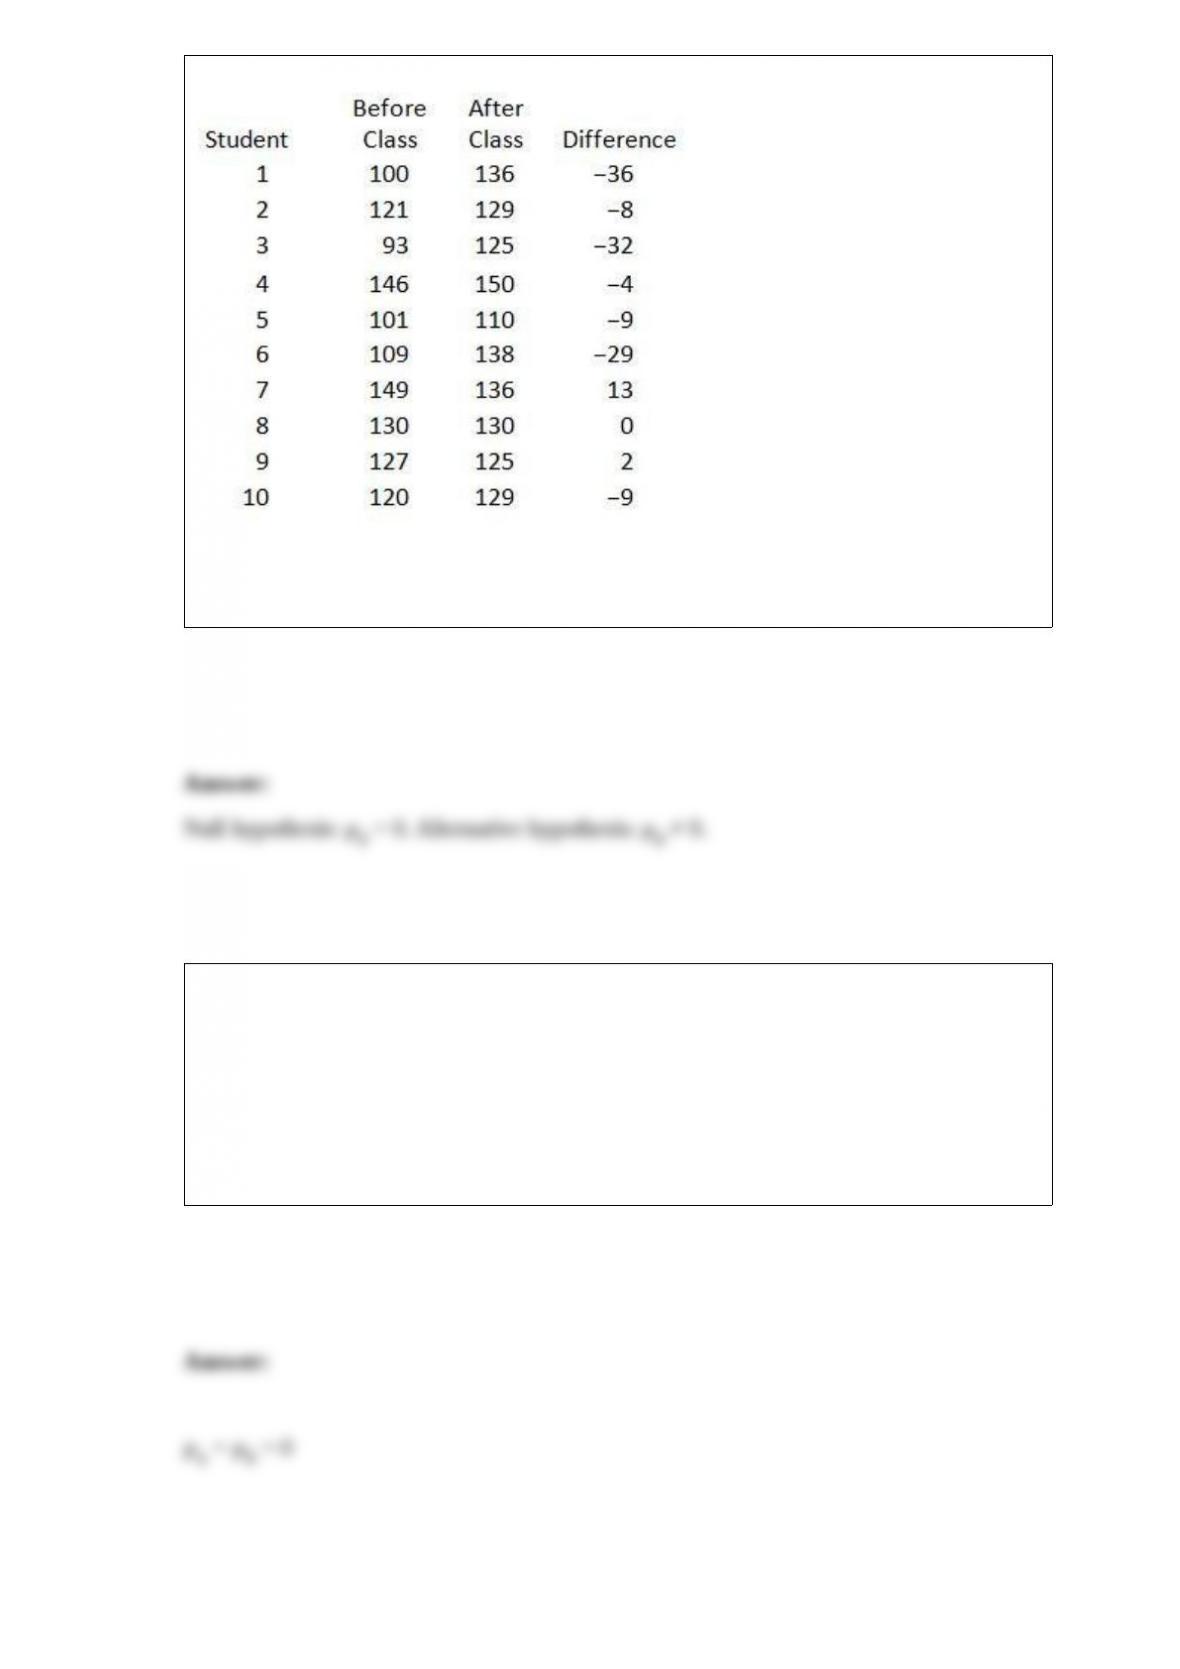
Write the null and alternative hypotheses testing the claim that the test score is not
affected by the course.
Two hospital emergency rooms use different procedures for triage of their patients. We
want to test the claim that the mean waiting time of patients is the same for both
hospitals. The 40 randomly selected subjects from hospital A produce a mean of 18.3
minutes. The 50 randomly selected patients from hospital B produce a mean of 25.31
minutes. Sample standard deviations are sa = 2.1 minutes and sb = 2.92 minutes. Set up
the null hypothesis to determine whether there is a difference in the mean waiting time
between the two hospitals.