The sum of squares block (SSBL) measures the variation between the block means and
the sample means.
Using backward elimination regression may result in a model in which none of the
independent variables are statistically significant.
The degrees of freedom for the sum of squares between for one-way ANOVA equal the
number of populations being compared minus one.
The advantage of using the Tukey-Kramer multiple comparisons procedure is that the
probability of making a Type I error applies to all possible combinations of sample
pairs.

Once the sample size has been increased to the size of the population, the values of α
and β will approach 1.0.
The dependent variable on scatter plots is placed on the horizontal axis on the graph.
All else being equal, choose the forecast with the higher mean absolute deviation.
Using general stepwise regression will always result in a model in which all of the
independent variables are statistically significant.
If the confidence interval for the regression slope includes zero, we would have some
evidence that β could be equal to zero, which would indicate that there may not be a
relationship between the dependent and independent variables.
The variation in sample means is measured by the standard error of the mean.
The ratio data has all of the properties of interval data with the added feature of having
a true zero point.
A sample median is an example of a statistic.
The alternative hypothesis, denoted by , represents the opposite of the null
hypothesis and is believed to be true if the null hypothesis is found to be false.
A time series is deseasonalized by dividing the actual time series value by its
corresponding trend component.
Using the regression equation to predict values for the dependent variable beyond the
range of the data may provide results that are unreliable.
The time between customer arrivals is a common application for the uniform
probability distribution.
Excel requires that the independent variables be located in adjacent columns in the
spreadsheet.
In order to get valid results, the hypothesis test for a variance for a single population
requires that the population from which the sample is drawn to be normally distributed.

The maximax criterion is the most optimistic method as well as the one with the highest
level of risk.
In decision trees, circle symbols are used to denote payoffs.
The benefit of the Hurwicz criterion is that it allows the user to choose a more precise
level of risk with the value of when compared to the maximax, maximin,
and equally likely criterion.
Two-way ANOVA compares the means from different factors using two levels.
Five random samples, each of size 40, are selected from a population of interest. A
90% confidence interval using a z-score is calculated for each sample. The margin of
error for each confidence interval need not be the same.
A box-and-whisker plot displays the mean of the data set.
One of the major reasons to use statistics is to transform data into information.

The adjusted multiple coefficient of determination will always be greater than or equal
to the multiple coefficient of determination.
The maximax criterion is described as the least pessimistic method and the one with the
lowest level of risk.
Statistics can be misused by making differences seem greater or lesser by adjusting the
scale on graphs.
Steve’s grade on a recent statistics exam was an 85 on a scale of 0-100. Based on this
information, we can conclude that Steve’s grade was in the 85th percentile in his class.
Each category of a pie chart occupies a segment of the pie that represents the
cumulative relative frequency of that category.
Empty classes for a frequency distribution using grouped quantitative data result from
class widths that are too wide.
The critical value for the Tukey-Kramer critical range is found using the F-distribution.

The probability of a binomial distribution represents the variation that we would see in
the number of successes over n trials, assuming the chance of a success is p.
Measures of relative variation compare the position of one value in relation to other
values in the data set.
The Kruskal-Wallis test does not rely on any assumptions about the probability
distributions but does require equal variances among the populations.
If two variables have a correlation coefficient equal to -0.60 from a sample size of 5, we
can conclude that the population correlation coefficient is less than zero using α = 0.05.
Apple is considering offering the new version of the iPad in color options other than
black and white. Before deciding, Apple would like to survey potential iPad users on
their preferences. Management feels that the gender of the person will affect their
response. As a result, Apple would like to ensure the sample in composed of an equal
number of male and female respondents. This is an example of cluster sampling.
The number of successes in a binomial experiment must range from zero to n.
When performing a hypothesis test to compare two or more population proportions, the
expected frequencies must always be integer values.

Using forward selection regression will always result in a model in which all of the
independent variables are statistically significant.
Hamburgers are on the menu tomorrow at a school cafeteria and the manager needs to
decide how many to have ready for the lunch hour. Each hamburger costs the school
$1.85 and is sold for $3.50. Leftover hamburgers have no monetary value. The manager
expects demand tomorrow to be 100, 150, 200, or 250 hamburgers and would like to
prepare one of these four quantities for lunchtime. If the manager uses the maximin
criterion, how many hamburgers will be prepared?
A) 100
B) 150
C) 200
D) 250

A statistics class at Wilmington College has 25 students of which 15 are math majors
and 10 are business majors. The professor randomly selects five students to work
together on a group project. What is the probability that three or four of the students in
this group are business majors?
A) 0.1350
B) 0.2154
C) 0.2965
D) 0.4461
A golfer claims that his average golf score at the course he plays regularly is less than
90. A Type II error would occur if the golfer concludes that the average score is
____________________________________.
A) 90 or more when, in reality, the average score is less than 90
B) more than 90 when, in reality, the average score is equal to 90
C) less than 90 when, in reality, the average score is 90 or more
D) 90 or less when, in reality, the average score is equal to 90
According to the National Health Interview Survey, 4.7% of U.S. adults 50 and older
have had a total knee replacement. A random sample of 20 adults 50 and older has been
selected. Use the Poisson distribution to approximate the binomial distribution to
determine the probability that three or more adults from this sample have had a total
knee replacement.
A) 0.0696
B) 0.1532
C) 0.2087
D) 0.3319
The Canadian government would like to test the hypothesis that the average hourly
wage for men is more than $2.00 higher than the average hourly wage for women. The
following data summarizes the sample statistics for hourly wages for men and women.
Assume that the population variances are equal.
If Population 1 is defined as men and Population 2 is defined as women, and using α =
0.025, the critical value for this hypothesis test would be ________.
A) 1.296
B) 1.306
C) 1.688
D) 2.028

A method of gathering data when people are asked a series of questions that can be
administered by e-mail, via the Web, face-to-face or over the telephone, is known as
_________.
A) direct observation
B) focus groups
C) experiments
D) surveys
Weighted moving average is an example of a ________ forecasting technique.
A) smoothing
B) regression analysis
C) multiplicative decomposition
D) seasonal
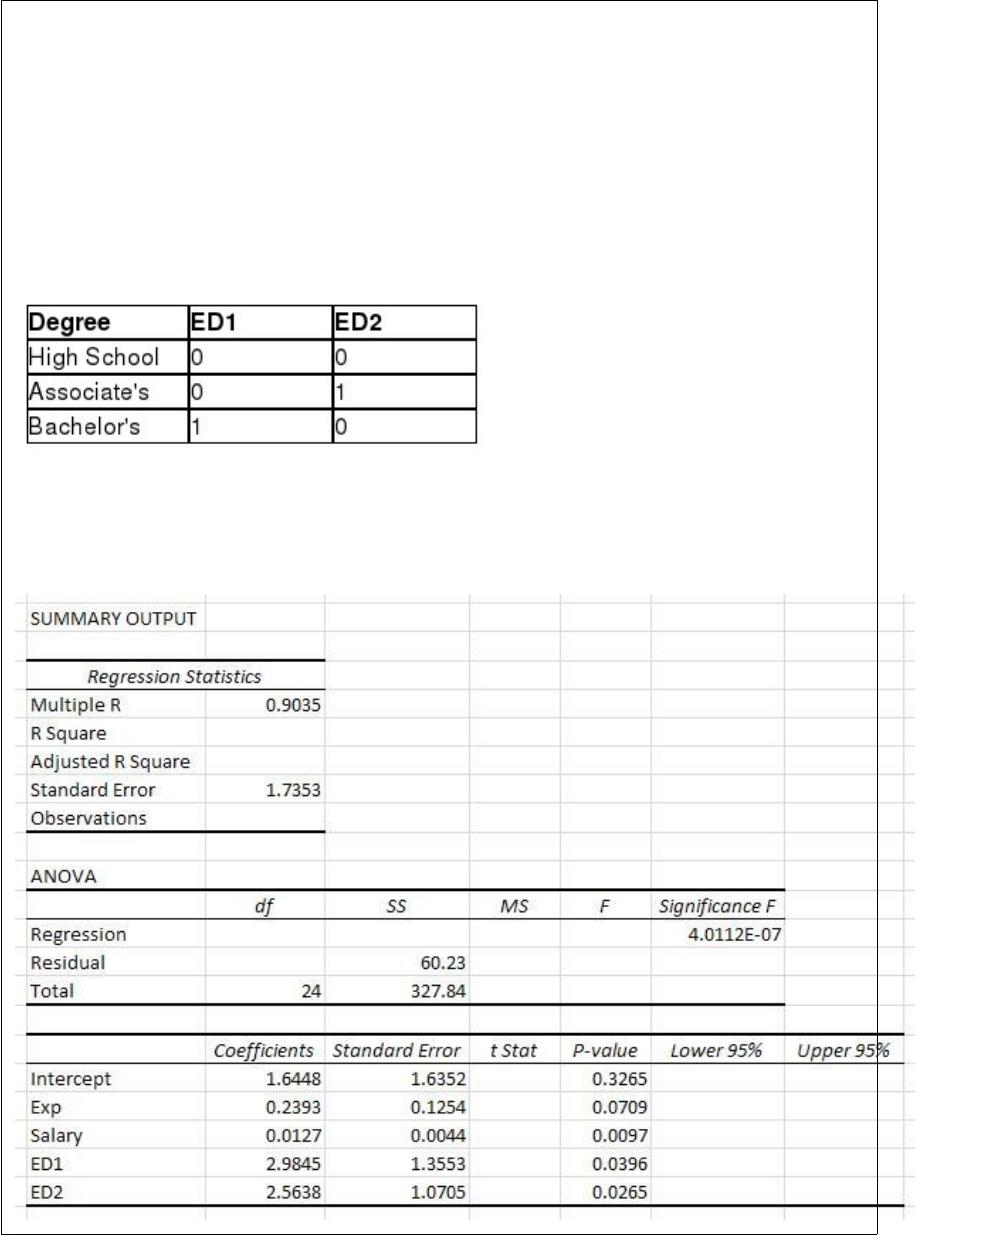
Use the following information to answer the question(s) below.
Ford would like to develop a regression model that would predict the number of cars
sold per month by a dealership employee based on the employee’s number of years of
sales experience (Exp), the employee’s weekly base salary before commissions (Salary),
and the education level of the employee. There are three levels of education in the sales
forcehigh school degree, associate’s degree, and bachelor’s degree. The following
dummy variables have been defined.
The following Excel output shows the partially completed regression output from a
random sample of employees from the previous month.
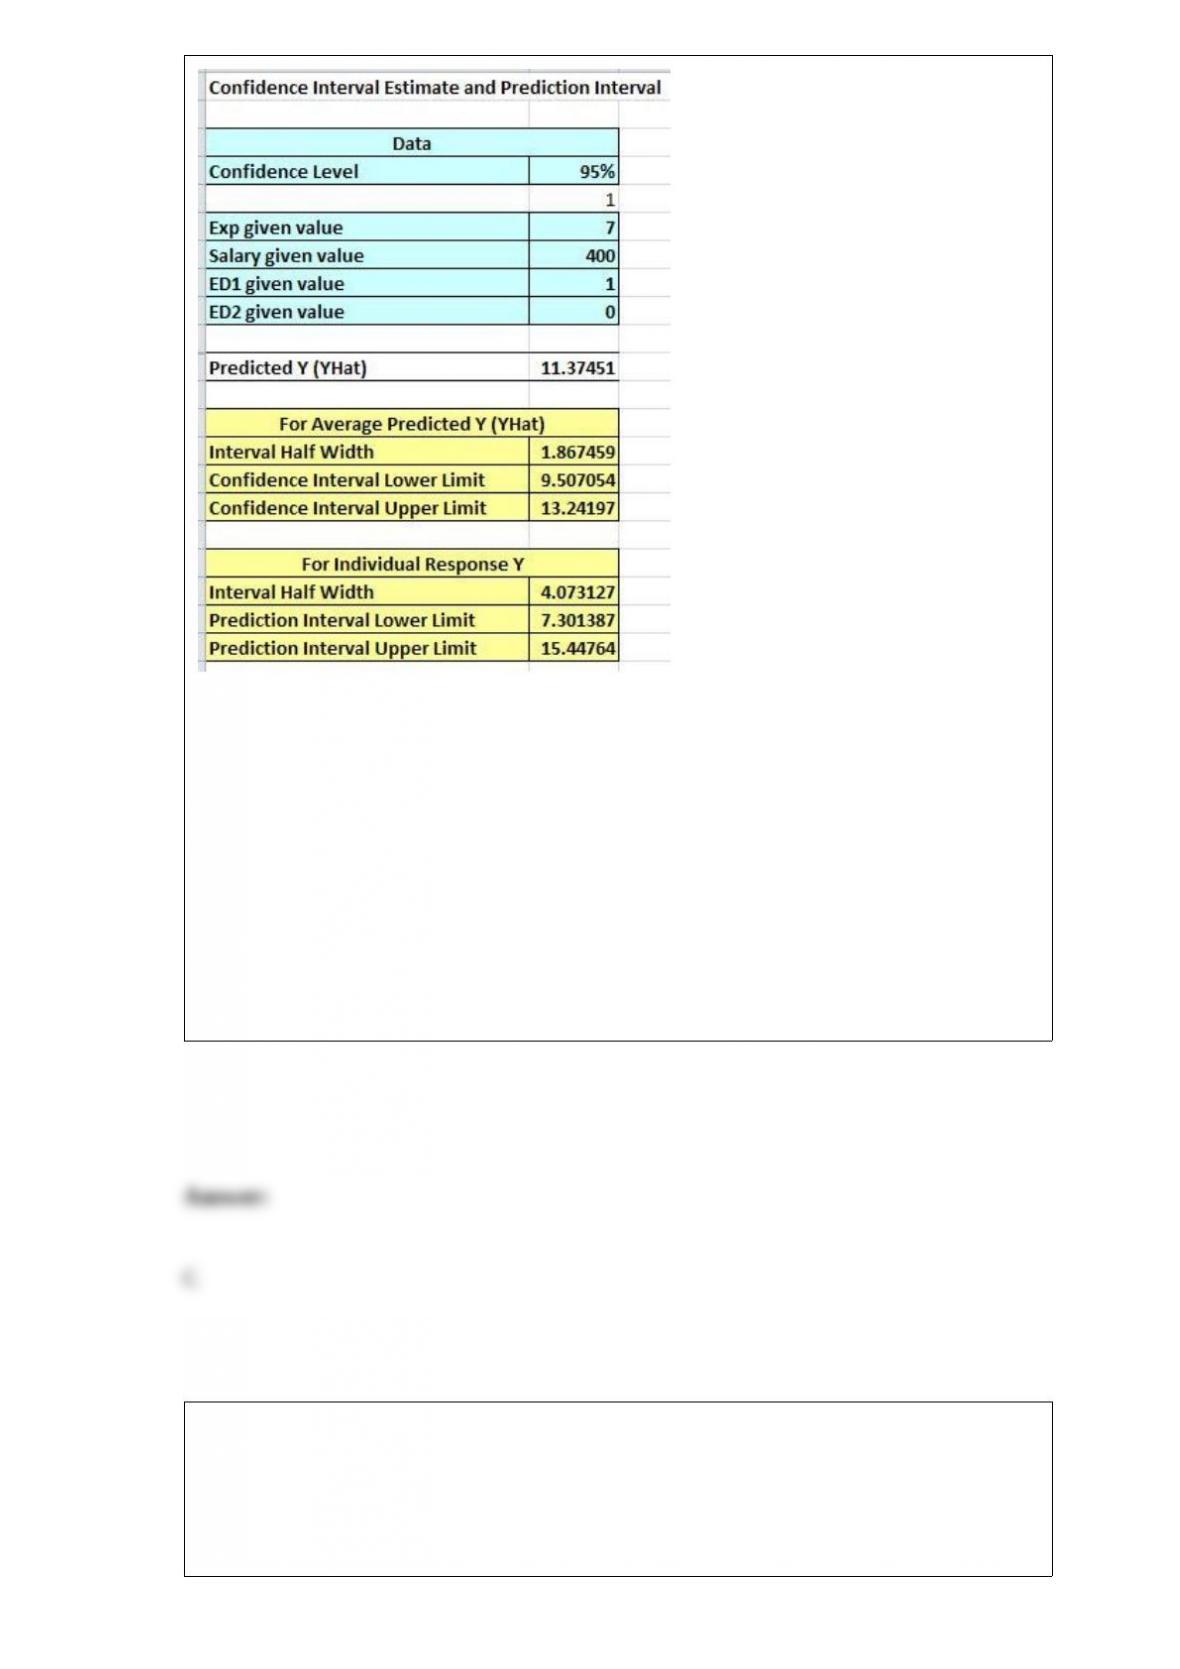
The 95% prediction interval for the number of cars sold per month by a specific
employee with seven years of experience, a salary of $400 per week, and a bachelor’s
degree is ________.
A) (5.50, 17.24)
B) (8.58, 14.16)
C) (7.30, 15.45)
D) (9.51, 13.24)
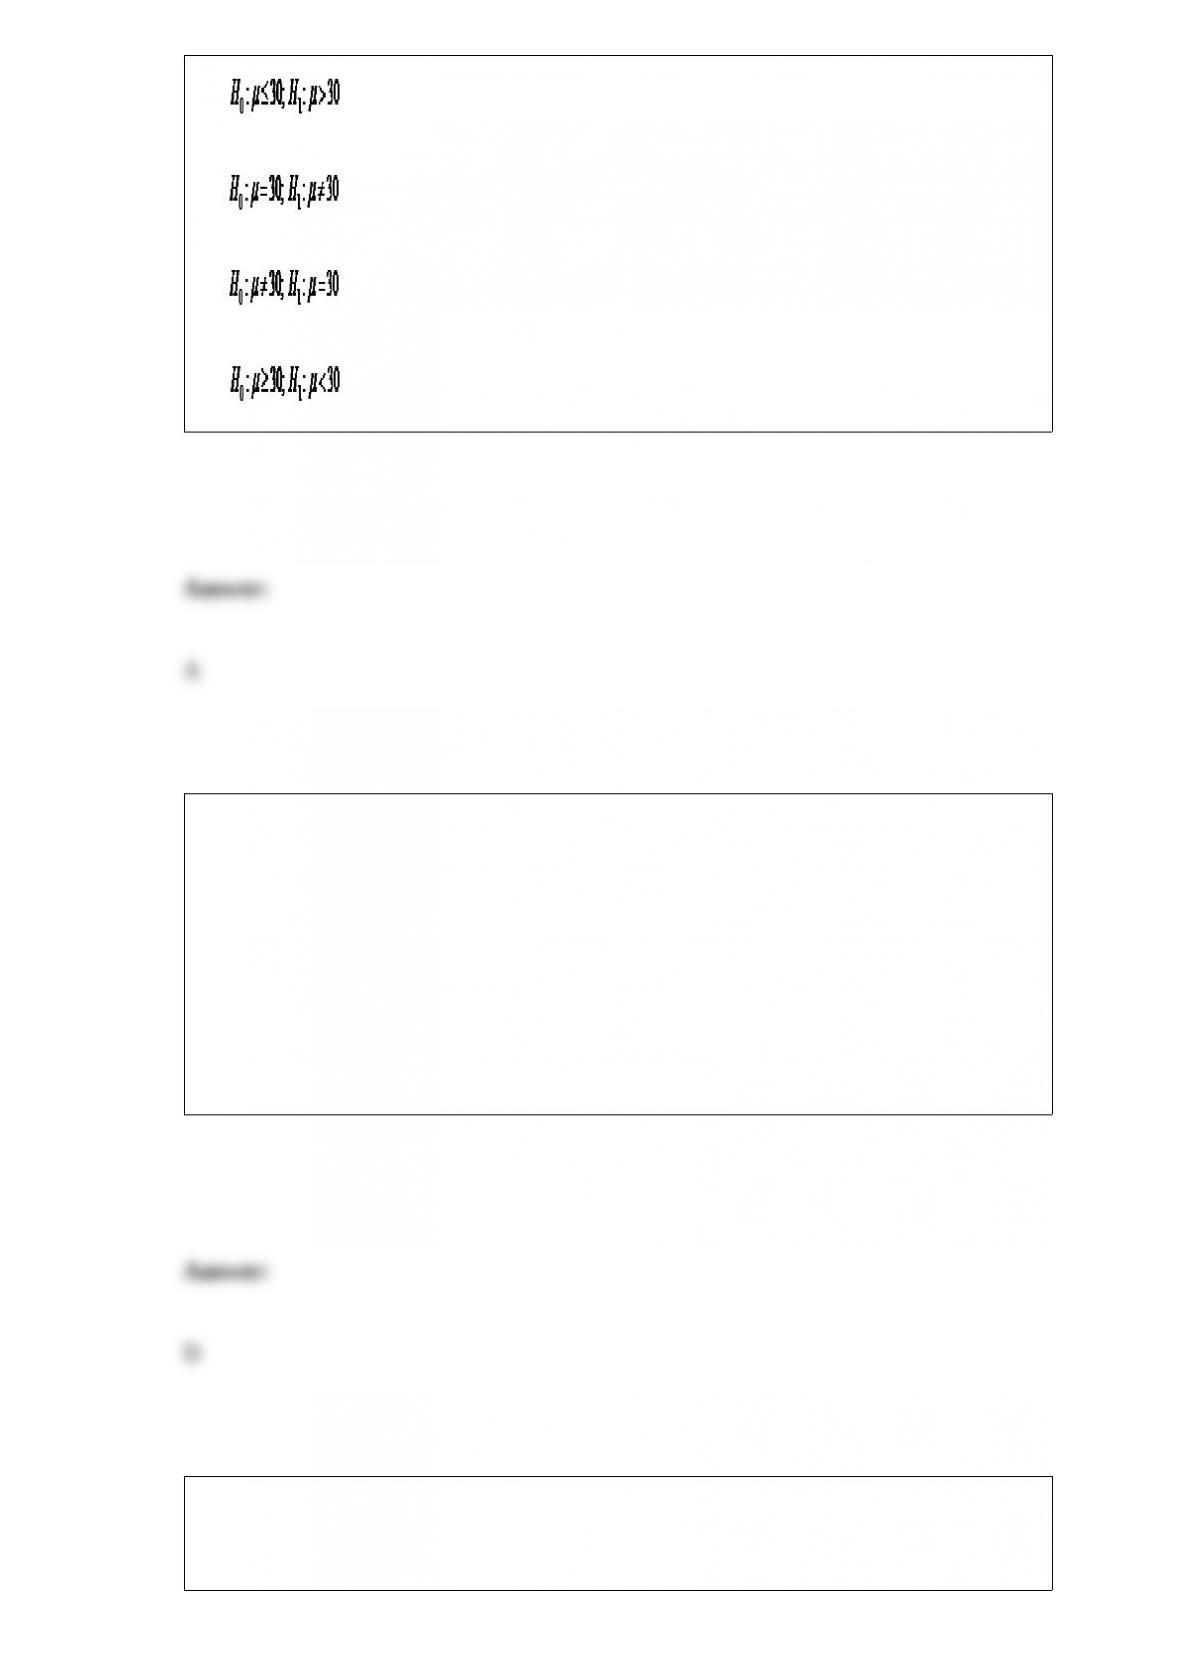
Entertainment Software Association would like to test if the average age of “gamers”
(those that routinely play video games) is more than 30 years old. The correct
hypothesis statement for Entertainment Software Association would be
_____________________.
A)
B)
C)
D)
________ variables are used to represent qualitative data in a multiple regression model
and can only take on the values 0 and 1.
A) Regression
B) Dependent
C) Independent
D) Dummy
Medicare would like to test the hypothesis that the standard deviation for the monthly
rate for a one-bedroom assisted-living facility is more than $400. A random sample of
17 assisted living facilities had a standard deviation of $530. The degrees of freedom
for this hypothesis test would be ________.
A) 16
B) 17
C) 18
D) 19
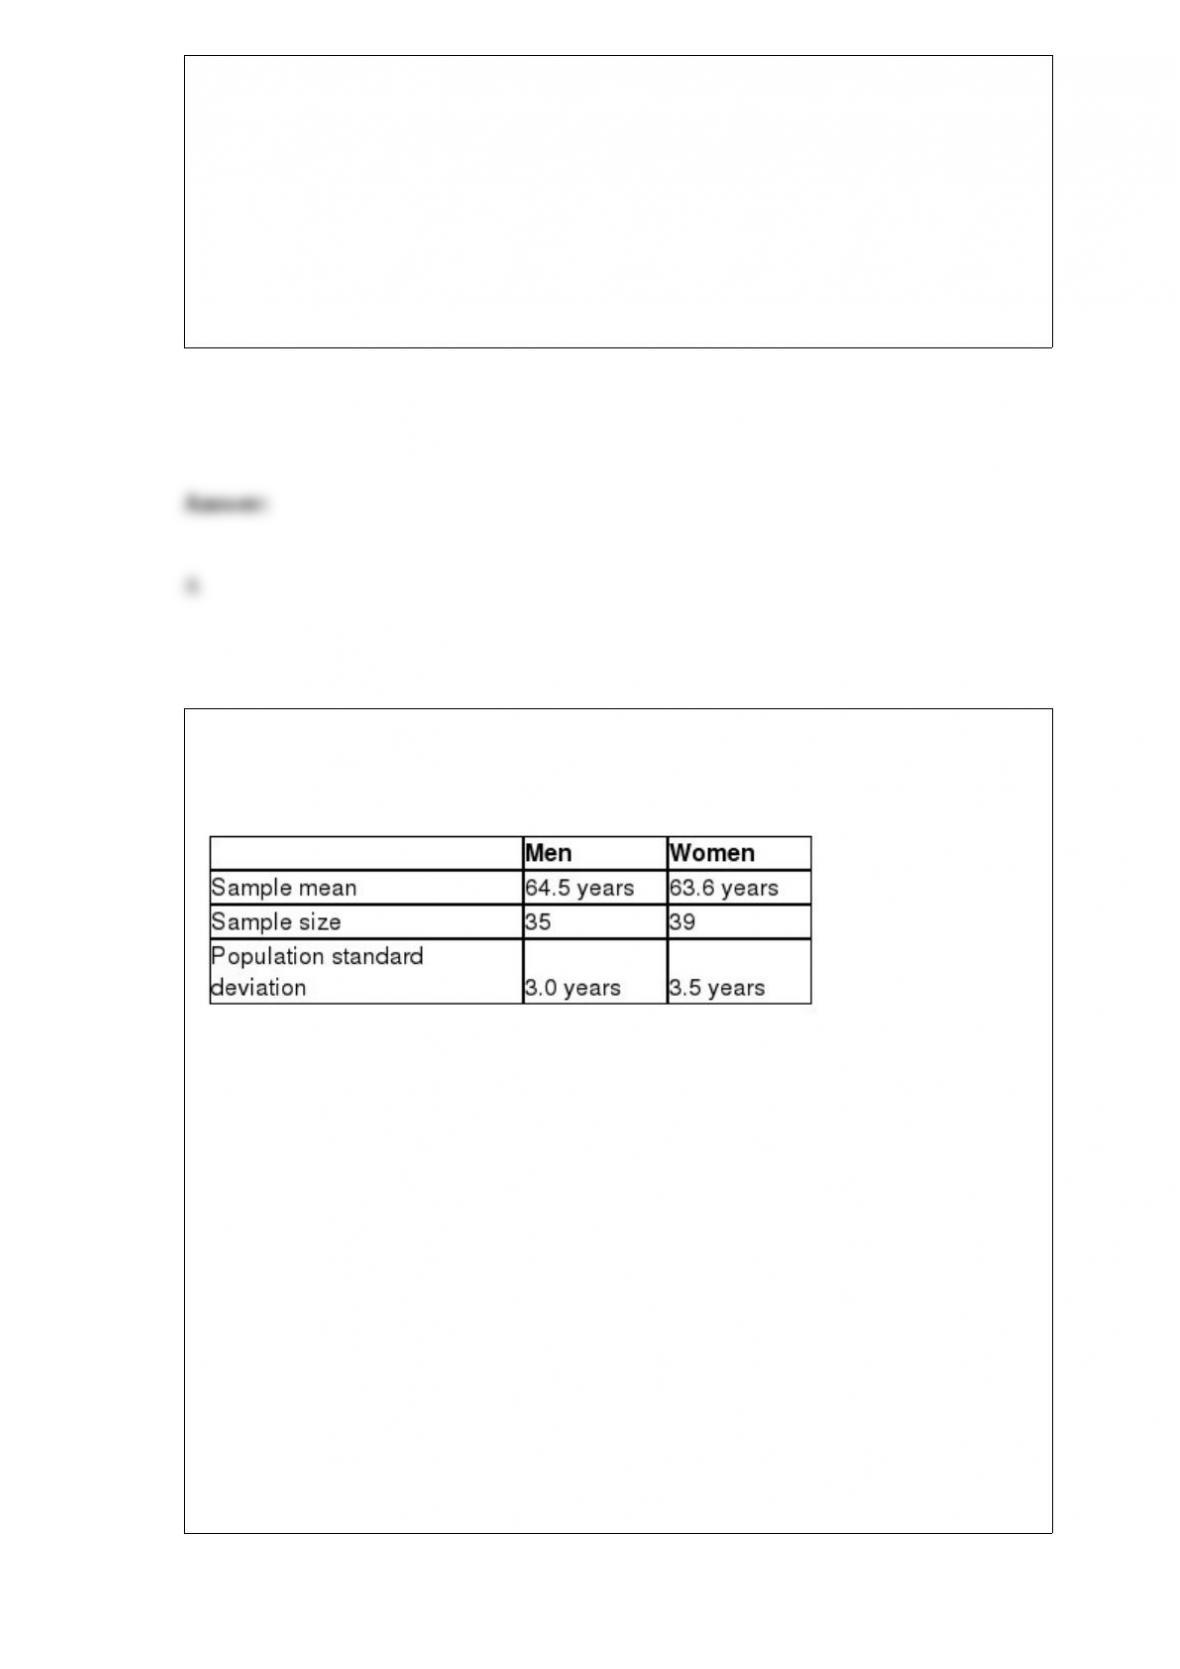
The federal government would like to test the hypothesis that the average age of men
filing for Social Security is higher than the average age of women set using α = 0.05
with the following data:
If Population 1 is defined as men and Population 2 is defined as women, the conclusion
for this hypothesis test would be that because the test statistic is
________________________________________________________________.
A) more than the critical value, we can conclude that the average age of men filling for
social security is more than the average age of women
B) less than the critical value, we can conclude that the average age of men filling for
social security is less than the average age of women
C) more than the critical value, we cannot conclude that the average age of men filling
for social security is more than the average age of women
D) less than the critical value, we cannot conclude that the average age of men filling
for social security is more than the average age of women
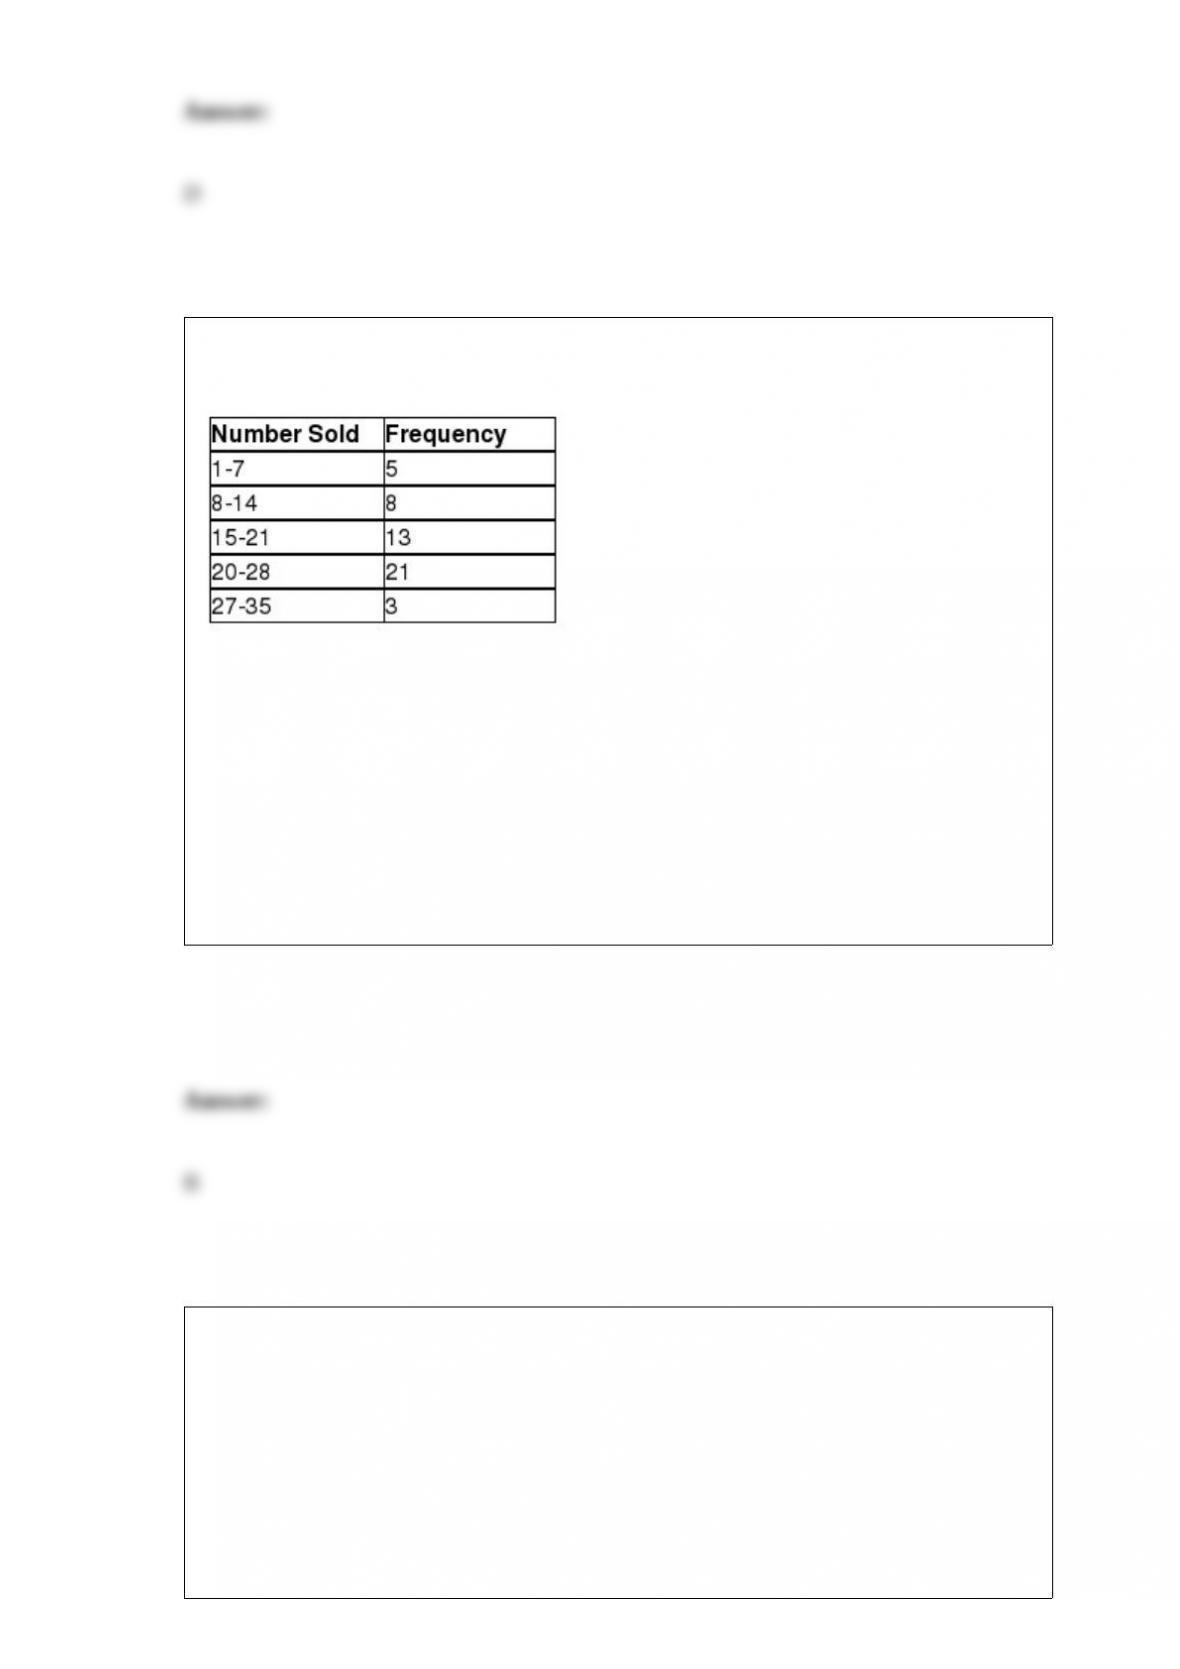
The following frequency distribution displays the daily sales of muffins at Avalon
Bakery.
How many days of data are included in this frequency distribution?
A) 25
B) 50
C) 75
D) 100
Dwight Howard plays center in the National Basketball Association and averaged 1.8
blocked shots per game during a recent season. Assume that the number of blocked
shots per game follows the Poisson distribution. What is the probability that Dwight
Howard will block exactly two shots during the first half of the next game?
A) 0.1169
B) 0.1647

C) 0.2860
D) 0.3427
The Beer Institute reported that monthly consumption of beer is 1.7 gallons per person.
A random sample of 36 adults was selected. Using a standard deviation of 0.5 gallons
per month per person, what is the probability that the sample mean was between 1.6 and
1.8 gallons per month per person?
A) 0.4960
B) 0.5596
C) 0.7698
D) 0.9082
The sum of squares________ represents the random variation in the data not attributed
to either the main factor or the blocking factor in randomized block ANOVA.
A) within
B) between
C) block
D) error

The _________________ provides an estimate for the population variance if the null
hypothesis is true for one-way ANOVA.
A) sum of squares error
B) total sum of squares
C) mean square between
D) mean square within
Bob’s golf score at his local course follows the normal distribution with a mean of 92.1
and a standard deviation of 3.8. What is the probability that the score on his next round
of golf will be between 82 and 89?
A) 0.2022
B) 0.3269
C) 0.3960
D) 0.4832

A smaller standard deviation for the normal probability distribution results in a
_______________________.
A) fatter curve that is more spread out around the mean and not as tall
B) fatter curve that is tighter and taller around the mean
C) skinnier curve that is tighter and taller around the mean
D) skinnier curve that is more spread out around the mean and not as tall
The average natural gas bill for a random sample of 21 homes in the 19808 zip code
during the month of March was $311.90 with a sample standard deviation of $51.60.
The approximate standard error of the mean for this sample is ________.
A) 8.20
B) 9.93
C) 11.27
D) 14.74

Verizon Wireless would like to estimate the proportion of households that use cell
phones for their phone service without a land line. A random sample of 150 households
was selected and 48 relied strictly on cell phones for their service. The margin of error
for a 90% confidence interval for the proportion based on this sample is ________.
A) 0.0333
B) 0.0475
C) 0.0561
D) 0.0627
Progressive Insurance would like to test the hypothesis that a difference exists in the
proportion of students in 12th grade who text while driving when compared to the
proportion of 11th grade drivers who text. A random sample of 160 12th grade students
found that 84 texted while driving. A random sample of 175 11th grade students found
that 70 texted while driving. If Population 1 is defined as 12th grade drivers and
Population 2 is defined as 11th grade drivers, the pooled estimate for the overall
proportion is ________.
A) 0.460
B) 0.506
C) 0.611
D) 0.780
The ________ measures the total variation in the dependent variable in simple
regression analysis.
A) sum of squares within
B) sum of squares error
C) sum of squares regression
D) total sum of squares
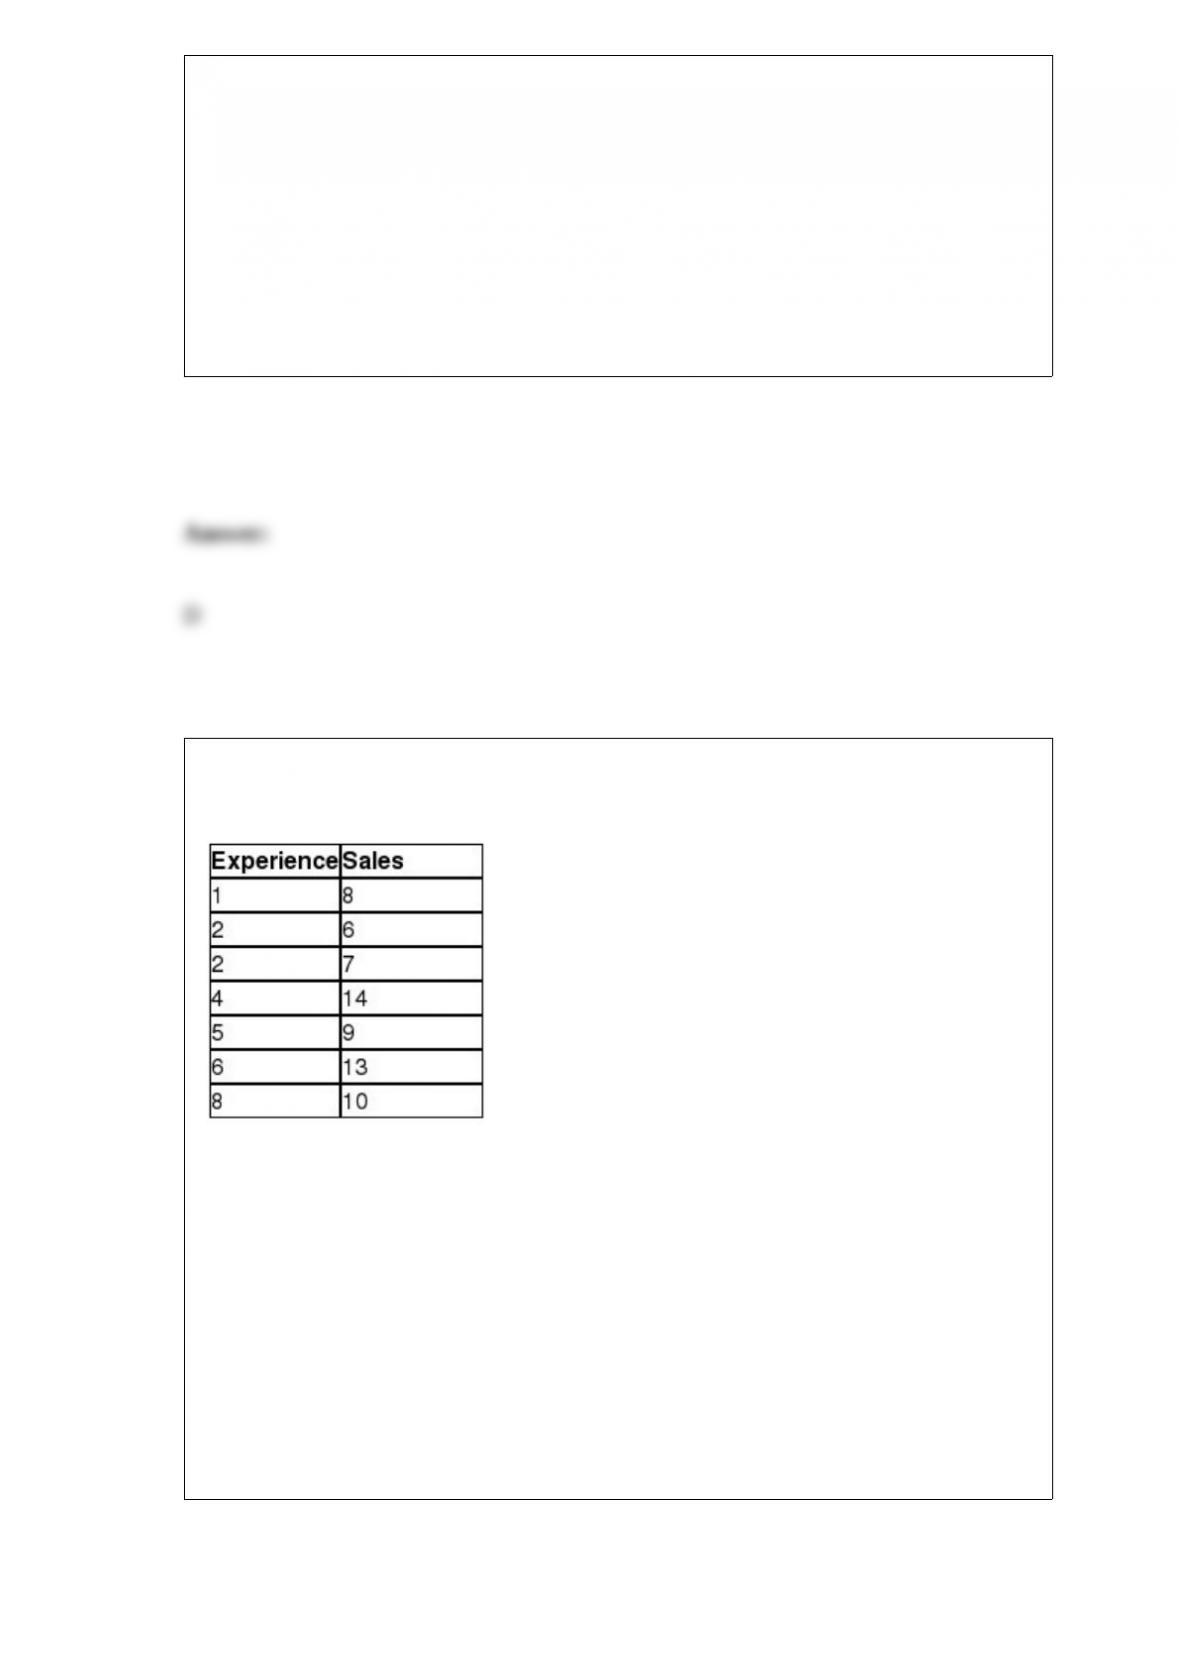
The table below shows the number of cars sold last month by seven employees at
Concord Motors and their number of years of sales experience.
Management would like to use simple regression analysis to estimate monthly car sales
using the number of years of sales experience. The coefficient of determination for this
sample is ________.
A) 0.307
B) 0.419
C) 0.567
D) 0.612

The ________ measures the variability, or spread, of the data points in a set around the
set’s mean.
A) mode
B) variance
C) median
D) range
Sara is a regional manager for a restaurant chain that has locations in the towns of
Florence, Camden, and Columbia. A random sample of customers at all three locations
were asked to rate their satisfaction level on a scale of 1 to 20. A two-way ANOVA
procedure was performed on this data using α = 0.05 with Factor A representing each
location and Factor B representing the customer ‘s gender. The results are summarized
below in the ANOVA table.
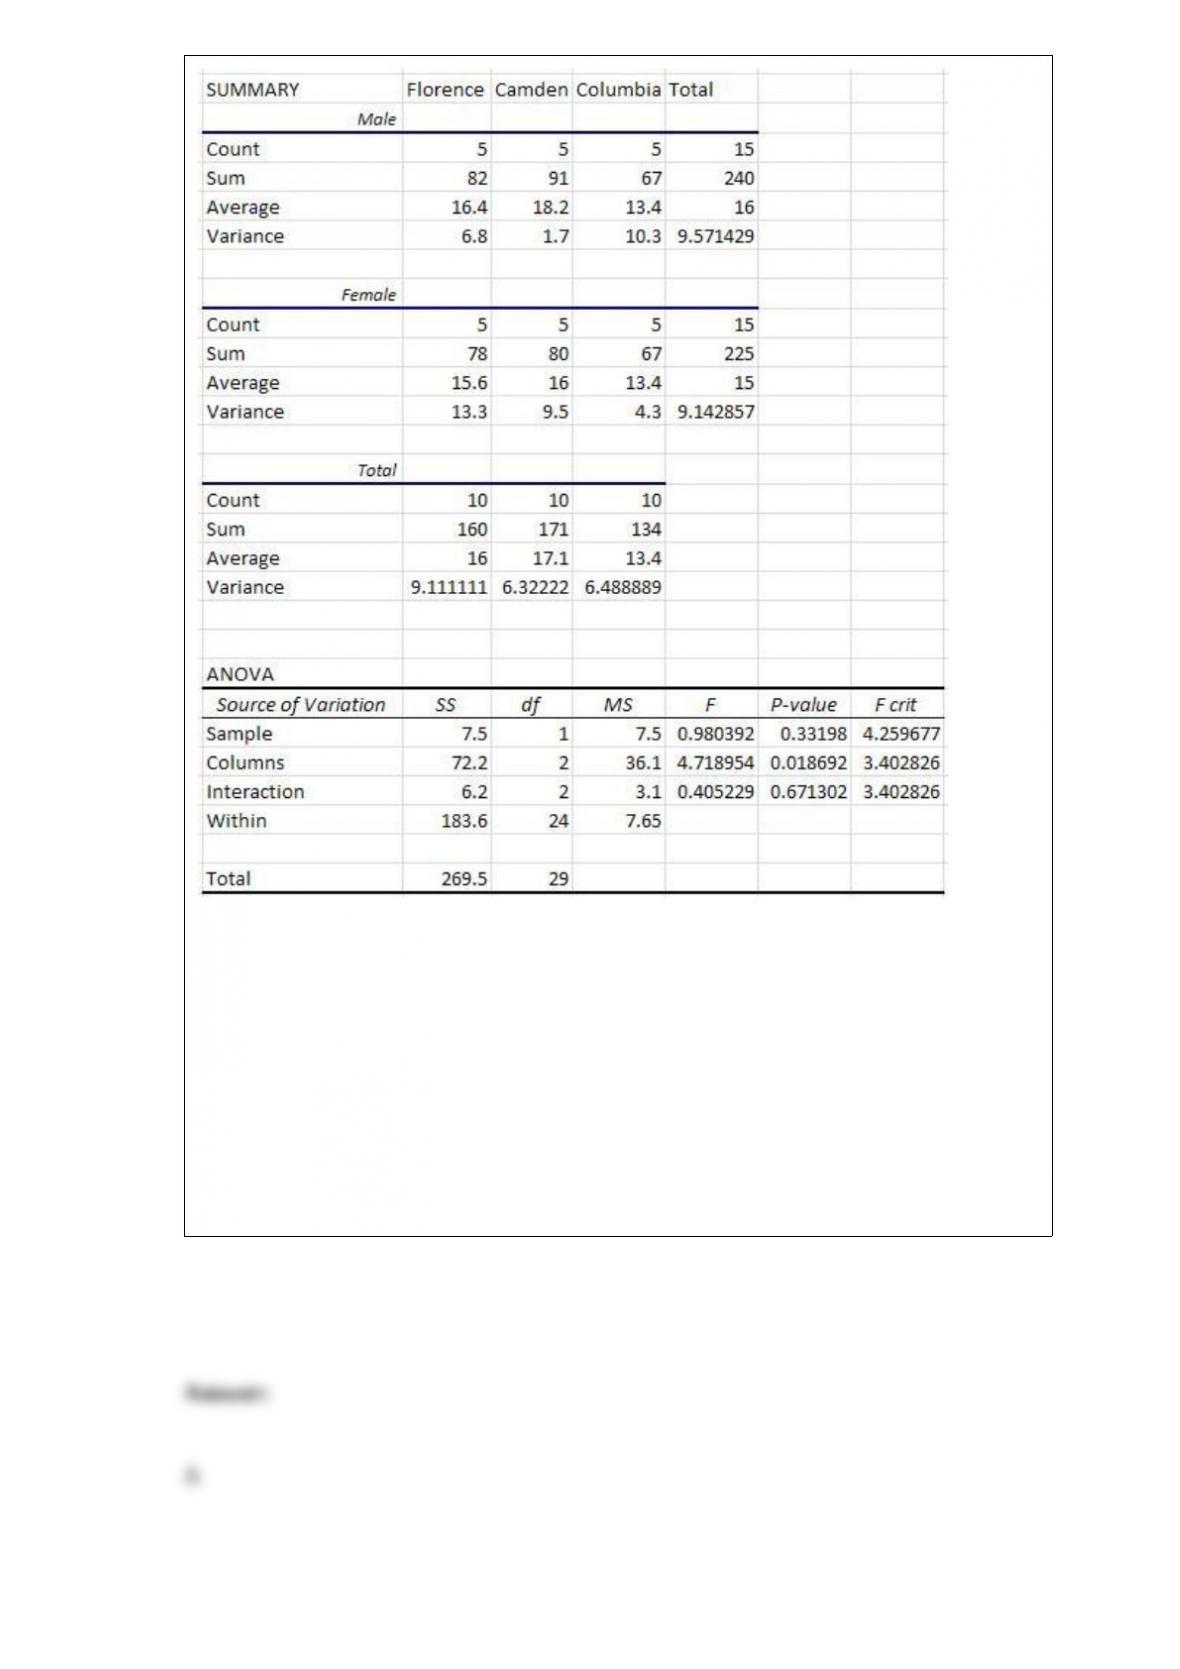
The critical value for the Tukey-Kramer critical range for Factor A using α = 0.05 is
________.
A) 3.53
B) 3.61
C) 3.88
D) 4.60
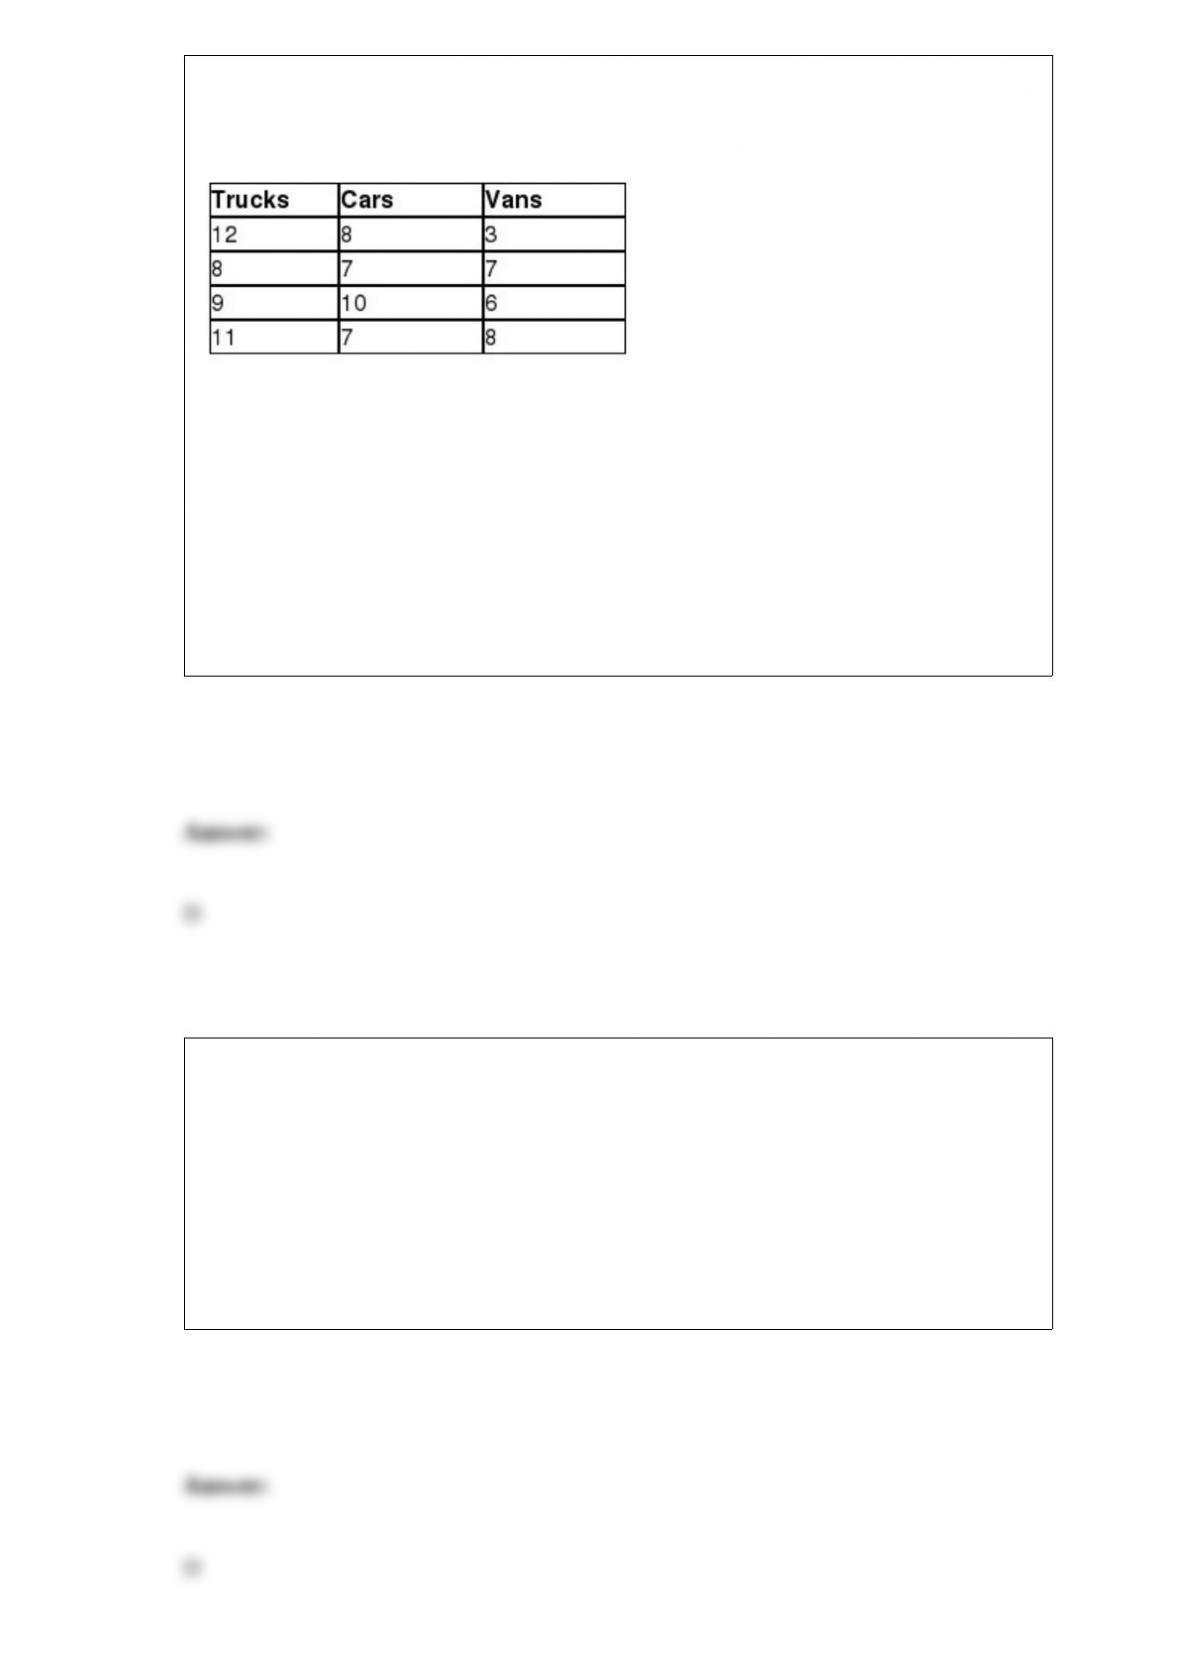
AutoTrader.com would like to test if a difference exists in the median age of three
different types of vehicles currently on the road–trucks, cars, and vans. The following
data represent the age of a random sample of trucks, cars, and vans.
The test statistic for this hypothesis test is ________.
A) 3.55
B) 4.36
C) 5.11
D) 6.04
The shape of the uniform probability distribution is ____________.
A) symmetrical
B) left-skewed
C) right-skewed
D) flat
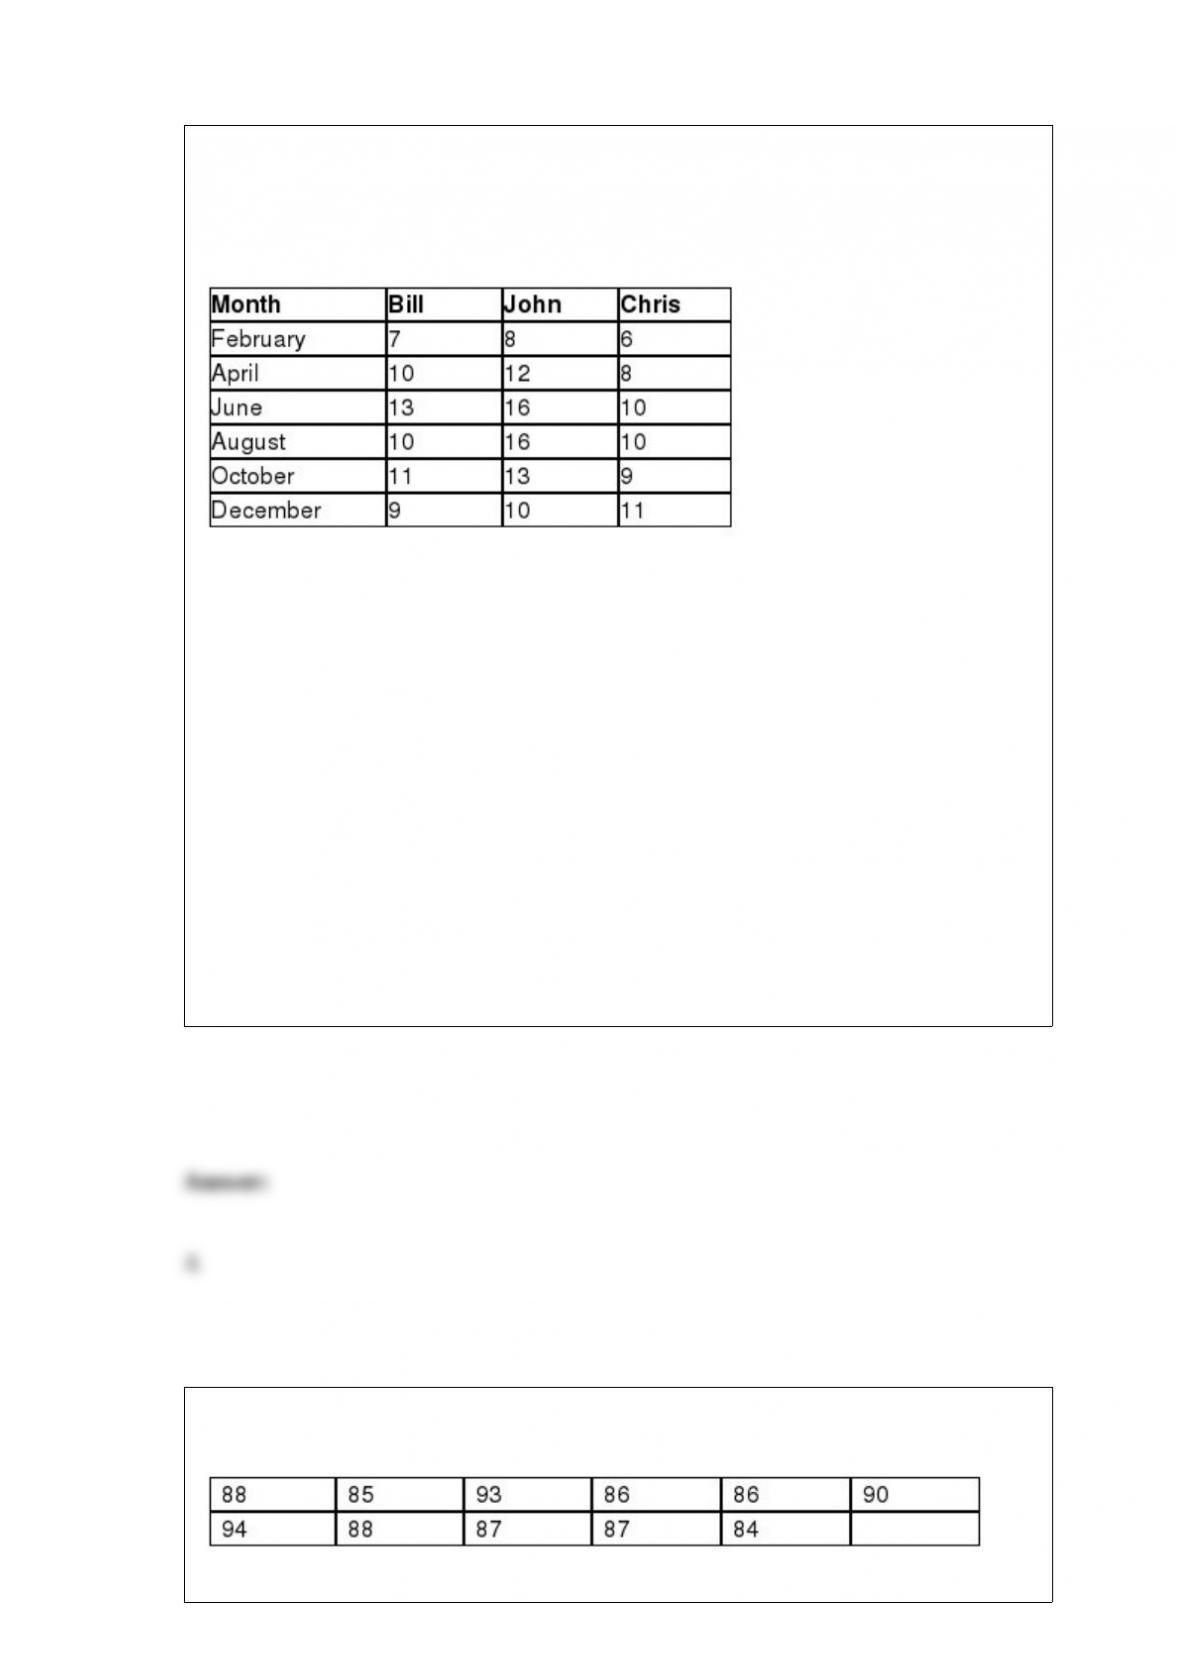
Sheridan Motors is a car dealership that would like to investigate if there is a difference
in the average number of car sales per month between three sales employees using a
randomized block ANOVA. The following data represent the number of car sales last
year for these employees for six different months.
The conclusion for this hypothesis test using α = 0.05 would be that because the main
factor test statistic is
__________________________________________________________________.
A) more than the main factor critical value, we can conclude that there is a difference in
the average monthly car sales between these three employees
B) less than the main factor critical value, we can conclude that there is a difference in
the average monthly car sales between these three employees
C) more than the main factor critical value, we cannot conclude that there is a
difference in the average monthly car sales between these three employees
D) less than the main factor critical value, we cannot conclude that there is a difference
in the average monthly car sales between these three employees
A golfer claims that his median golf score at the course he plays regularly is less than
90. The following random sample from 11 rounds were collected to test this hypothesis.
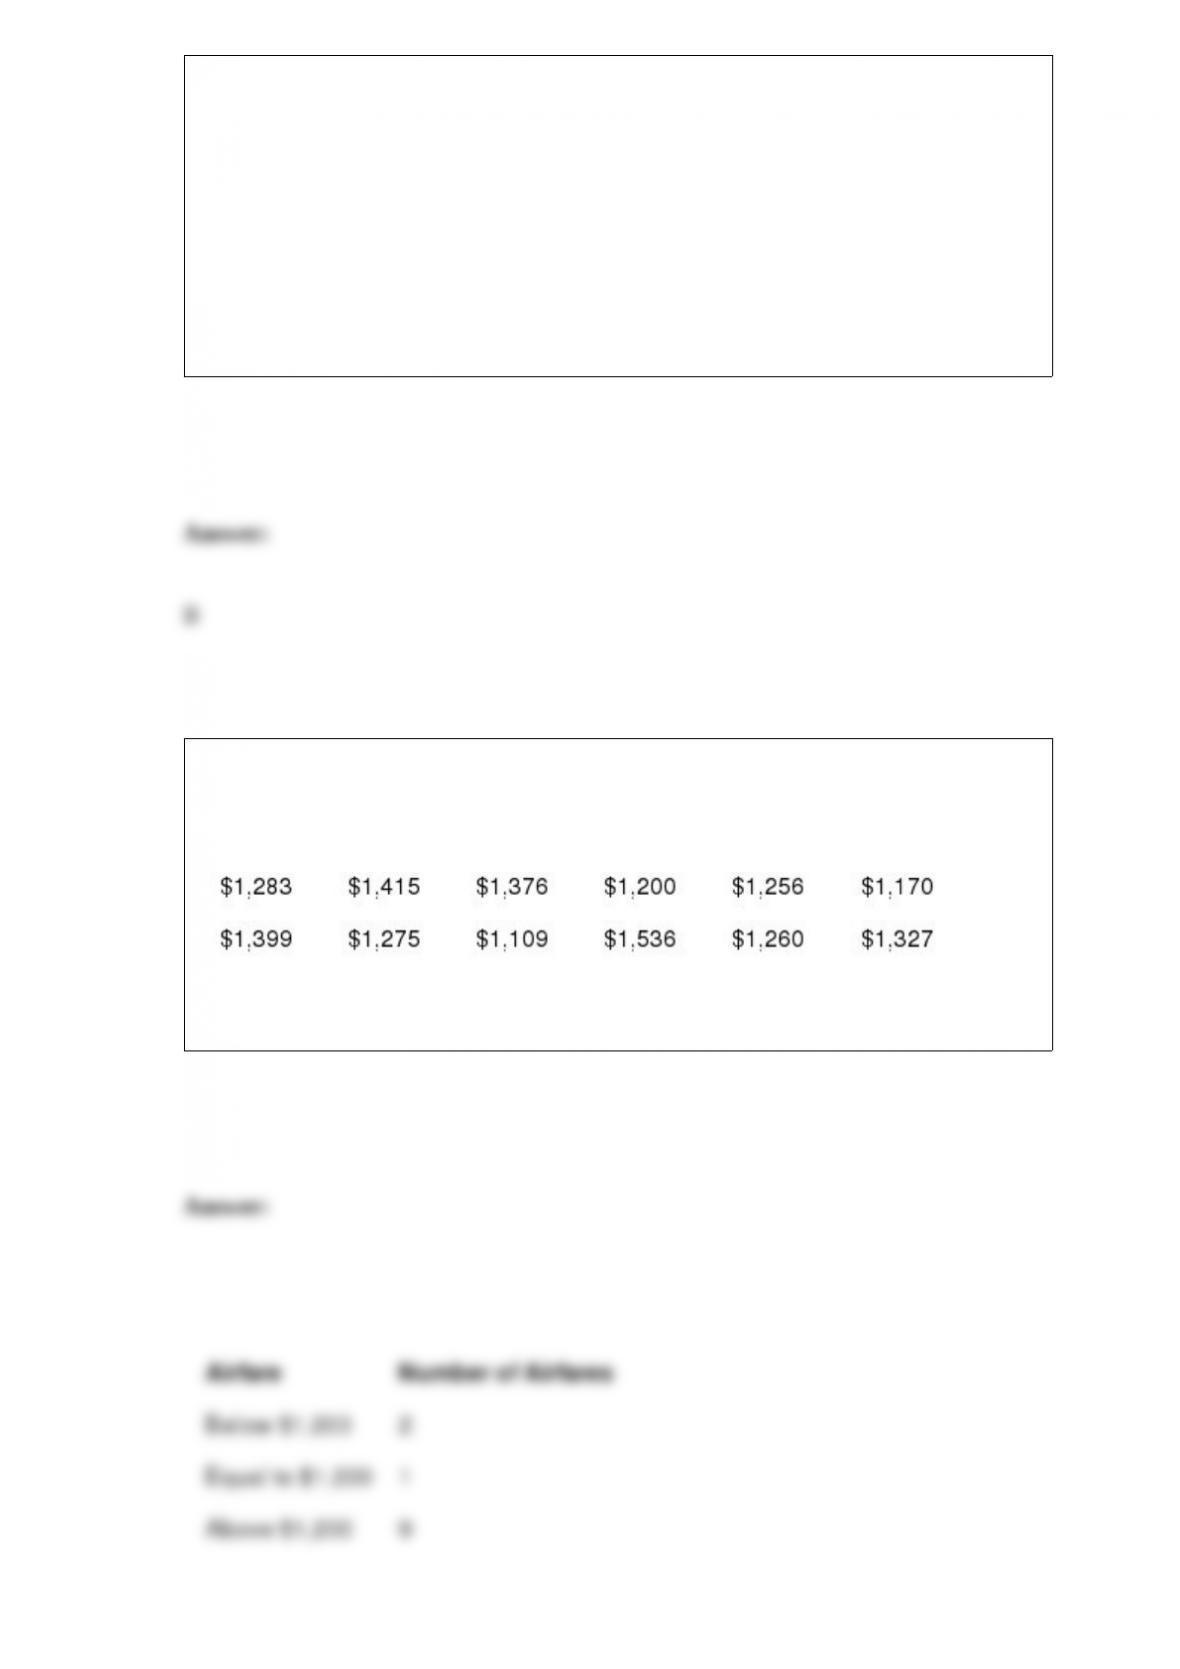
The appropriate nonparametric procedure for this analysis is the _________________
test.
A) Wilcoxon rank-sum
B) sign
C) Wilcoxon signed-rank
D) Kruskal-Wallis
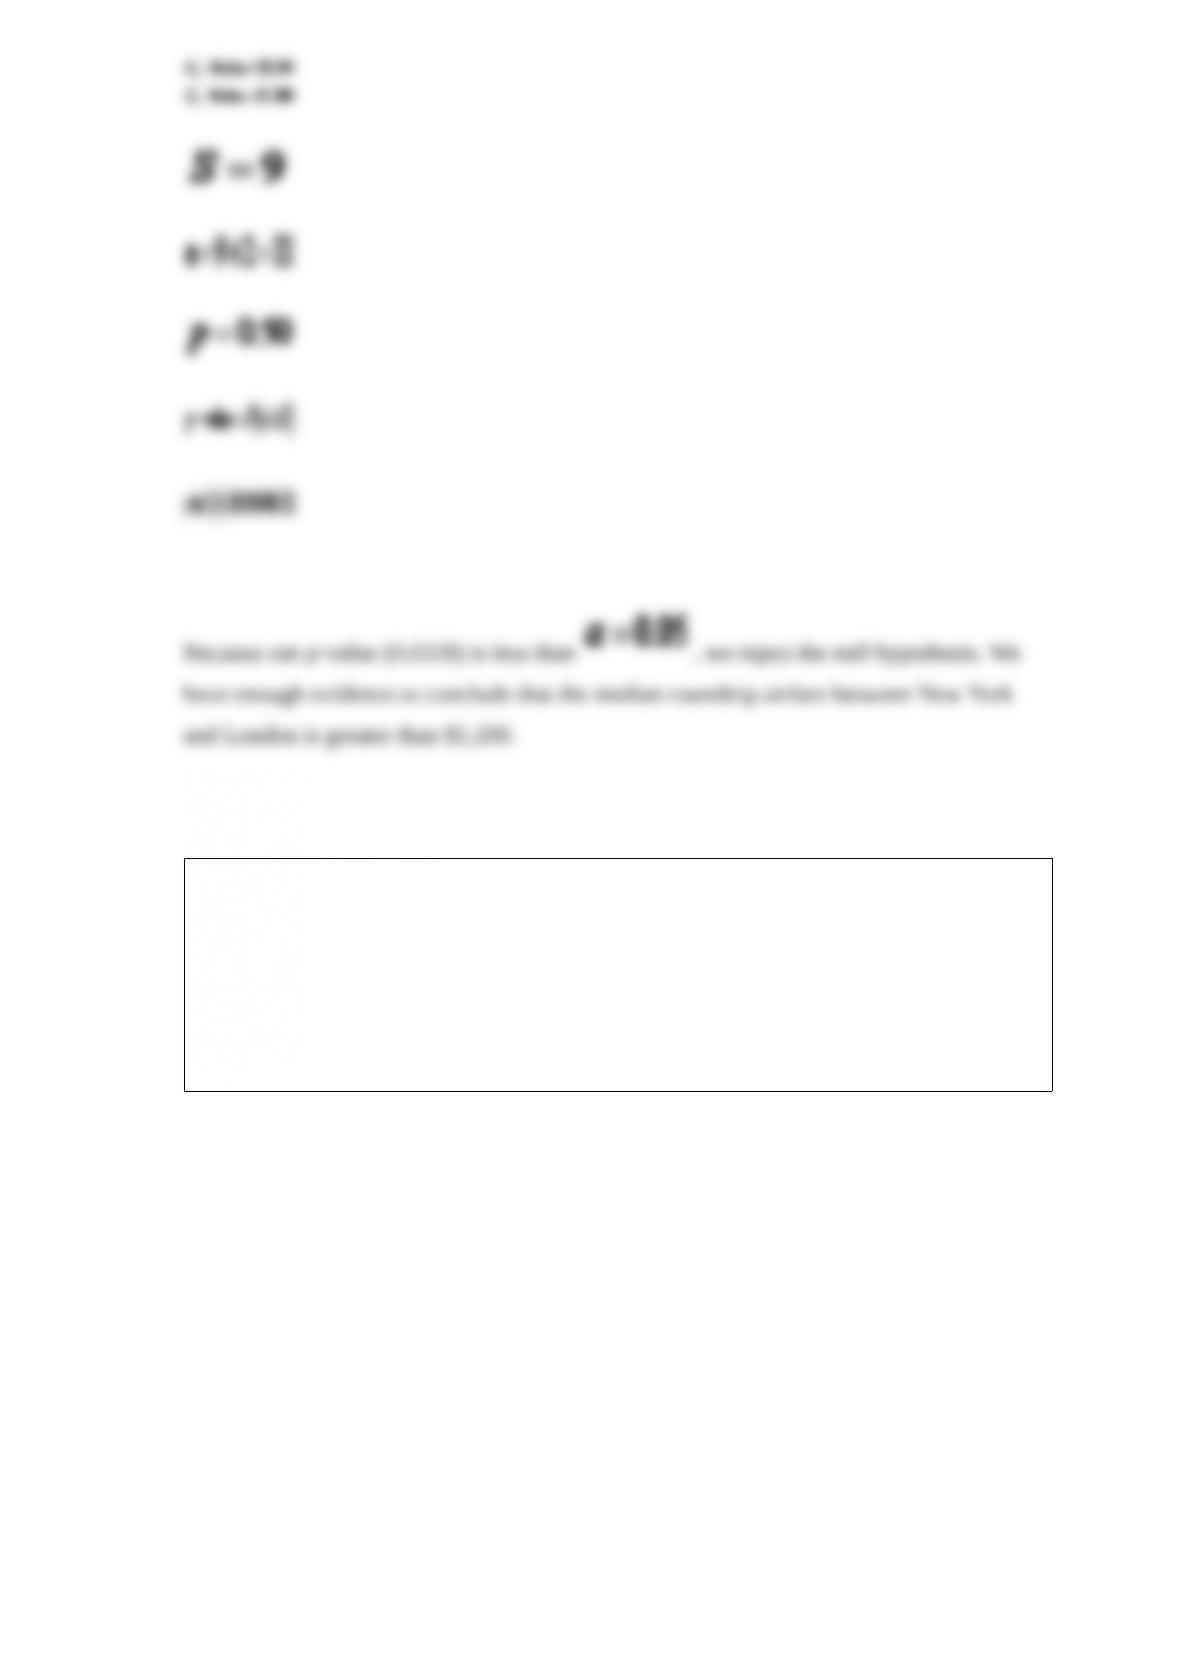
Travelocity would like to test if the median roundtrip airfare between New York and
London is greater than $1,200. The following table shows randomly selected airfares
between these two cities.
Perform this hypothesis test using α = 0.05.
Use the following information to answer the question(s) below.
The following data provides the monthly Comcast cable bill for a random sample of 20
households along with the number of televisions in the household (TV), the number of
people living in the household (People), and the number of years that household has
been a Comcast customer (Years).
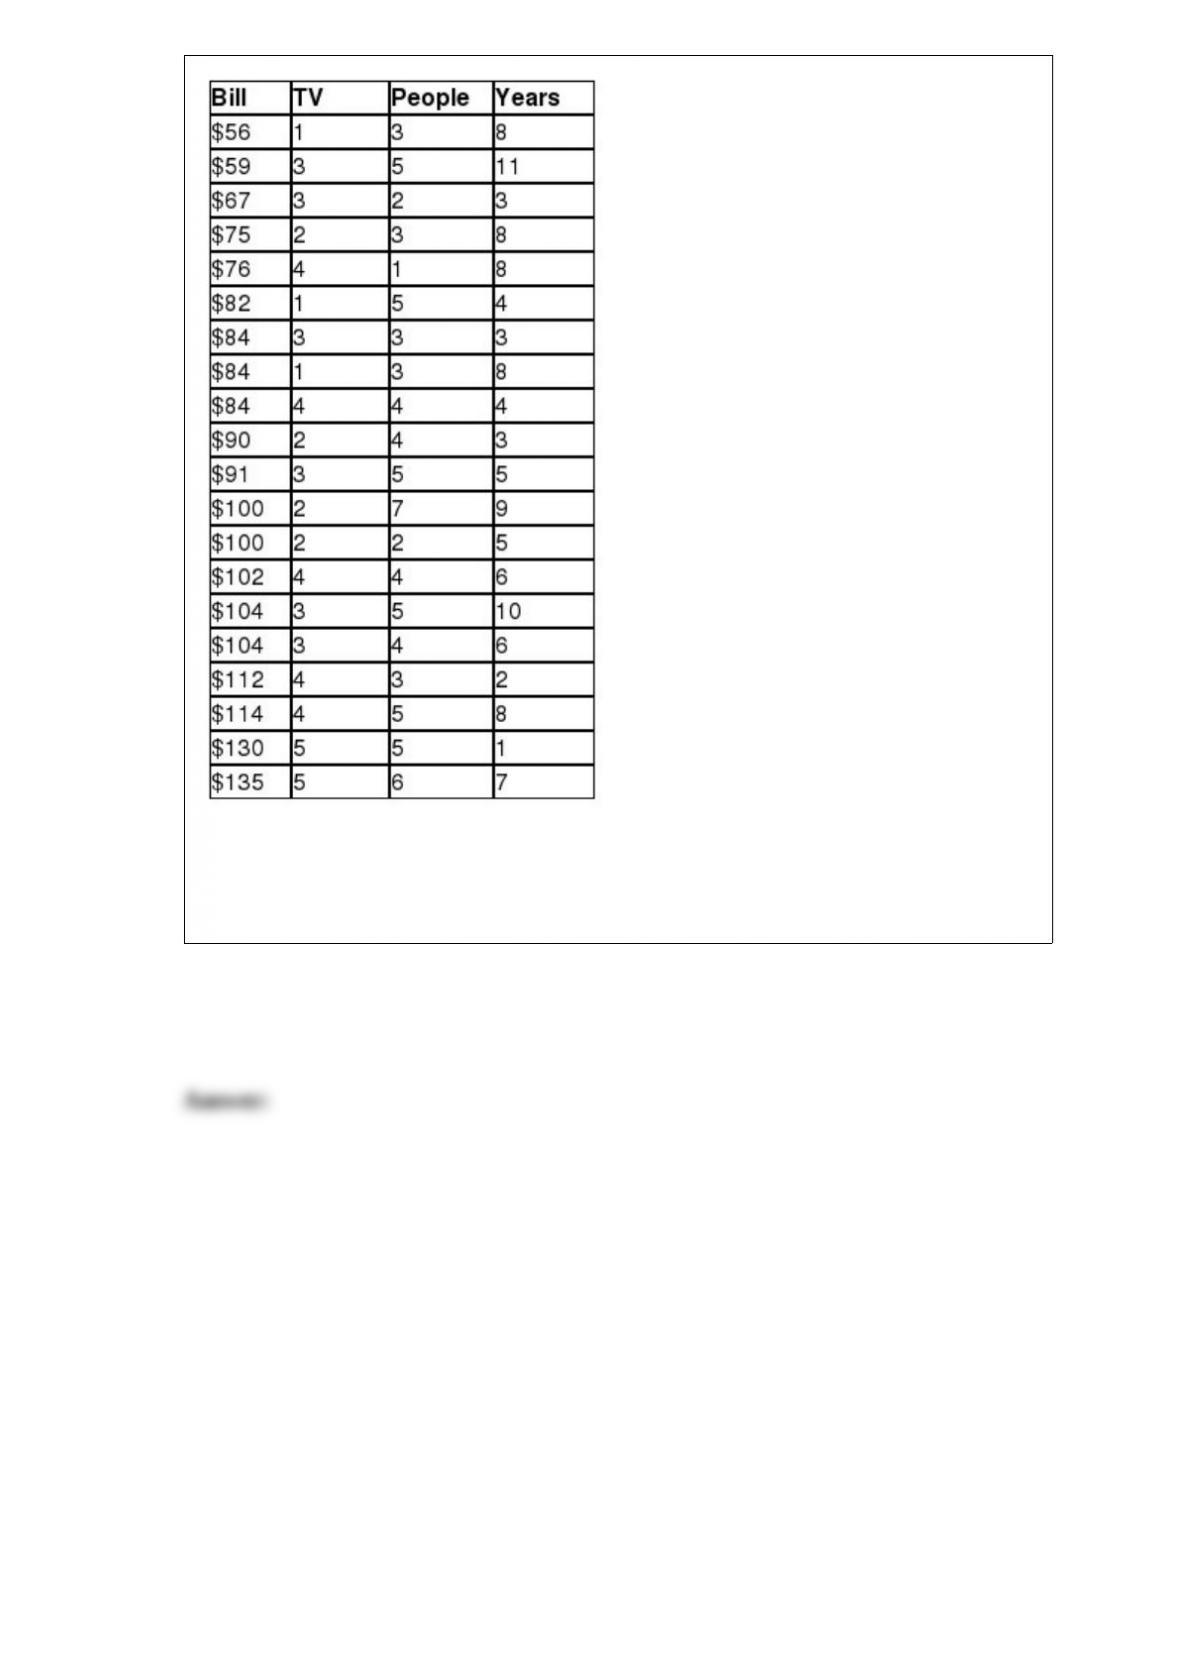
Construct a 95% prediction interval to estimate the monthly cable bill for a specific
household that has three televisions, has four people in the household, and has been a
Comcast customer for 10 years.
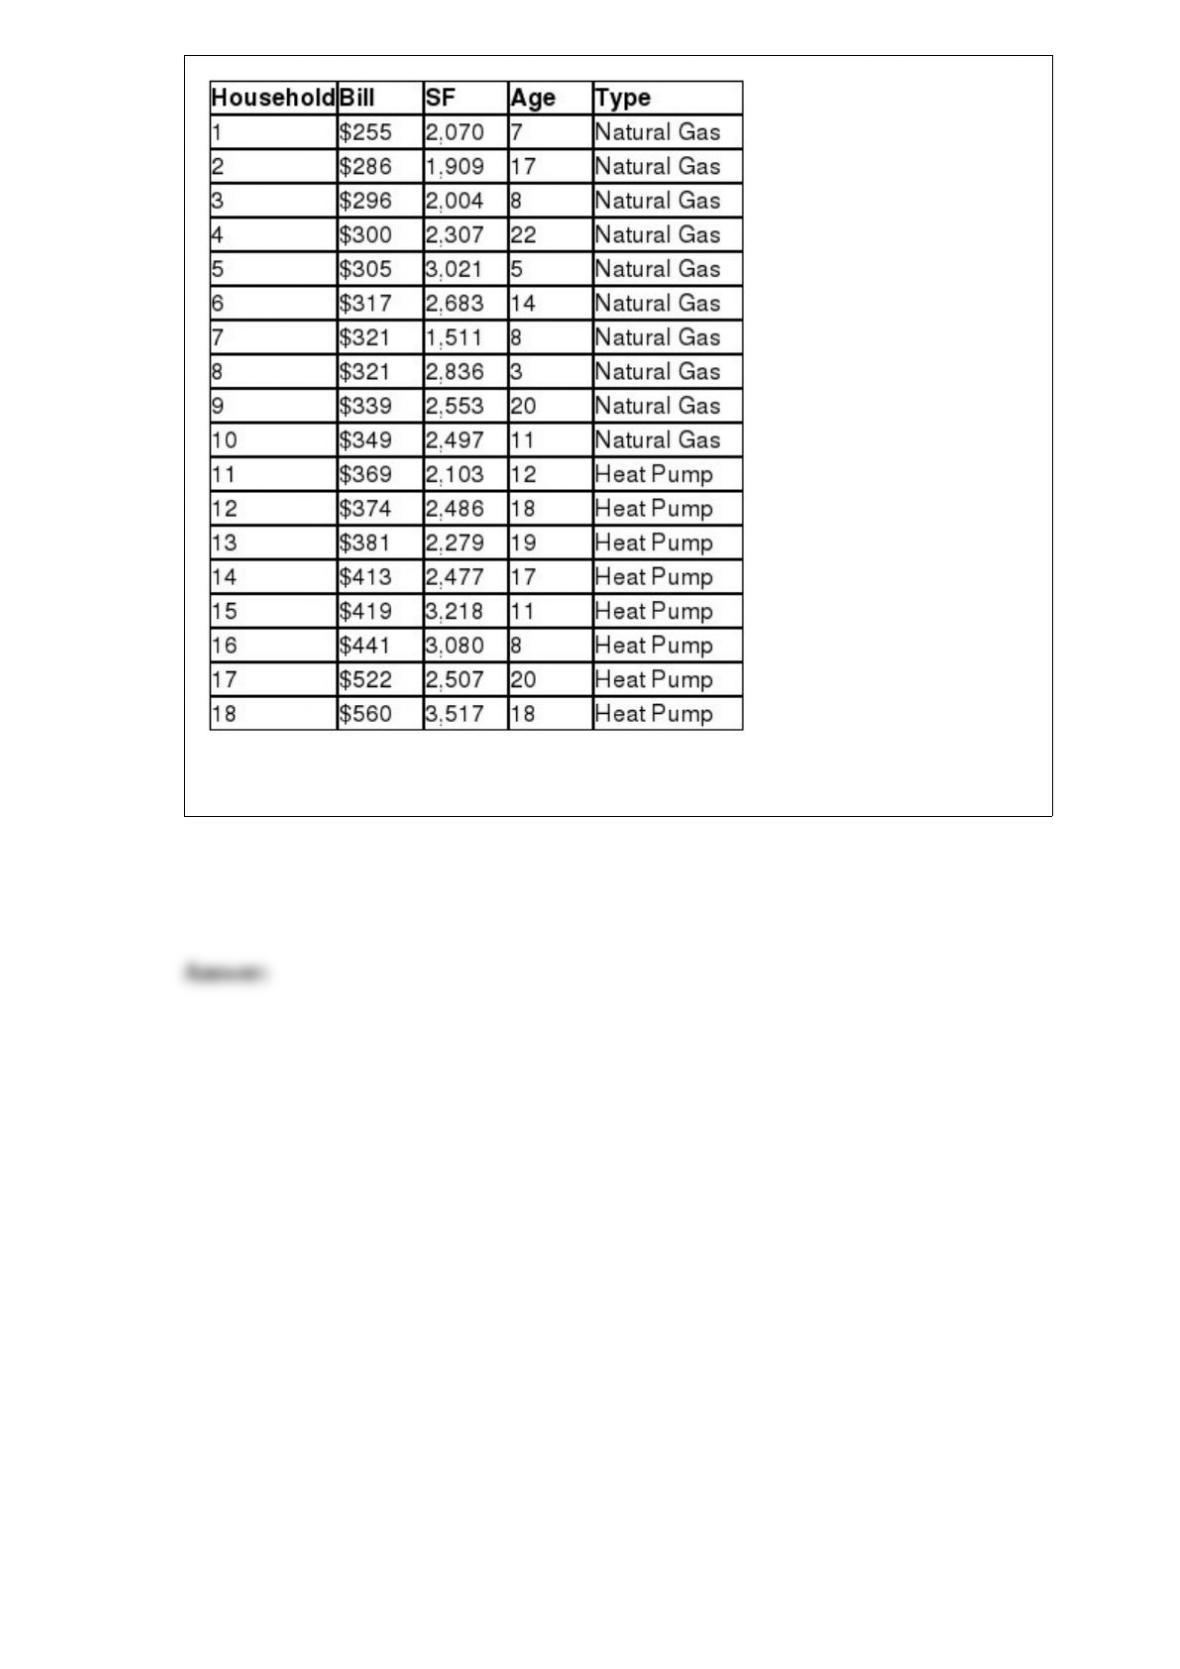
Use the following information to answer the question(s) below.
Delmarva Power is a utility company that would like to predict the monthly heating bill
for a household in Kent County during the month of January. A random sample of 18
households in the county were selected and their January heating bill recorded. This
data is shown in the table below along with the square footage of the house (SF), the
age of the heating system in years (Age,) and the type of heating system (heat pump = 1
or natural gas = 0).
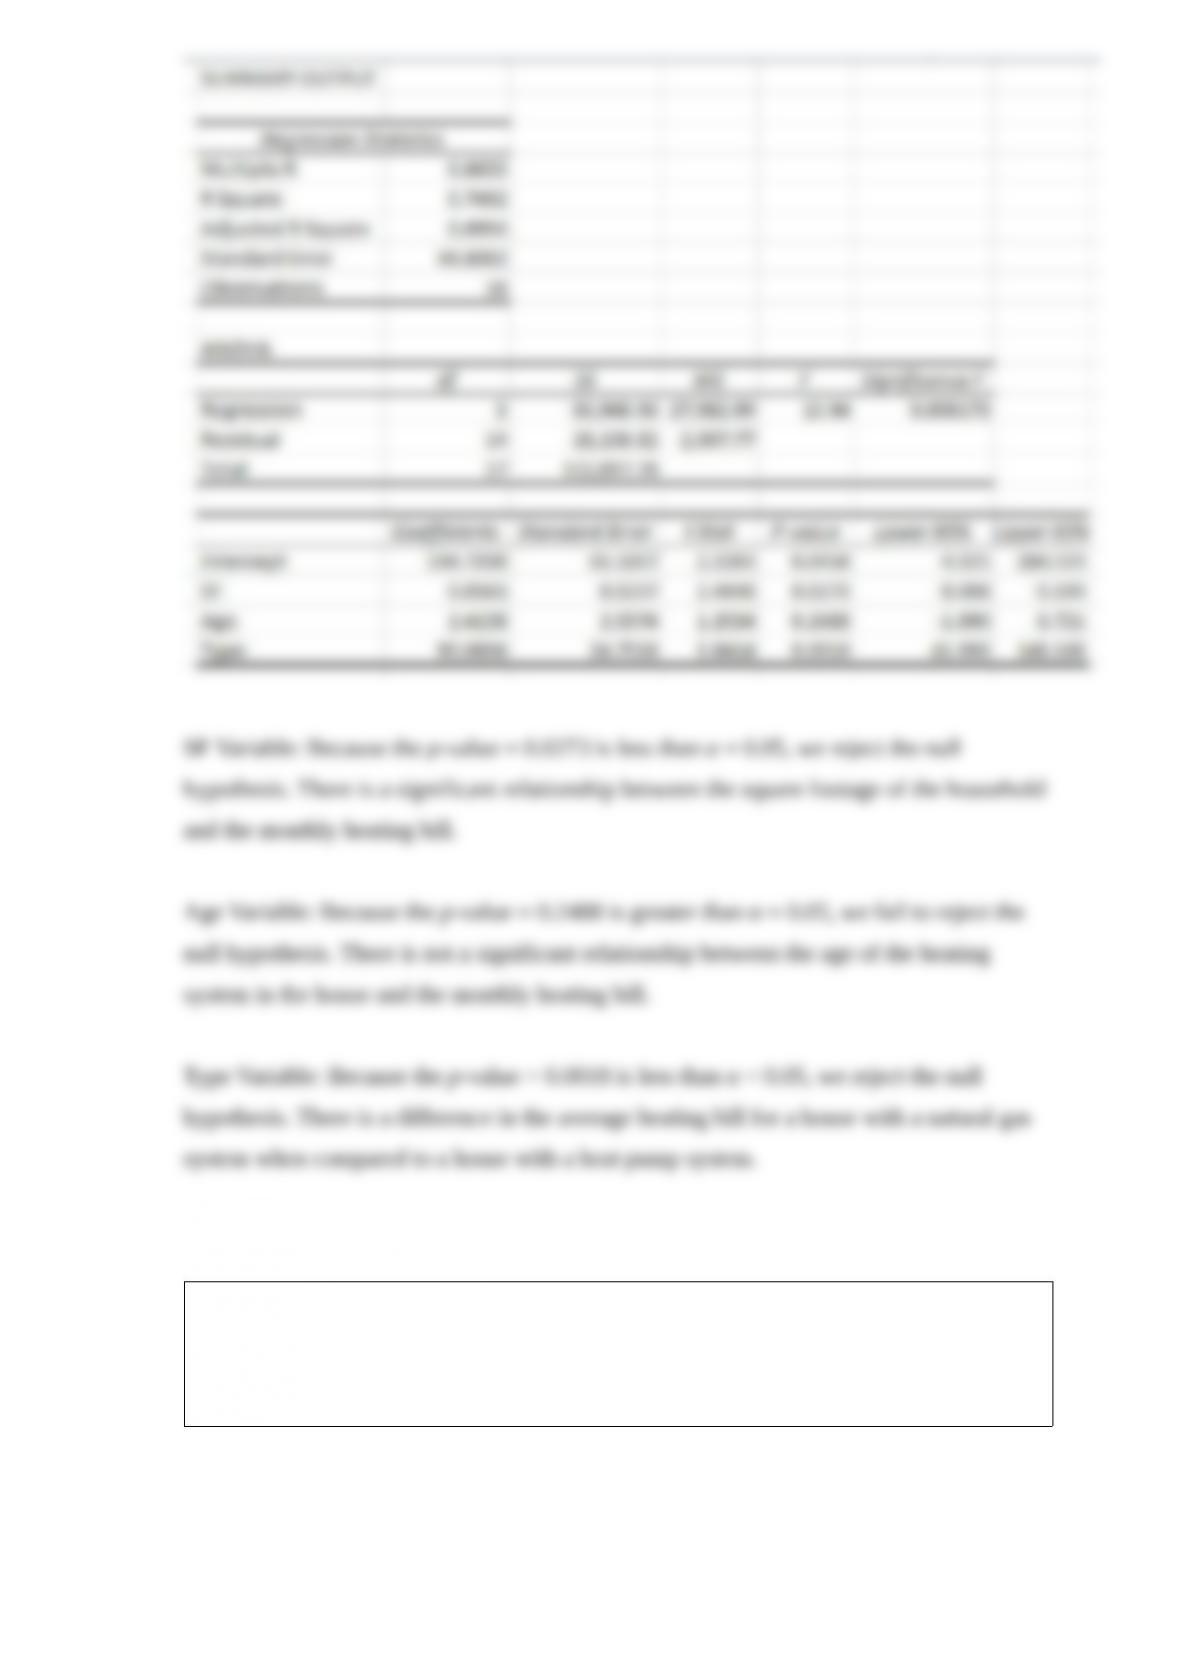
Interpret the p-value for each regression coefficient for the heating bill model.
Acme Supermarket would like to determine customers have a preference between their
store brand ice cream and the leading national brand. Store management conducted a
taste test with randomly selected customers. The results are summarized in the
following table.
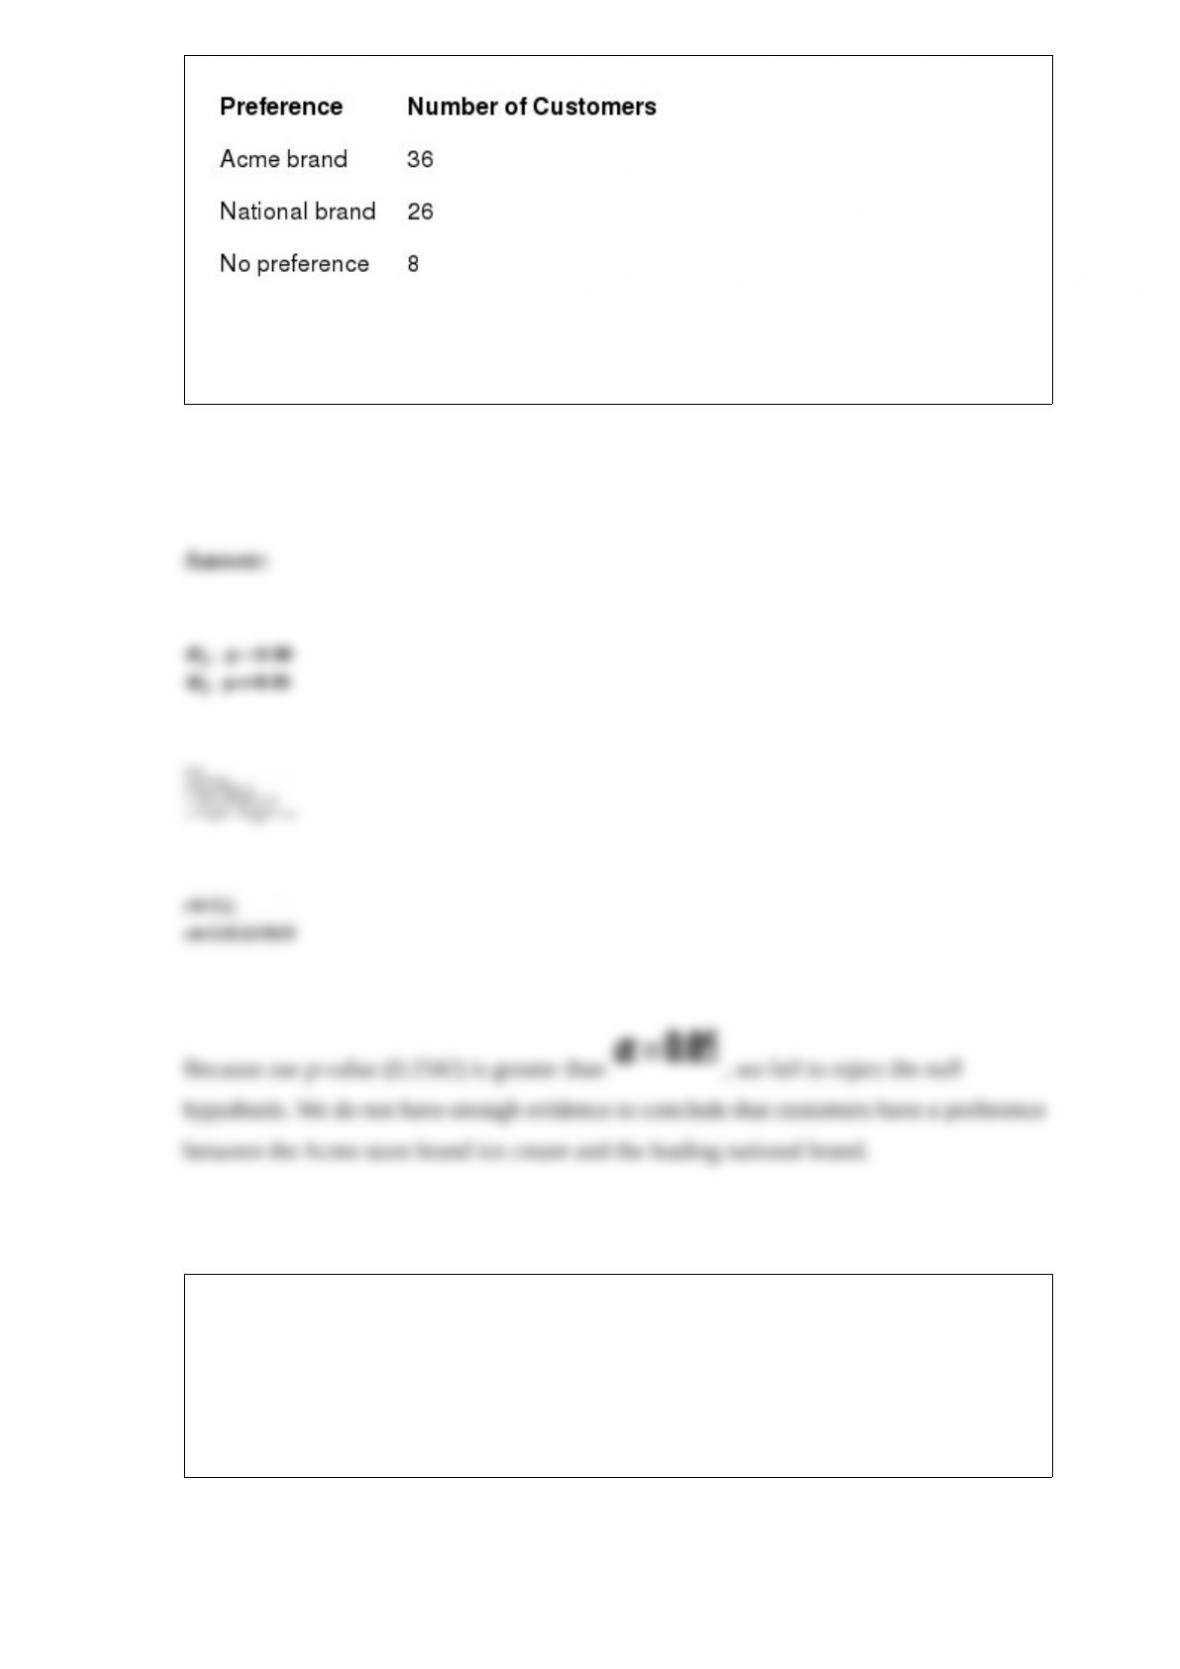
Perform a hypothesis test to determine if a preference exists between these two brands
using α = 0.05.
Organizations are relying more and more on social-networking sites to research job
candidates. According to CareerBuilder, 52% of organizations do not use these sites. A
random sample of 150 organizations found that 67 of them do not use
social-networking sites to research job candidates. Use the critical value approach to
test the hypothesis that less than 52% of organizations do not use social-networking
sites to research job candidates with α = 0.01.