
For the following distribution of heights, what are the limits for the class with the
greatest frequency?
A. 64 and up to 70
B. 65 and 69
C. 65 and up to 70
D. 69.5 and 74.5
The mean of any uniform probability distribution is _________.
A. (b – a)/2
B. (a + b)/2
C.
D. nπ

There are 2,000 eligible voters in a precinct. A total of 500 voters are randomly selected
and asked whether they plan to vote for the Democratic incumbent or the Republican
challenger. Of the 500 surveyed, 350 said they would vote for the Democratic
incumbent. Using the 0.99 confidence coefficient, what are the confidence limits for the
proportion that plan to vote for the Democratic incumbent?
A. 0.647 and 0.753
B. 0.612 and 0.712
C. 0.397 and 0.797
D. 0.826 and 0.926
A contingency table would be used to summarize data such as ________.
A. Company employees by gender and organizational title
B. Company employees by gender and age
C. Company employees by compensation and age
D. Company employees by compensation and years with the company
Which measure of dispersion disregards the algebraic signs (plus and minus) of each
difference between X and the mean?
A. Standard deviation
B. Mean deviation
C. Arithmetic mean
D. Variance
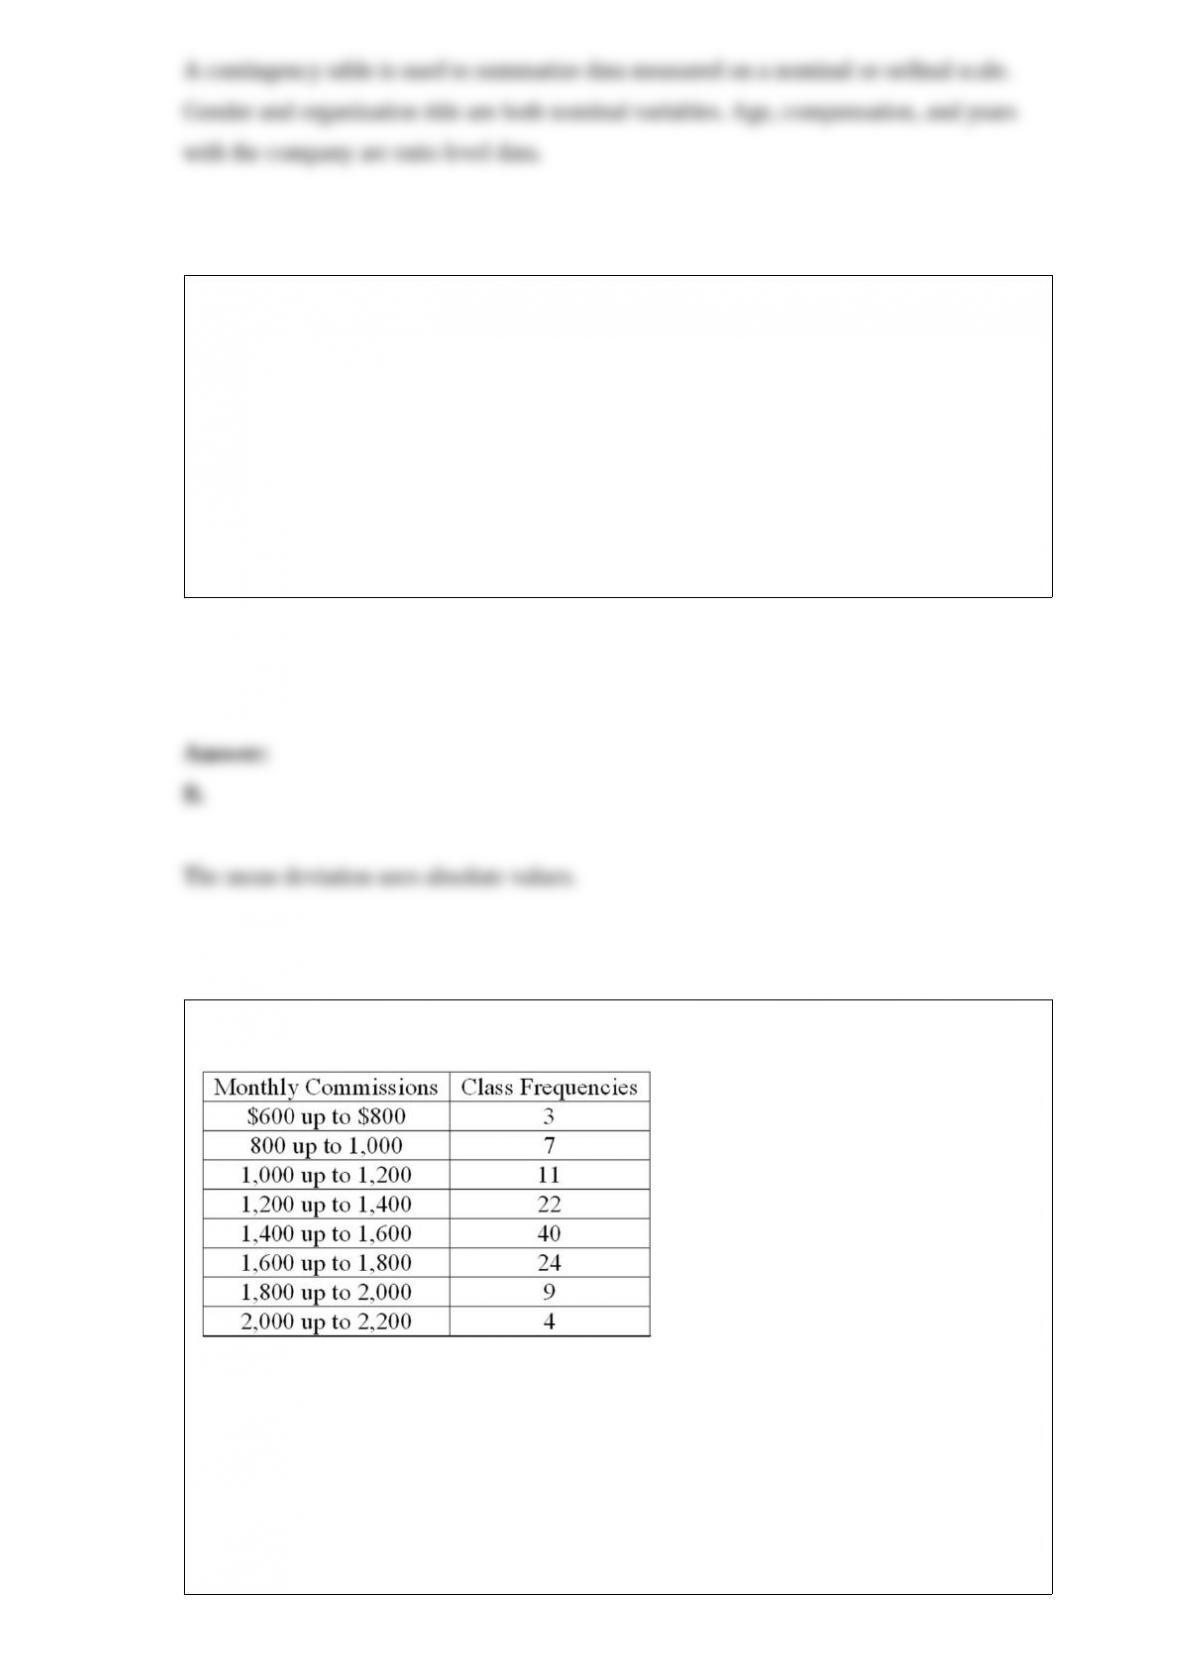
Refer to the following distribution of commissions:
To plot a cumulative frequency distribution, the first coordinate would be _________.
A. X = 0, Y = 600
B. X = 500, Y = 3
C. X = 3, Y = 600

D. X = 600, Y = 0
What is the probability of making a Type II error if the null hypothesis is actually true?
A. α
B. 1
C. 0
D. 0.05
Which of the following is an example of a continuous variable?
A. Tons of concrete to complete a parking garage
B. Number of students in a statistics class
C. Zip codes of shoppers

D. Rankings of baseball teams in a league
In the regression equation, what does the letter “a” represent?
A. The Y-intercept
B. The slope of the line
C. Any value of the independent variable that is selected
D. Error
A student wanted to construct a 95% confidence interval for the mean age of students in
her statistics class. She randomly selected nine students. Their mean age was 19.1
years, with a sample standard deviation of 1.5 years. What is the 95% confidence
interval for the population mean?
A. [0.97, 3.27]
B. [15.64, 22.56]

C. [17.97, 20.23]
D. [17.95, 20.25]
If the correlation between the two independent variables of a regression analysis is 0.11,
and each independent variable is highly correlated to the dependent variable, what does
this indicate?
A. Multicollinearity between these two independent variables.
B. A negative relationship is not possible.
C. Only one of the two independent variables will explain a high percent of the
variation.
D. An effective regression equation.

In the regression equation, what does the letter “Y” represent?
A. The Y-intercept
B. The slope of the line
C. The independent variable
D. The dependent variable
It is claimed that in a bushel of peaches, less than 10% are defective. A sample of 400
peaches is examined and 50 are found to be defective. What is the null hypothesis?
A. H0: π ≠ 0.10
B. H0: π ≥ 0.10
C. H0: π ≤ 0.10
D. H0: π < 0.10

A question has these possible responsesexcellent, very good, good, fair, and
unsatisfactory. What are the degrees of freedom for a goodness-of-fit test to test the
hypothesis that responses are uniformly distributed?
A. 0
B. 2
C. 4
D. 5
The net incomes (in $millions) of a sample of steel fabricators are $86, $67, $86, and
$85. What is the modal net income?
A. $67
B. $85
C. $85.5
D. $86
What kind of distribution is the t distribution?
A. Continuous
B. Discrete
C. Subjective
D. A z distribution
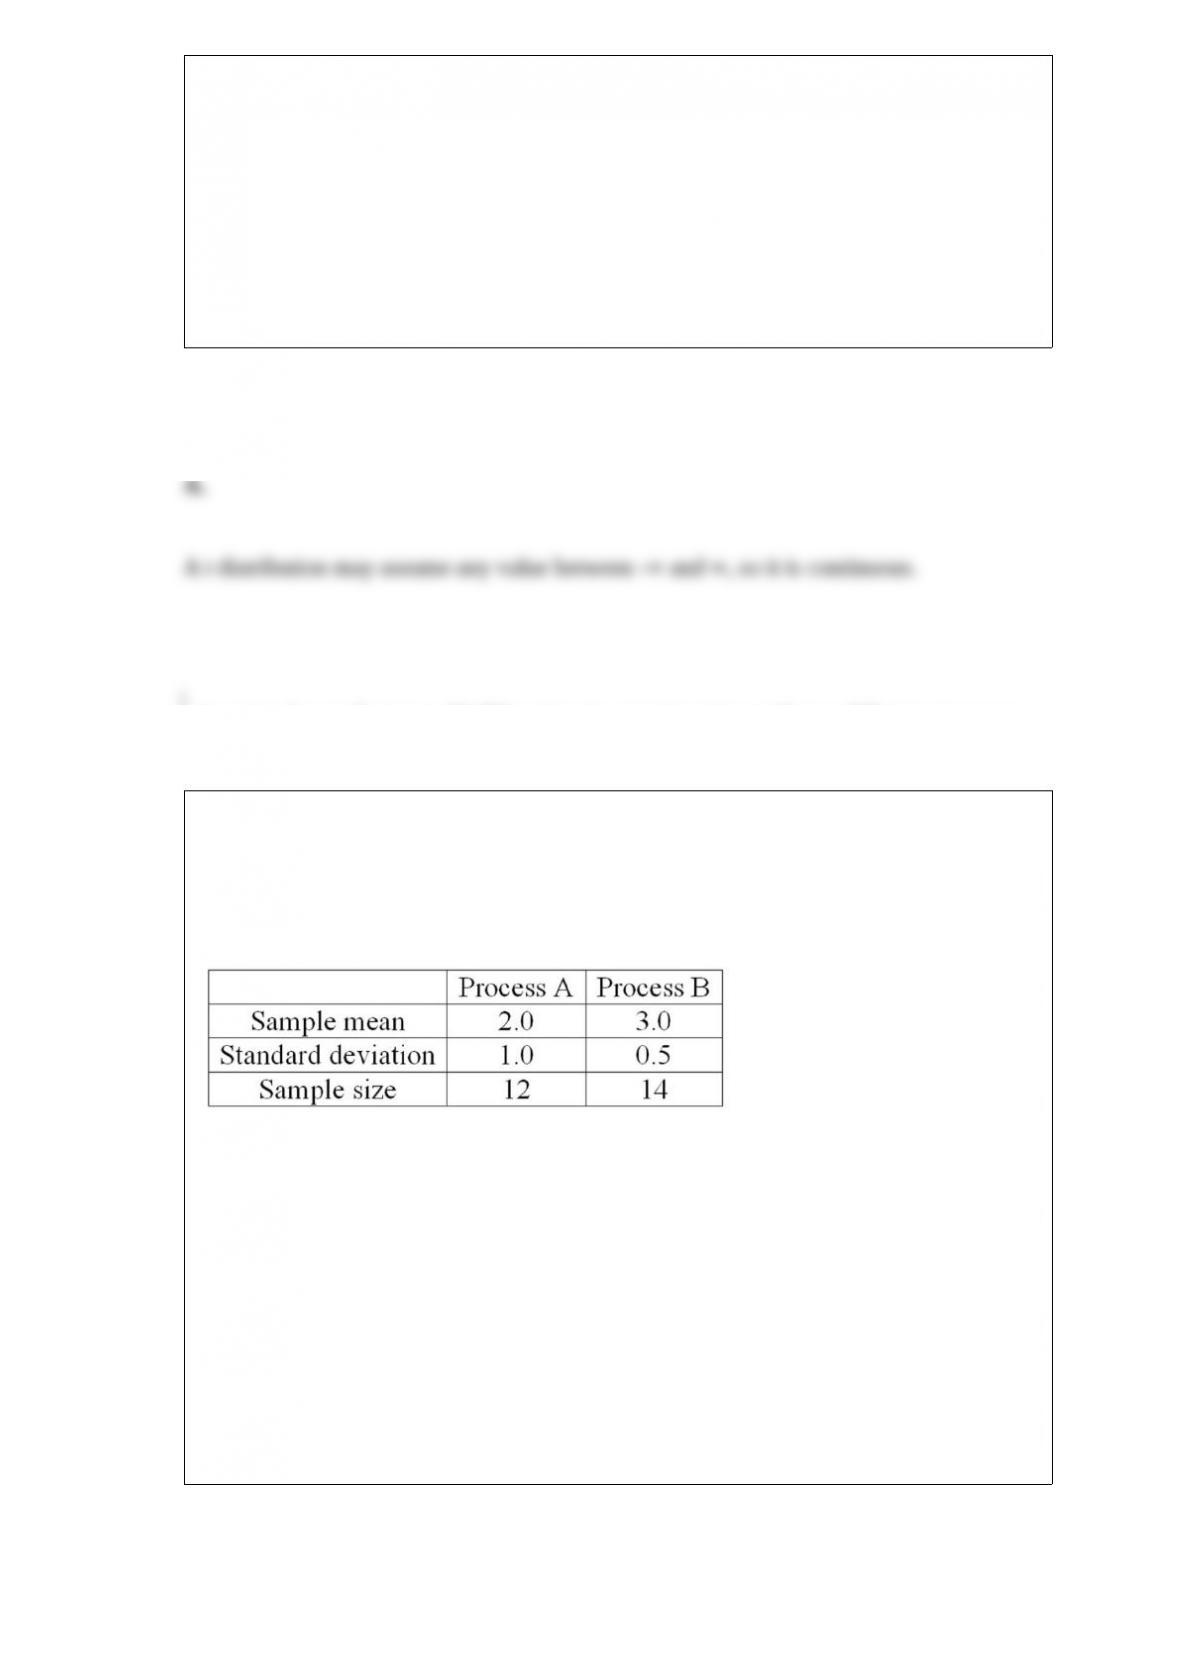
A national manufacturer of ball bearings is experimenting with two different processes
for producing precision ball bearings. It is important that the diameters be as close as
possible to an industry standard. The output from each process is sampled and the
average error from the industry standard is measured in millimeters. The results are
presented next.
The researcher is interested in determining whether there is evidence that the two
processes yield different average errors. The population standard deviations are
unknown but are assumed equal. What are the degrees of freedom?
A. 10
B. 13
C. 26
D. 24

When is it appropriate to use the paired difference t-test?
A. When four samples are compared at once
B. When any two samples are compared
C. When two independent samples are compared
D. When two dependent samples are compared
A survey of 25 grocery stores revealed that the mean price of a gallon of milk was
$2.98, with a standard error of $0.10. If 90% and 95% confidence intervals were
developed to estimate the true cost of a gallon of milk, what similarities would they
have?
A. Both have the same confidence level
B. Both use the same t statistic
C. Both use the same z statistic
D. Both use the same point estimate of the population mean
Using a graphical method to determine if a set of ungrouped raw data is normally
distributed, the data would be normally distributed if ____________.
A. The plot of the data was curvilinear
B. The data was randomly distributed
C. The plot of the data was linear
D. The plot of the data was significantly different from zero
Bones Brothers & Associates prepare individual tax returns. Over prior years, Bones
Brothers has maintained careful records regarding the time to prepare a return. The
mean time to prepare a return is 90 minutes and the standard deviation of this
distribution is 14 minutes. Suppose 100 returns from this year are selected and analyzed
regarding the preparation time. What is the standard error of the mean?
A. 14 minutes
B. 140 minutes
C. 1.4 minutes
D. 90 minutes

What is the probability that z is between 0.0 and 2.0?
A. 1.0000
B. 0.7408
C. 0.1359
D. 0.4772
A recent study of the relationship between social activity and education for a sample of
corporate executives showed the following results.
Based on the analysis, what can be concluded?
A. Social activity and education are correlated.
B. Social activity and education are not related.
C. Social activity and education are related.
D. No conclusion is possible.
Which of the following statements regarding the coefficient of correlation is true?
A. It ranges from 0.0 to +1.0 inclusive.
B. It describes the relationship between two variables.
C. A value of 0.00 indicates two variables are related.
D. It is calculated as the square of the slope.

An analysis of the grades on the first test in History 101 revealed that they approximate
a normal curve with a mean of 75 and a standard deviation of 8. The instructor wants to
award the grade of A to the upper 10% of the test grades. To the nearest percent, what is
the dividing point between an A and a B grade?
A. 80
B. 85
C. 90
D. 95
The mean length of a candy bar is 43 millimeters. There is concern that the settings of
the machine cutting the bars have changed. Test the claim at the 0.02 level that there has
been no change in the mean length. The alternate hypothesis is that there has been a
change. Twelve bars (n = 12) were selected at random and their lengths recorded. The
lengths are (in millimeters) 42, 39, 42, 45, 43, 40, 39, 41, 40, 42, 43, and 42. The mean
of the sample is 41.5 and the standard deviation is 1.784. Computed t = -2.913. Has
there been a statistically significant change in the mean length of the bars?
A. Yes, because the computed t lies in the rejection region.
B. No, because the information given is not complete.
C. No, because the computed t lies in the area to the right of -2.718.
D. Yes, because 43 is greater than 41.5.
What does a coefficient of correlation of 0.70 infer?
A. There is almost no correlation because 0.70 is close to 1.0.
B. 70% of the variation in one variable is explained by the other variable.
C. The coefficient of determination is 0.49.
D. The coefficient of nondetermination is 0.30.

In multiple regression analysis, how is the degree of association between a set of
independent variables and a dependent variable measured?
A. Confidence intervals
B. Autocorrelation
C. Coefficient of multiple determination
D. Standard error of estimate
Suppose we select every fifth invoice in a file. What type of sampling is this?
A. Random
B. Cluster
C. Stratified
D. Systematic

For the following distribution:
What is the mean of the distribution?
A. 2.1
B. 1.13
C. 0.113
D. 1.5
The first card selected from a standard 52-card deck was a king. If it is returned to the
deck, what is the probability that a king will be drawn on the second selection?
A. 1/4 or 0.25
B. 1/13 or 0.077
C. 12/13 or 0.923
D. 1/3 or 0.33
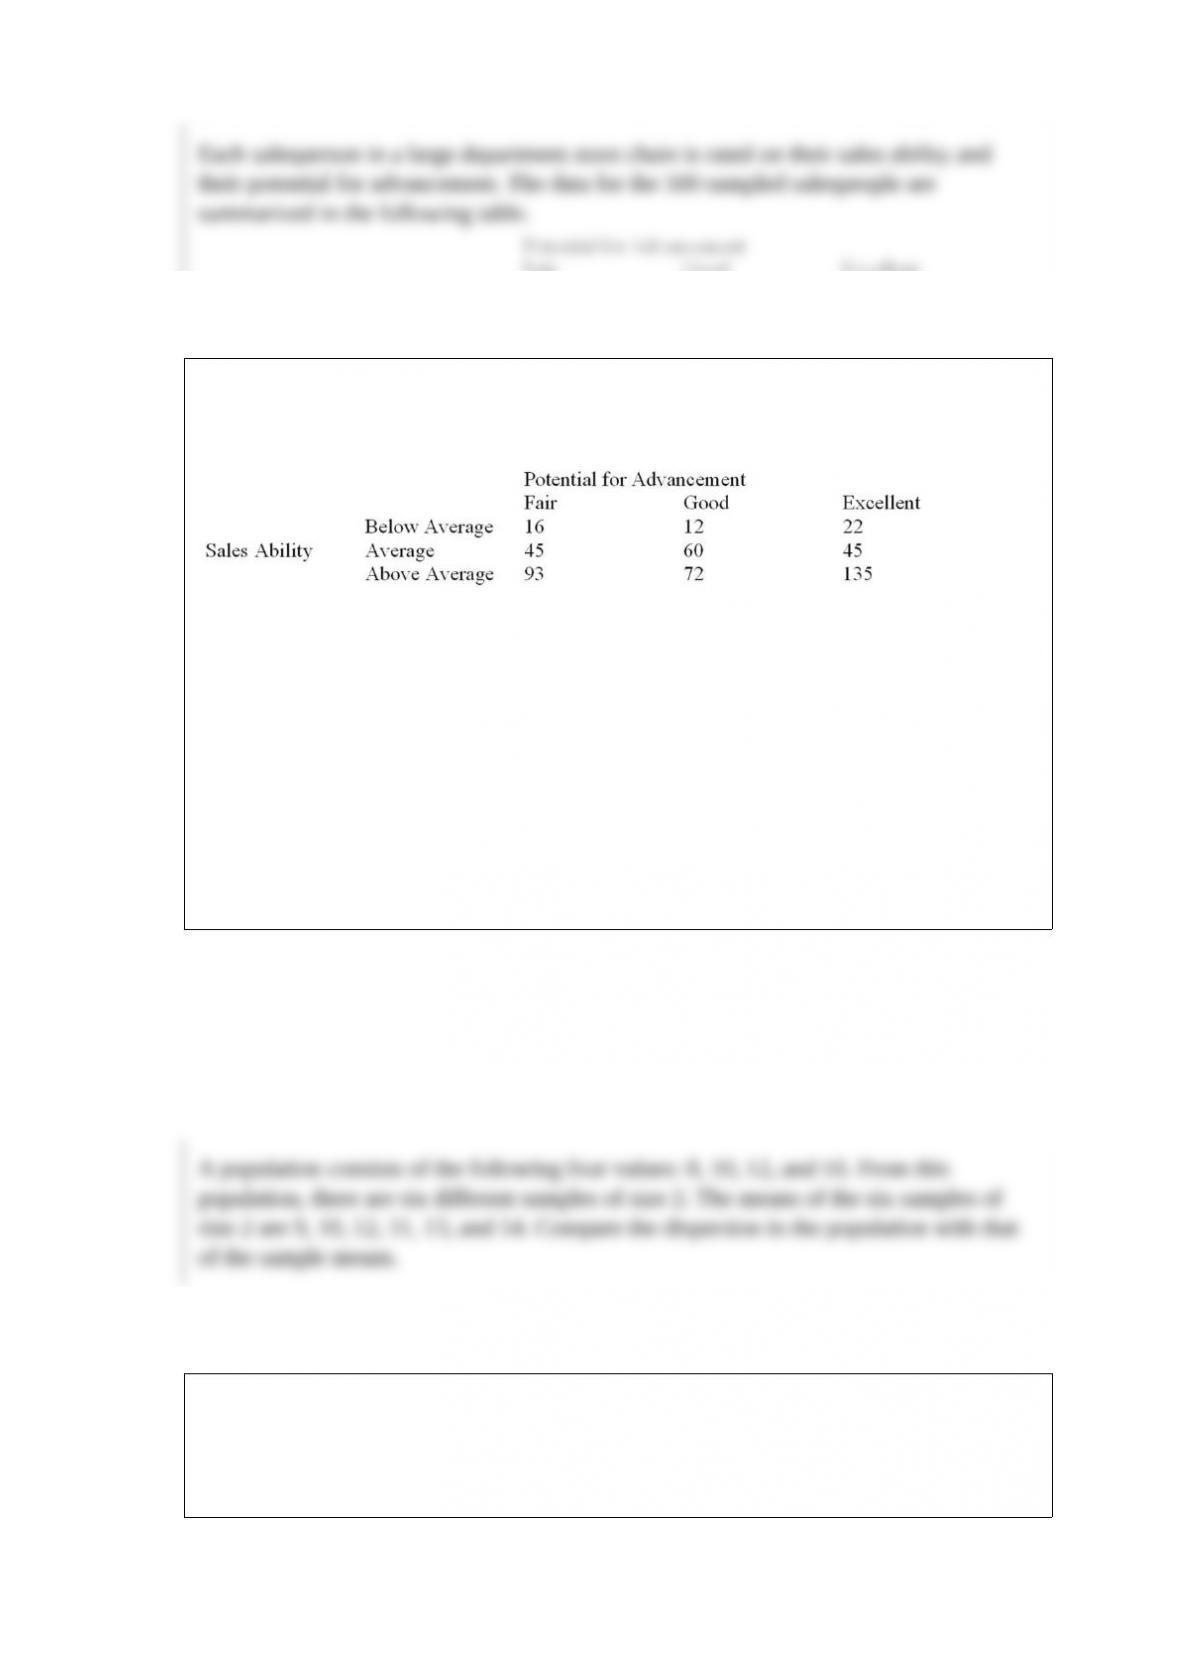
Each salesperson in a large department store chain is rated on their sales ability and
their potential for advancement. The data for the 500 sampled salespeople are
summarized in the following table.
What is the probability that a salesperson selected at random will have an excellent
potential for advancement given they also have average sales ability?
A. 0.27
B. 0.30
C. 0.404
D. 0.45
A population consists of the following four values: 8, 10, 12, and 16. From this
population, there are six different samples of size 2. The means of the six samples of
size 2 are 9, 10, 12, 11, 13, and 14. Compare the dispersion in the population with that
of the sample means.
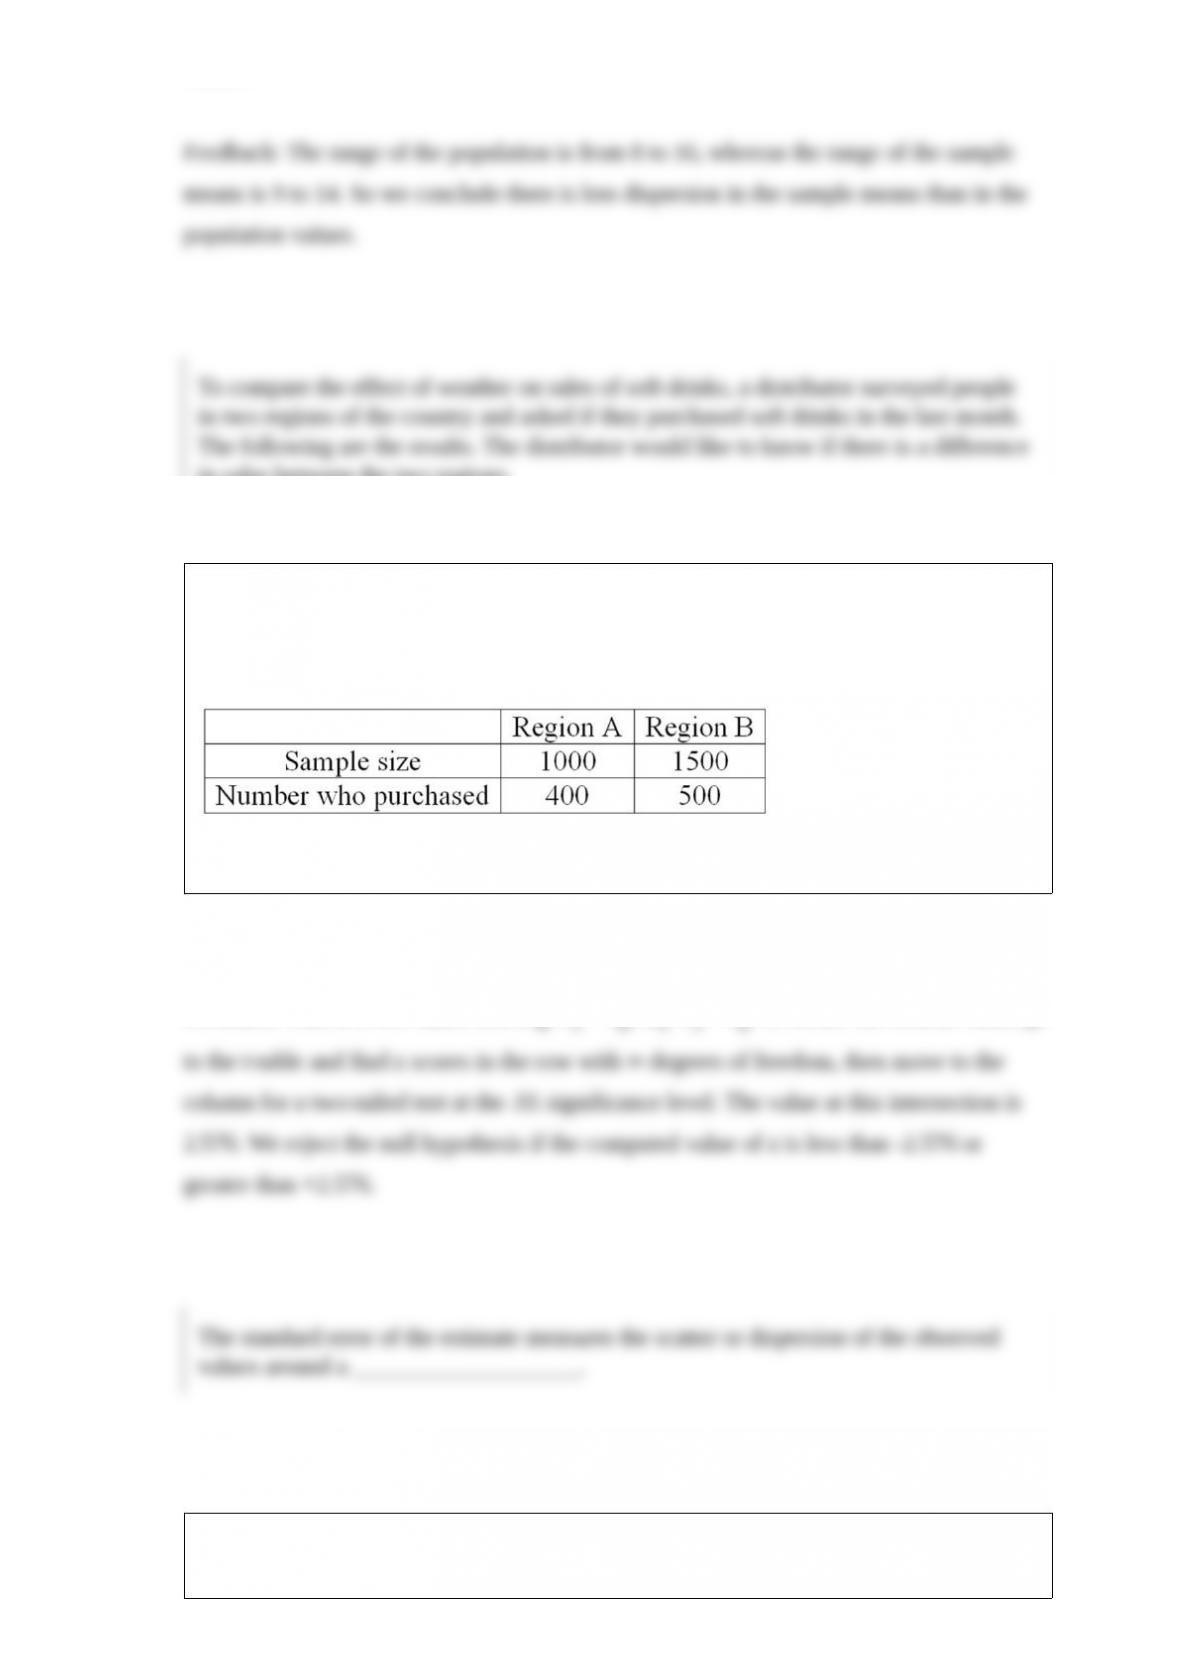
To compare the effect of weather on sales of soft drinks, a distributor surveyed people
in two regions of the country and asked if they purchased soft drinks in the last month.
The following are the results. The distributor would like to know if there is a difference
in sales between the two regions.
Using the 1% level of significance, what is the critical value?
The standard error of the estimate measures the scatter or dispersion of the observed
values around a ___________________.
LongLast Inc. produces car batteries. The mean life of these batteries is 60 months. The
distribution of the battery life closely follows the normal probability distribution with a
standard deviation of eight months. As a part of its testing program, LongLast tests a
sample of 25 batteries. What proportion of the samples will have a mean useful life of
more than 56 months?
Explain the concept of a confidence interval when estimating a population mean.
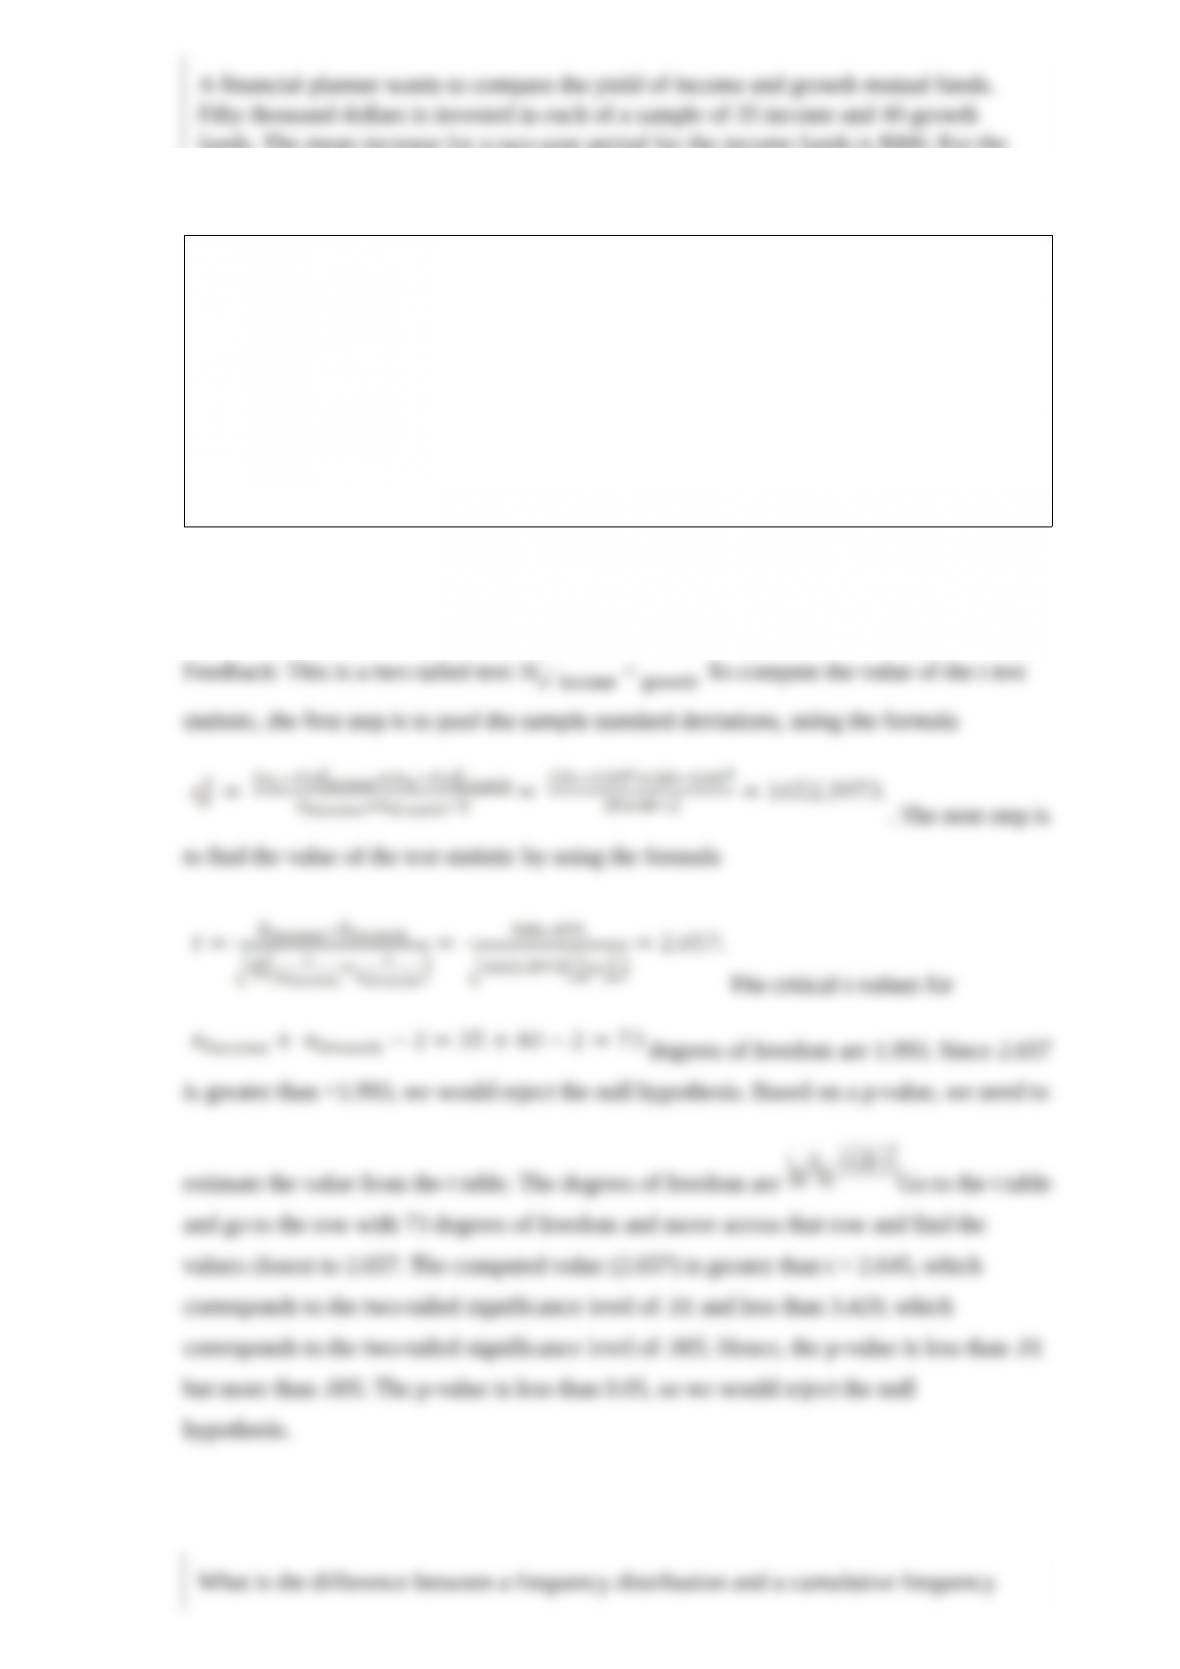
A financial planner wants to compare the yield of income and growth mutual funds.
Fifty thousand dollars is invested in each of a sample of 35 income and 40 growth
funds. The mean increase for a two-year period for the income funds is $900. For the
growth funds, the mean increase is $875. Income funds have a sample standard
deviation of $35; growth funds have a sample standard deviation of $45. Assume that
the population standard deviations are equal. At the 0.05 significance level, is there a
difference in the mean yields of the two funds?
What decision is made about the null hypothesis using an α = 0.05?

What is the difference between a frequency distribution and a cumulative frequency
distribution?
The test statistic for a goodness-of-fit test for unequal expected frequencies is a
__________ statistic.
When testing the null hypothesis that two population proportions are equal, the
hypothesized difference between the population proportions is ________________.

The difference between the maximum and minimum values in a set of data is called the
_______.
In a frequency distribution, the class with the largest number of observations is called
the ___________.
What does a significantly large chi-square statistic infer about the differences between
the observed and expected frequencies in a goodness-of-fit test?

The Poisson distribution or, the law of improbable events, is _______________
skewed.