In a multiple regression analysis with three independent variables the null hypothesis
for conducting the test of the overall model is:
H0: β0= β1= β2= β3= 0.
In a time series with quarterly sales data, assume that the seasonal index for the summer
quarter has been found to be 0.87, this can be interpreted to mean that sales tend to be
87 percent higher in the summer quarter when compared to the other quarters.
A local medical center has advertised that the mean wait for services will be less than
15 minutes. In an effort to test whether this claim can be substantiated, a random
sample of 100 customers was selected and their wait times were recorded. The mean
wait time was 17.0 minutes. Based on this sample result, there is sufficient evidence to
reject the medical center’s claim.
The F-distribution is used to test whether two sample variances are equal.


When using the p-value method, the null hypothesis is rejected when the calculated
p-value > α.
In order to make the test for the difference between two population means valid, the
sample size in each independent sample must be the same.
When determining sample size for a proportion, the farther that p is from 0.5, the
smaller the resulting sample size will be.

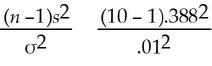
The makers of furnace filters recently conducted a test to determine whether the median
number of particulates that would pass through their four leading filters was the same. A
random sample of 6 of each type of filter was used with the following data being
recorded:
If the Kruskal-Wallis test is used, the test statistic is approximately H = 7.814
A dam on a river that holds back a water reservoir begins to leak. Engineers say that
there is a 10 percent chance of the dam breaking if repairs are not made. This is an
example of classical probability.
If a contingency analysis test is performed with a 4 6 design, and if alpha = .05, the
critical value from the chi-square distribution is 24.9958


When using the t-distribution in a hypothesis test, the population does not need to be
assumed normally distributed.
A seafood shop sells salmon fillets where the weight of each fillet is normally
distributed with a mean of 1.6 pounds and a standard deviation of 0.3 pounds. Based on
this information we can conclude that 90 percent of the fillets weight more than 1.0
pound.
In a completely randomized analysis of variance design, the observations from each
factor are selected in an independent and random fashion.


The state insurance commissioner believes that the mean automobile insurance claim
filed in her state exceeds $1,700. To test this claim, the agency has selected a random
sample of 20 claims and found a sample mean equal to $1,733 and a sample standard
deviation equal to $400. They plan to conduct the test using a 0.05 significance level.
Given this, the appropriate null and alternative hypotheses are
H0 : ≤ $1,700
HA : > $1,700
Multicollinearity occurs when one or more independent variables is highly correlated
with the dependent variable.
Consider a situation in which both a frequency distribution and a relative frequency
distribution have been developed for the same quantitative variable. If histograms are
constructed from each distribution, the graphs will appear to have the same shape.


When performing a hypothesis test for the difference between the means of two
independent populations where the standard deviations are known, it is necessary to use
the pooled standard deviation in calculating the test statistic.
In the model diagnosis step in regression modeling, we are interested in the sign and
size of the regression slope coefficients.
When the intercept in a regression equation is deemed not significantly different from 0,
then in making predictions for y, 0.0 should be used as the value of the intercept rather
than the estimated intercept value.
A Parks and Recreation official surveyed 200 people at random who have used one of
the city’s parks. The survey revealed that 26 resided outside the city limits. If she had to
arrive at one single value to estimate the true proportion of park users who are residents
of the city it would be 0.13.
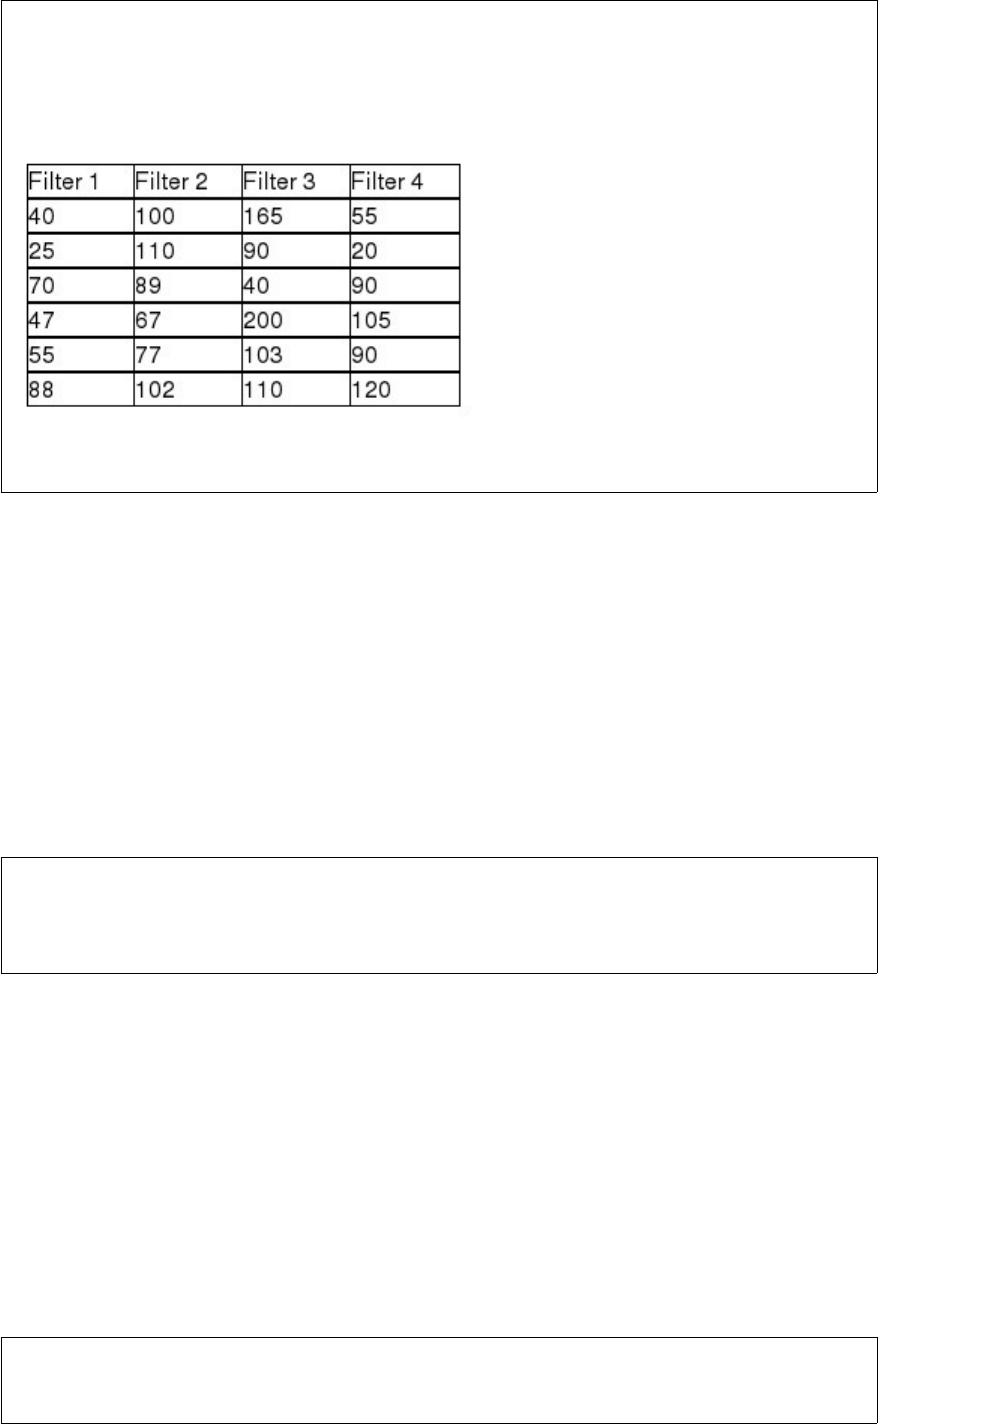
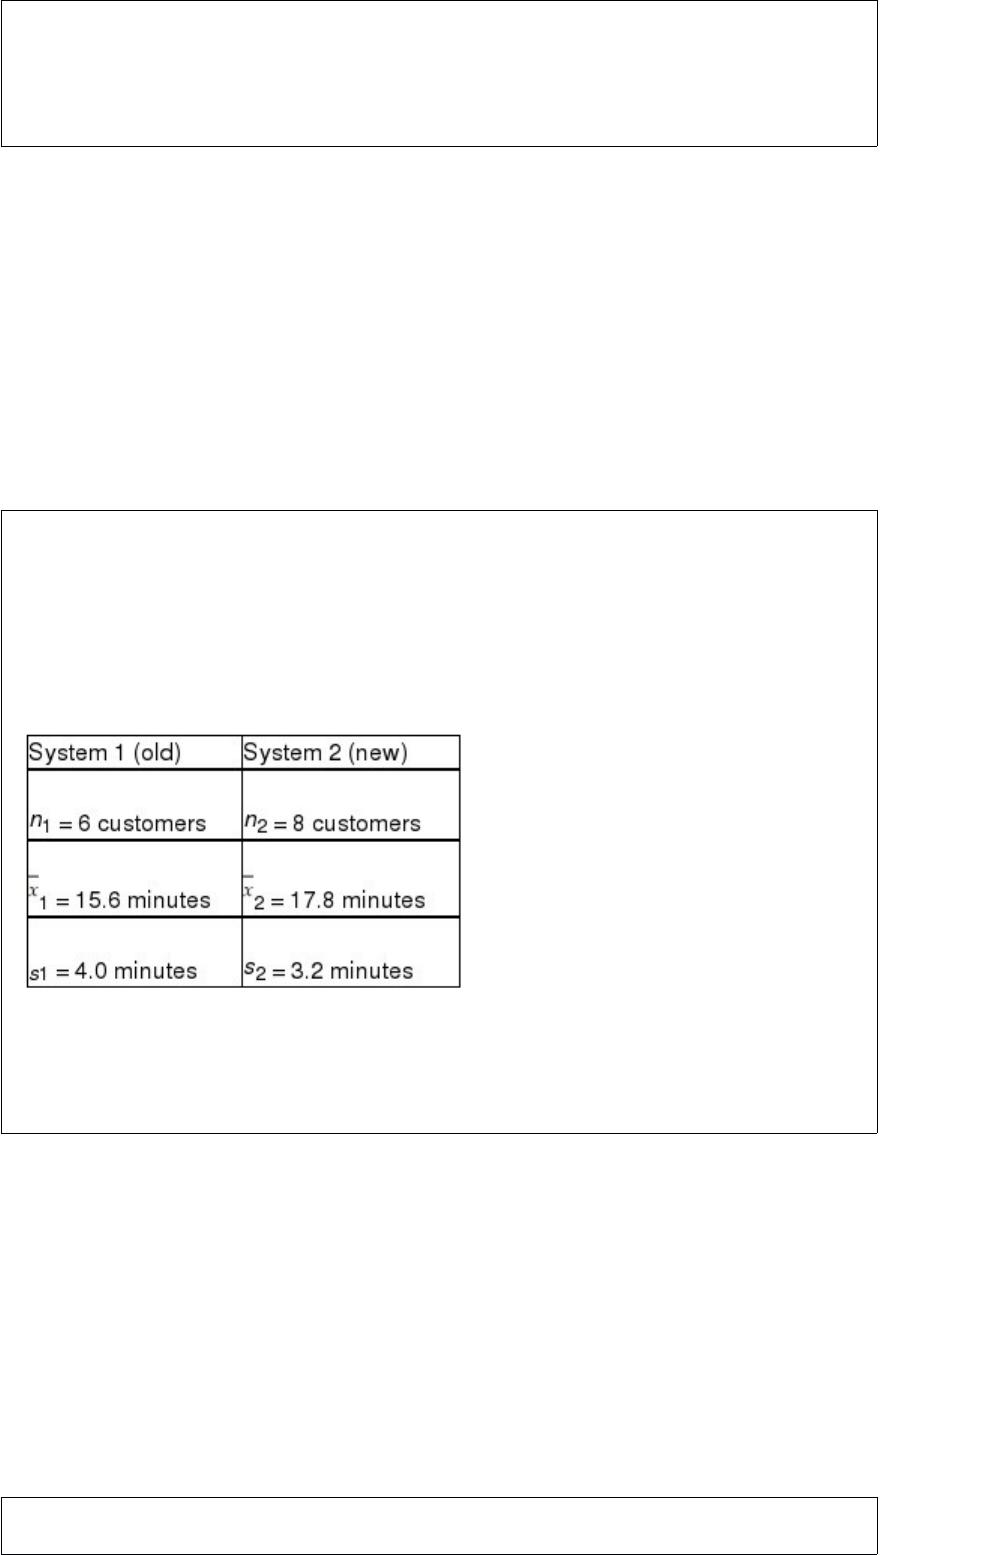
One of the key quality characteristics in many service environments is that the variation
in service time be reasonably small. Recently, a major amusement park company
initiated a new line system at one of its parks. It then wished to compare this new
system with the old system in place at a comparable park in another state. At issue is
whether the standard deviation in waiting time is less under the new line system than
under the old line system. The following information was collected:
Assuming that it wishes to conduct the test using a 0.05 level of significance, the null
hypothesis should be rejected since the test statistic exceeds the F-critical value from
the F-distribution table.
When the decision maker has control over the null and alternative hypotheses, the
alternative hypotheses should be the “research” hypothesis.
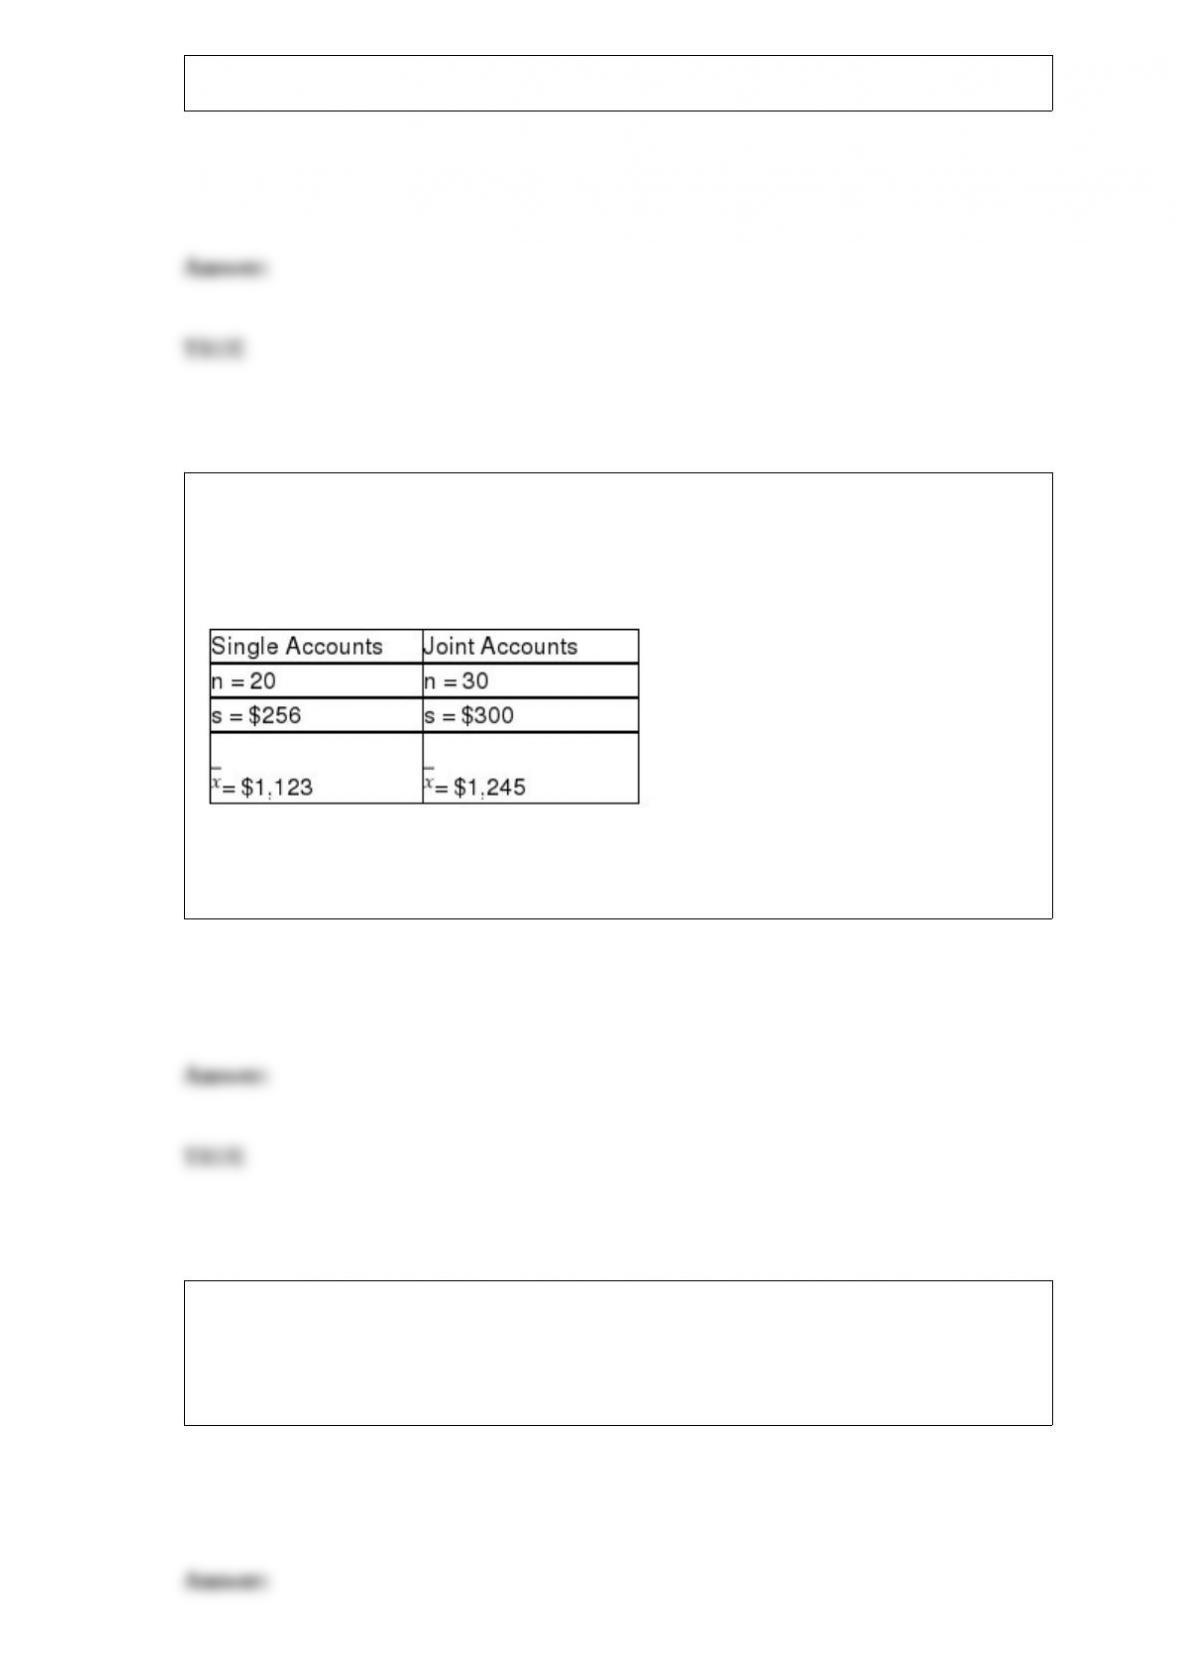
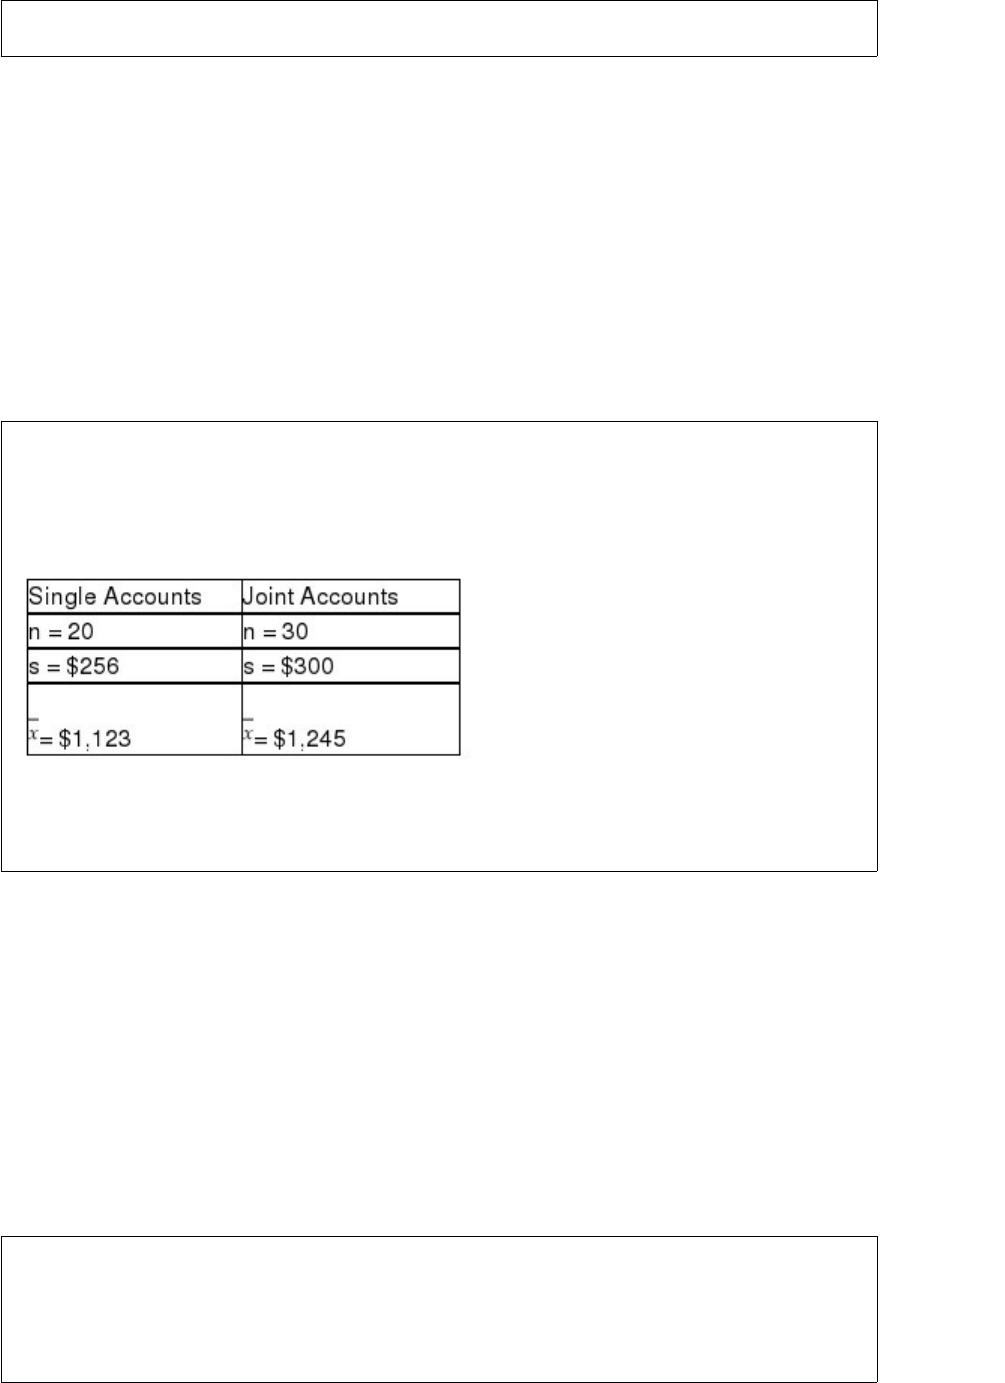
There is interest at the American Savings and Loan as to whether there is a difference
between average daily balances in checking accounts that are joint accounts (two or
more members per account) versus single accounts (one member per account). To test
this, a random sample of checking accounts was selected with the following results:
Based upon these data, the test statistic for testing whether the two populations have
equal variances is F = 1.3733.
In establishing a single exponential smoothing forecasting model, a starting point for
the forecast value for period 1 is required. One method for arriving at this starting point
is to use the first data point as the forecast for that period. If we do that, then the first
data point should be ignored when computing measures of forecast error.

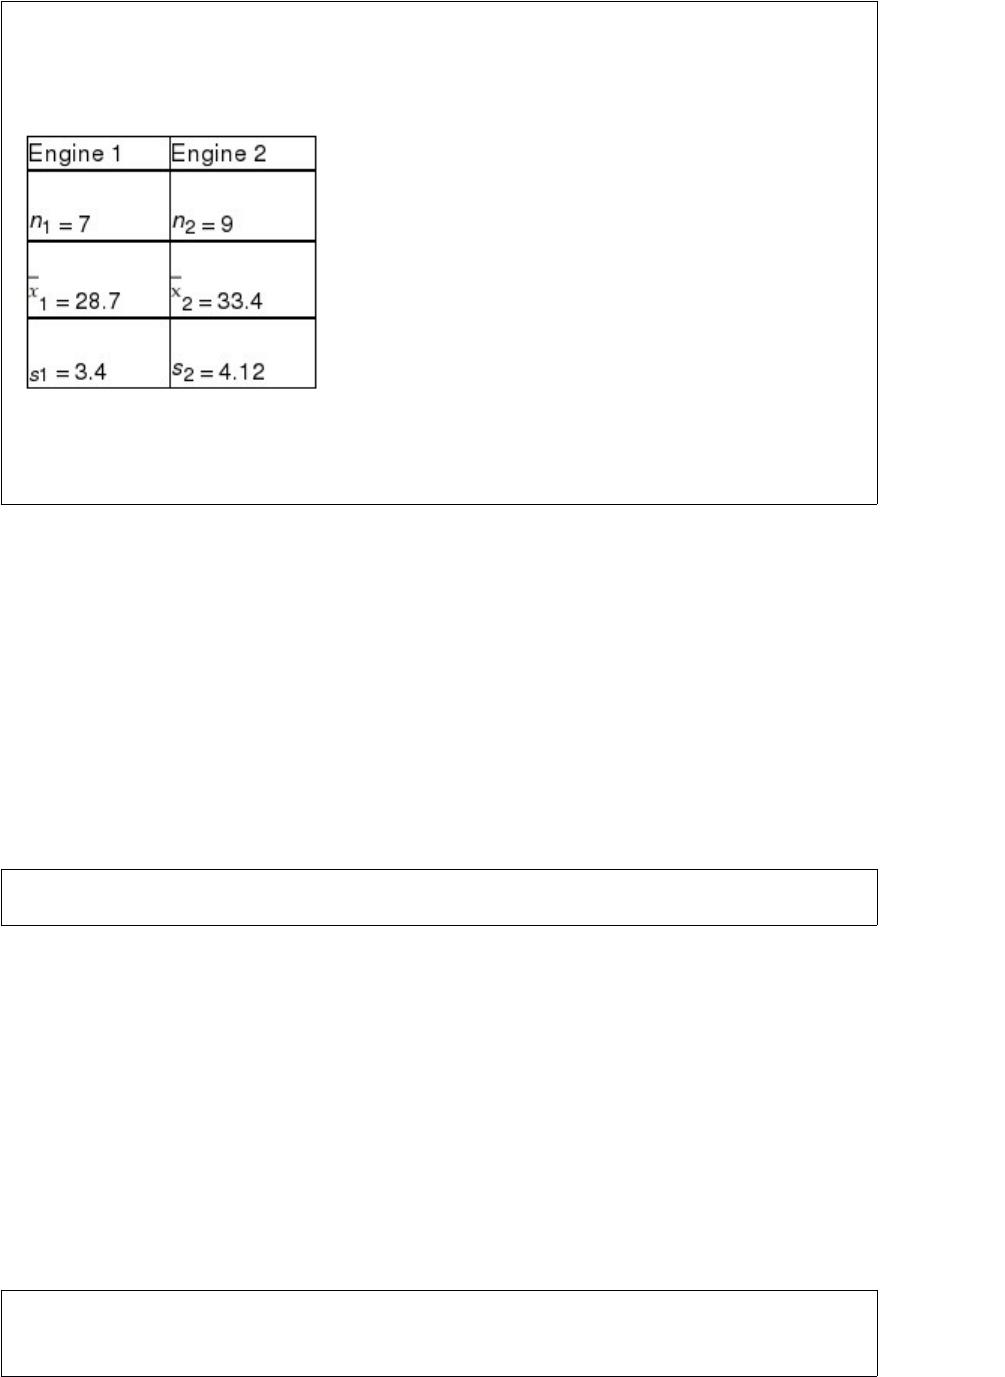
One of the major automobile makers has developed two new engines. At question is
whether the two engines have the same variability with respect to miles per gallon. To
test this using a 0.10 level of significance, the following information is available:
Based on this situation and the information provided, the null hypothesis cannot be
rejected and it is possible that the two engines produce the same variation in mpg.
The Wilcoxon signed rank test is used to test hypotheses about the population median.
First Pacific Bank has determined that the mean checking account balance for all its
customers is currently $743.50. Based on this, it is fair to say that about half the


customers have balances exceeding $743.50.
A university computer lab manager wishes to estimate the mean time that students stay
in the lab per visit. She believes that the population standard deviation would be no
larger than 10 minutes. Further, she wishes to have a confidence level of 90 percent and
a margin of error of 2.00 minutes. Given this, the sample size that she uses is
approximately 60 students.
In a one-way analysis of variance design, the total variation in the data across the
various factor levels can be partitioned into two parts, the within sample variation and
the between sample variation.
One claim states the IRS conducts audits for not more than 5 percent of total tax returns
each year. In order to test this claim statistically, the appropriate null and alternative
hypotheses are:
H0 : μ ≤ 0.05
Ha : μ > 0.05
A stem and leaf diagram is more appropriate for graphically displaying a joint
frequency distribution than is a histogram since the stems can be used to display one
variable while the leaves can be used to display the second variable.
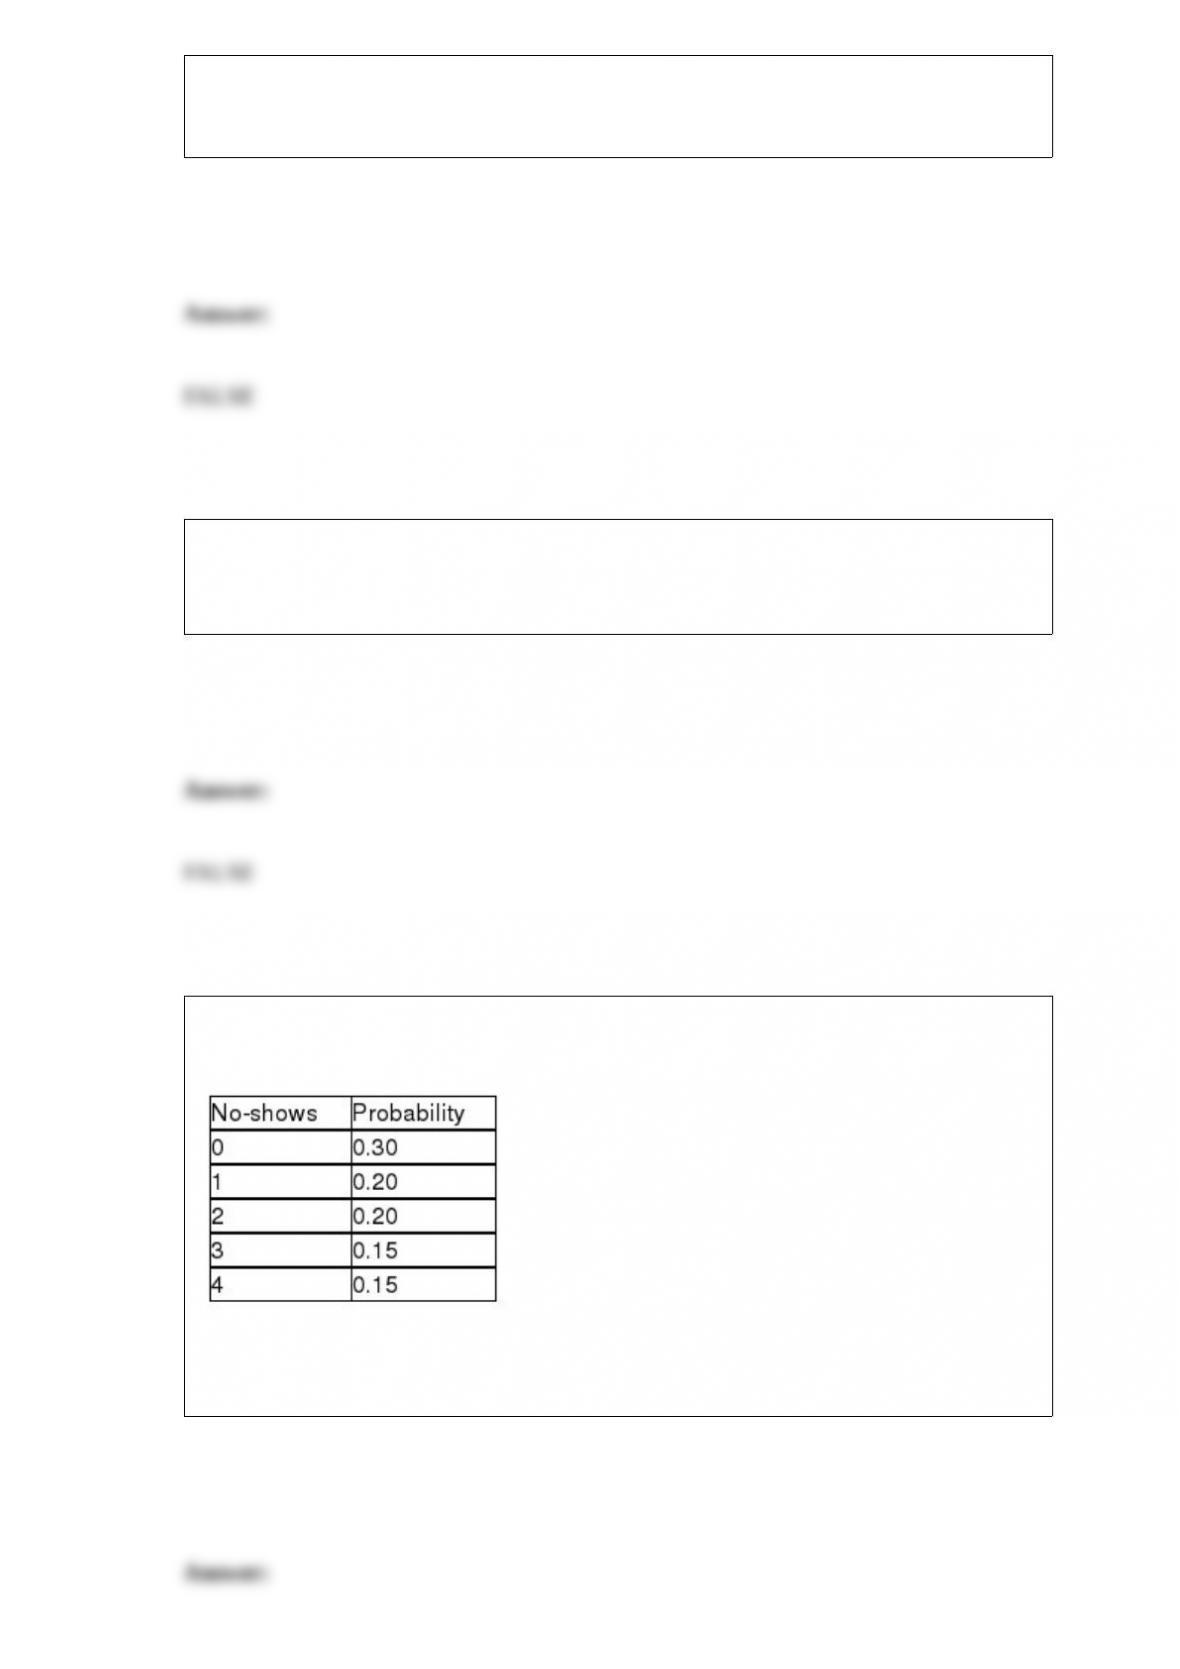
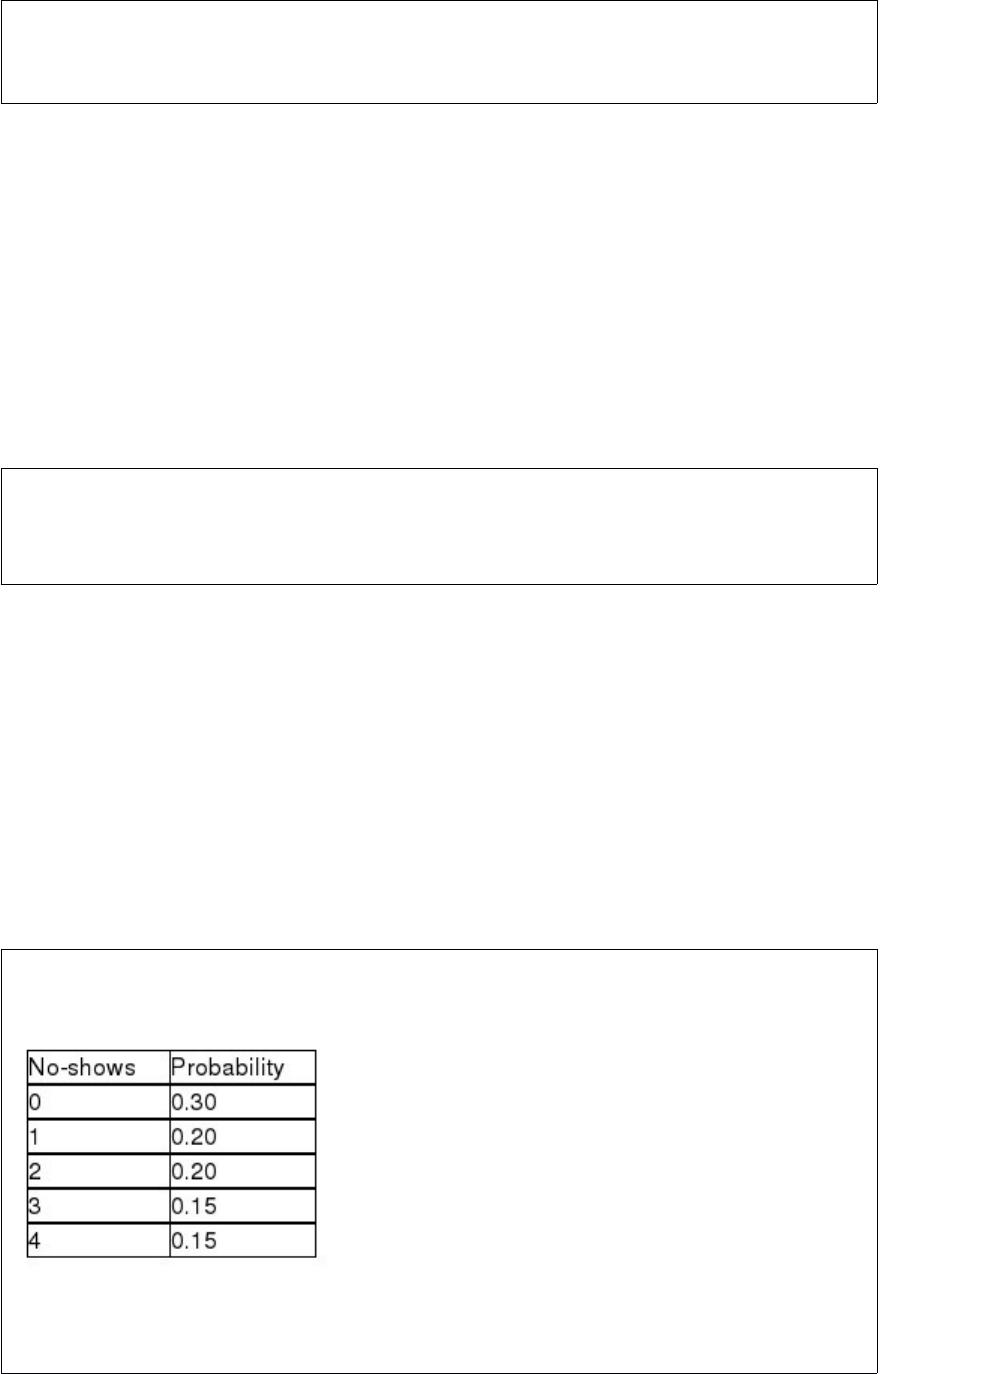
The number of no-shows for dinner reservations at the Cottonwood Grille is a discrete
random variable with the following probability distribution:
Based on this information, the most likely number of no-shows on any given day is 0
customers.


The J.B. Hanson Company is interested in analyzing the relationship between
end-of-the-week inventory levels and sales for the same week. The graph that most
likely would be used to show this relationship is a histogram.
A corporation has 11 manufacturing plants. Of these, 7 are domestic and 4 are located
outside the United States. Each year a performance evaluation is conducted for 4
randomly selected plants.
What is the probability that a performance evaluation will contain 3 plants from the
United States?
A) 0.4242
B) 0.3776
C) 0.3523
D) 0.4696
A multiple regression is shown below for a data set of yachts where the dependent
variable is the price of the boat in thousands of dollars.
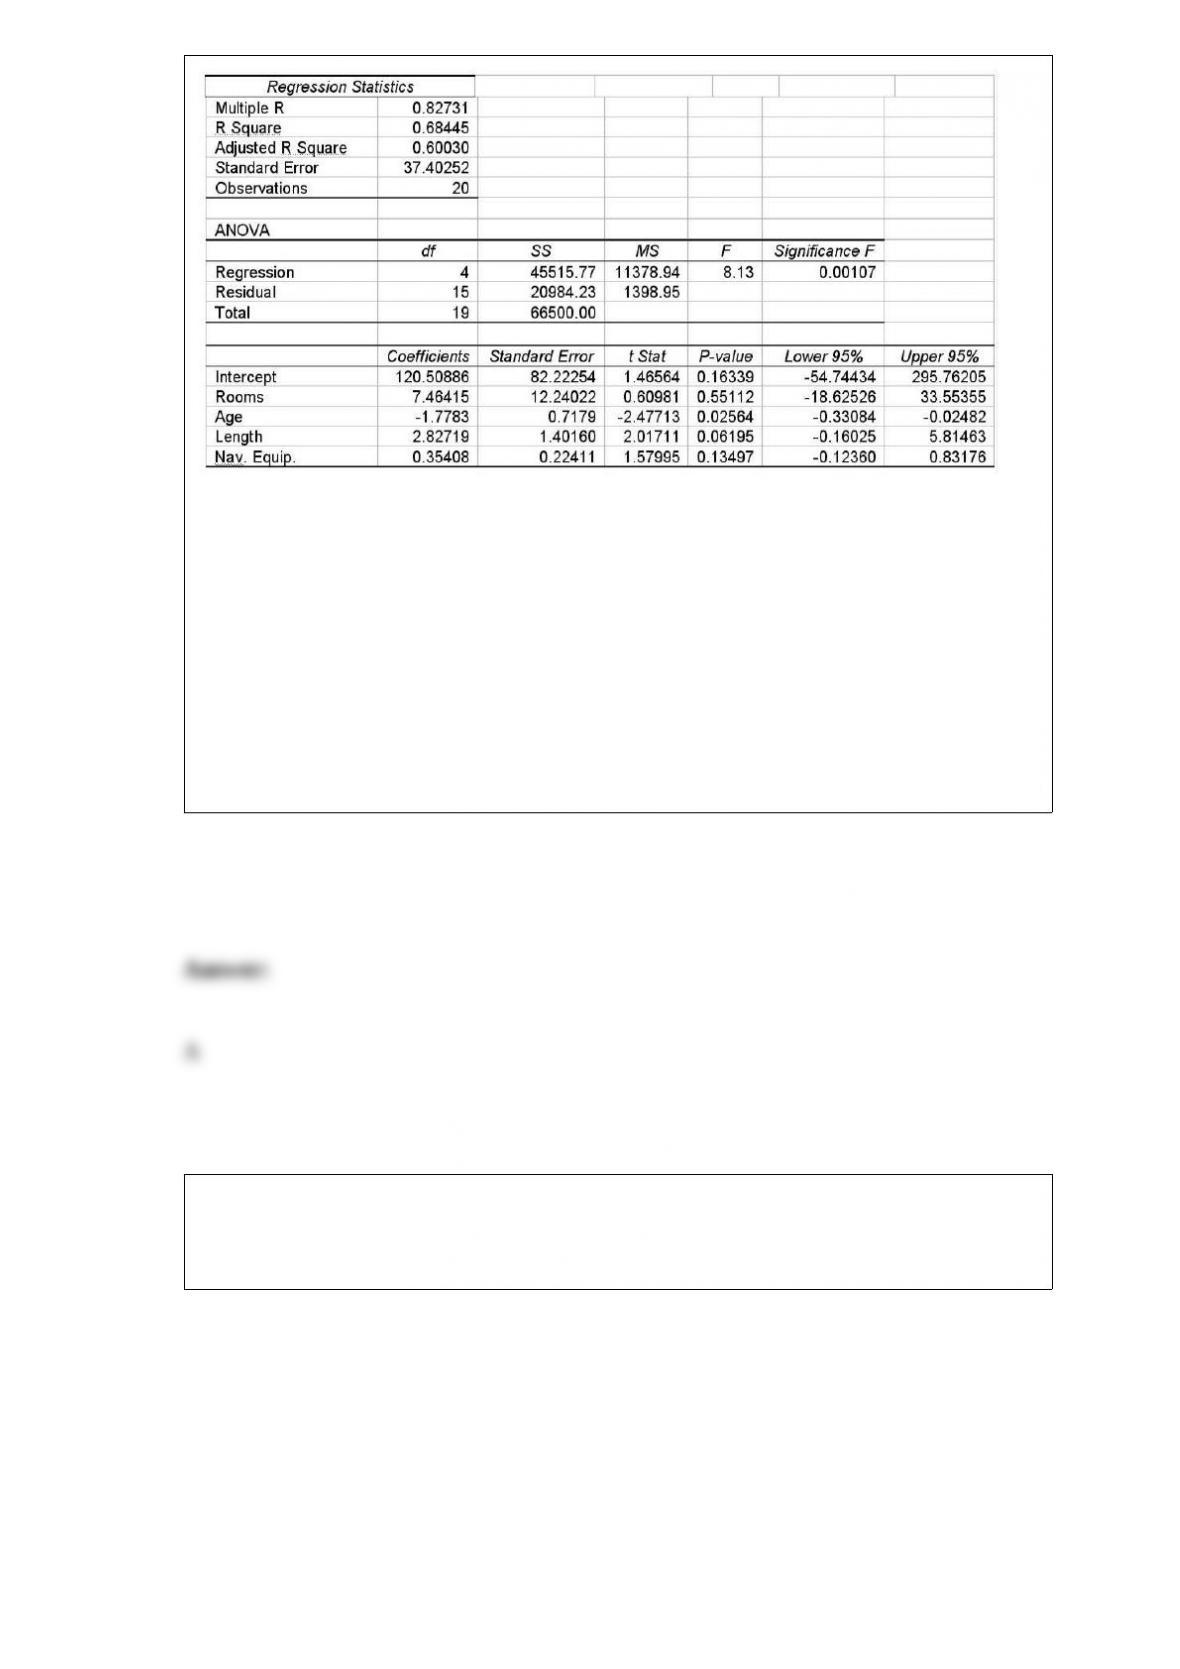
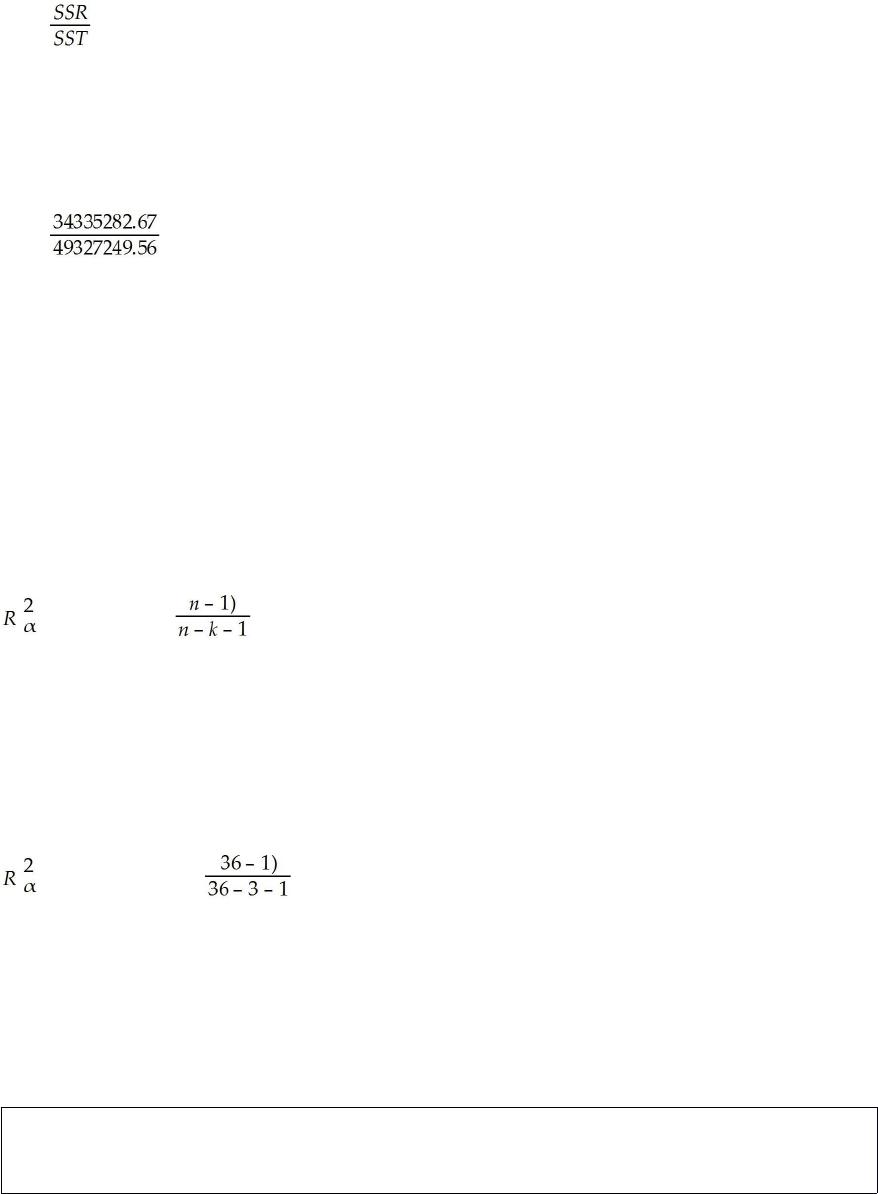
Given this information, what percentage of variation in the dependent variable is
explained by the regression model?
A) Approximately 68 percent
B) About 83 percent
C) About 37 percent
D) About 60 percent
State University recently randomly sampled ten students and analyzed grade point
average (GPA) and number of hours worked off-campus per week. The following data
were observed:

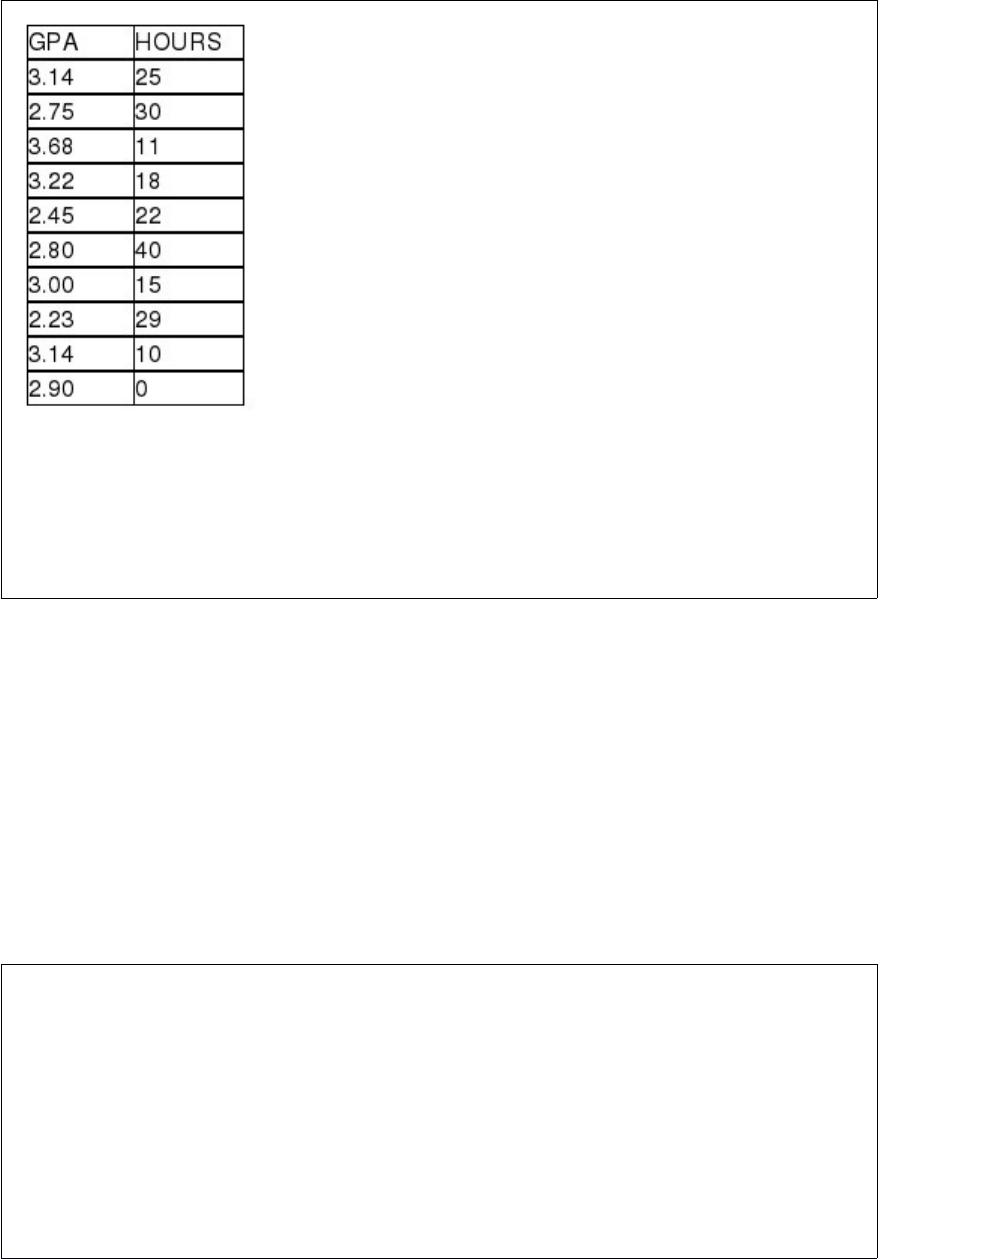
If the university wished to test the claim that the correlation between hours worked and
GPA is negative, the following null and alternative hypotheses would be appropriate:
H0 : ρ < 0.0
Ha : ρ ≥ 0.0
A major consumer group recently undertook a study to determine whether automobile
customers would rate the quality of cars differently whether they were manufactured in
the U.S., Europe, or Japan. To conduct this test, a sample of 20 individuals was asked to
look at mid-range model cars made in each of the three countries. The individuals in the
sample were then asked to provide a rating for each car on a scale of 1 to 1000. The
following computer output resulted, and the tests were conducted using a significance
level equal to 0.05.
ANOVA: Two-Factor Without Replication
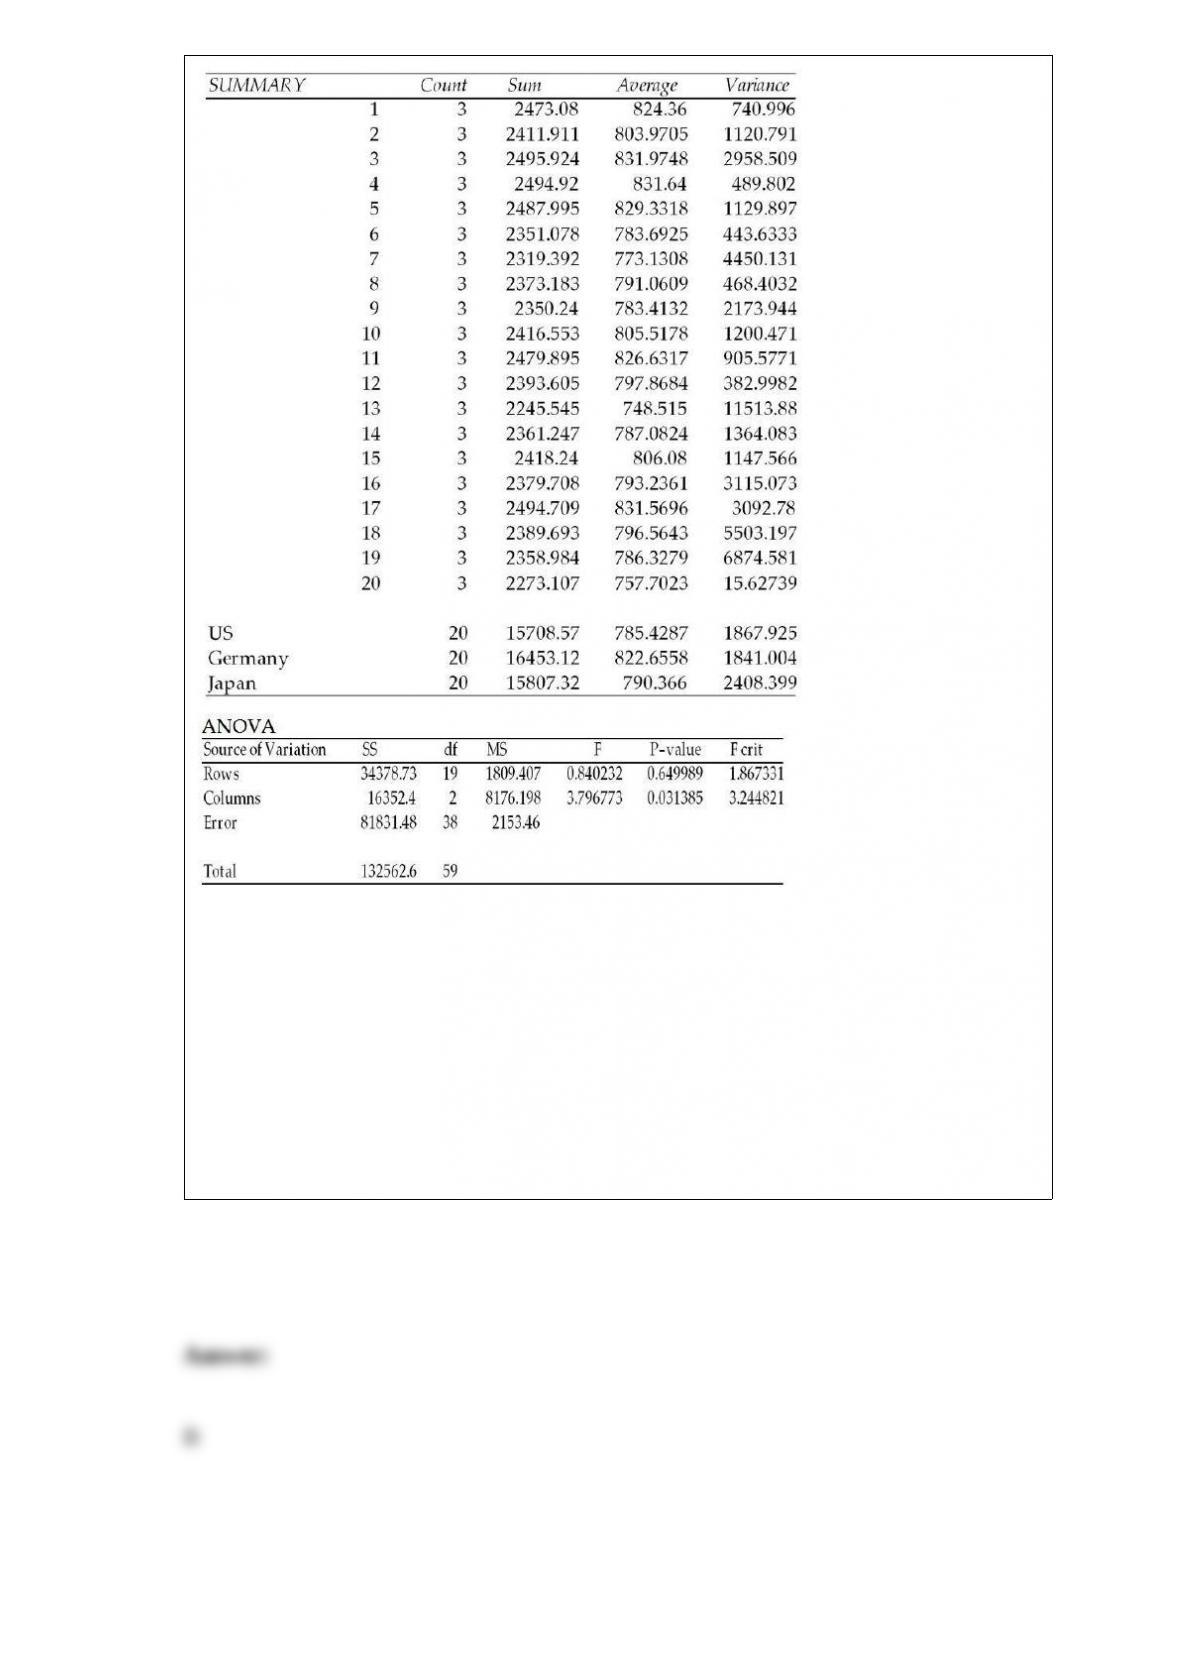
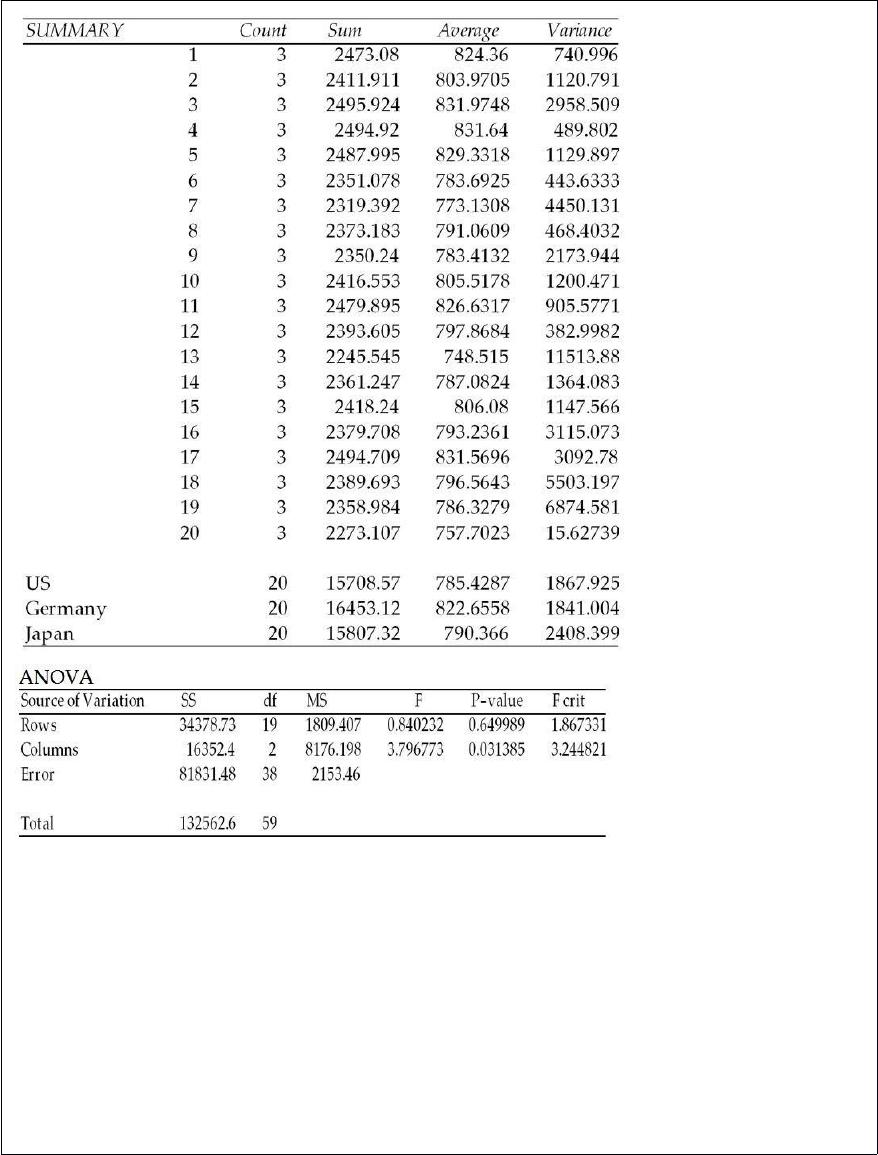
Based upon the data, which of the following statements is true?
A) Blocking was effective.
B) Blocking was not effective.
C) The primary null hypothesis should not be rejected.
D) The averages for the 20 people are not all the same.
In conducting a hypothesis test for the difference between two population means where
the standard deviations are known and the null hypothesis is:
H0 : μA – μβ ≥ 0
What is the p-value assuming that the test statistic has been found to be z = 2.52?
A) 0.0059
B) 0.9882
C) 0.0118
D) 0.4941
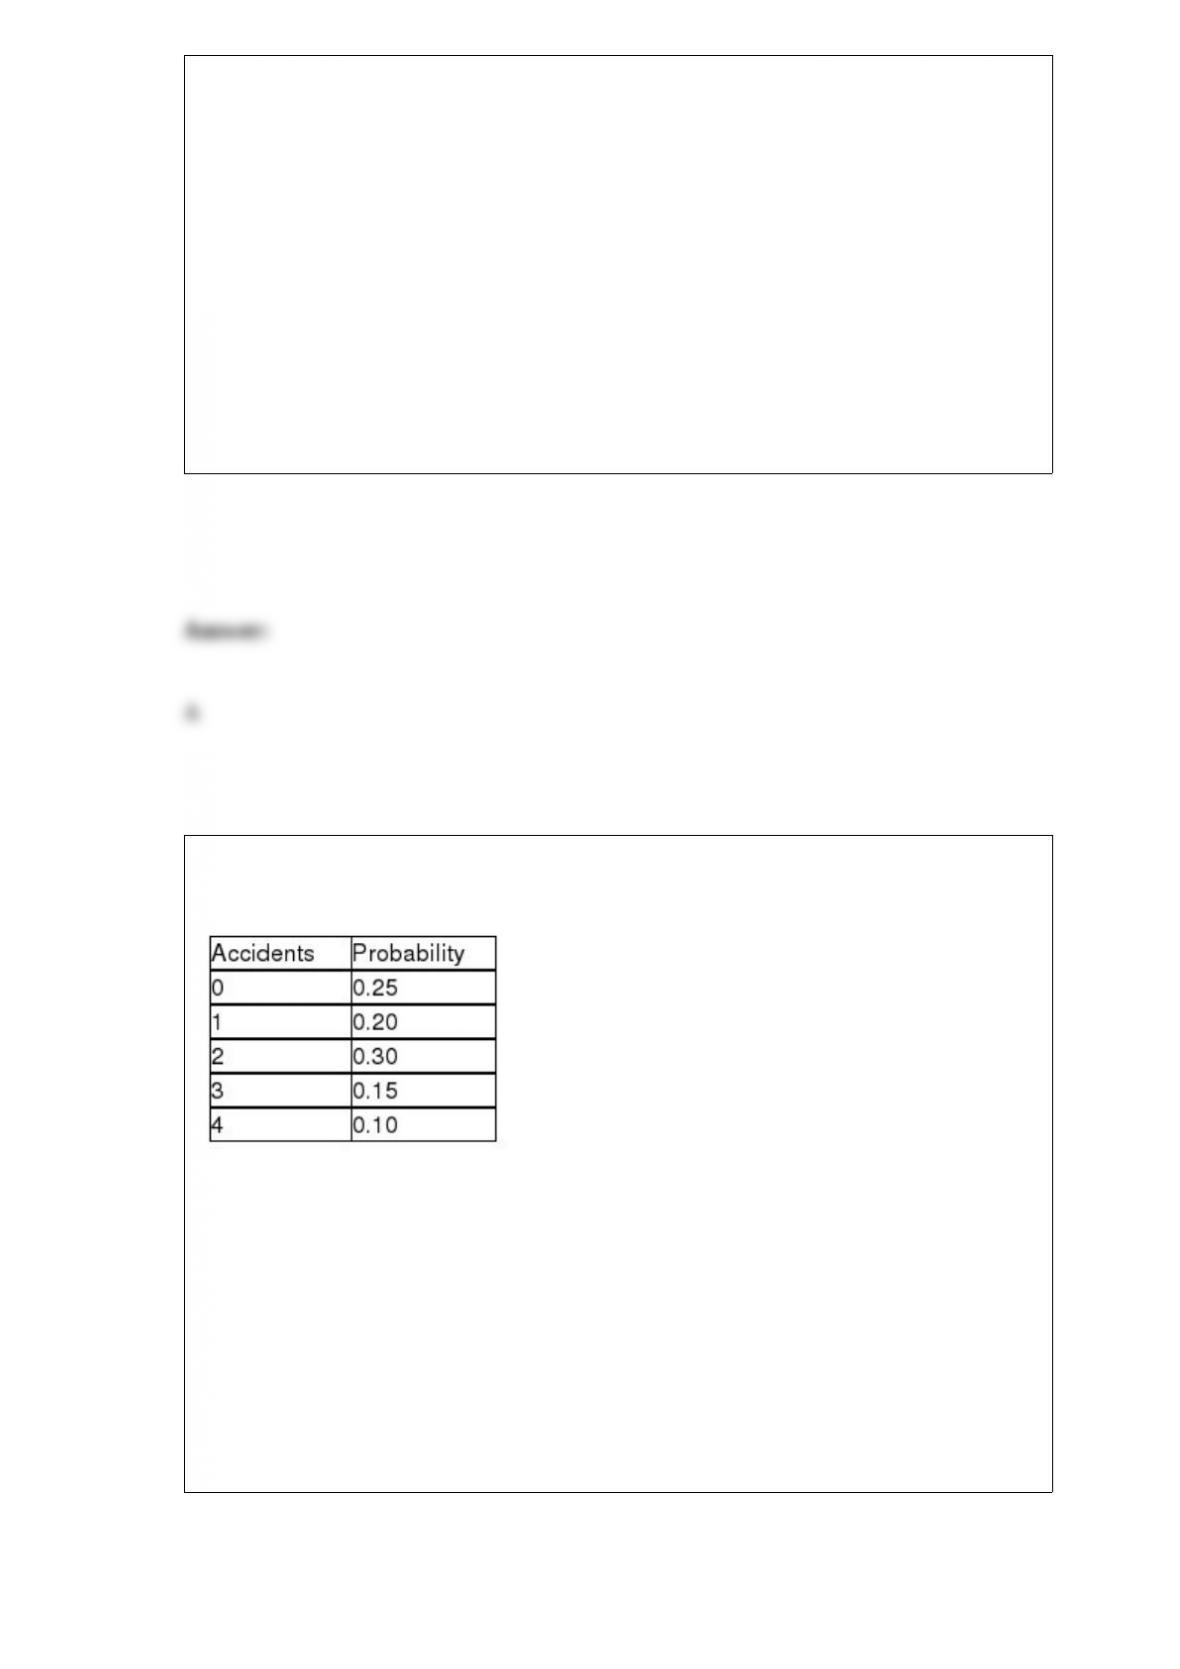
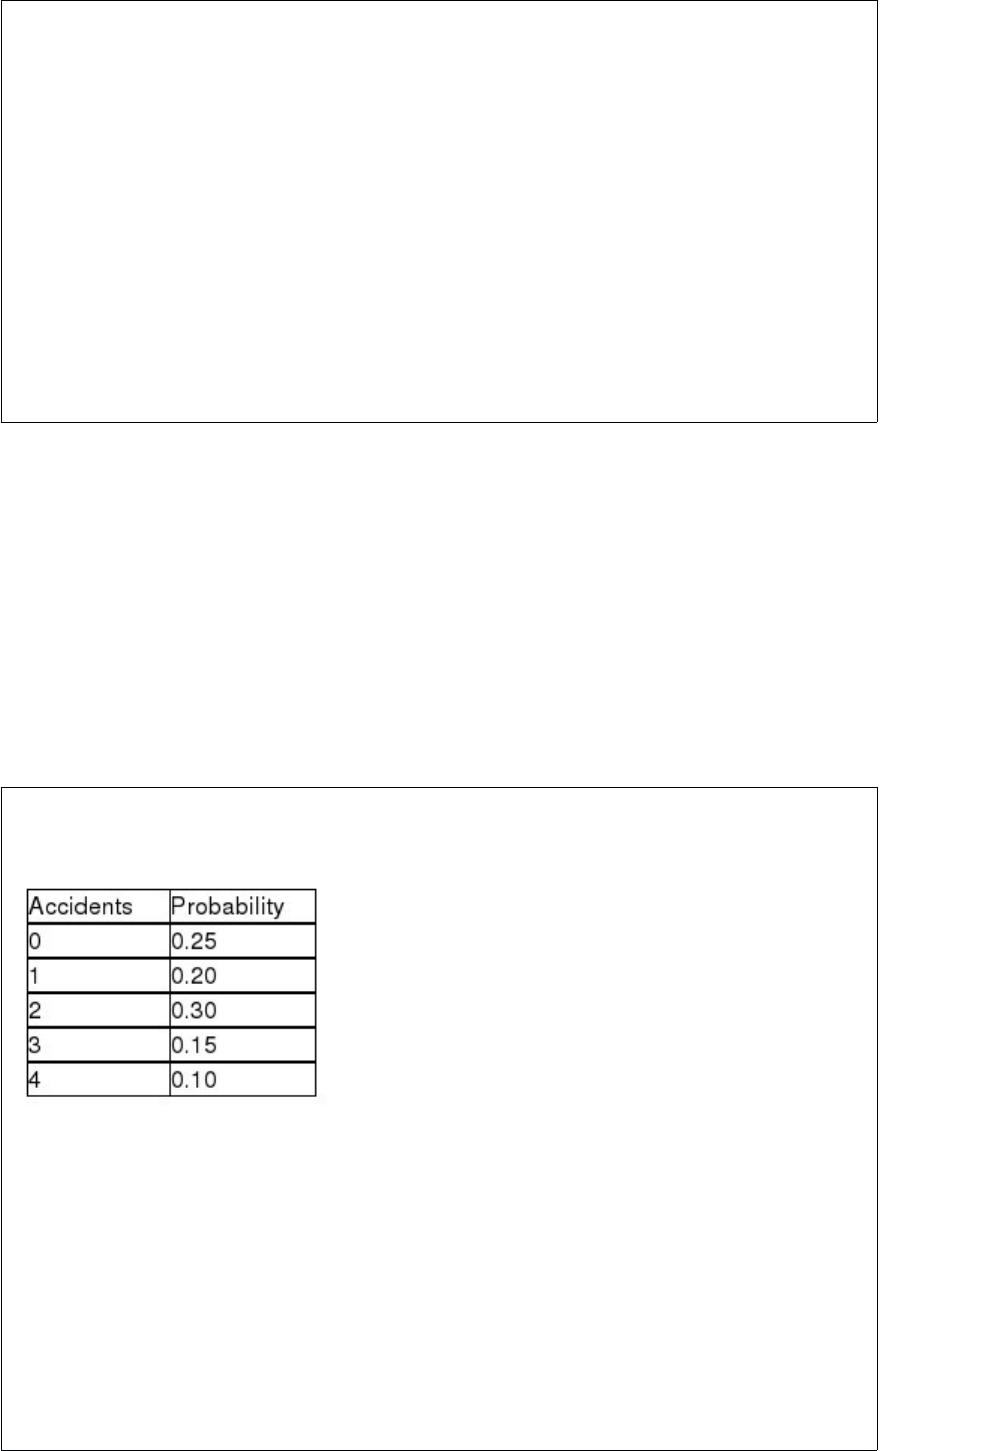
The following probability distribution has been assessed for the number of accidents
that occur in a Midwestern city each day:
Based on this probability distribution, the standard deviation in the number of accidents
per day is:
A) 2.0
B) 1.63
C) 2.65
D) 1.28


For a standardized normal distribution, calculate P(-1.00 < z < 1.00).
A) 0.6826
B) 0.6667
C) 0.4572
D) 0.5521
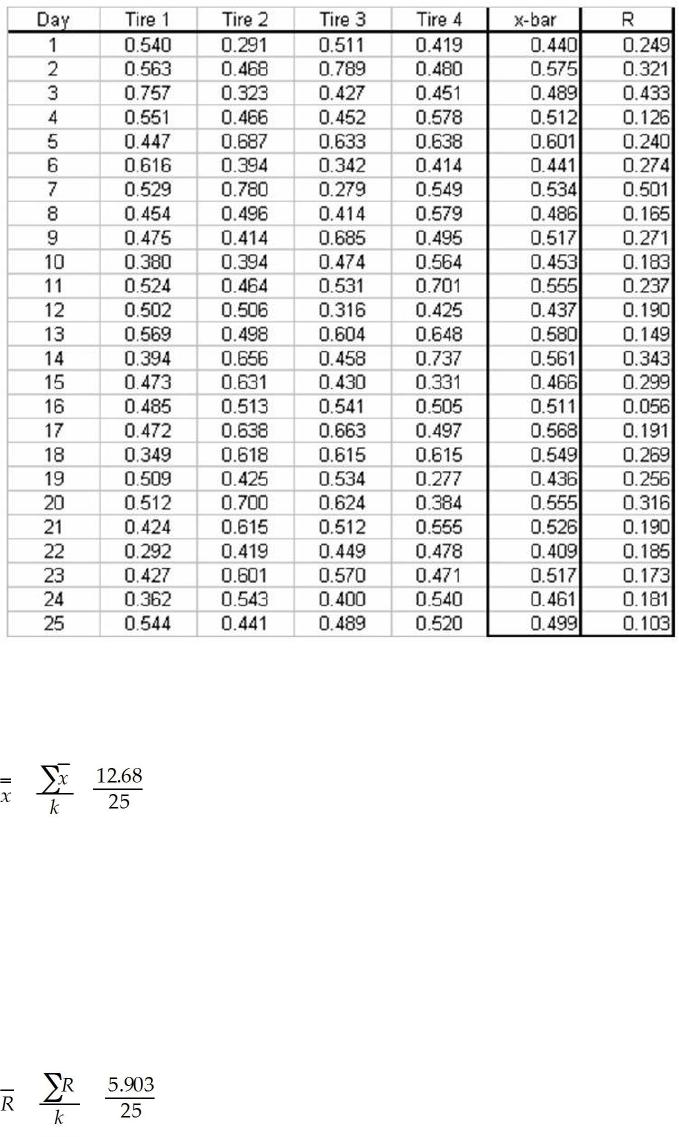
A tire company is interested in monitoring the process that produced tread thickness on
its tires. Every hour 4 tires are selected from production and the tread thickness is
measured. Data for the past 25 days is shown as follows:
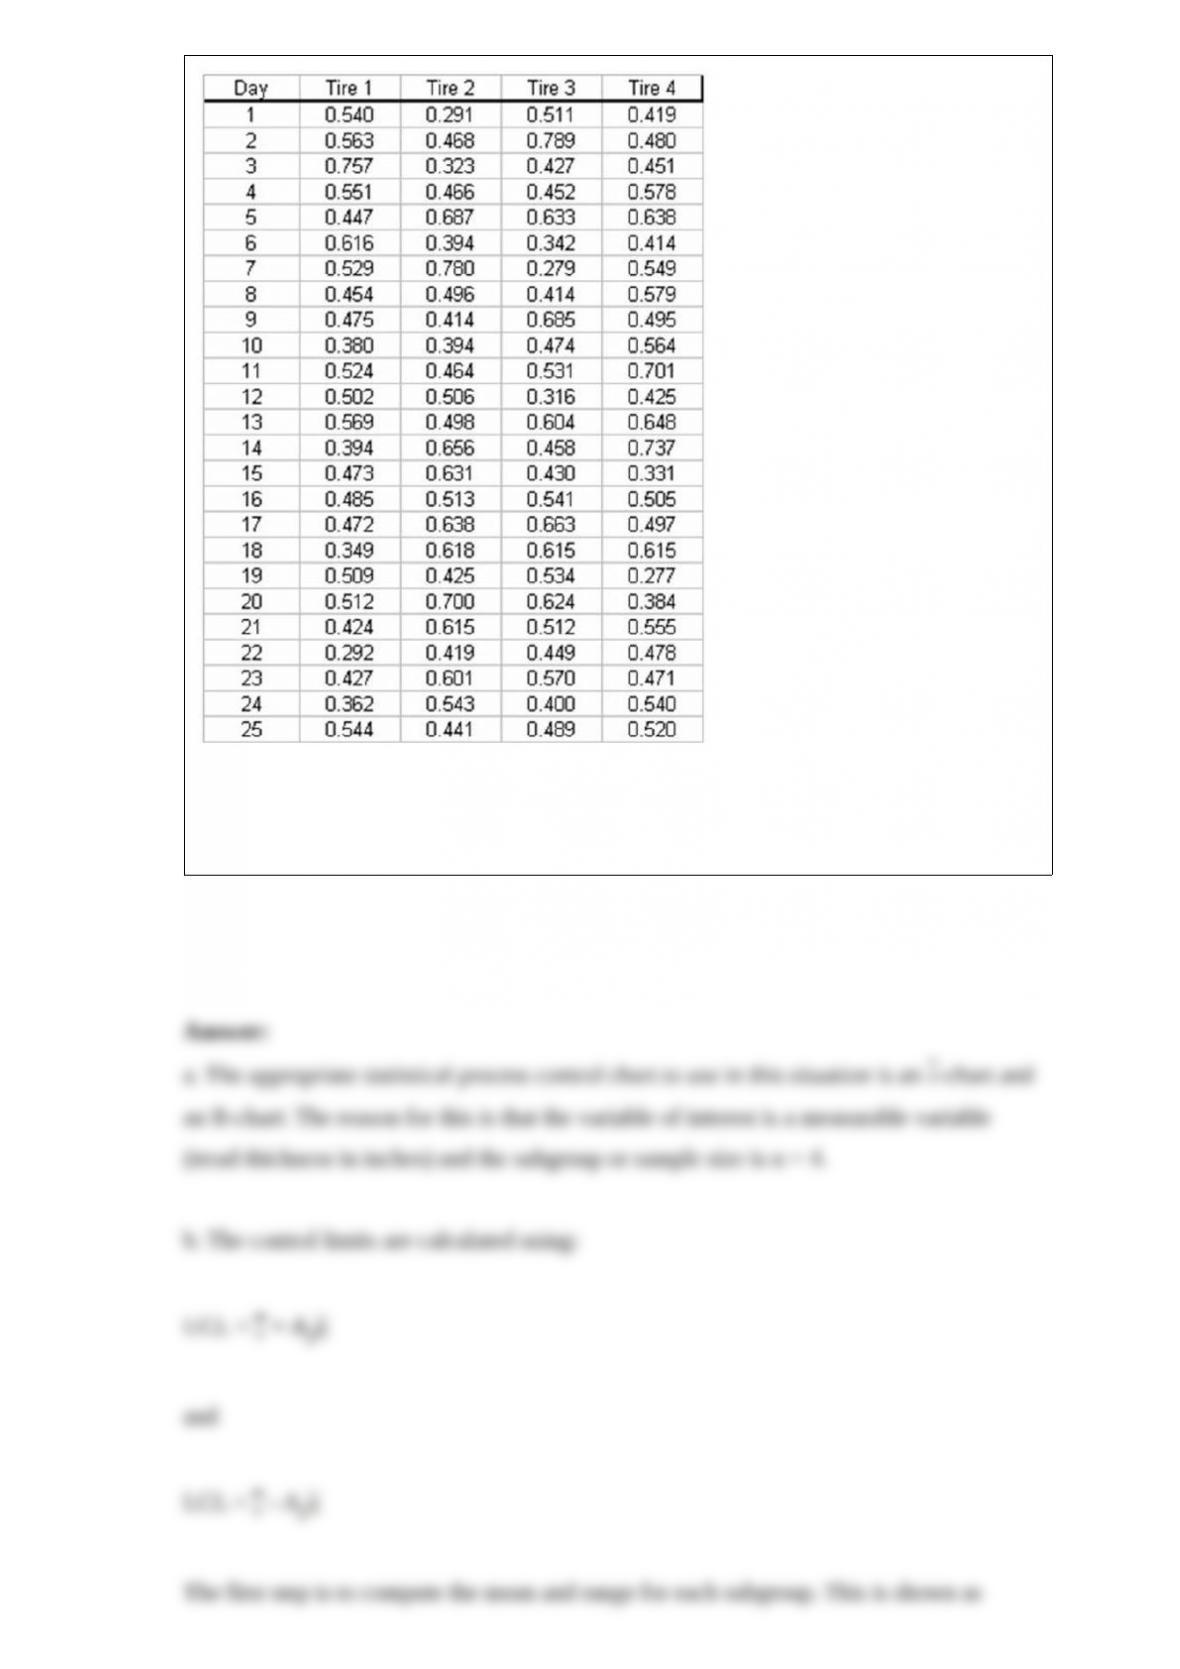
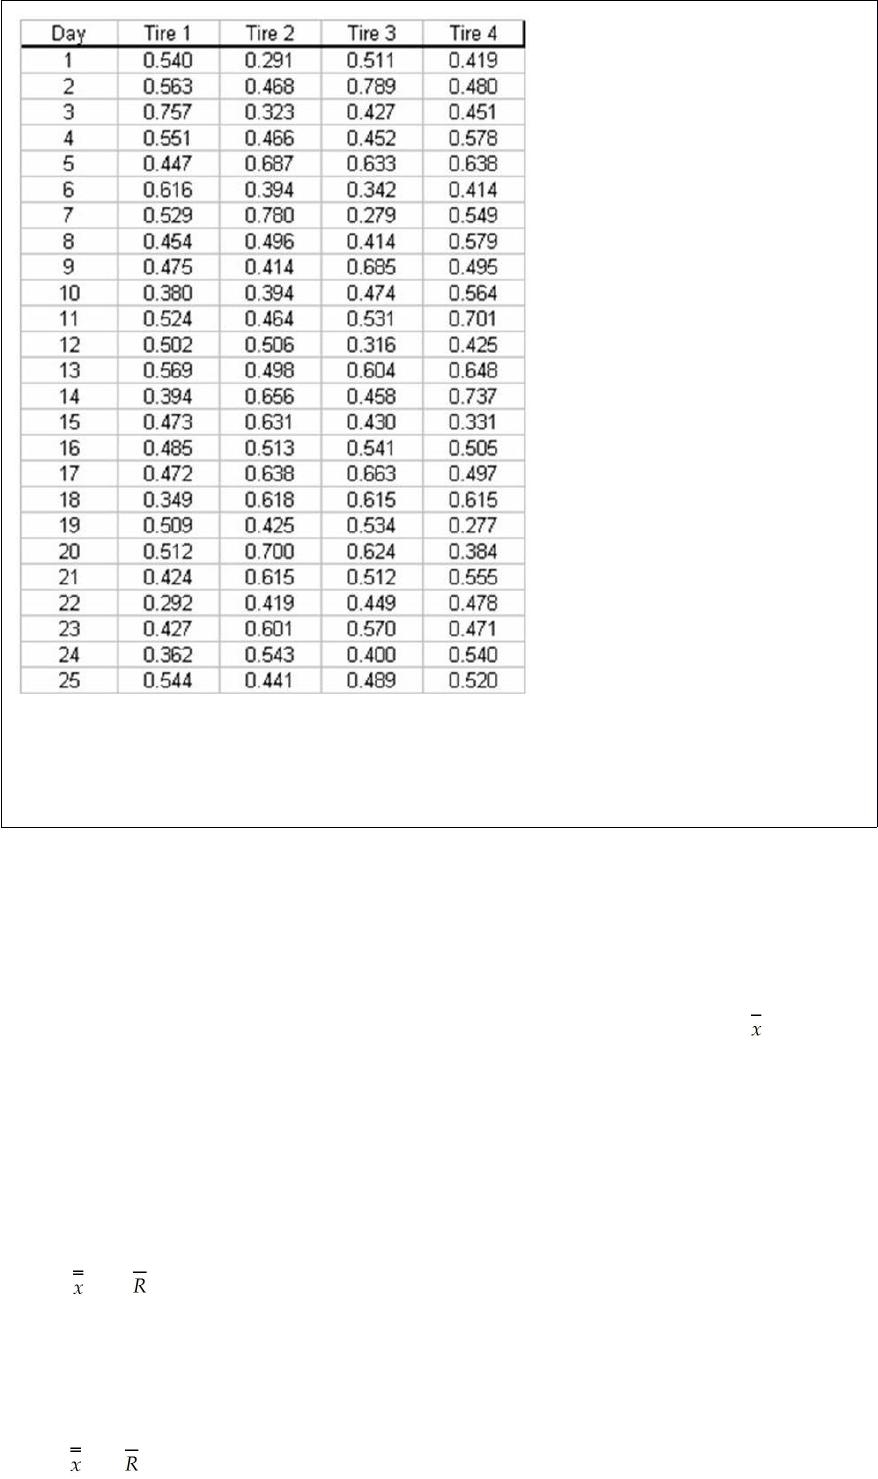
a. What type of control chart would you recommend be used in this case?
b. Compute the upper and lower control limits for these data.

It is assumed that the time failures for an electronic component are exponentially
distributed with a mean of 50 hours between consecutive failures. Based on this
information, what is the probability that a randomly selected part will fail in less than
10 hours?
A) About 0.82
B) About 0.20
C) About 0.33
D) About 0.18
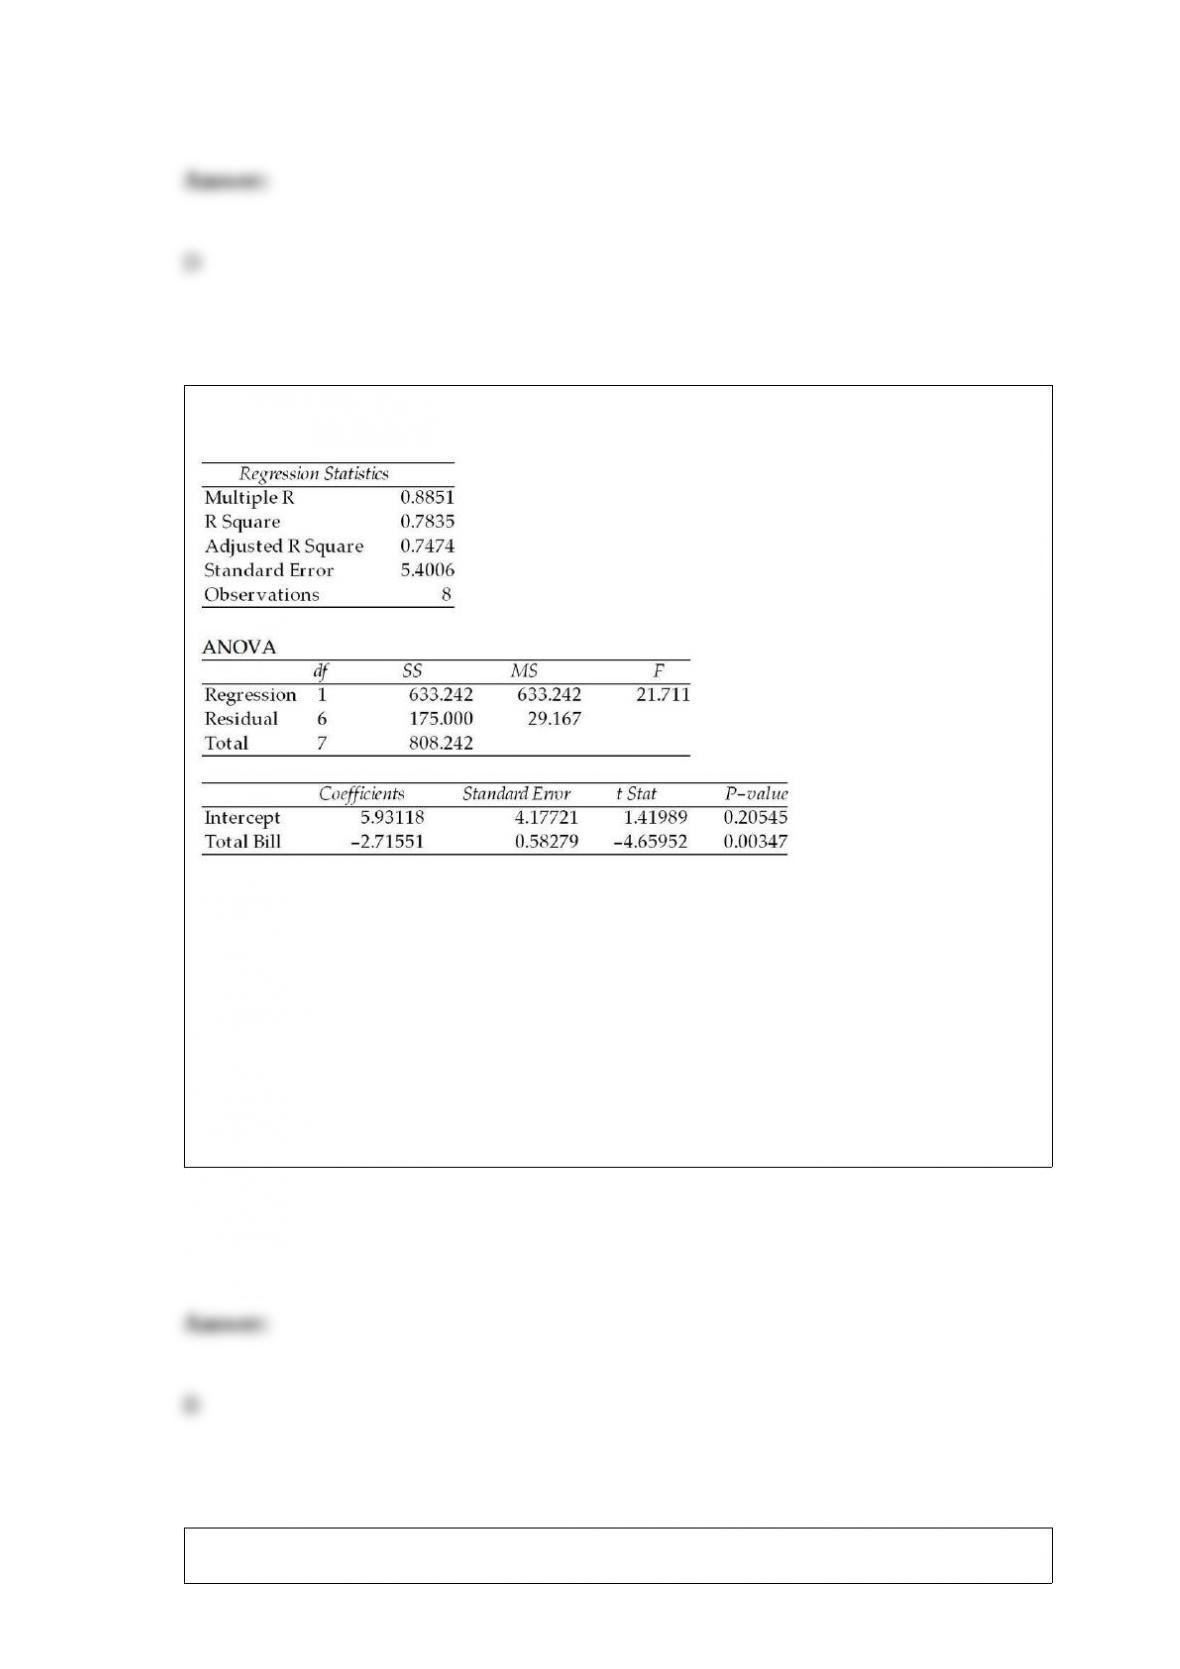
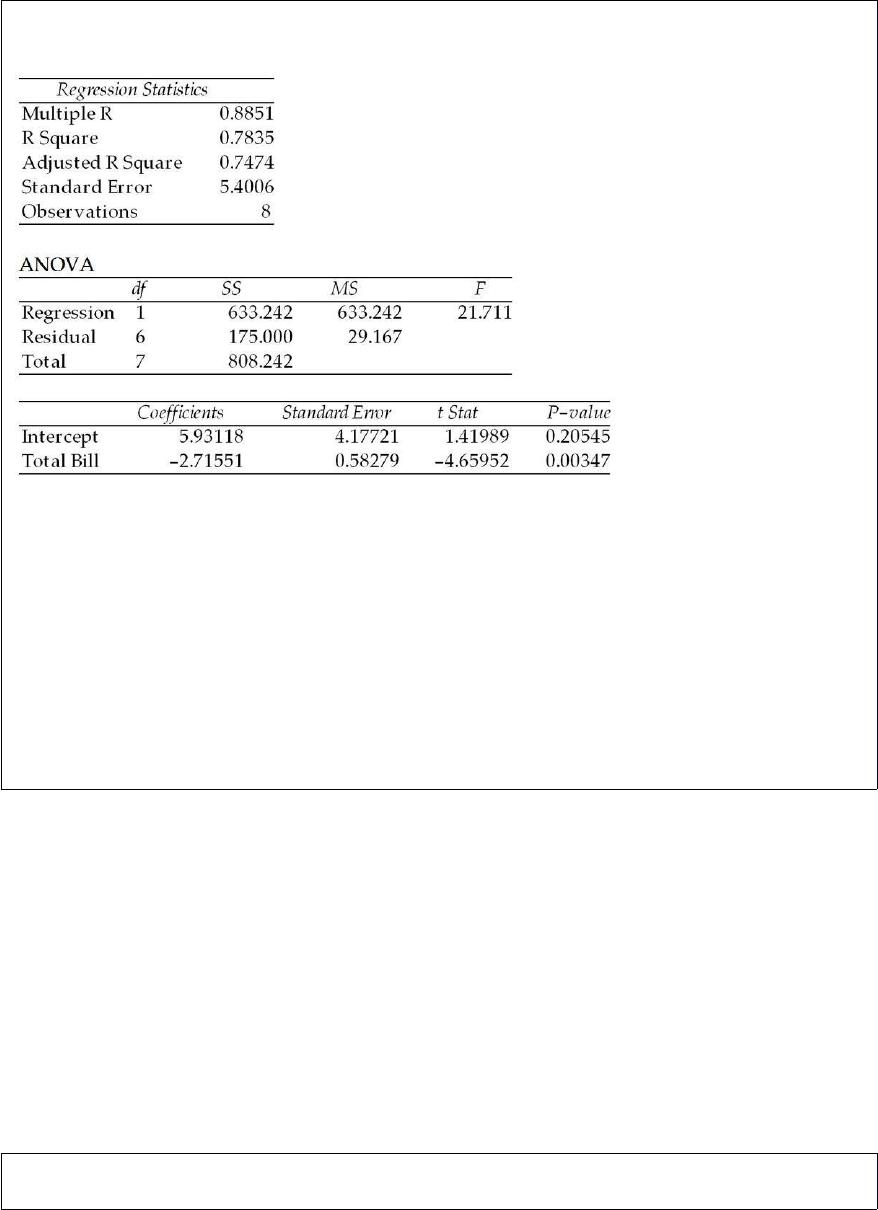
Use the following regression results to answer the question below.
How many observations were involved in this regression?
A) 7
B) 8
C) 9
D) 10
Which of the following is a reason for constructing a joint frequency distribution?


A) To determine the trend between the two variables
B) To measure the spread between the two variables
C) To help analyze the relationship between the two variables
D) To show the average of two variables
A population of 10 items contains 3 that are red and 7 that are green. What is the
probability that in a random sample of 3 items selected without replacement, 2 red and
1 green items are selected?
A) 0.175
B) 0.086
C) 0.124
D) 0.211
A golf ball manufacturer has three dimple patterns it is interested in analyzing to see
whether one results in longer driving distances. However, it also wishes to control for
the material the ball is made from since it believes that the material might affect driving
distance. Four materials can be used. The following data represent the results of tests in
which each combination of dimple pattern and cover material were used and the length
of the ball hit by a robot has been recorded. The test will be conducted using an alpha =

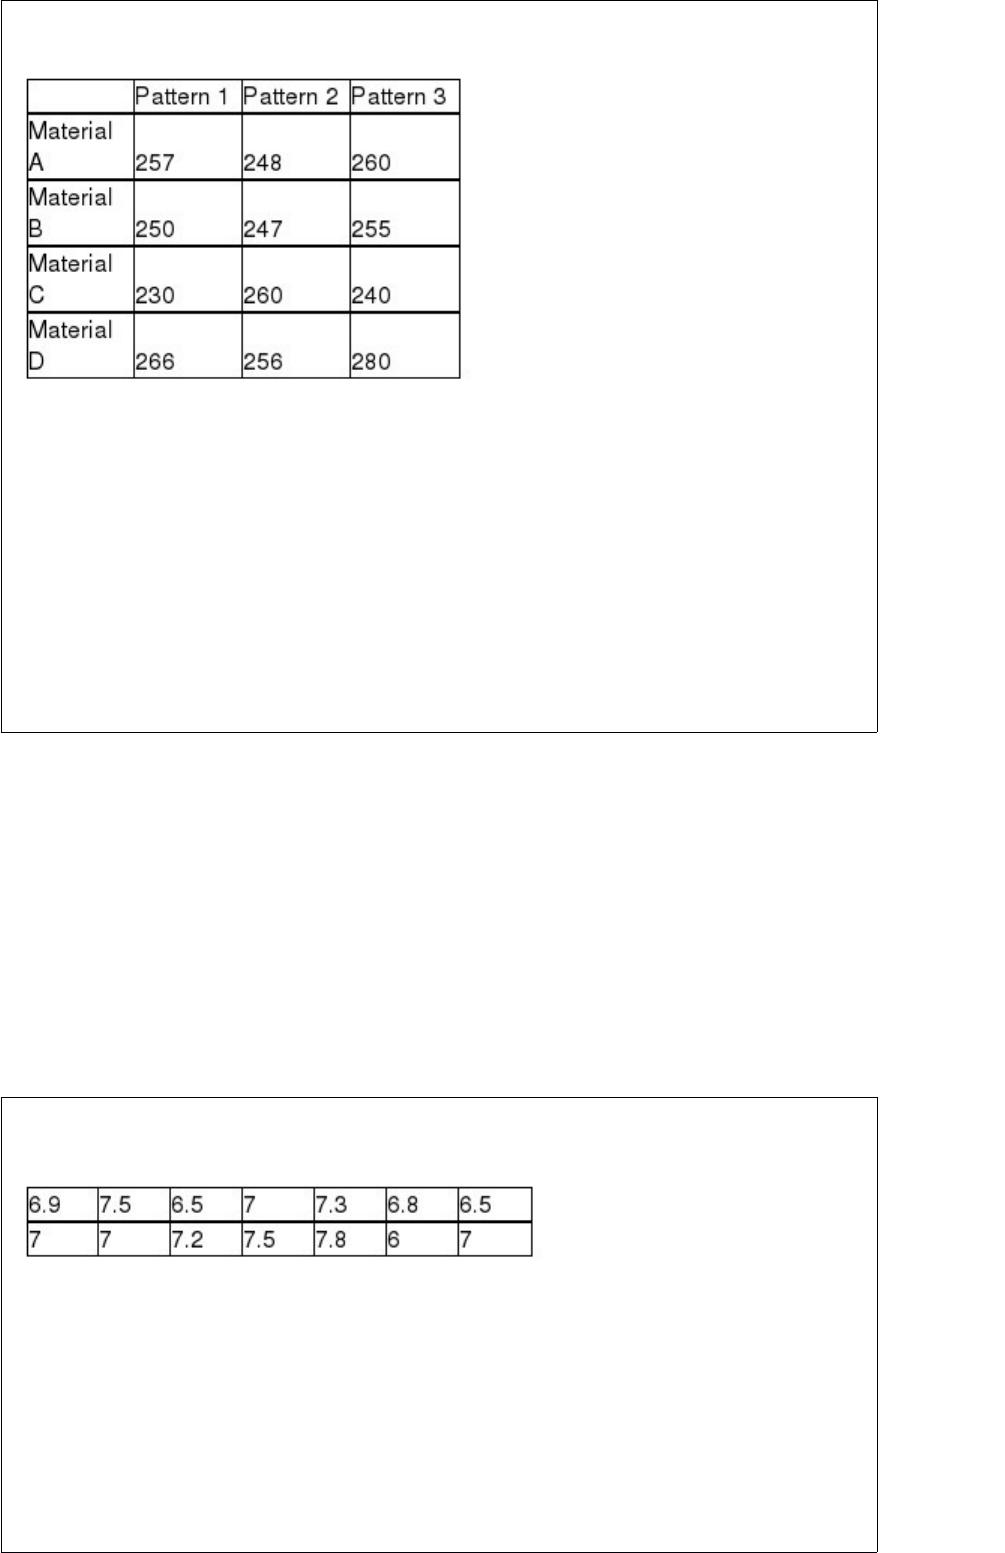
0.05 level.
Given these data, what is the value of Fisher’s Least Significant Difference critical
value?
A) Approximately 19.06
B) 2.4469
C) About 7.65
D) None of the above
The following values represent the population of home mortgage interest rates (in
percents) being charged by the banks in a particular city:
Given this information, what would the sampling error be if a sample including the
seven values in the top row were used to compute the sample mean?
A) Approximately 6.93
B) About 0.56
C) Approximately -0.07


D) About 0.07
The manager of a computer help desk operation has collected enough data to conclude
that the distribution of time per call is normally distributed with a mean equal to 8.21
minutes and a standard deviation of 2.14 minutes. What is the probability that three
randomly monitored calls will each be completed in 4 minutes or less?
A) 0.4756
B) Approximately 0.1076
C) About 0.00001
D) Can’t be determined without more information.
For the following hypothesis test:
With n = 80, σ = 9, and = 47.1, state the decision rule in terms of the critical value of
the test statistic.
A) Reject the null hypothesis if the calculated value of the test statistic, z, is greater
than the critical value of the test statistic, 1.645. Otherwise, do not reject.


B) Reject the null hypothesis if the calculated value of the test statistic, z, is greater than
the critical value of the test statistic, 2.05. Otherwise, do not reject.
C) Accept the null hypothesis if the calculated value of the test statistic, z, is greater
than the critical value of the test statistic, 1.645. Otherwise, do not accept.
D) Accept the null hypothesis if the calculated value of the test statistic, z, is greater
than the critical value of the test statistic, 2.05. Otherwise, do not accept.
In a goodness-of-fit test about a population distribution, if one or more parameters are
left unspecified in H0, they must be estimated from the sample data. This will reduce
the degrees of freedom by ________ for each estimated parameter.
A) 1
B) 2
C) 3
D) None of the above
The produce manager for a large retail food chain is interested in estimating the
percentage of potatoes that arrive on a shipment with bruises. A random sample of 150
potatoes showed 14 with bruises. Based on this information, what is the margin of error
for a 95 percent confidence interval estimate?
A) 0.0933


B) 0.0466
C) 0.0006
D) Can’t be determined without knowing σ.
The Grangeville Power Company has four classifications for its customers. For each
customer classification, the company tracks the total amount of electricity used during
the year. Which of the following types of graphs would be most appropriate to use?
A) A horizontal bar chart
B) A vertical bar chart
C) Both A and B would be appropriate.
D) A histogram
A study was recently conducted at a major university to estimate the difference in the
proportion of business school graduates who go on to graduate school within five years
after graduation and the proportion of non-business school graduates who attend
graduate school. A random sample of 400 business school graduates showed that 75 had
gone to graduate school while in a random sample of 500 non-business graduates, 137
had gone on to graduate school. Based on a 95 percent confidence level, what is the
upper limit of the confidence interval estimate?


A) 0.2340
B) 0.1034
C) -0.031
D) -0.018
The Empirical Rule states that for a bell-shaped distribution, approximately 95 percent
of data should lie within:
A) one standard deviation from either side of the mean.
B) two standard deviations from either side of the mean.
C) three standard deviations from either side of the mean.
D) four standard deviations from either side of the mean.
A population, with an unknown distribution, has a mean of 80 and a standard deviation
of 7. For a sample of 49, the probability that the sample mean will be larger than 82 is:
A) 0.5228
B) 0.9772
C) 0.4772


D) 0.0228
A special roulette wheel, which has an equal number of red and black spots, has come
up red four times in a row. Assuming that the roulette wheel is fair, what concept allows
a player to know that the probability the next spin of the wheel will come up black is
0.5?
A) Concept of independent events
B) Concept of mutually exclusive events
C) Concept of dependent events
D) Concept of mutually inclusive events
You are given the following null and alternative hypotheses:
If the true population mean is 1.25, determine the value of beta. Assume the population
standard deviation is known to be 0.50 and the sample size is 60.
A) 0.40
B) 0.04


C) 0.51
D) 0.80
If two variables show a positive linear relationship in a scatter diagram:
A) most of the data values will plot in the lower left-hand quadrant.
B) most of the data values will plot in the lower left-hand and upper right-hand
quadrants.
C) most of the data values will cluster close to the x and y axes.
D) the data will cluster in the center of the graph.
The control limits in a control chart can be interpreted to mean:
A) any value falling outside the limits is a defect and the product should be discarded.
B) the range of virtually all special cause variation.
C) any value falling within the limits means the product is high quality.
D) the range of virtually all common cause variation.

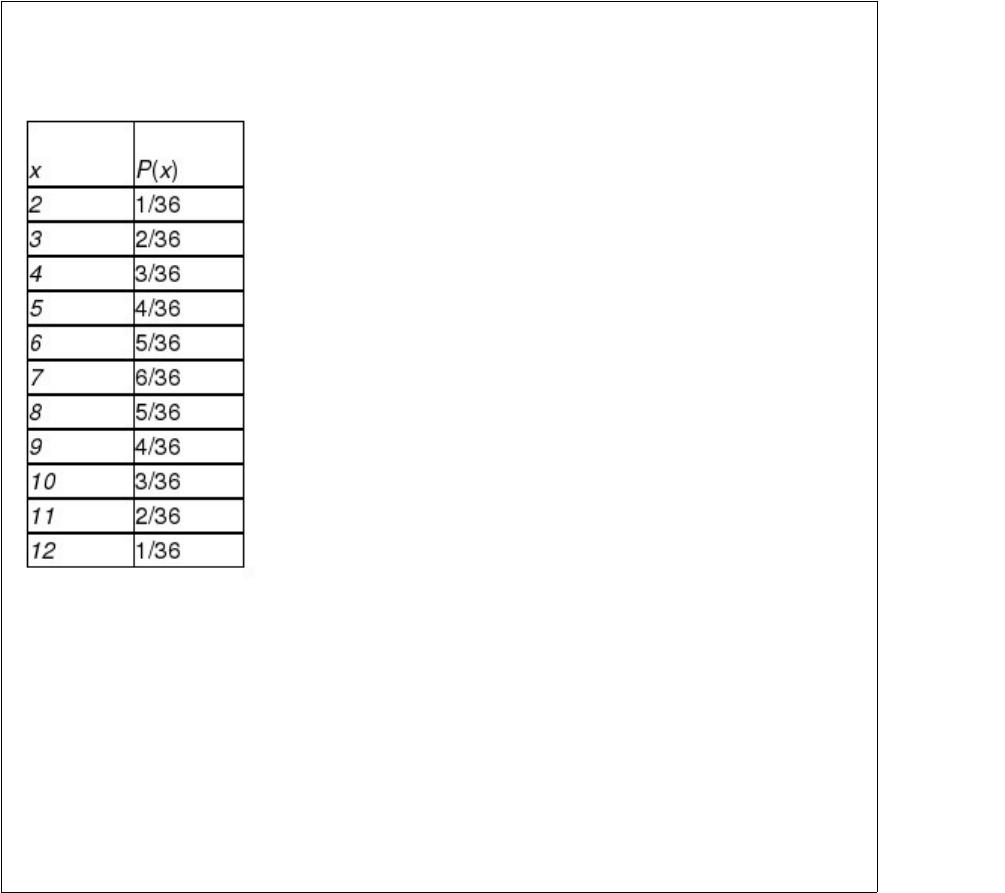
The roll of a pair of dice has the following probability distribution, where the random
variable is the sum of the values produced by each die:
Calculate the variance of x.
A) 5.833
B) 6.122
C) 5.666
D) 5.122
For the following hypothesis test:
With n = 80, σ = 9, and = 47.1, state the calculated value of the test statistic z.
A) 3.151
B) -2.141
C) 2.087
D) -3.121
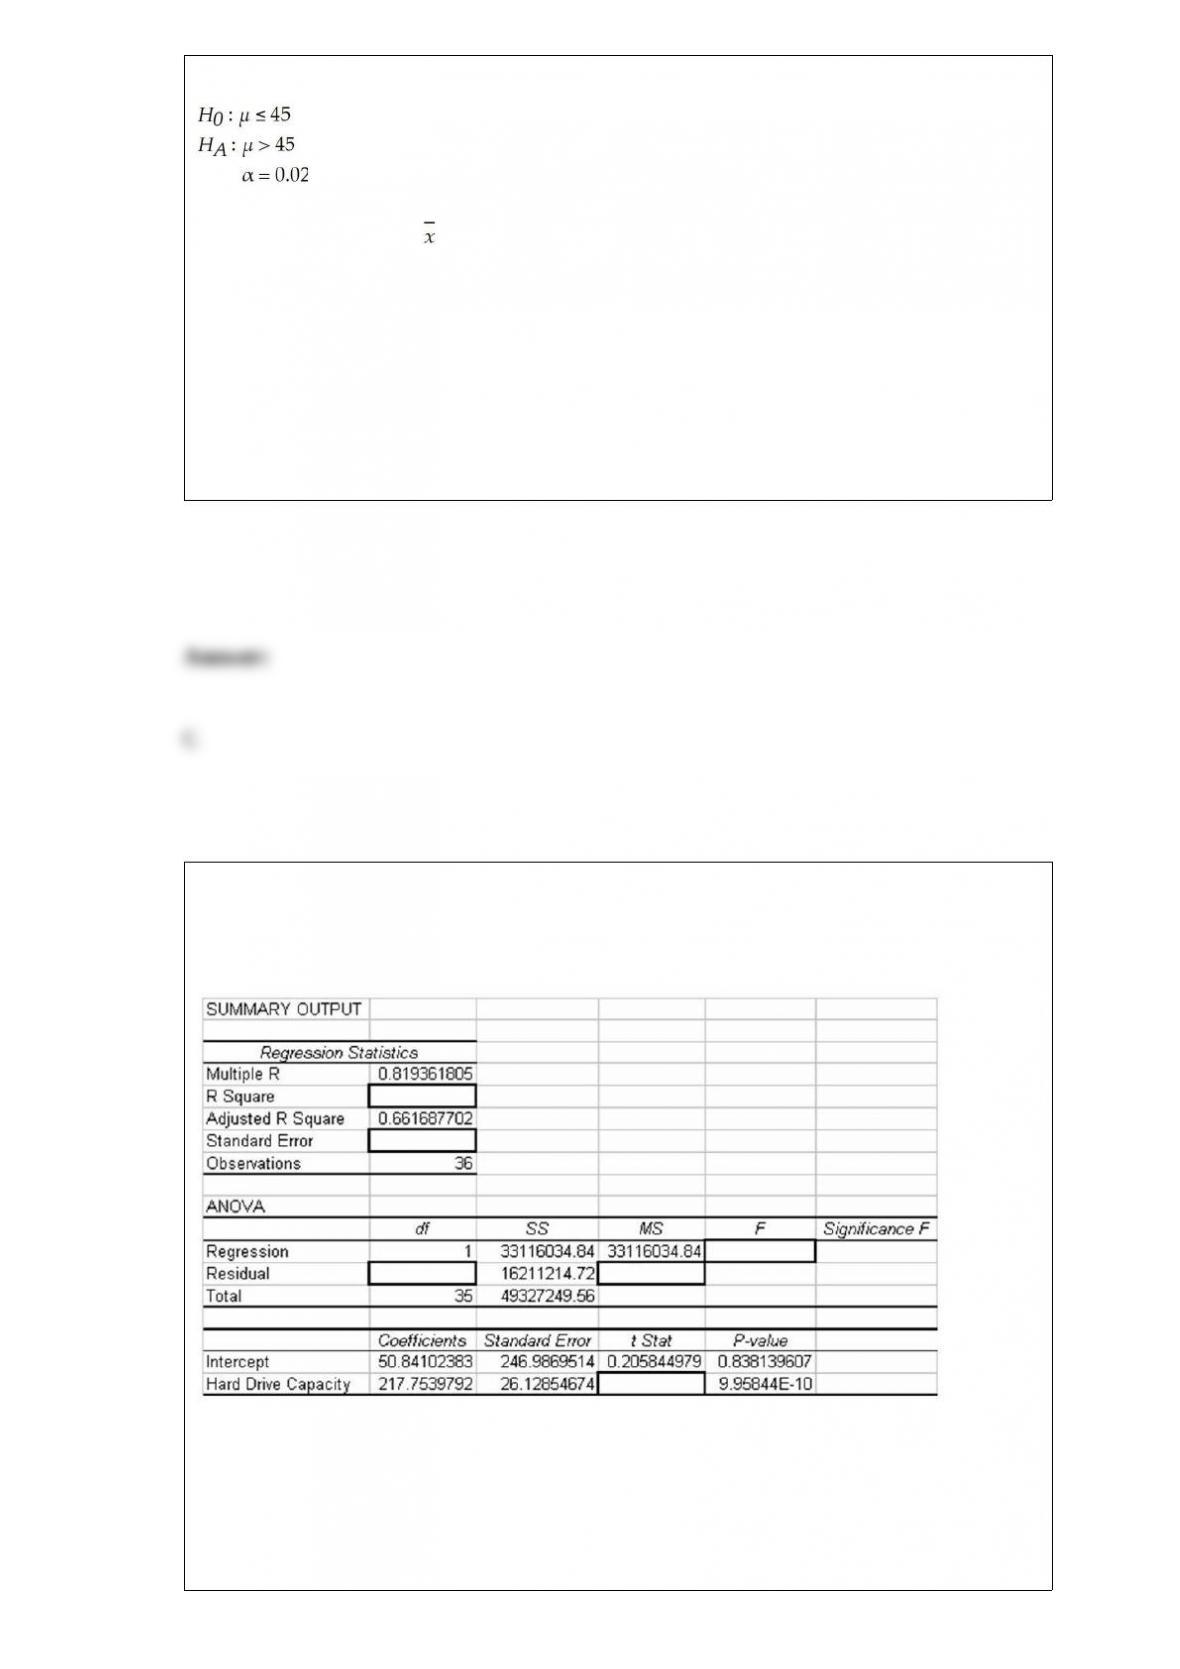
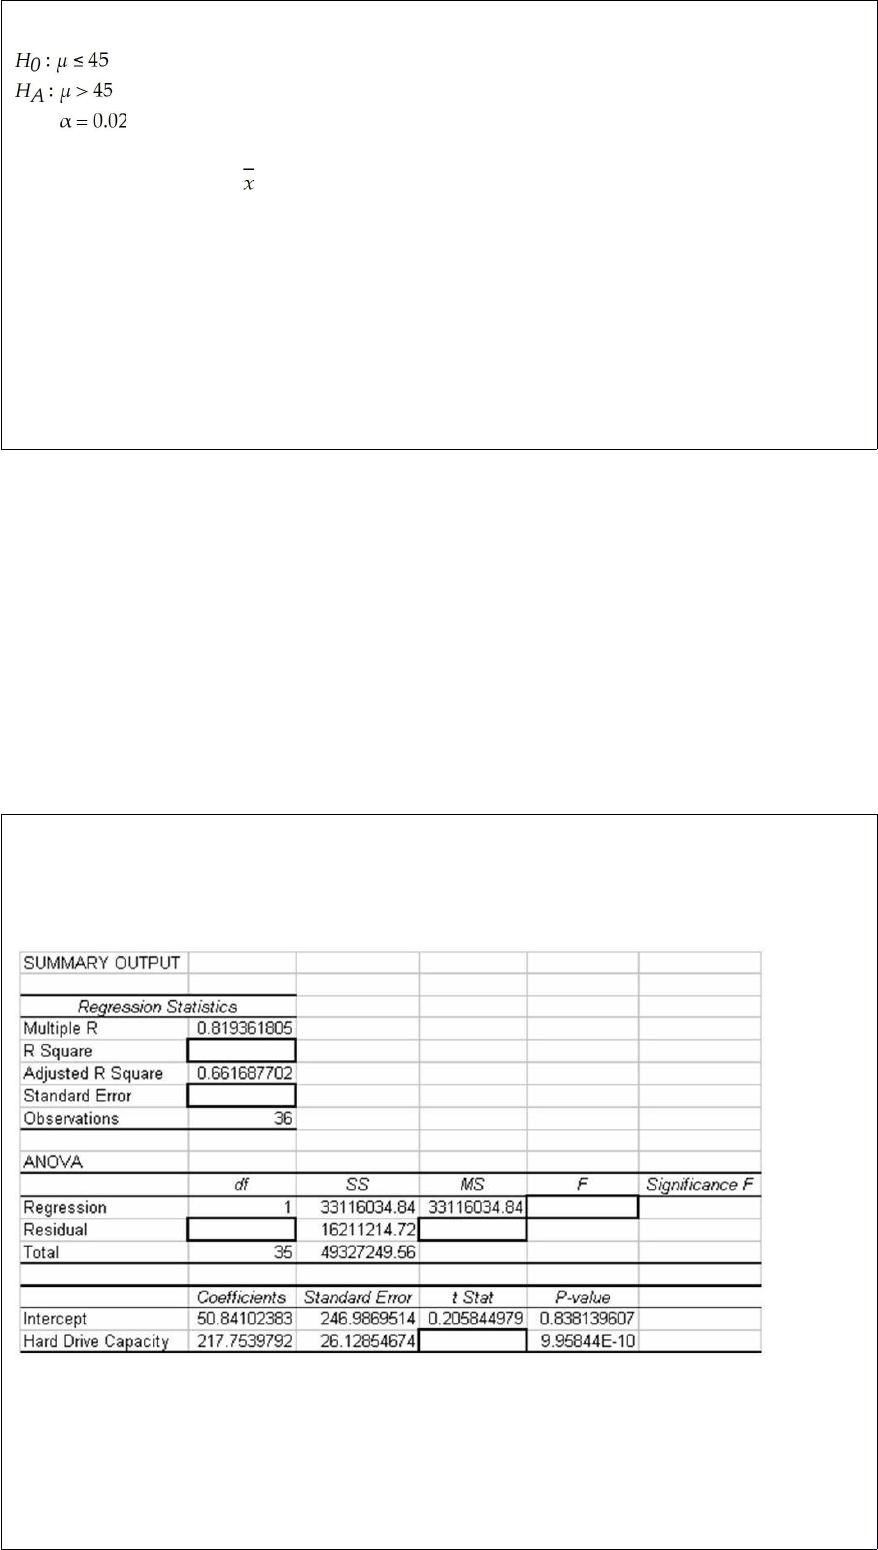
Consider the following partially completed computer printout for a regression analysis
where the dependent variable is the price of a personal computer and the independent
variable is the size of the hard drive.
Based on the information provided, what is the estimate for the standard error of the
estimate for the regression model?
A) Approximately 690.50


B) About 4,026
C) Just under 376.23
D) 476,800
In developing a confidence interval estimate for the population mean, which of the
following is true?
A) The larger the sample standard deviation, the wider will be the interval estimate, all
other things being equal.
B) If the population standard deviation is unknown, the appropriate critical value should
be obtained from the t-distribution.
C) The confidence interval developed from a smaller sample size will have a larger
margin of error than one obtained using a larger sample size, all other things being
equal.
D) All of the above are true.
A random sample of 121 automobiles traveling on an interstate showed an average
speed of 65 mph. From past information, it is known that the standard deviation of the
population is 22 mph. The 95 percent confidence interval for μ is determined as (61.08,
68.92). If we are to reduce the sample size to 100 (other factors remain unchanged), the
95 percent confidence interval for μ would:


A) become wider.
B) become narrower.
C) be the same.
D) be impossible to determine.
A major cell phone service provider has determined that the number of minutes that its
customers use their phone per month is normally distributed with a mean equal to 445.5
minutes with a standard deviation equal to 177.8 minutes. The company is thinking of
charging a lower rate for customers who use the phone less than a specified amount. If
it wishes to give the rate reduction to no more than 12 percent of its customers, what
should the cut-off be?
A) About 237 minutes
B) About 654 minutes
C) About 390 minutes
D) About 325 minutes
The manager at a local movie theater has collected data for a long period of time and
has concluded that the revenue from concession sales during the first show each
evening is normally distributed with a mean equal to $336.25 and a standard deviation
equal to $80. Based on this information, what are the chances that the revenue on the


first show will be between $300 and $500?
A) About 0.3062
B) Approximately 0.6534
C) 0.1736
D) Approximately 0.4798
The advantage of using the interquartile range versus the range as a measure of
variation is:
A) it is easier to compute.
B) it utilizes all the data in its computation.
C) it gives a value that is closer to the true variation.
D) it is less affected by extremes in the data.
Explain how to determine whether the binomial distribution can be used in a particular
application.

Under what circumstances would you wish to select a pilot sample?
A mid-management team consists of 10 people, 6 males and 4 females. Recently top
management selected 4 people from this team for promotion. It was stated that the
selections were based on random selection. All 4 people selected were males. The
females are upset and believe that there may have been more than random selection
involved here. What probability distribution should be used to analyze this situation and
what is the probability that all 4 promotions would go to males if the selections were

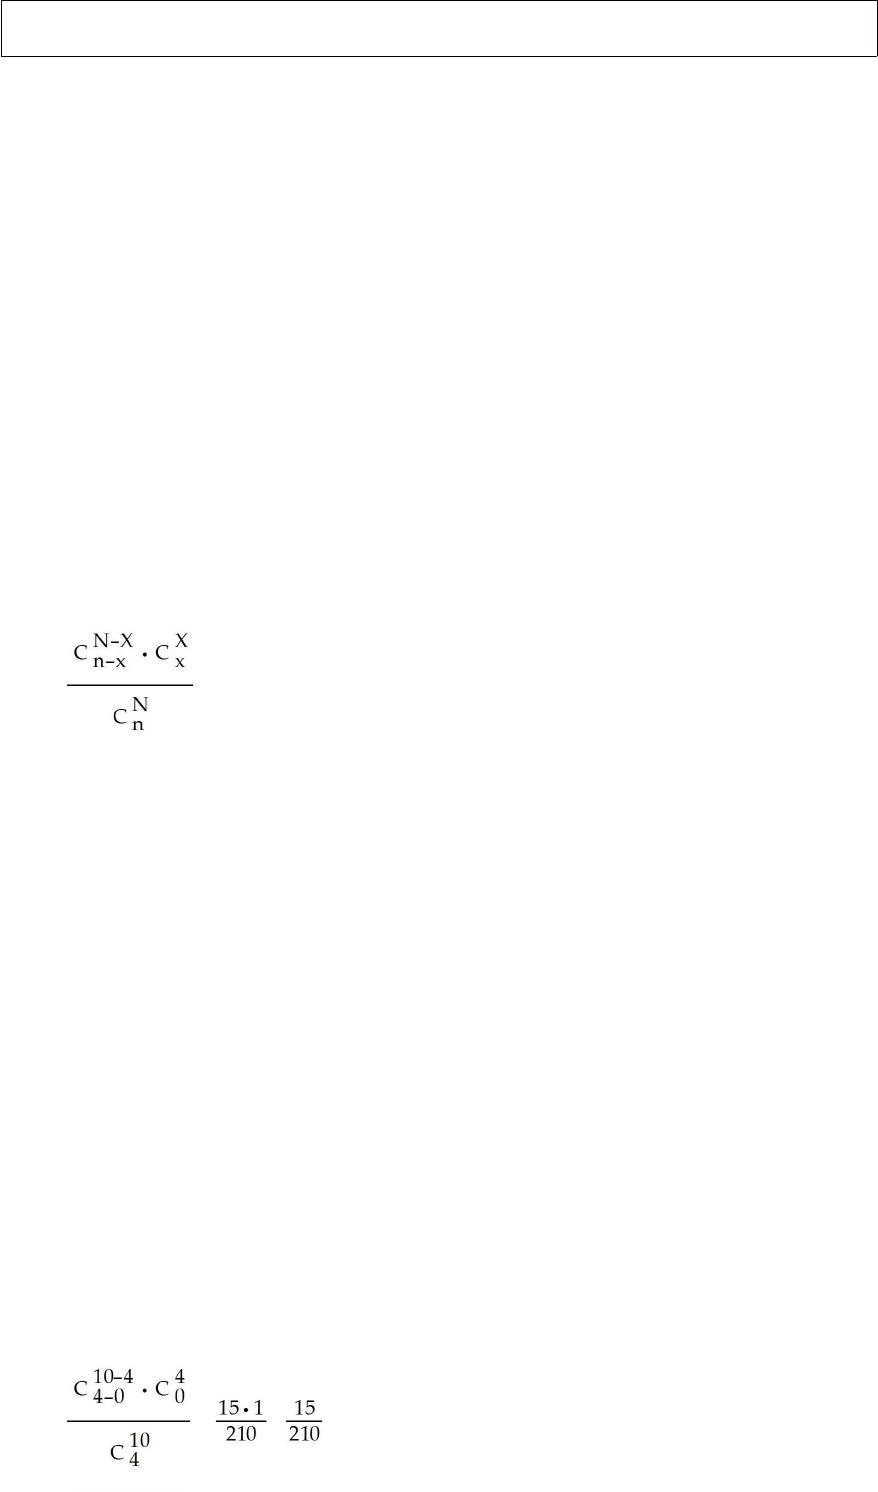
random? Do you believe that the females have a valid complaint in this situation?
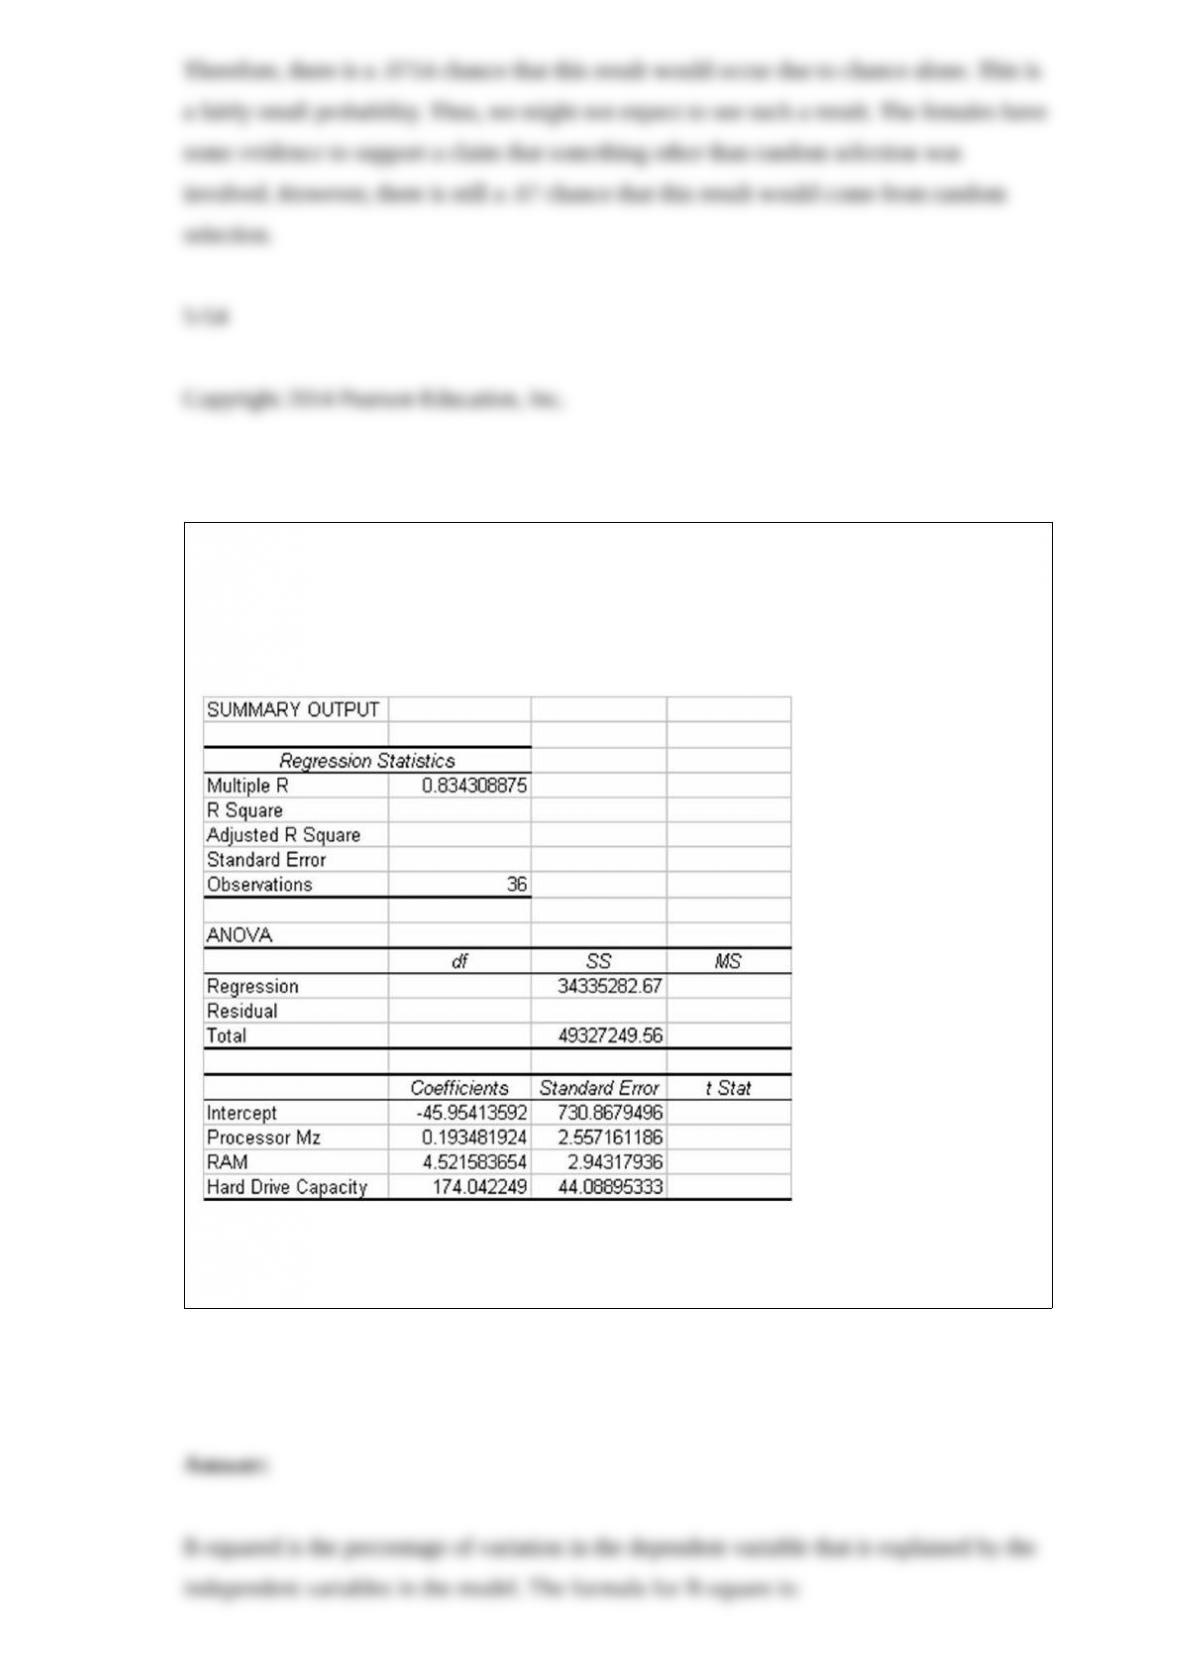
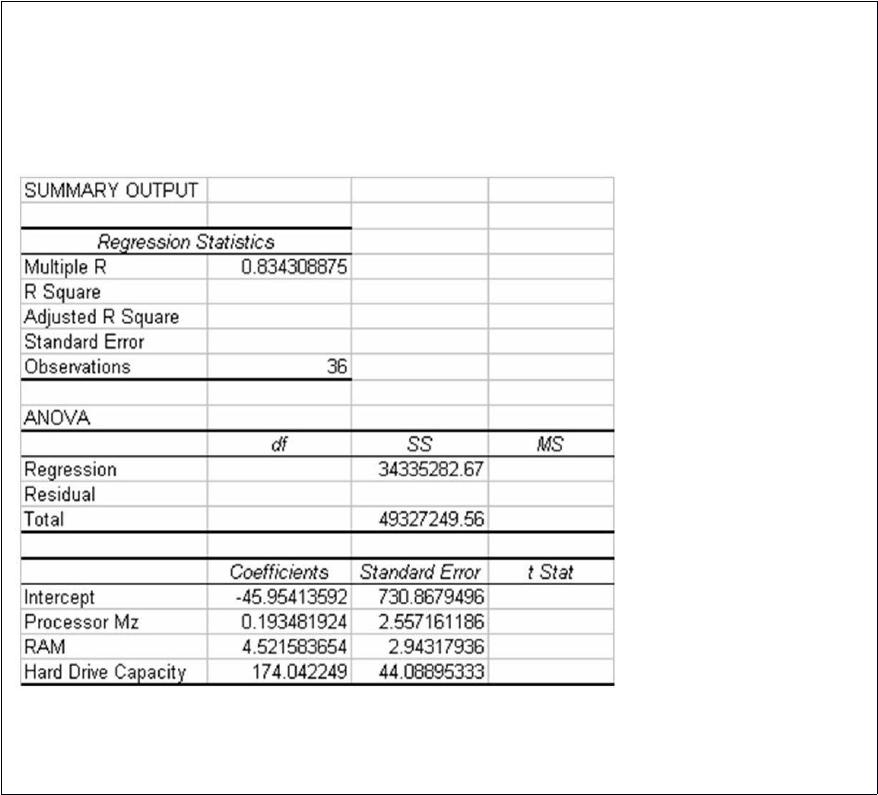
The following regression output is the result of a multiple regression application in
which we are interested in explaining the variation in retail price of personal computers
based on three independent variables, CPU speed, RAM, and hard drive capacity.
However, some of the regression output has been omitted.
Given this information and your knowledge of multiple regression, what is the adjusted
R-square value?
The Norton Industrial Company has 12 quarters of historical sales data and is interested
in forecasting sales for quarter 13. The following data are available:
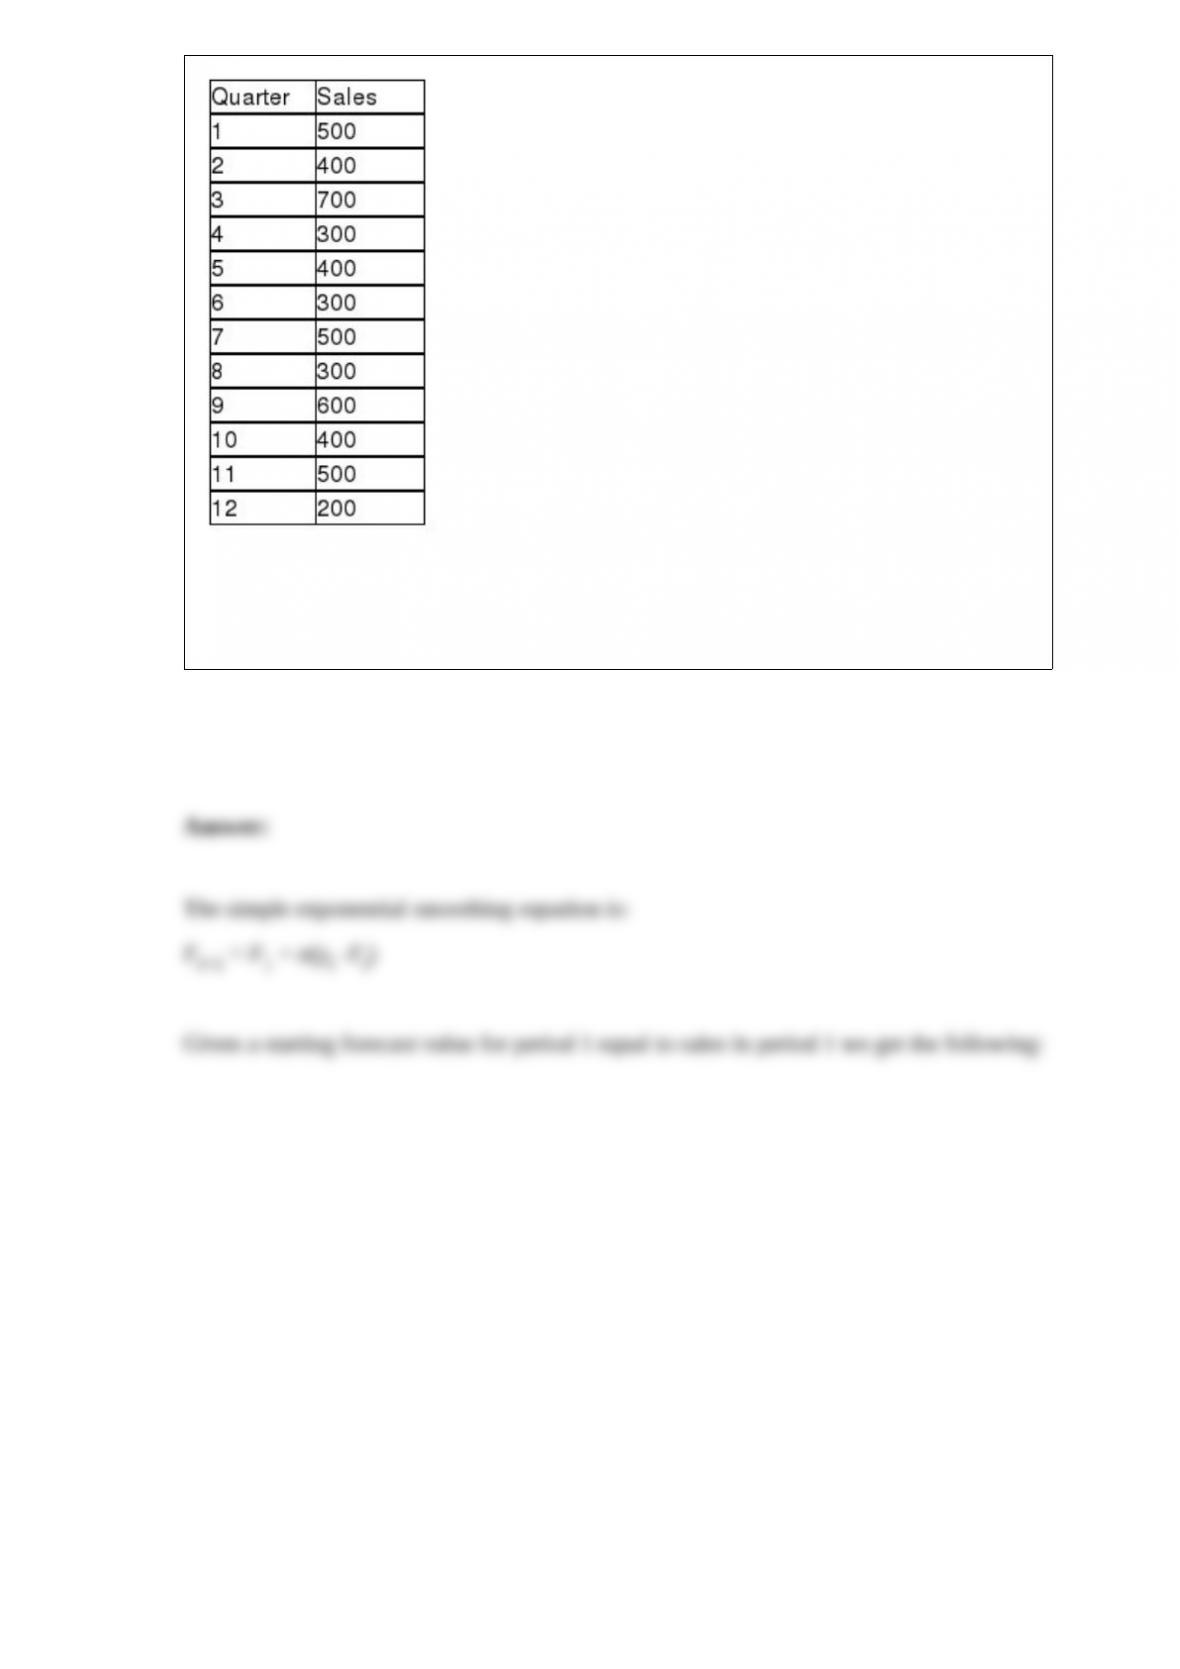
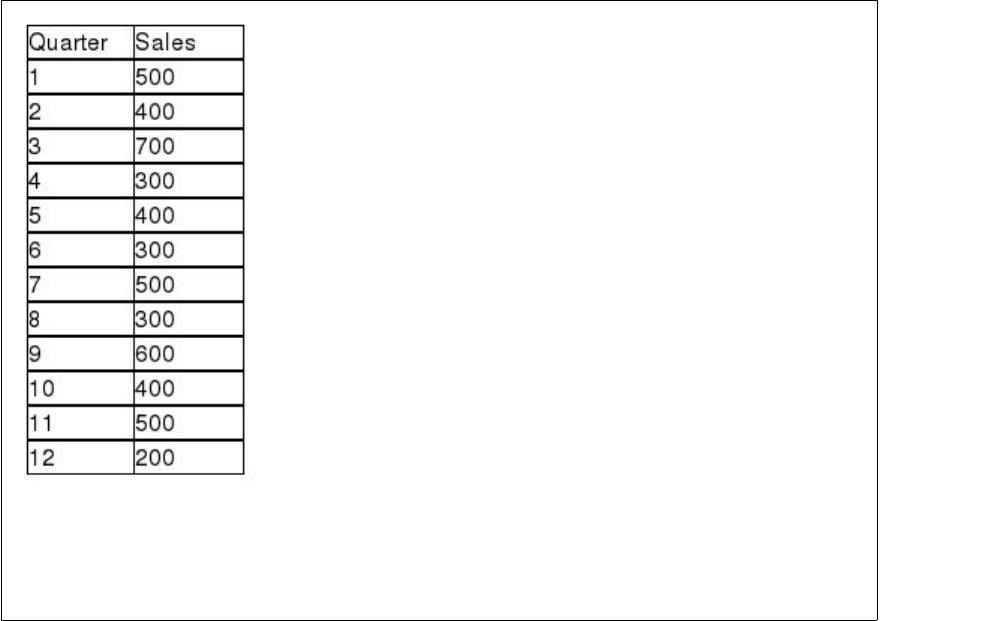
Based on this data, use simple exponential smoothing with a smoothing constant value
equal to 0.10 and a starting forecast value equal to the sales in quarter 1 to forecast sales
for period 13.

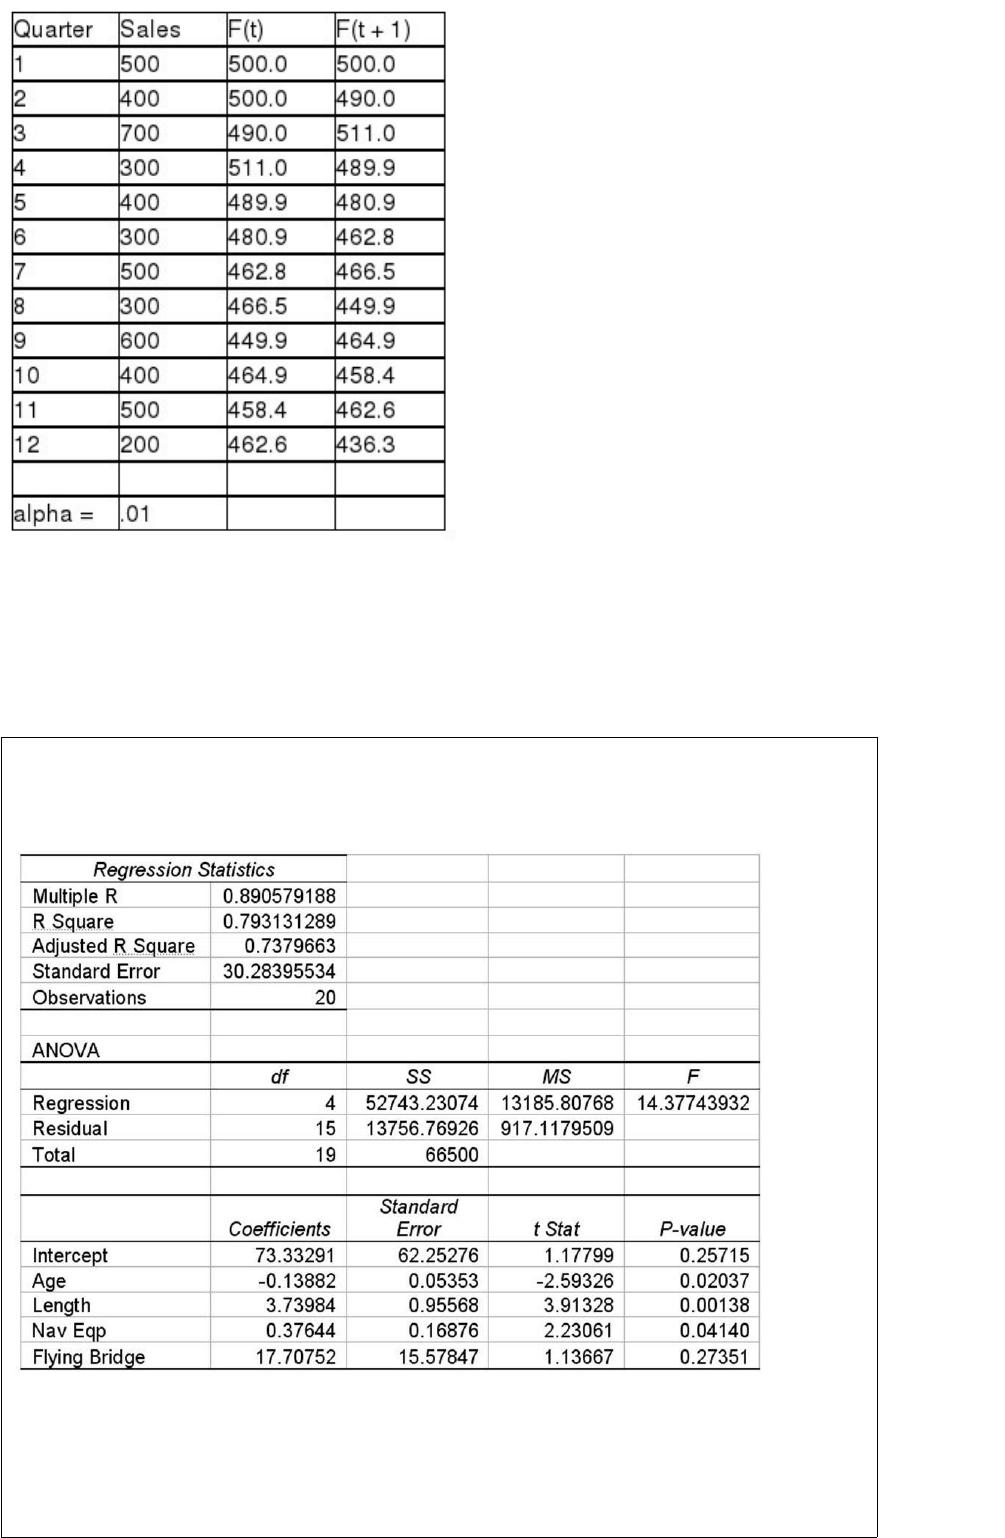
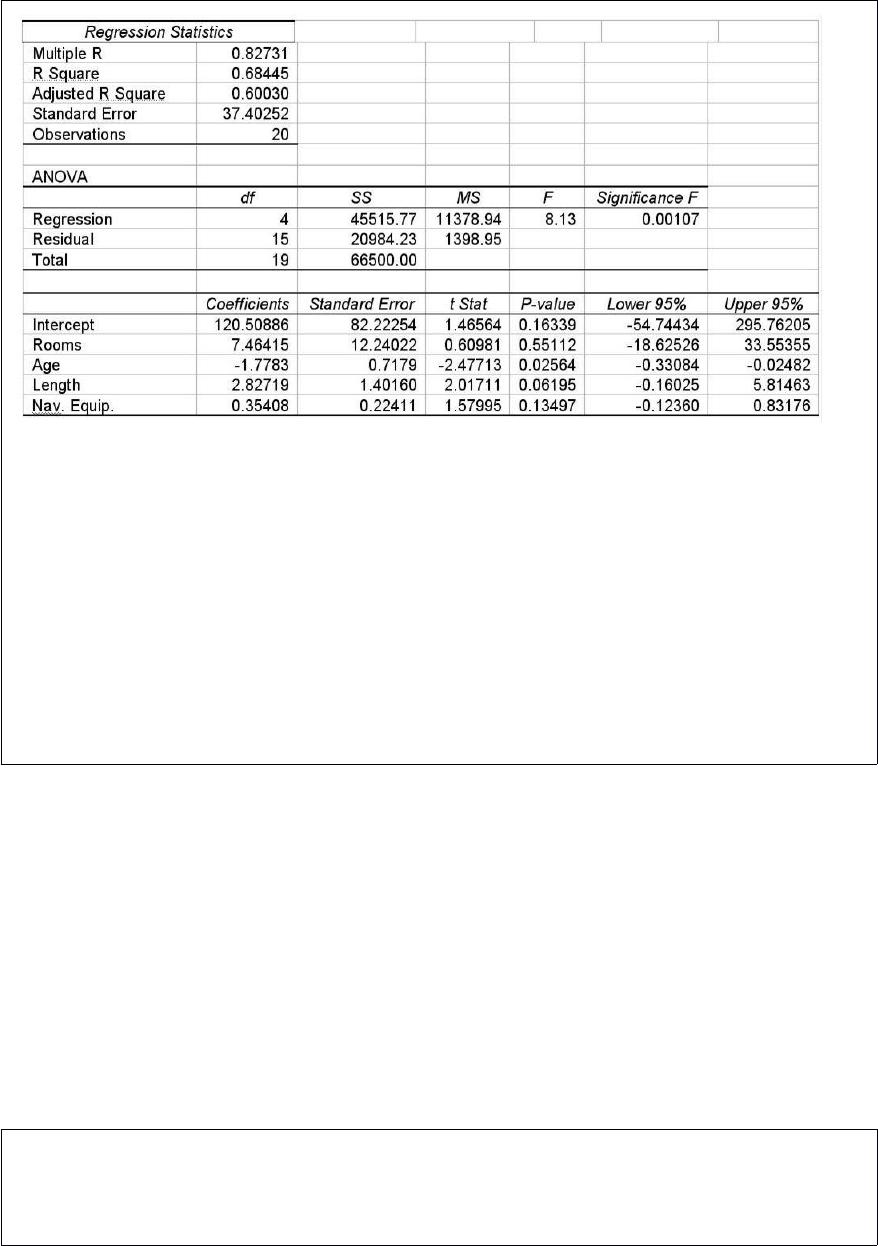
The following multiple regression was conducted to attempt to predict the price of
yachts based on the independent variables shown.
Given this information and your knowledge of multiple regression, determine which, if
any, of the four independent variables are statistically significant in explaining the
variation in the dependent variable. Use a 0.05 level of significance and use the p-value
method.

Suppose a population is normally distributed with a mean 100 and a standard deviation
of 15. When a sample of size n = 36 is collected a sampling distribution is created.
Explain which is larger: the probability of a value randomly selected from the
population being larger than 120, or the probability of a sample mean being larger than
120.
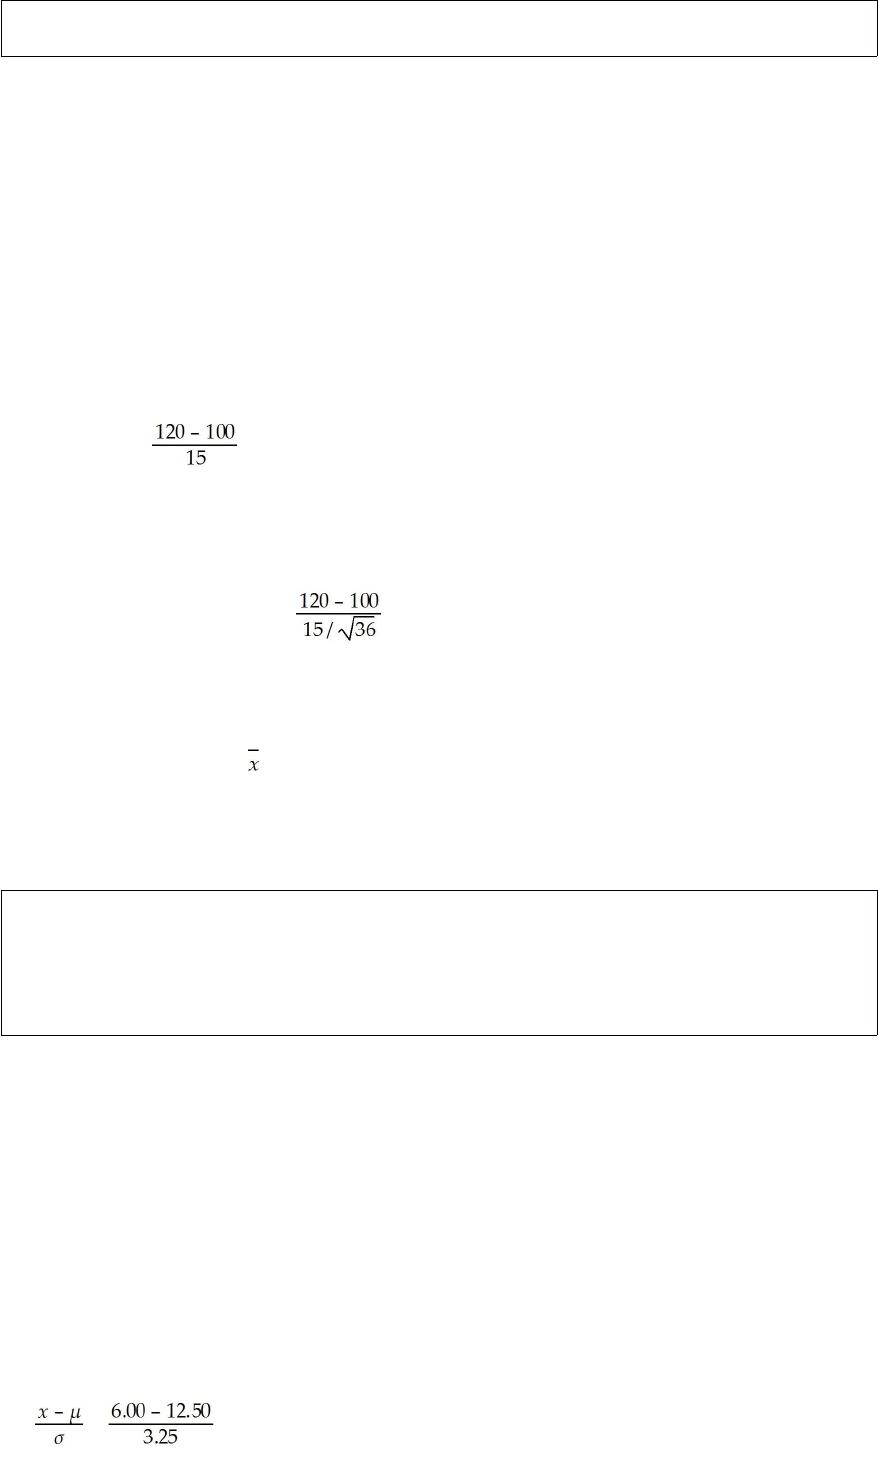
The fares received by taxi drivers working for the City Taxi line are normally
distributed with a mean of $12.50 and a standard deviation of $3.25. Suppose a driver
has four consecutive fares that are less than $6.00. What is the probability of this
happening?

Statistical Process Control charts are used to detect whether a process remains in
control or whether it has gone out of control. Explain how the SPC signals work.

Explain what information can be conveyed by a frequency histogram.
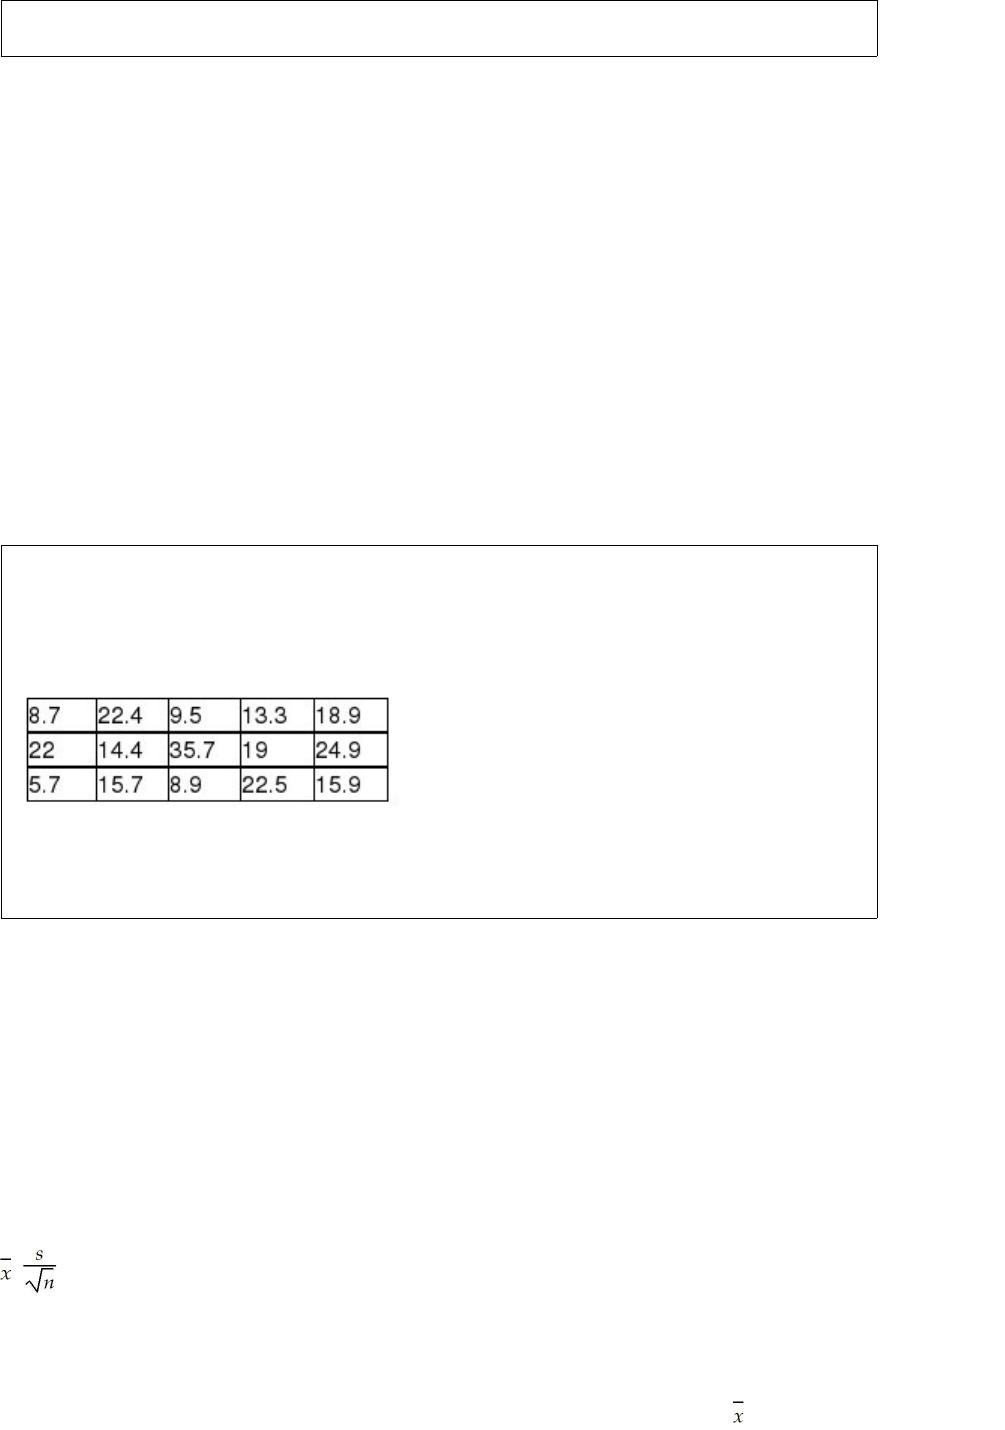
One of the major oil products companies conducted a study recently to estimate the
mean gallons of gasoline purchased by customers per visit to a gasoline station. To do
this, a random sample of customers was selected with the following data being recorded
that show the gallons of gasoline purchased.
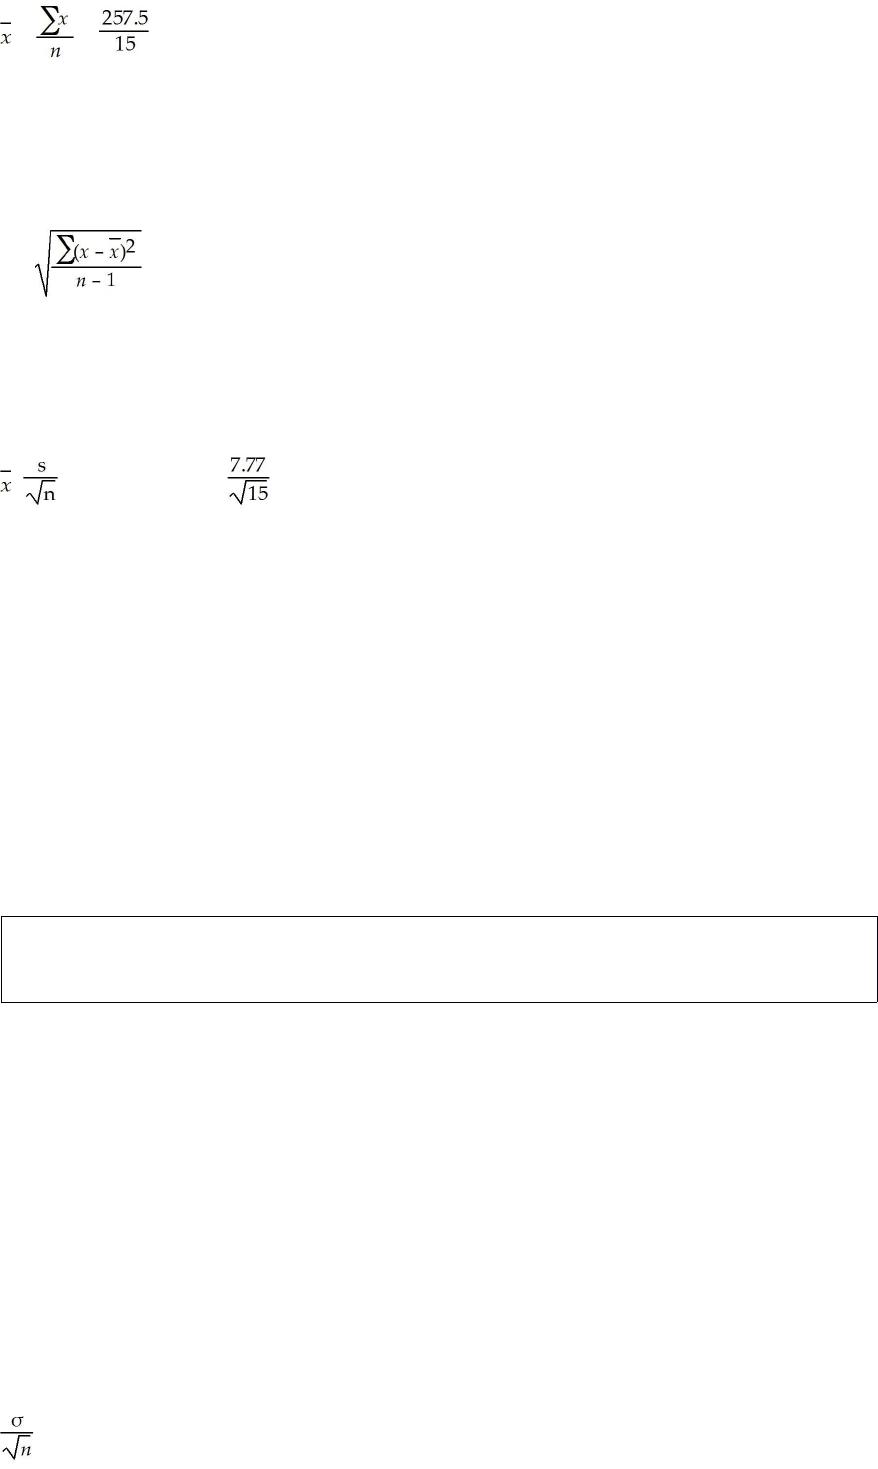
Based on these sample data, construct and interpret a 95 percent confidence interval
estimate for the population mean.
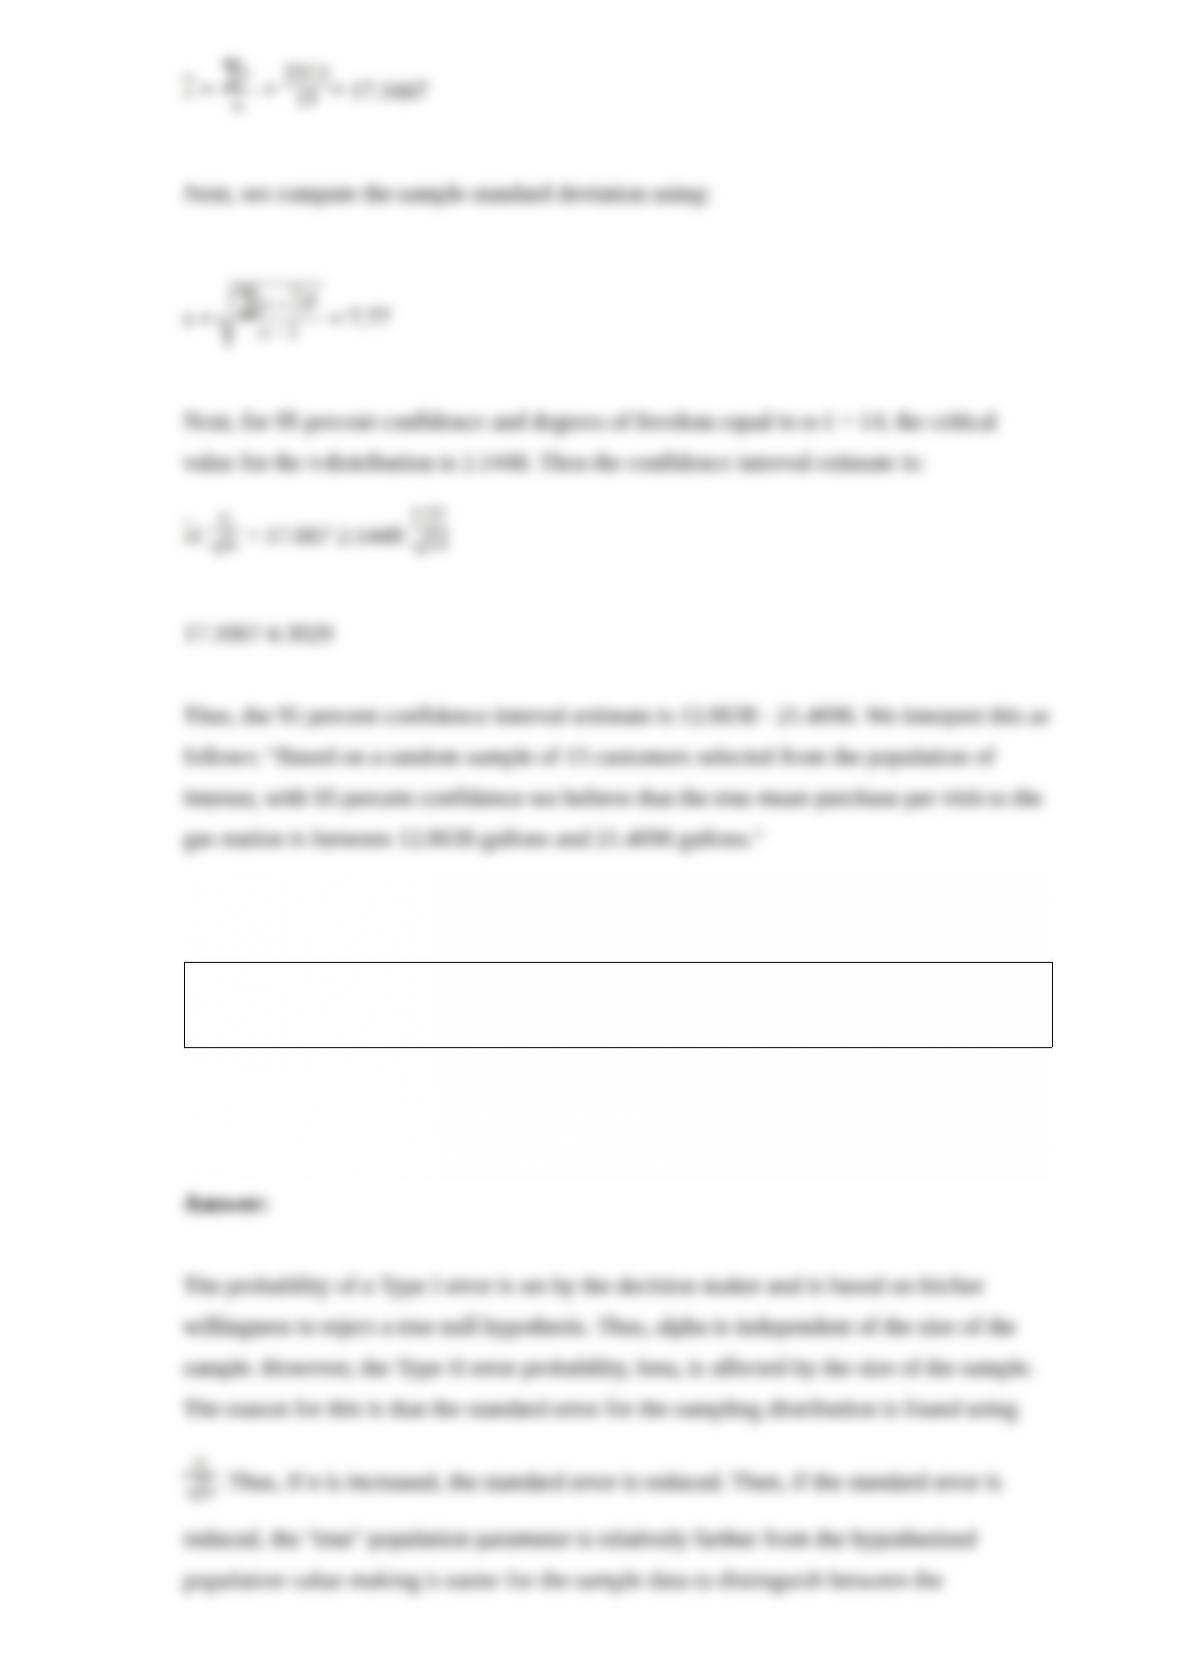
Explain why an increase in sample size will reduce the probability of a Type II error but
will not impact the probability of a Type I error.

Explain the difference between forward stepwise regression (standard stepwise),
forward selection, and all possible subsets regression approaches.

Explain what is meant by partitioning the sum of squares in a one-way analysis of
variance application.
Explain what is meant by percentiles and quartiles.


The Department of Weights and Measures in a southern state has the responsibility for
making sure that all commercial weighing and measuring devices are working properly.
For example, when a gasoline pump indicates that 1 gallon has been pumped, it is
expected that 1 gallon of gasoline will actually have been pumped. The problem is that
there is variation in the filling process. The state’s standards call for the mean amount of
gasoline to be 1.0 gallon with a standard deviation not to exceed 0.010 gallons.
Recently, the department came to a gasoline station and filled 10 cans until the pump
read 1.0 gallon. It then measured precisely the amount of gasoline in each can. The
following data were recorded:
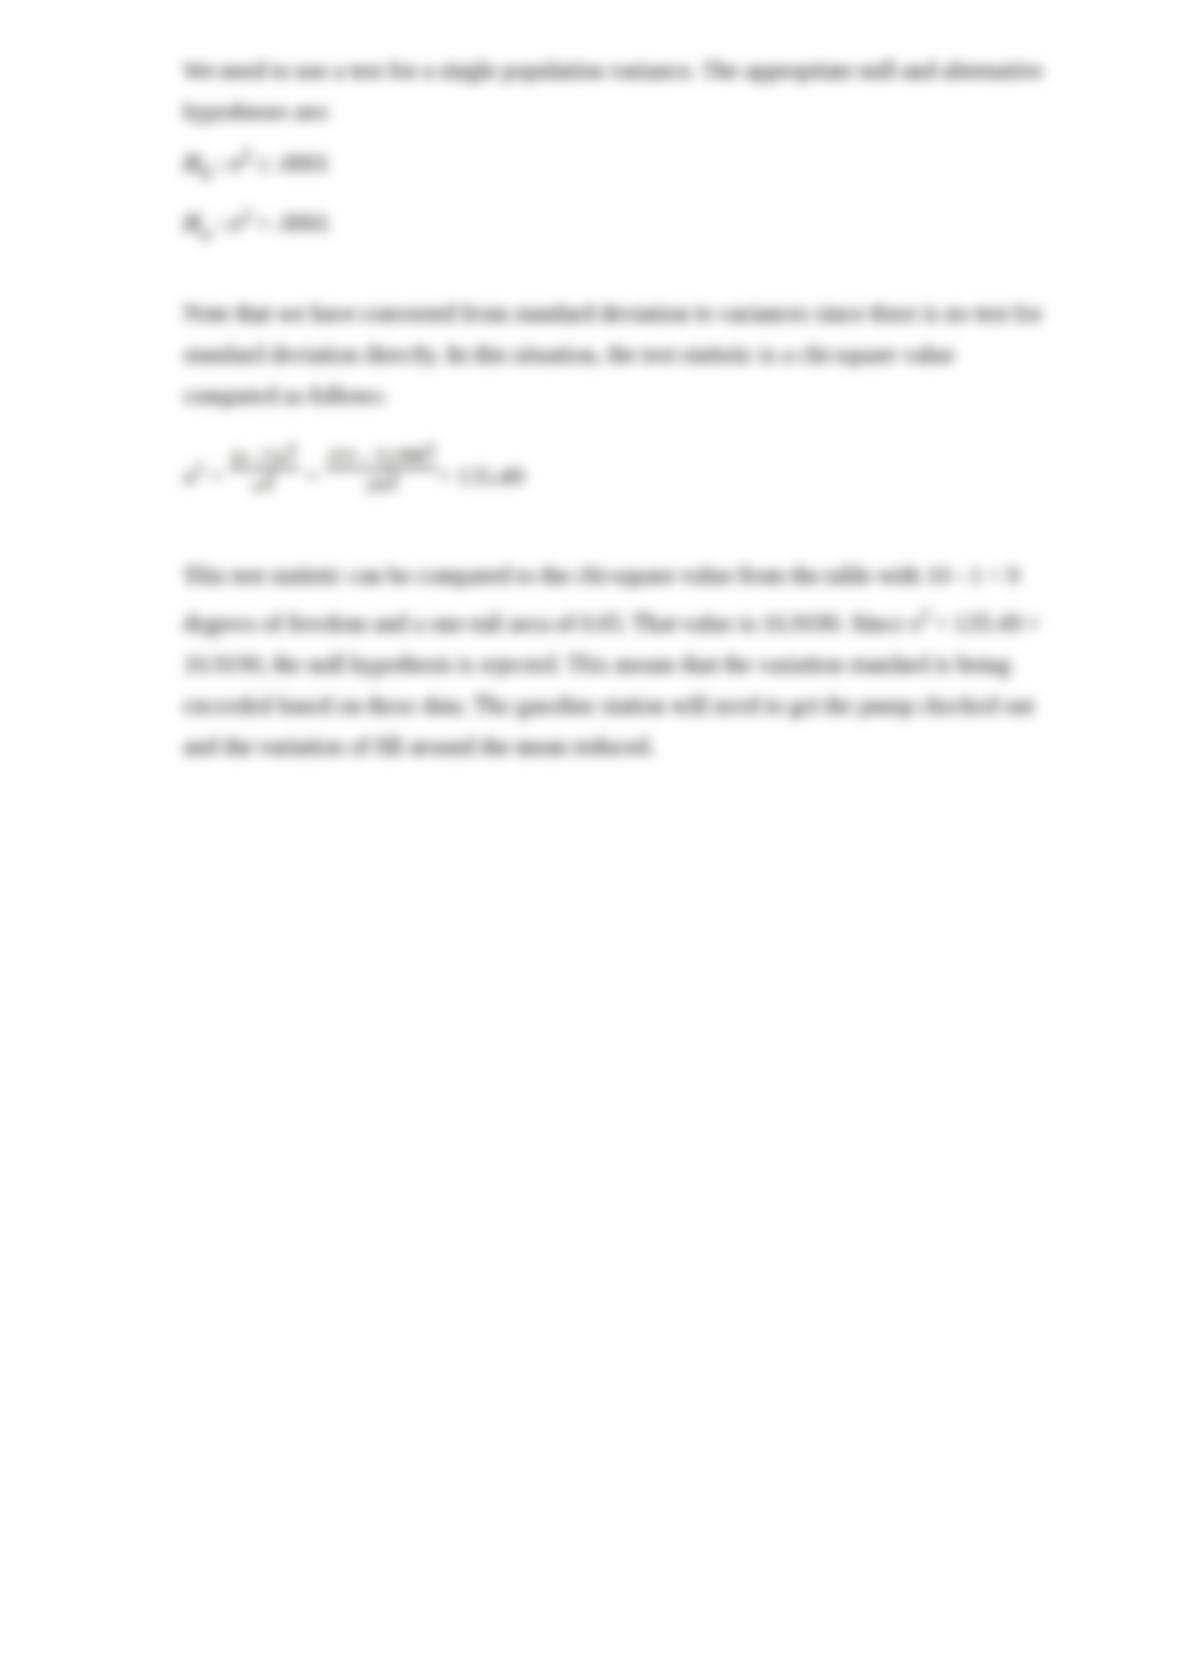
Based on these data, what should the Department of Weights and Measures conclude if
it wishes to test whether the standard deviation exceeds 0.010 gallons or not, using a
0.05 level of significance?