When customers return a product to a store and the store asks the customer to indicate
the reason that the merchandise was returned, the resulting data are quantitative since
multiple people will be providing the data.
Which of the following statements is true?
A) Random samples are easier to select than nonstatistical samples.
B) Nonstatistical samples can provide useful data.
C) Stratified random sampling involves breaking the population down into geographic
subgroups.
D) Systematic sampling is an example of nonstatistical sampling.
Which of the following in not an out of control signal for an x-bar chart?
A) One or more points outside the control limits
B) Seven or more consecutive points that all fall on the same side of the center line
C) Six or more consecutive points moving in the same direction (an upward or
downward trend)
D) Fourteen points in a row, alternating up and down
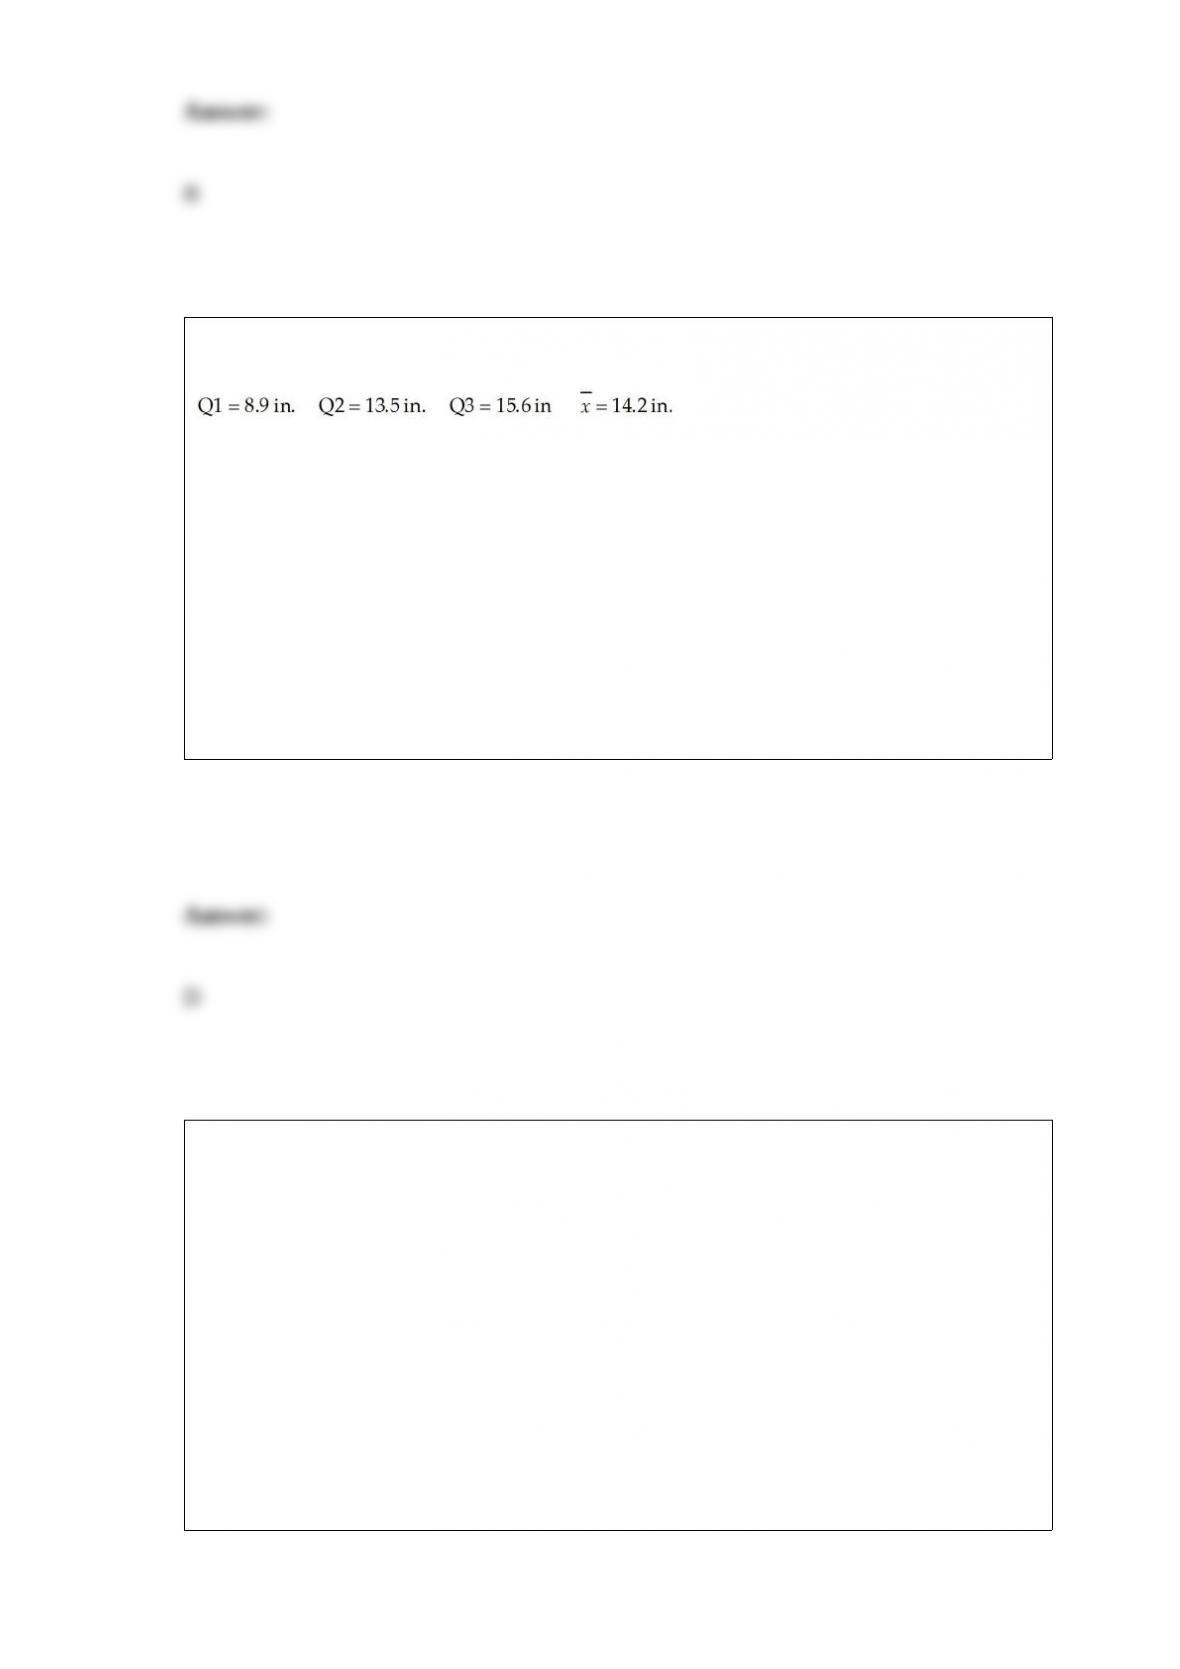
At a sawmill in Oregon, a process improvement team measured the diameters for a
sample of 1,500 logs. The following summary statistics were computed:
Given this information, in a box and whisker plot, which of these four values will NOT
appear?
A) 8.9 in.
B) 13.5 in.
C) 15.6 in.
D) 14.2 in.
Two airlines are being compared with respect to the time it takes them to turn a plane
around from the time it lands until it takes off again. The study is interested in
determining whether there is a difference in the variability between the two airlines.
They wish to conduct the hypothesis test using an alpha = 0.02. If random samples of
20 flights are selected from each airline, what is the appropriate F critical value?
A) 3.027
B) 2.938
C) 2.168
D) 2.124
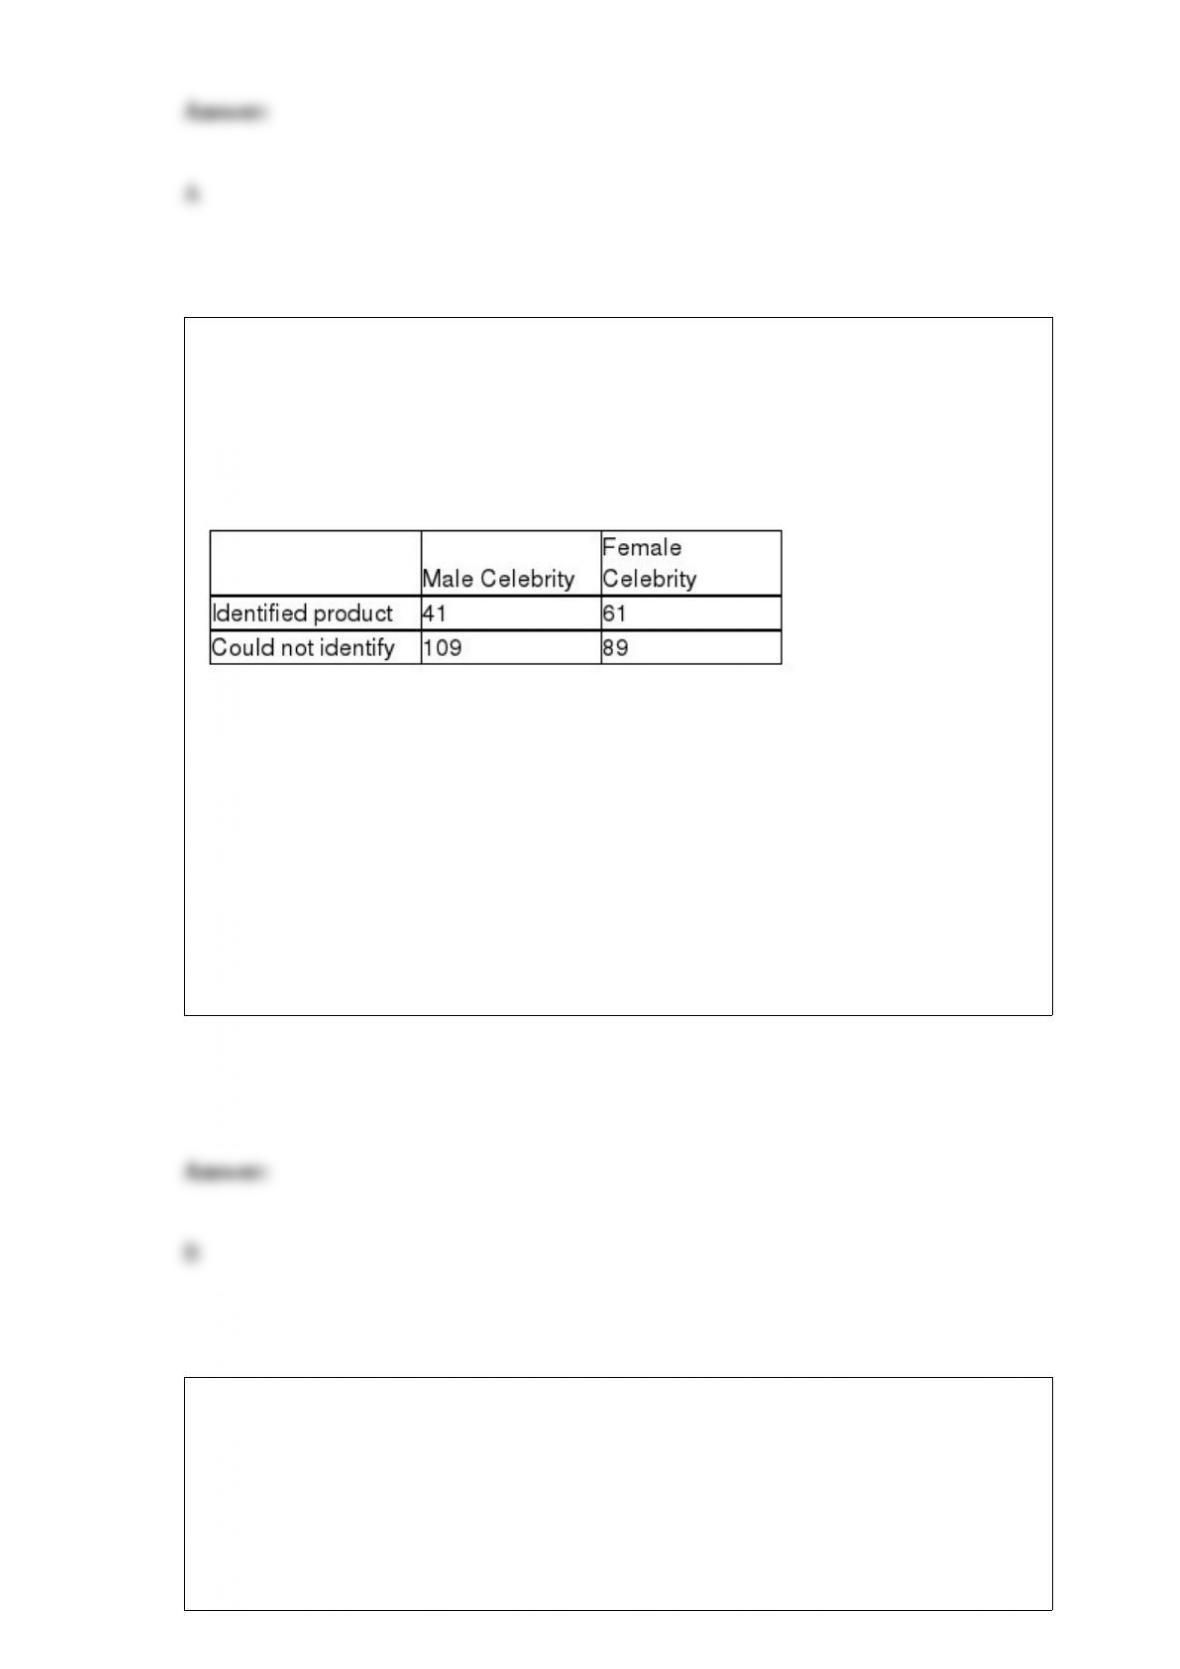
Many companies use well-known celebrities as spokespeople in their TV
advertisements. A study was conducted to determine whether brand awareness of
female TV viewers and the gender of the spokesperson are independent. Each in a
sample of 300 female TV viewers was asked to identify a product advertised by a
celebrity spokesperson. The gender of the spokesperson and whether or not the viewer
could identify the product was recorded. The numbers in each category are given below.
Referring to these sample data, if the appropriate hypothesis test is to be conducted
using a .05 level of significance, which of the following is correct critical value?
A) 9.4877
B) 3.8415
C) 1.96
D) 7.8147
If the variance of the contents of cans of orange juice is significantly more than 0.003,
the manager has to order to stop the filling machine. A sample of 26 cans of orange
juice showed a standard deviation of 0.06 ounce. Based on the sample and at the 0.05
level of significance, the filling machine should be
A) stopped.
B) kept going.
C) upgraded.
D) downgraded.
The main process change that can be detected with a process control chart is:
A) the process average has shifted up or down from normal.
B) the process average is trending up or down from normal.
C) the process is behaving in such a manner that the existing variation is not random in
nature.
D) All of the above
A recent study of 15 shoppers showed that the correlation between the time spent in the
store and the dollars spent was 0.235. Using a significance level equal to 0.05, which of
the following is the appropriate null hypothesis to test whether the population
correlation is zero?
A) H0: r = 0.0
B) H0 : ρ = 0.0
C) H0 : μ = 0.0
D) H0 : ρ ≠ 0
The Internal Revenue Service (IRS) is interested in estimating the mean amount of
money spent on outside tax service by income tax filers filing as single on their
individual form. To do this, they have selected a random sample of n = 16 people from
this population and surveyed them to determine the sample mean and sample standard
deviation. The following information was observed:
Given this information, what is the 95 percent confidence interval for the mean dollars
spent on outside tax assistance by taxpayers who file as single?
A) Approximately $72.19 – $105.01
B) About $22.97 – $154.23
C) Approximately $80.90 – $96.30
D) About $28.25 – $148.95
Flavors of ice cream (chocolate, vanilla, strawberry, etc.) are an example of nominal
data.

A random variable is normally distributed with a mean of 25 and a standard deviation of
5. If an observation is randomly selected from the distribution, determine two values of
which the smallest has 25% of the values below it and the largest has 25% of the values
above it.
A) 18.85 and 27.94
B) 19.31 and 21.12
C) 16.23 and 18.82
D) 21.65 and 28.35
For a standardized normal distribution, determine a value, say z0, so that P(-z0 ≤ z < 0)
= 0.45.
A) 1.84
B) 1.645
C) 1.96
D) 1.33
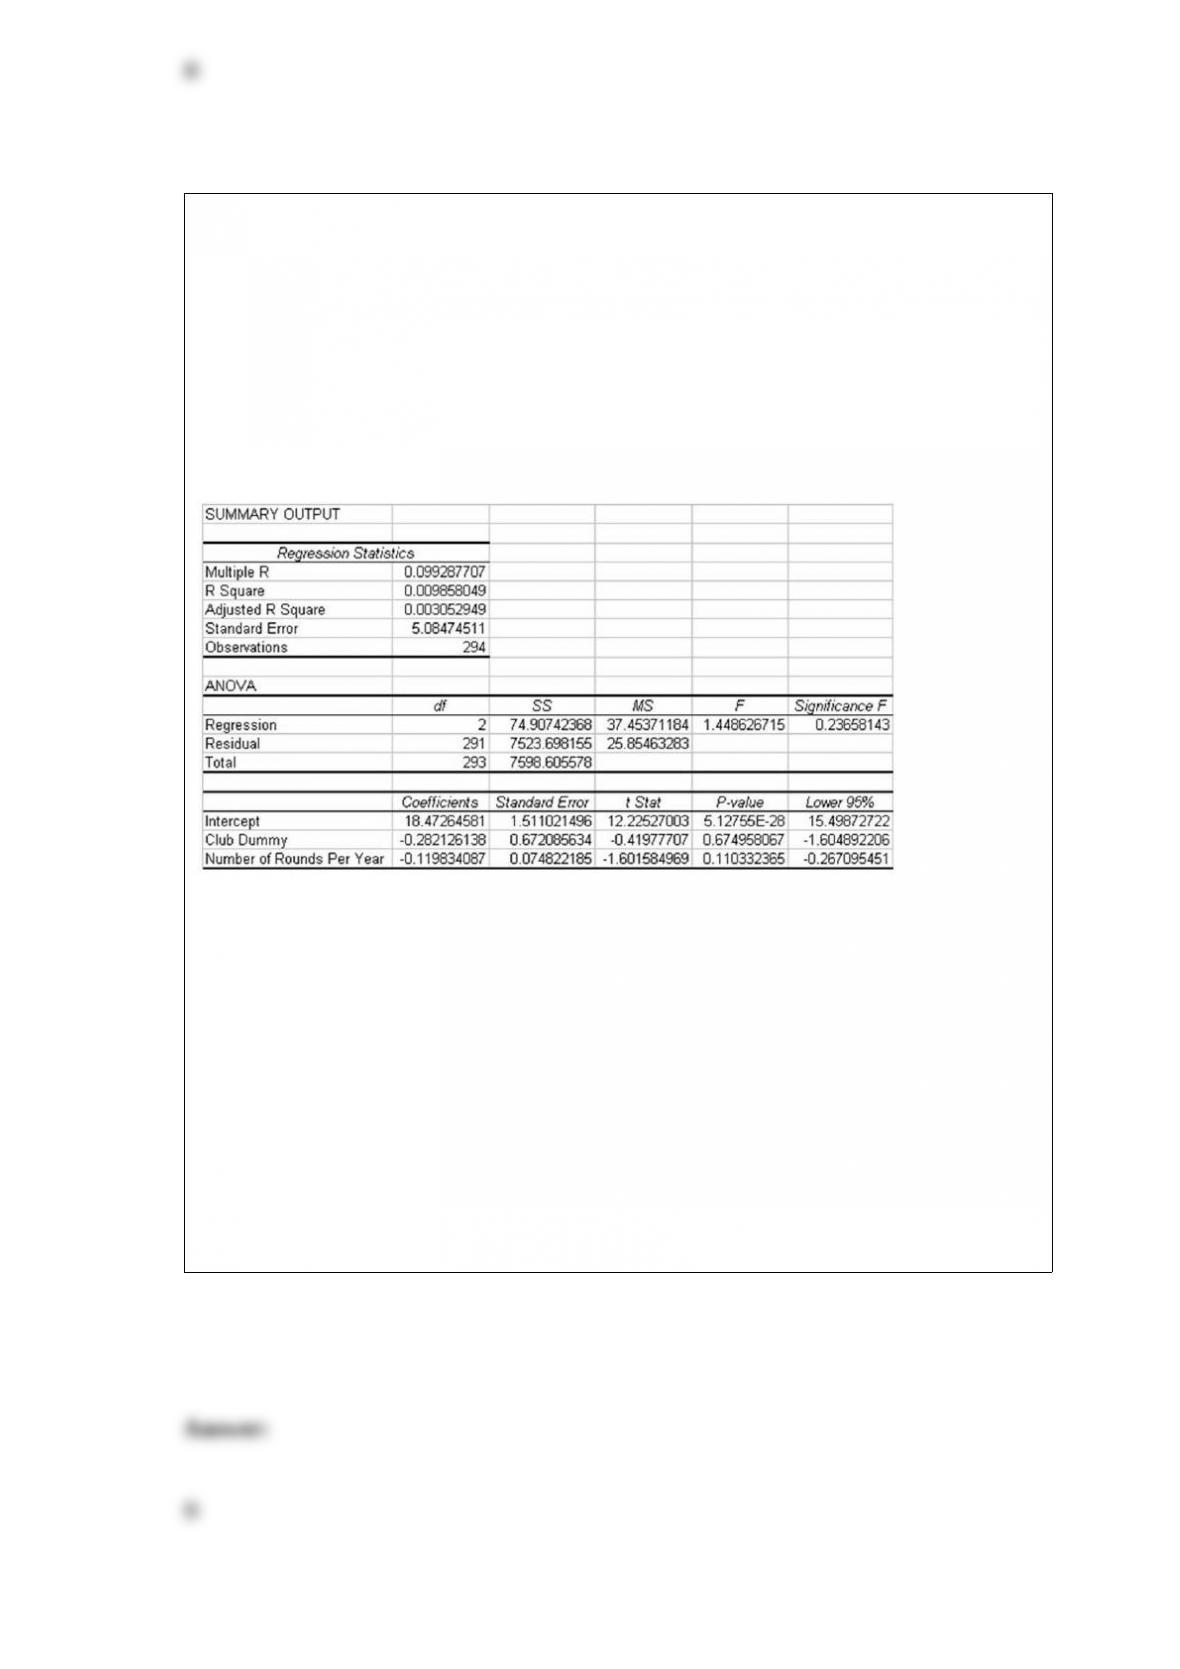
Golf handicaps are used to allow players of differing abilities to play against one
another in a fair match. Recently a sample of golfers was selected in an effort to
develop a model for explaining the difference in handicaps. One independent variable
of interest is the number of rounds played per year. Another is whether or not the player
is using an “original” name brand club or a copy. In recent years, a number of smaller
golf club manufacturers have attempted to copy major golf club designs and sell
“copies” of original clubs such as the Big Bertha by Calloway. The resulting regression
analysis containing both Rounds Played and a Dummy variable for Club Used is shown
as follows:
Given this information, which of the following statements is not correct?
A) The overall regression model is insignificant at the alpha = .05 level.
B) The Club Dummy variable is statistically significant in the model meaning that
knowing that a player used an original club or copy is of value in knowing the player’s
handicap.
C) The two independent variables do not explain a statistically significant portion of the
variation in golf handicap.
D) All of the above are not correct.
A company that fills soft drinks into bottles has established an -chart and an R-chart to
monitor the average fill level in the bottles. To do this, the company has taken a series
of samples of size n = 4 bottles. The overall average fill is 12.03 ounces. The average
range for the subgroups has been .06 ounces. Suppose, after developing the control
chart, a subgroup of size 4 yields a sample mean of 12.09 ounces and a range of .08,
which of the following statements is true?
A) The process is in control on both the -chart and the R-chart.
B) The process is out of control on the R-chart but in control on the -chart.
C) The process is out of control on the -chart but in control on the R-chart.
D) The process is out of control on both the -chart and the R-chart.
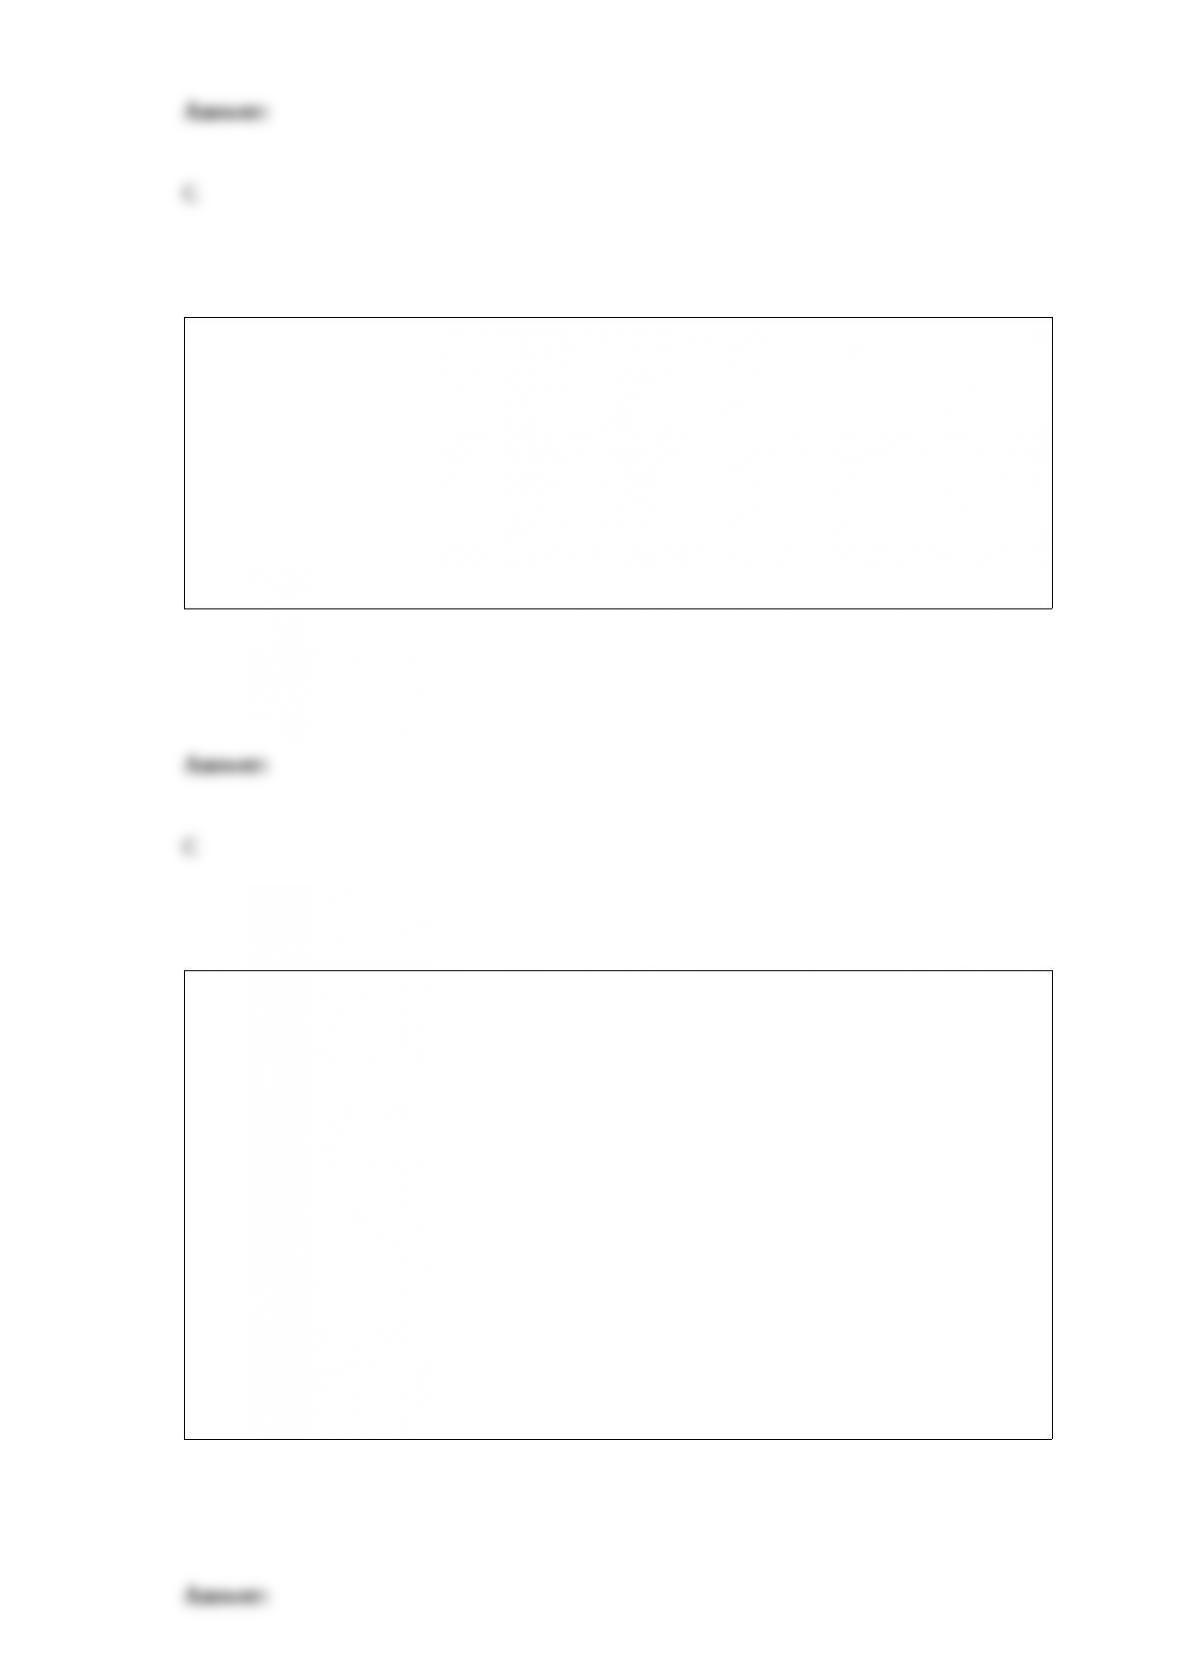
The following probability distribution has been assessed for the number of accidents
that occur in a Midwestern city each day:
This distribution is an example of:
A) a uniform distribution.
B) a continuous probability distribution.
C) a discrete probability distribution.
D) an expected value distribution.
A bar chart possesses which of the following?
A) Capability of displaying the distribution for a quantitative variable
B) The option of displaying the data in scatter diagram form
C) The option for displaying two or more variables on the same chart
D) An easy method for displaying the general shape of a continuous variable
Hubble Construction Company has submitted a bid on a state government project that is
to be funded by the federal government’s stimulus money in Arizona. The price of the
bid was predetermined in the bid specifications. The contract is to be awarded on the
basis of a blind drawing from those who have bid. Five other companies have also
submitted bids.
What is the probability of the Hubble Construction Company winning the bid?
A) 0.2778
B) 0.1667
C) 0.6944
D) 0.0278
The Mann-Whitney U test assumes that the 2 samples are:
A) equal in size.
B) independent and random.
C) matched or paired.
D) normally distributed.
Suppose a survey is taken of two groups of people where each person is asked a yes/no
question and the proportion of people who answer yes is calculated for each group.
Which of the following is true about a hypothesis test of the difference in the two
proportions?
A) Normality can be assumed if the sample size for each population is at least 30.
B) The t-distribution should be used if the standard deviations are unknown.
C) The standard deviation must be assumed equal.
D) Normality can be assumed if, in each group, at least 5 people say yes, and at 5
people say no.
Harrison Water Sports has three retail outlets: Seattle, Portland, and Phoenix. The
Seattle store does 50 percent of the total sales in a year, while the Portland store does 35
percent of the total sales. Further analysis indicates that of the sales in Seattle, 20
percent are in boat accessories. The percentage of boat accessories at the Portland store
is 30 and the percentage at the Phoenix store is 25. Overall, the probability that a sale
by Harrison Water Sports will be for a boat accessory is:
A) 0.105
B) 0.2425
C) 0.75
D) None of the above
A study has recently been conducted by a major computer magazine publisher in which
the objective was to develop a multiple regression model to explain the variation in
price of personal computers. Three quantitative independent variables were used along
with one qualitative variable. The qualitative variable was coded 1 if the computer
included a monitor, 0 otherwise. The following computer printout shows the final
output.
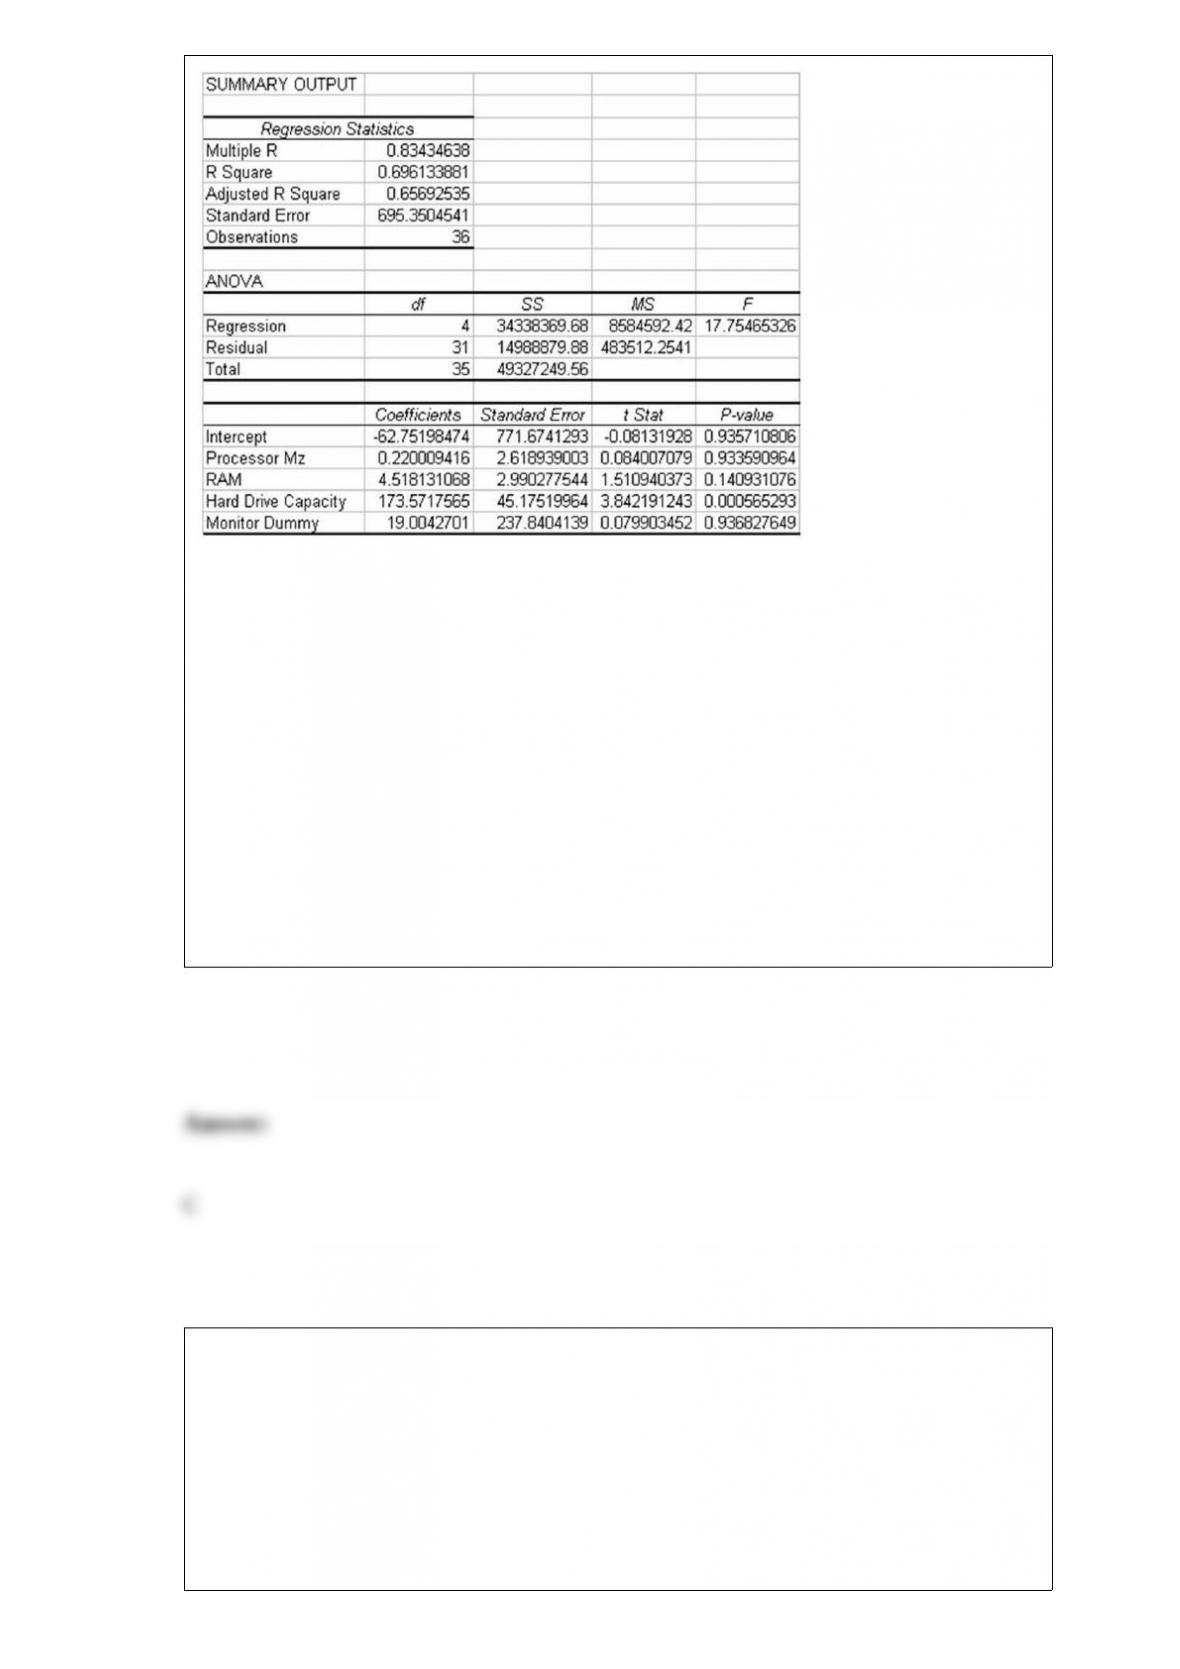
Based on this information, and with a 0.05 level of significance, which of the following
conclusions can be justified?
A) Knowing whether the computer comes with a monitor or not is a significant factor in
explaining the variation in price of the computer.
B) There are substantial multicollinearity effects in this regression model.
C) The only significant variable in the model at the .05 level of significance is Hard
Drive Capacity.
D) Removing the Monitor dummy variable would reduce the standard error of the
estimate considerably.
Past experience indicates that the variance in the time it takes for a “fast lube” operation
to actually complete the lube and oil change for customers is 9.00 minutes. The
manager wishes to estimate the mean time with 99 percent confidence and a margin of
error of 0.50 minutes. Given this, what must the sample size be?
A) n = 239
B) n = 2149
C) n = 139
D) n = 1245
A survey of 499 women for the American Orthopedic Foot and Ankle Society revealed
that 38% wear flats to work.
Suppose the society also wishes to estimate the proportion of women who wear athletic
shoes to work with a margin of error of 0.01 with 95% confidence. Determine the
sample size required.
A) 7241
B) 9604
C) 10021
D) 9715