Unlock document.
This document is partially blurred.
Unlock all pages and 1 million more documents.
Get Access
The sampling distribution of is close to normal provided that n≥30.
Given the error we are willing to tolerate, the sample size is determined by the mean of
the population and the confidence level.
The lowest appropriate level of measurement for the median is ordinal.
The null hypothesis for a chi-square test of independence is that the two variables are
not related.

The area under the standard normal distribution between 0 and 2 is twice the area
between 0 and 1.
The number of visitors to a website each day is an example of a discrete random
variable
When the error terms of a regression forecasting model are correlated the problem of
autocorrelation occurs.

In a standard normal distribution, if the area under curve to the right of a z-value is
0.10, then the area to the left of the same z-value is -0.10.
A stationary time-series data has only trend but no cyclical or seasonal effects.
Suppose 90% of students in some specific college have a computer at home and a
sample of 40 students is taken. The probability that more than 30 of those in the sample
have a computer at home can be approximated using the normal approximation.
The F value for treatment will always increase if we include a blocking effect.

For grouped data, the midpoint of each class interval is used to represent all the values
in a class interval.
In estimating the sample size necessary to estimate a population mean, the error of
estimation, E, is equal to the difference between the sample mean and the sample
standard deviation.
The value of R2always goes up when a nontrivial explanatory variable is added to a
regression model.

Bayes' rule is a rule to assign probabilities under the relative frequency method.
The difference between the actual y value and the predicted y value found using a
regression equation is called the residual.
With cluster sampling, there is homogeneity within a subgroup or stratum.

A chi-square goodness-of-fit test to determine if the observed frequencies in ten
categories are Poisson distributed has nine degrees of freedom.
Business researchers sometimes need to test for equality of population variance. The
hypothesis test about a population variance is performed using a chi-square test.
A cumulative frequency distribution provides a running total of the frequencies in the
classes.
In a decision-making scenario, if the decision maker knows which state of nature will
occur, the scenario is called decision-making under certainty.

In an experimental design, treatment variables are response variables.
To compute the variance of a discrete distribution, it is not necessary to know the mean
of the distribution.
A two-way table used for a test of independence is sometimes called a contingency
table.
In a decision-making scenario, if it is not known which of the states of nature will occur
and further if the probabilities of occurrence of the states are also unknown the scenario
is called decision-making under double risk.
In determining the interval estimates for a population variance using the sample
variance, it is appropriate to use the values from a chi-square distribution rather than a
t-distribution.
The mean square error (MSerr) is calculated by dividing the sum of squares error (SSerr)
by the number of error degrees of freedom (dferr).
Kurtosis is a measure of the association between two numerical variables.
In decision-making under risk, the expected monetary payoff of perfect information is
the weighted average of the best payoff for each state of nature (using the probability of
the state of nature as the weight).
An advantage of nonparametric statistics is that the computations on nonparametric
statistics are usually less complicated than those for parametric statistics, particularly
for small samples.
If the individual class frequency is divided by the total frequency, the result is the
median frequency.

The interaction between two independent variables can be examined by including a new
variable, which is the sum of the two independent variables, in the regression model.
When a statistic calculated from sample data is used to estimate a population parameter,
it is called a point estimate.
Average deviation is a common measure of the variability of data containing a set of
numbers.
The mean of the sample means is the same as the mean of the population
The process of constructing a mathematical model or function that can be used to
predict or determine one variable by another variable is called regression analysis.
James Desreumaux, VP of Human Resources of American First Banks (AFB), is
reviewing the employee training programs of AFB banks. His staff randomly selected
personnel files for 100 tellers in the Southeast Region and determined that their mean
training time was 25 hours. Assume that the population standard deviation is 5 hours.
The 88% confidence interval for the population mean of training times is ________.
a) 17.25 to 32.75
b) 24.23 to 25.78
c) 24.42 to 25.59
d) 19.15 to 30.85
e) 21.00 t0 32.00

Life tests performed on a sample of 13 batteries of a new model indicated: (1) an
average life of 75 months, and (2) a standard deviation of 5 months. Other battery
models, produced by similar processes, have normally distributed life spans. The 98%
confidence interval for the population mean life of the new model is _________.
a) 63.37 to 86.63
b) 61.60 to 88.41
c) 71.77 to 78.23
d) 71.28 to 78.72
e) 79.86 to 81.28
Lucy Baker is analyzing demographic characteristics of two television programs,
American Idol(population 1) and 60 Minutes (population 2). Previous studies indicate
no difference in the ages of the two audiences. (The mean age of each audience is the
same.) Her staff randomly selected 100 people from each audience, and reported the
following: 1= 43 years and 2= 45 years. Assume that 1= 5 and 2=
8. Assuming a two-tail test and a= .05, the observed zvalue is _________________.
a) -2.12
b) -2.25
c) -5.58
d) -15.38
e) -20.68
You are conducting a study on the blood glucose levels of 9 patients who are on strict
diets and exercise routines. To monitor the mean and range of the blood glucose levels
of your patients, you take a blood glucose reading every day for each patient for 20
days. The mean of the 9 sample means is 101.03, and the mean of the 9 standard
deviations is 29.243. The lower control limit for your chart is ________.
a) 70.85
b) 92.11
c) 73
d) 71.75
e) 60.5
Albert Abbasi, VP of Operations at Ingleside International Bank, is evaluating the
service level provided to walk-in customers. Accordingly, he plans a sample of waiting
times for walk-in customers. Albert instructs his staff to record the waiting times for the
first 45 walk-in customers arriving after the noon hour. Albert's sample is a ________.
a) simple random sample
b) systematic sample
c) convenience sample
d) stratified sample
e) cluster sample
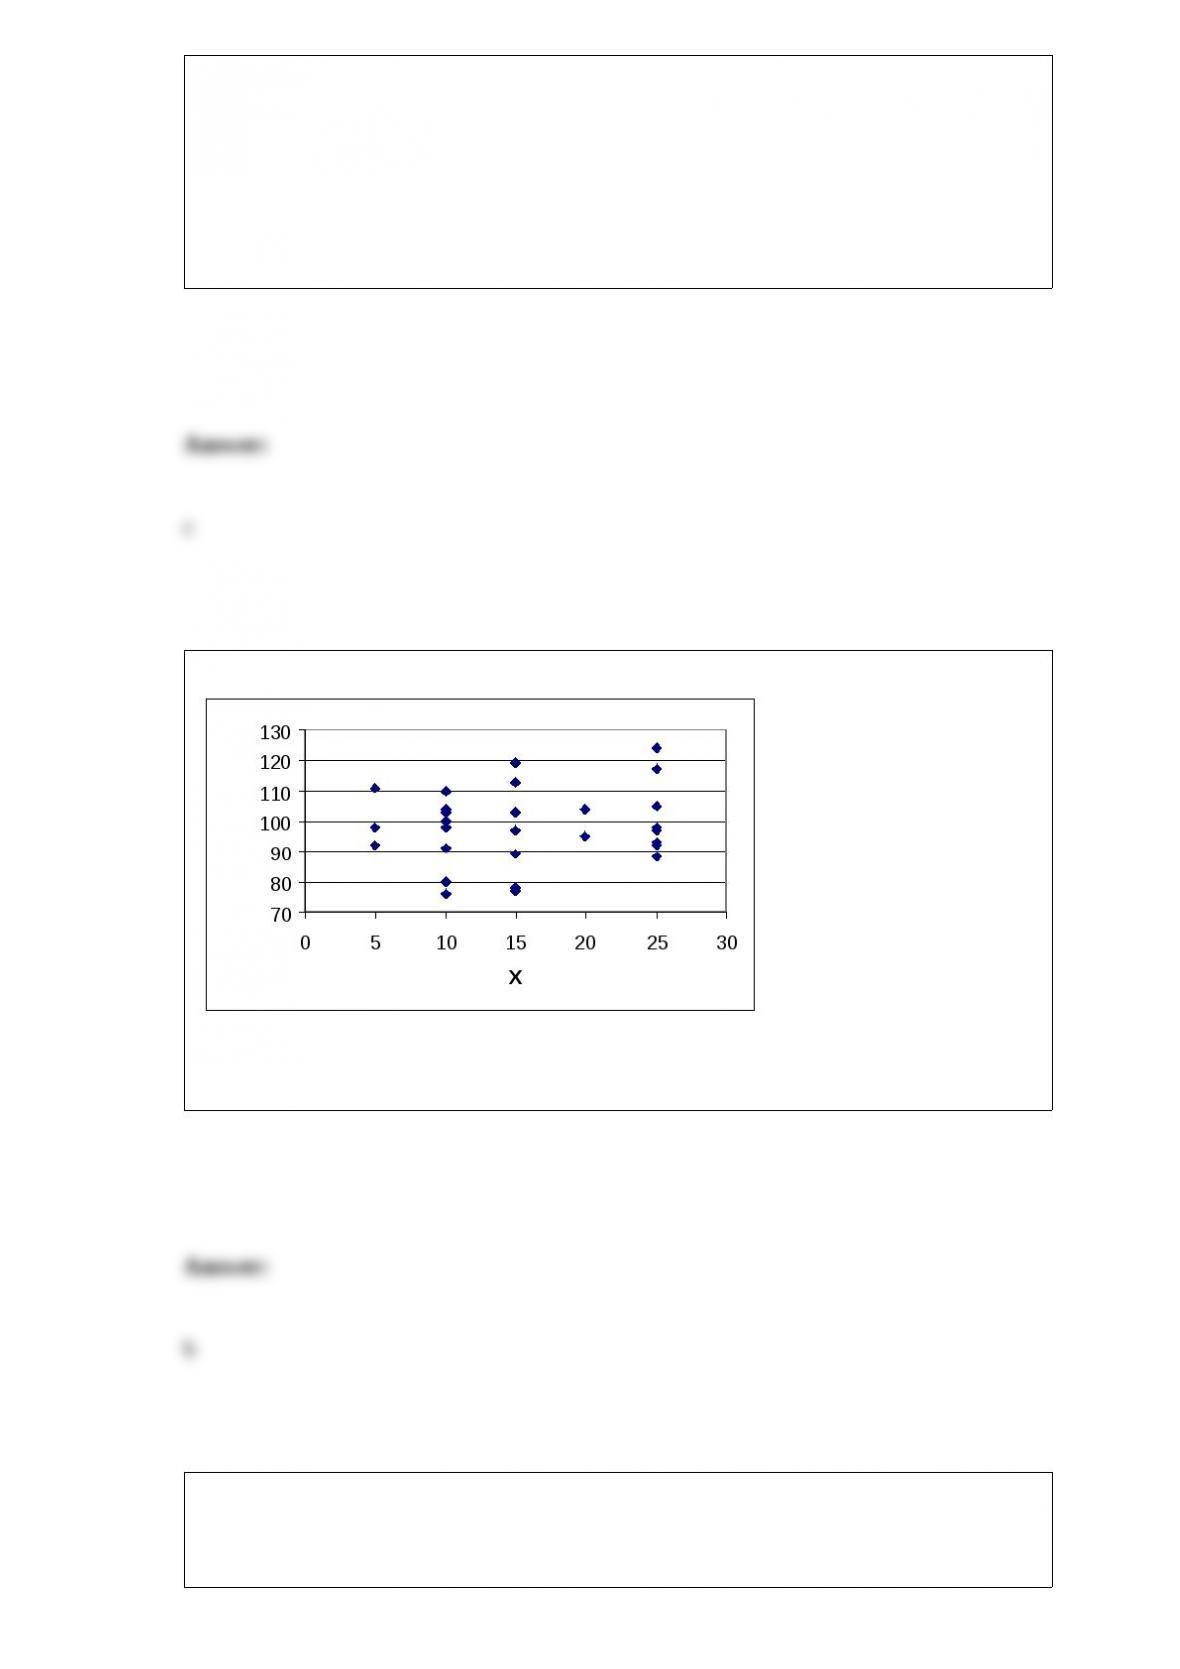
According to the following graphic, X and Y have _________.
a) strong negative
correlation
b) virtually no
correlation
c) strong positive
correlation
d) moderate
negative correlation
e) weak negative correlation
Yvonne Yang, VP of Finance at Discrete Components, Inc. (DCI), wants a regression
model which predicts the average collection period on credit sales. Her data set includes

two qualitative variables: sales discount rates (0%, 2%, 4%, and 6%), and total assets of
credit customers (small, medium, and large). The number of dummy variables needed
for "total assets of credit customer" in Yvonne's regression model is ________.
a) 1
b) 2
c) 3
d) 4
e) 7
In a decision analysis problem, variables (such as investing in common stocks or
corporate bonds) which are under the decision maker's control are called _________.
a) payoffs
b) decision alternatives
c) states of nature
d) revised probabilities
e) prior probabilities
If the standard deviation, is known the z-distribution values may not be
used to determine interval estimates for the population mean when
a) n<30

b) the distribution is not normal
c) the distribution is skewed
d) n is big
e) n is small (<30) and the distribution is not normal
The probability that a call to an emergency help line is answered in less than 10 seconds
is 0.8. Assume that the calls are independent of each other. Using the normal
approximation for binomial with a correction for continuity, the probability that at least
75 of 100 calls are answered within 10 seconds is approximately _______
a) 0.8
b) 0.1313
c) 0.5235
d) 0.9154
e) 0.8687
A market researcher is studying the use of coupons by consumers of varying ages. She
classifies consumers into four age categories and counts the number of grocery store

customers who use at least one coupon during check out. It is expected that data are
uniformly distributed across the four age categories. The observed data results in
frequencies of 22, 35, 32, and 21. Using
= .05, the appropriate decision is _______.
a) do not reject the null hypothesis that the observed distribution is uniform
b) do not reject the null hypothesis that the observed distribution is not uniform
c) reject the null hypothesis that the observed distribution is uniform
d) reject the null hypothesis that the observed distribution is not uniform
e) do nothing
A random sample of 64 items is selected from a population of 400 items. The sample
mean is 200. The population standard deviation is 48. From this data, a 90% confidence
interval to estimate the population mean can be computed as _______.
a) 189.21 to 210.79
b) 188.24 to 211.76
c) 190.13 to 209.87
d) 190.94 to 209.06
e) 193.45 to 211.09
Louis Katz, a cost accountant at Papalote Plastics, Inc. (PPI), is analyzing the
manufacturing costs of a molded plastic telephone handset produced by PPI. Louis's
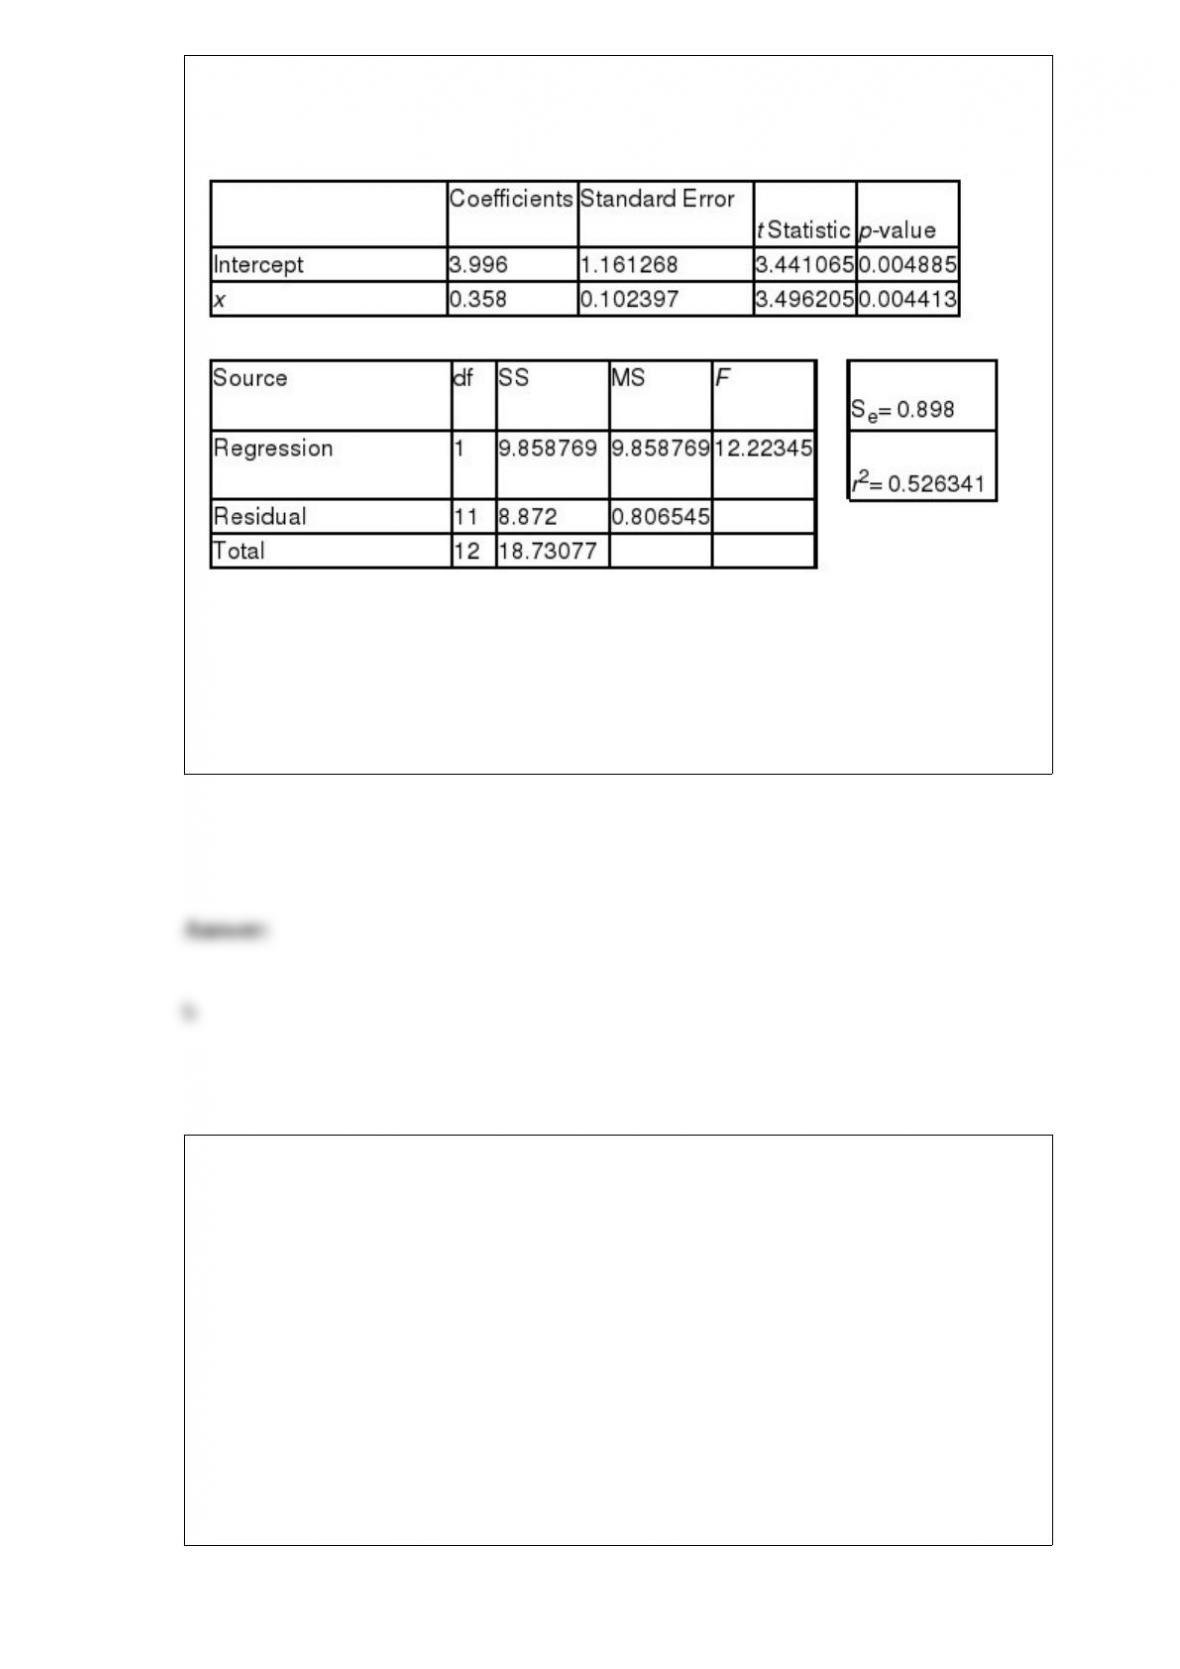
independent variable is production lot size (in 1,000's of units), and his dependent
variable is the total cost of the lot (in $100's). Regression analysis of the data yielded
the following tables.
The correlation coefficient between Louis's variables is ________________.
a) -0.73
b) 0.73
c) 0.28
d) -0.28
e) 0.00
According to the central limit theorem, if a sample of size 64 is drawn from a
population with a standard deviation of 80, the standard deviation of sample means
would equal _______.
a) 10.000
b) 1.250
c) 0.125
d) 0.800
e) 0.080
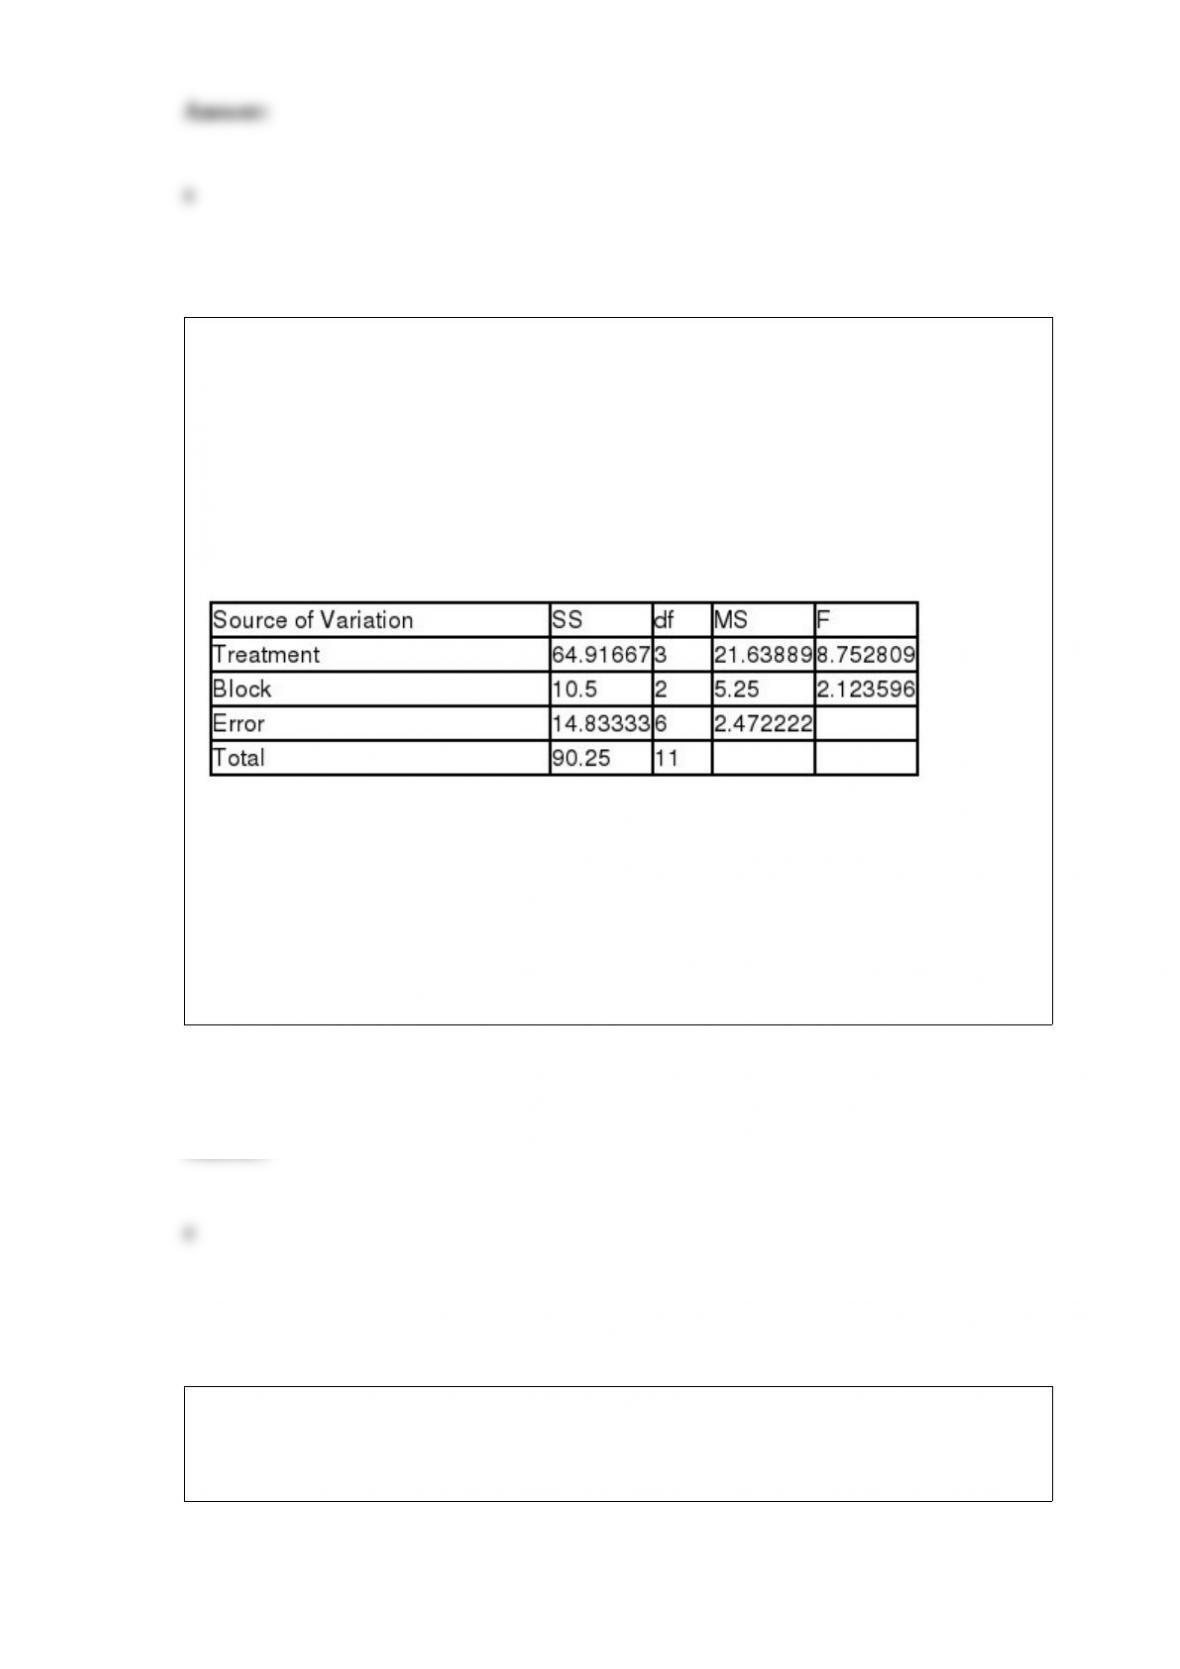
Cindy Ho, VP of Finance at Discrete Components, Inc. (DCI), theorizes that the
discount level offered to credit customers affects the average collection period on credit
sales. Accordingly, she has designed an experiment to test her theory using four sales
discount rates (0%, 2%, 4%, and 6%). First, she classified DCI's credit customers into
three categories by total assets (small, medium, and large). Then, she randomly
assigned four customers from each category to a sales discount rate. An analysis of
Cindy's data yielded the following ANOVA table.
Using
= 0.05, the appropriate decision for treatment effects is ________.
a) reject the null hypothesis
b) reject the null hypothesis
1
2
3
4
c) do not reject the null hypothesis
1
2
3
4
d) do not reject the null hypothesis
1
2
3
4
e) do nothing
A market research team compiled the following discrete probability distribution for
families residing in Randolph County. In this distribution, x represents the number of
evenings the family dines outside their home during a week.
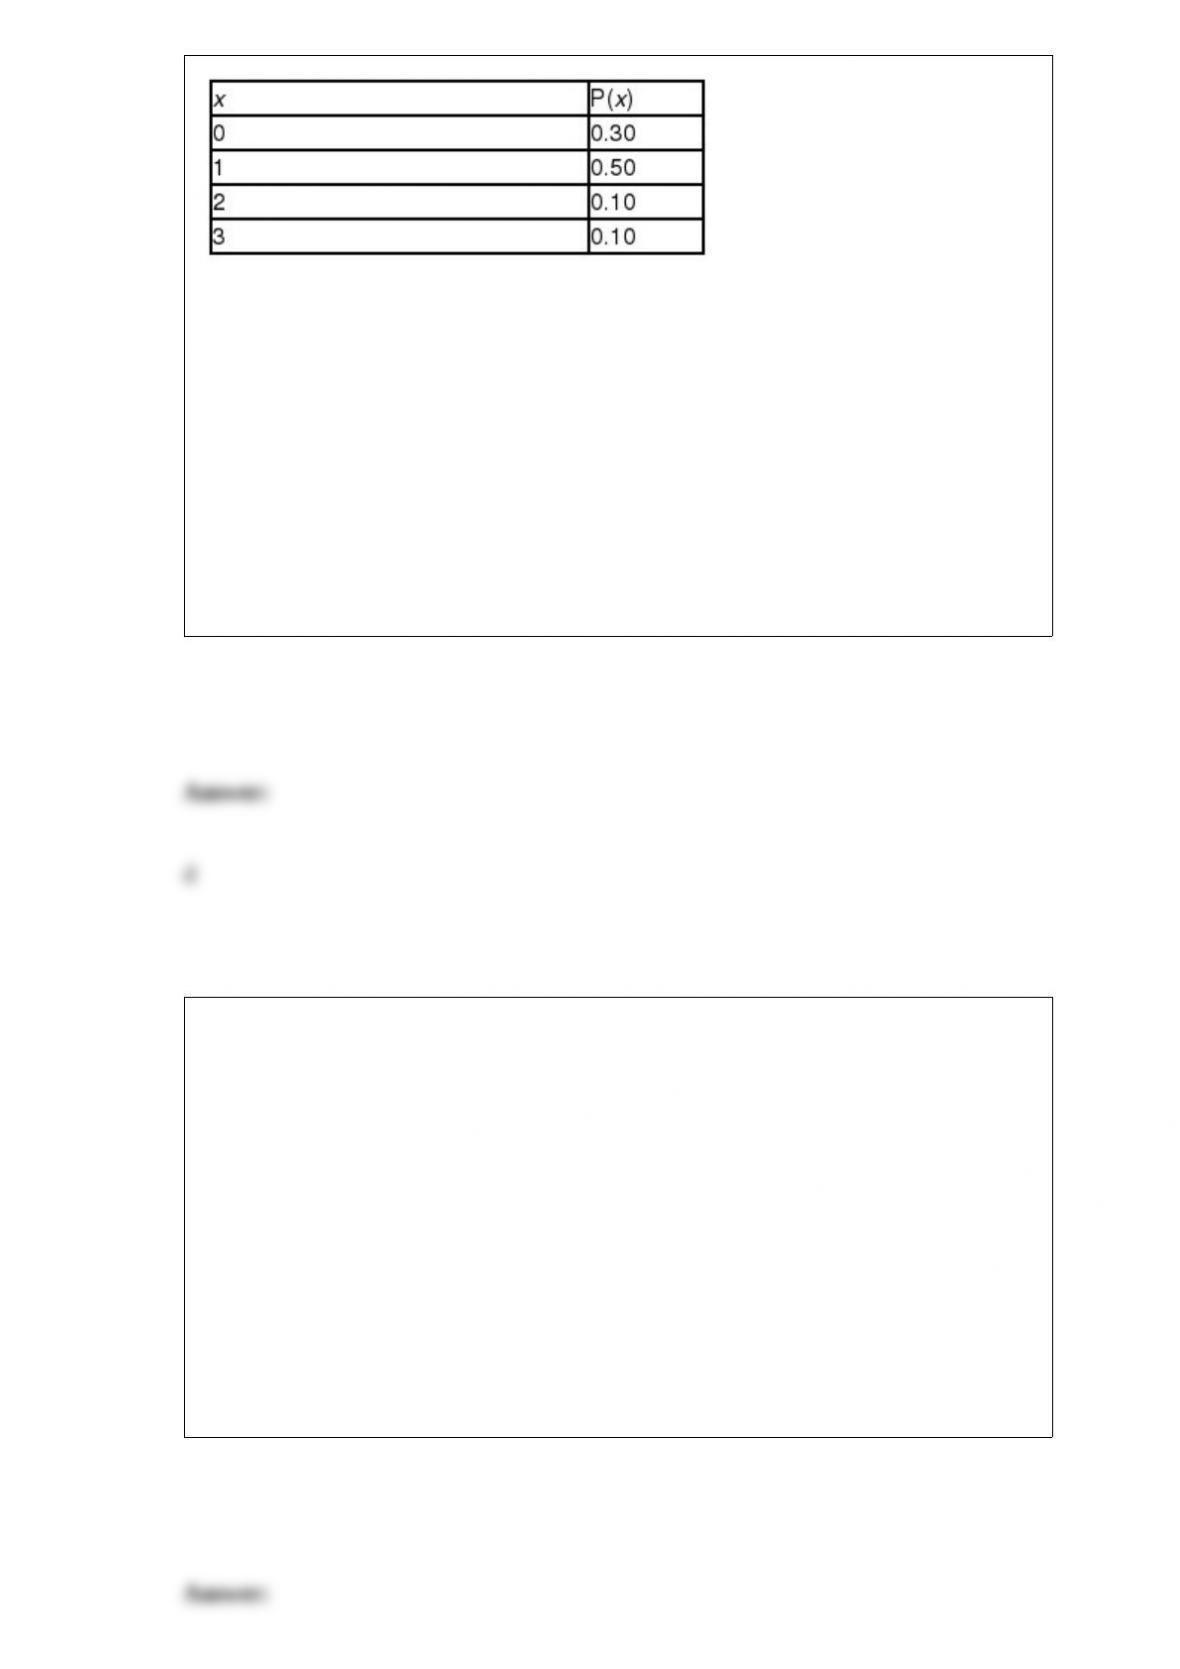
The standard deviation of x is _______________.
a) 1.00
b) 2.00
c) 0.80
d) 0.89
e) 1.09
A large trucking company wants to estimate the proportion of its tracker truck
population with refrigerated carrier capacity. A random sample of 200 tracker trucks is
taken and 30% of the sample have refrigerated carrier capacity. The 90% confidence
interval to estimate the population proportion is _______.
a) 0.53 to 0.67
b) 0.25 to 0.35
c) 0.24 to 0.36
d) 0.27 to 0.33
e) 0.33 to 0.39

The total area underneath any normal curve is equal to _______.
a) the mean
b) one
c) the variance
d) the coefficient of variation
e) the standard deviation
A market analyst is developing a regression model to predict monthly household
expenditures on groceries as a function of family size, household income, and
household neighborhood (urban, suburban, and rural). The "income" variable in this
model is ____.
a) an indicator variable
b) a response variable
c) a qualitative variable
d) a dependent variable
e) an independent variable
Suppose the population of all public Universities shows the annual parking fee per
student is $110 with a standard deviation of $18. If a random sample of size 49 is drawn

from the population, the probability of drawing a sample with a sample mean between
$100 and $115 is _______.
a) 0.9738
b) 0.4738
c) 0.0262
d) 0.6103
e) 0.1103
If x, the time (in minutes) to complete an change job at certain auto service station, is
uniformly distributed over the interval 20 to 30, inclusively (20 x 30), then the
probability that an oil change job is completed in 33 to 35 minutes, inclusively, i.e.,
P(33 x 35) is __________________.
a) 0.5080
b) 0.000
c) 0.375
d) 0.200
e) 1.000
A researcher wants to estimate the percent of the population that uses the radio to stay
informed on local news issues. The researcher wants to estimate the population
proportion with a 95% level of confidence. He estimates from previous studies that no

more than 30% of the population stay informed on local issues through the radio. The
researcher wants the estimate to have an error of no more than .03. The necessary
sample size is at least _______.
a) 27
b) 188
c) 211
d) 897
e) 900
Within a range of zscores from -1 to +1, you can expect to find _______ per cent of the
values in a normal distribution.
a) 95
b) 99
c) 68
d) 34
e) 100
Each day, the office staff at Oasis Quick Shop prepares a frequency distribution and an
ogive of sales transactions by dollar value of the transactions. Saturday's cumulative
frequency ogive follows.
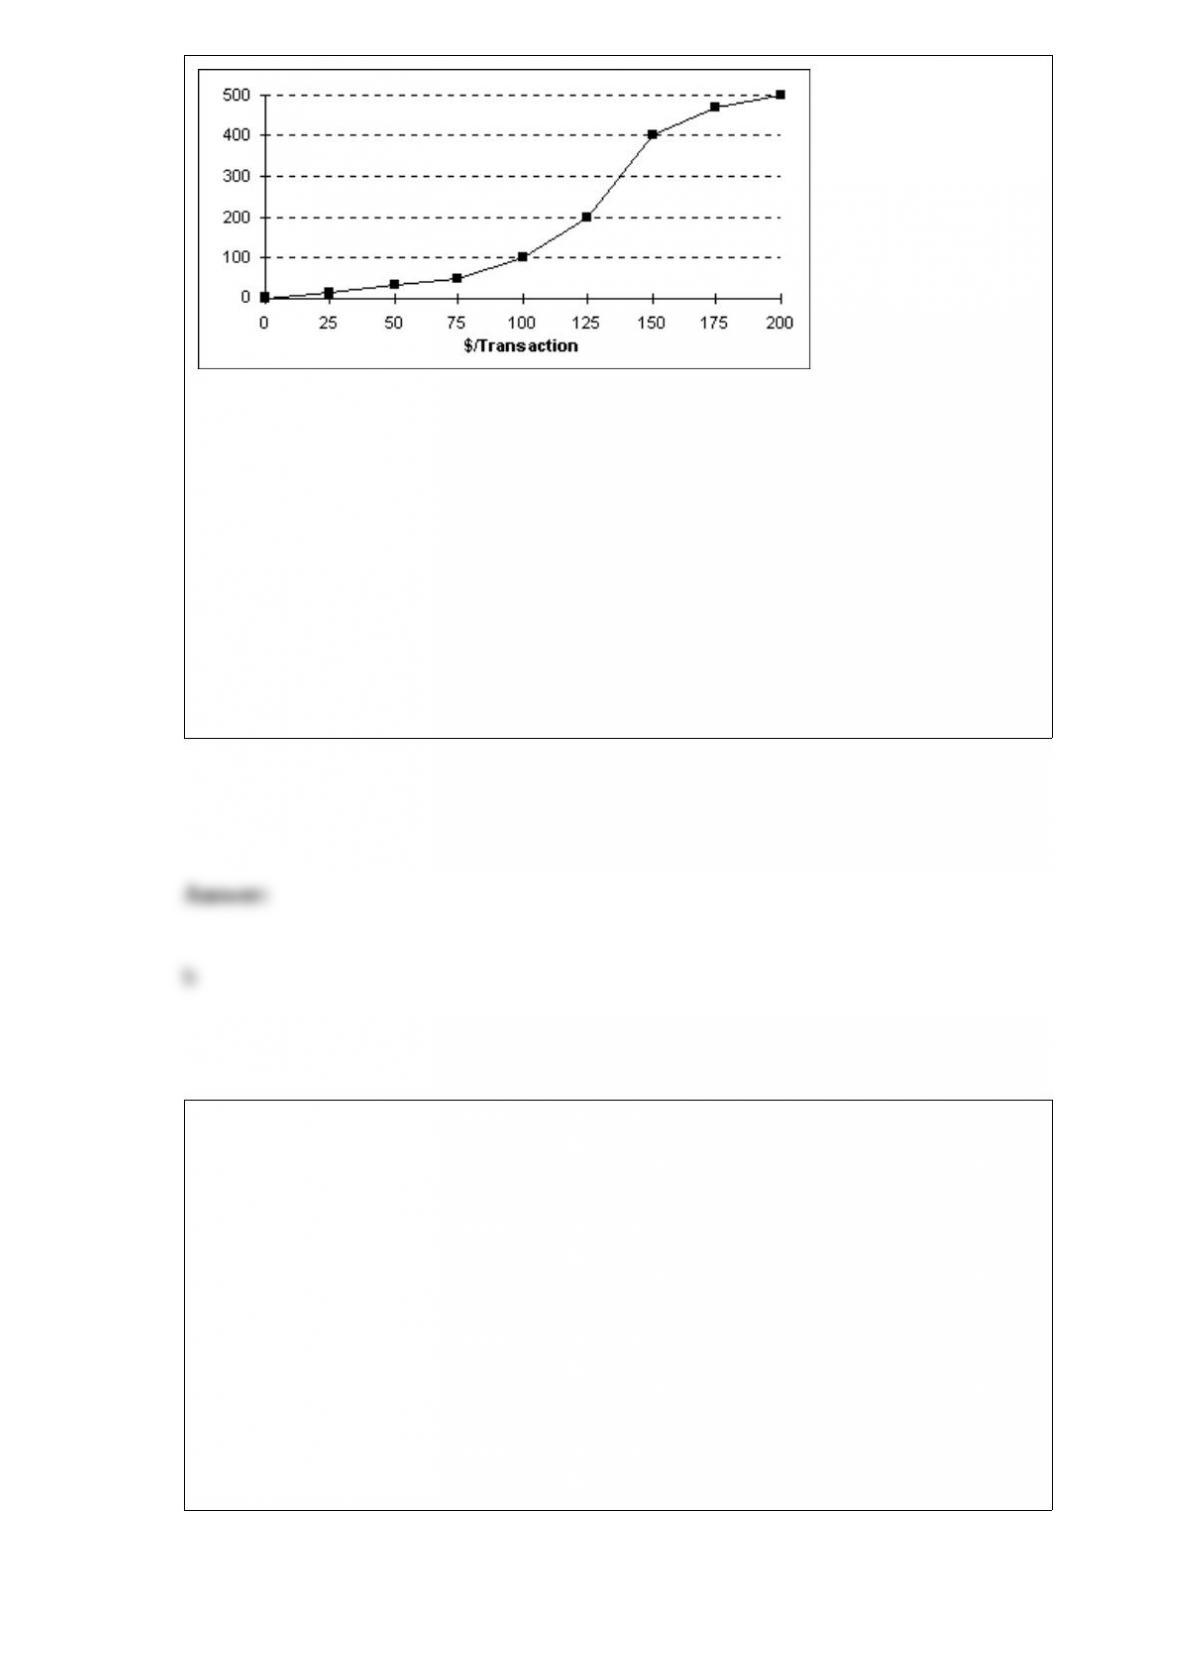
The total number of sales transactions on Saturday was _____________.
a) 200
b) 500
c) 300
d) 100
e) 400
The number of cars arriving at a toll booth in five-minute intervals is Poisson
distributed with a mean of 3 cars arriving in five-minute time intervals. The probability
of 5 cars arriving over a five-minute interval is _______.
a) 0.0940
b) 0.0417
c) 0.1500
d) 0.1008
e) 0.2890
An advantage of a just-in-time inventory system is _________.
a) fewer managerial controls on inventory
b) lower inventory holding costs
c) larger shipment and production lots
d) fewer orders per operational year
e) more inspection and handling of materials
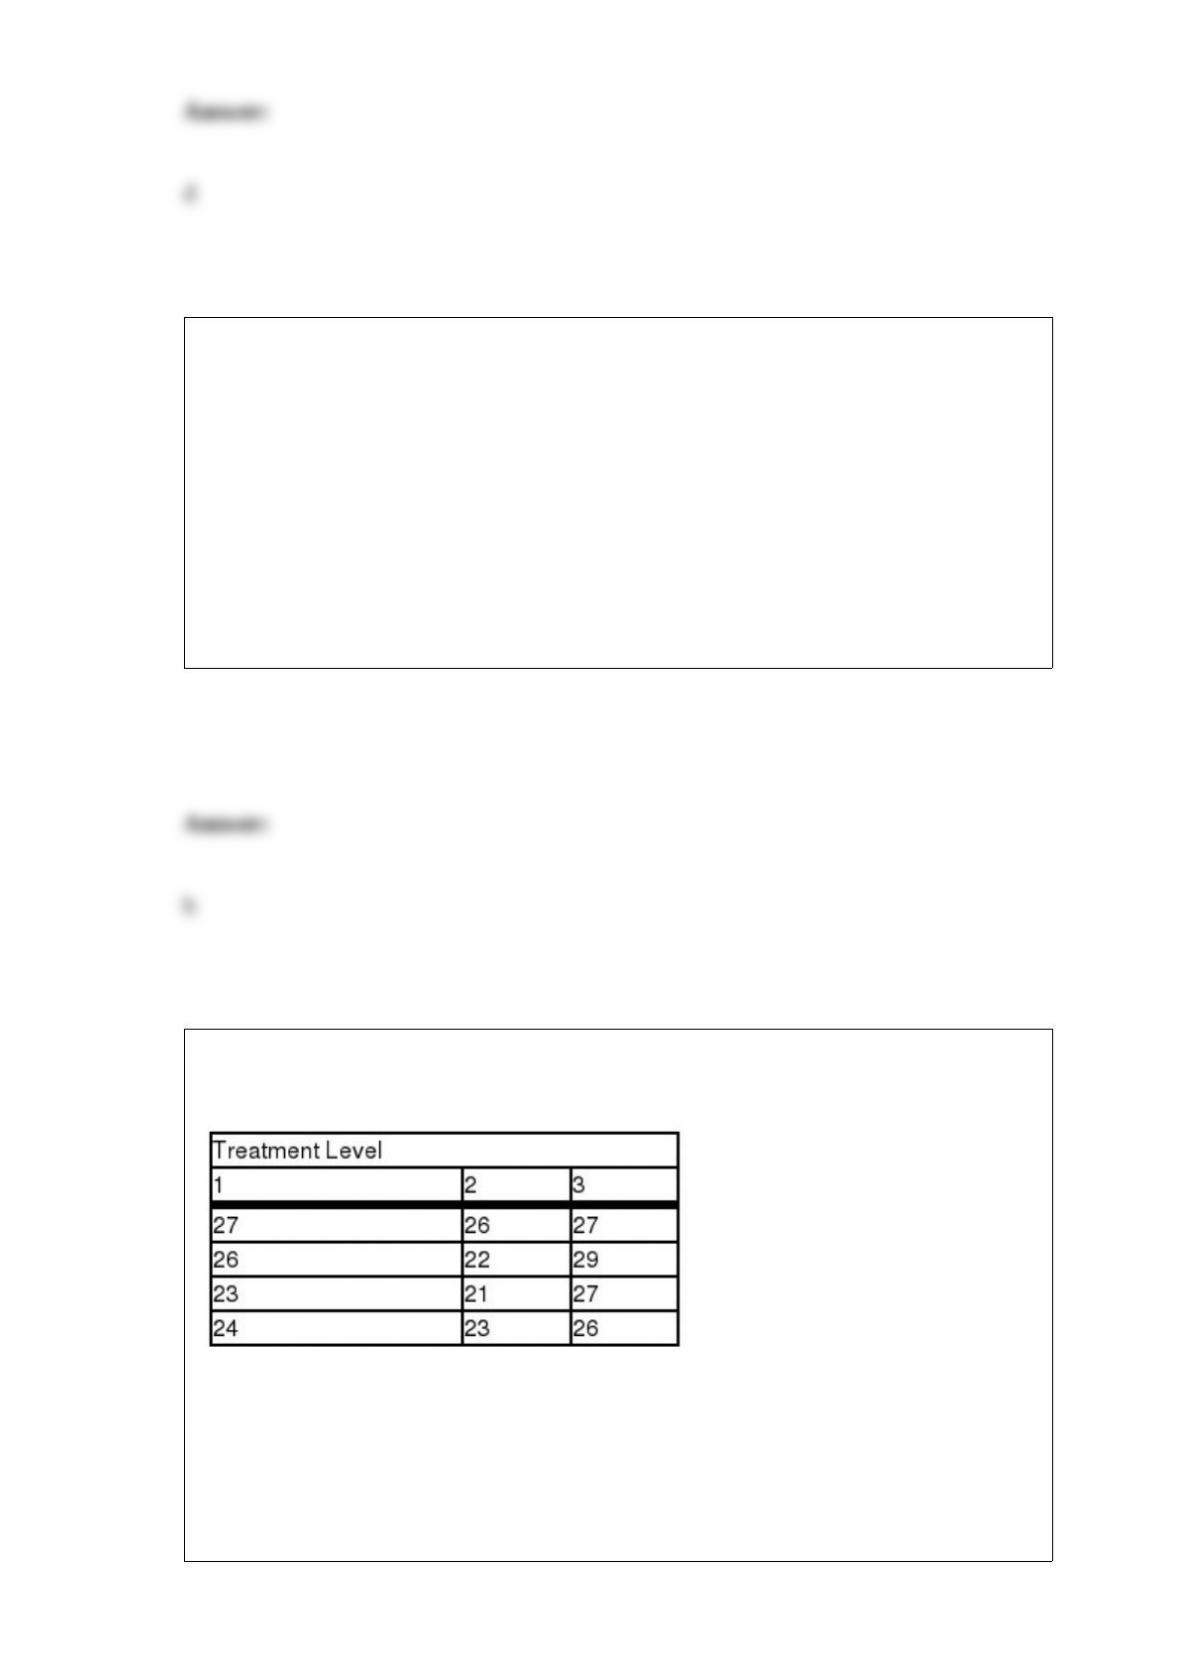
Data from a completely randomized design are shown in the following table.
For a one-way ANOVA using
= 0.05, the observed F value is ________.
a) 5.66
b) 3.19
c) 18.08
d) 4.34
e) 8.98

If the number of parking spots at urban grocery stores is uniformly distributed over the
interval 90 to 140, inclusively (90 x 140), inclusively (90 x 140), then the mean of this
distribution is __________________.
a) 115
b) 230
c) 45
d) 70
e) unknown
Statistical techniques based on fewer assumptions about the population and the
parameters are called _______.
a) population statistics
b) parametric statistics
c) nonparametric statistics
d) chi-square statistics
e) correlation statistics
A market research firm conducts studies regarding the success of new products. The
company is not always perfect in predicting the success. Suppose that there is a 50%
chance that any new product would be successful (and a 50% chance that it would fail).
In the past, for all new products that ultimately were successful, 80% were predicted to
be successful (and the other 20% were inaccurately predicted to be failures). Also, for
all new products that were ultimately failures, 70% were predicted to be failures (and
the other 30% were inaccurately predicted to be successes). If the market research
predicted that the product would be a success, what is the probability that it would
actually be a success?
a) 0.27
b) 0.73
c) 0.80
d) 0.24
e) 1.00
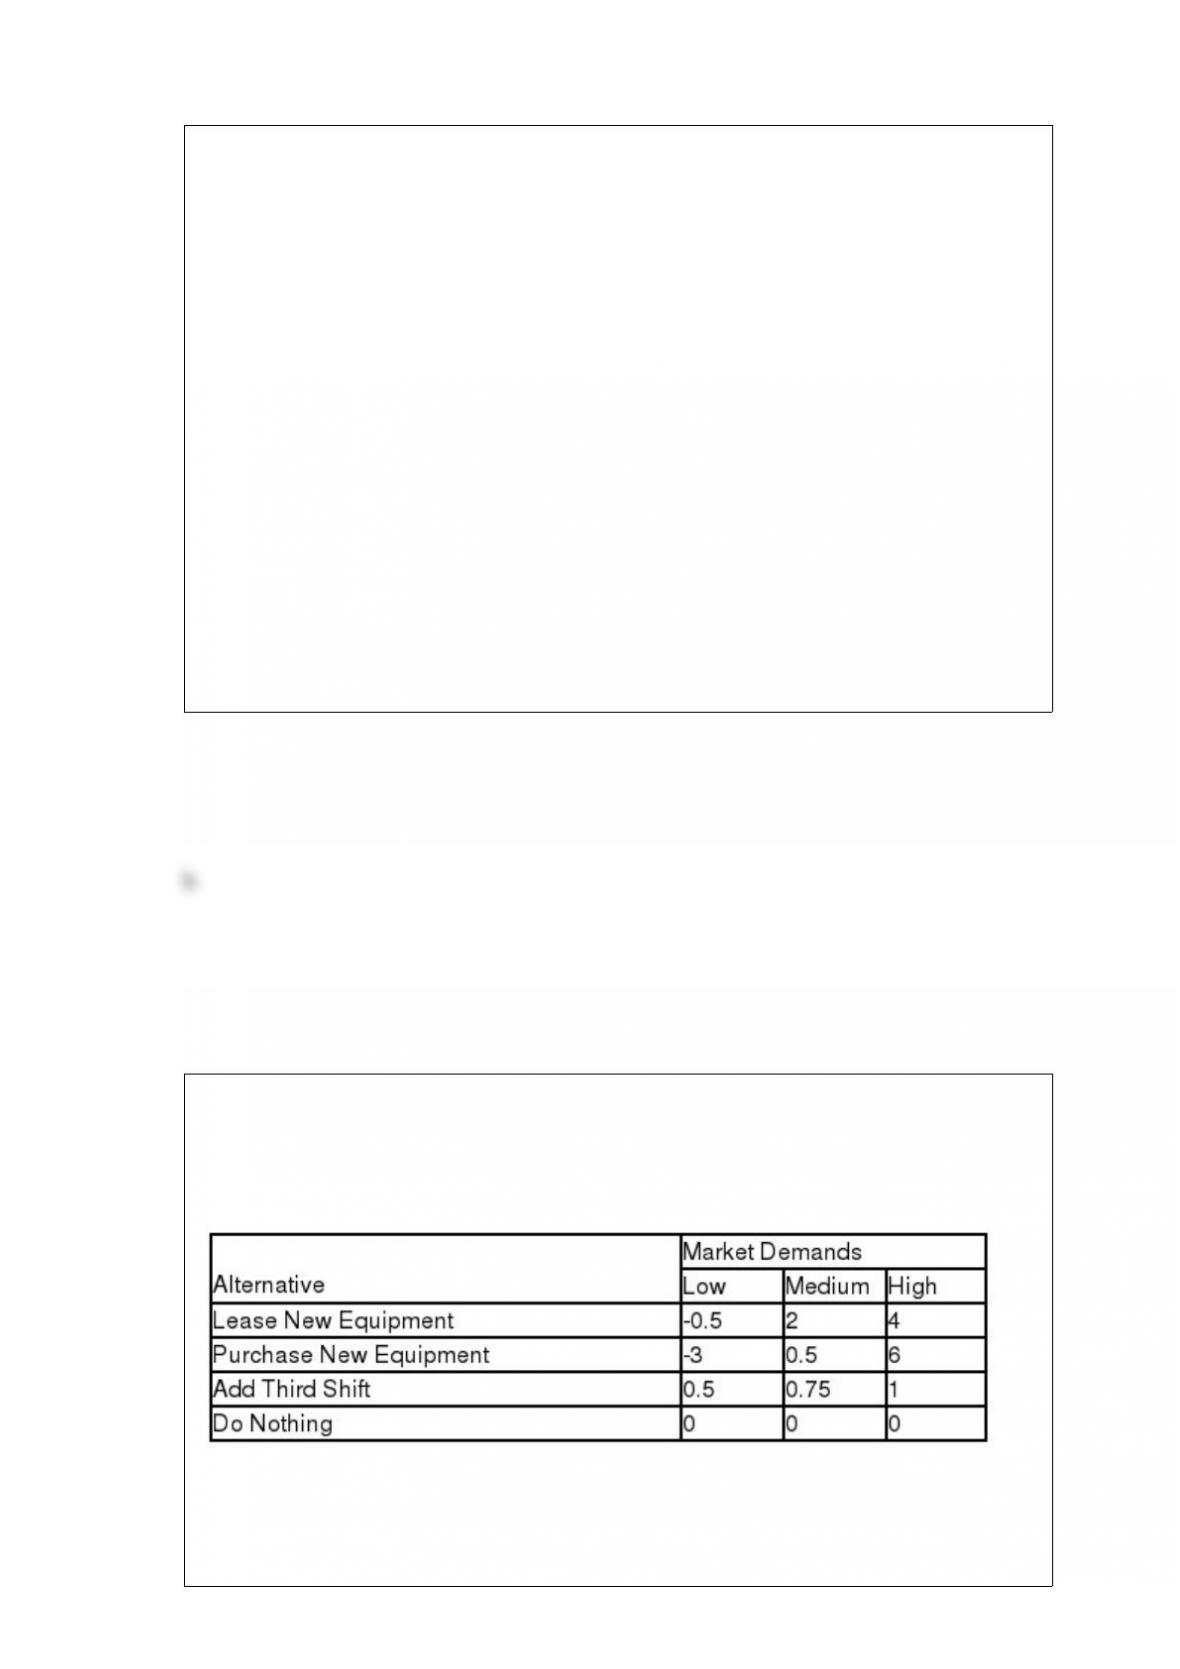
Trey Leeman, Operations Manager at National Consumers, Inc. (NCI), is evaluating
alternatives for increasing capacity at NCI's Fountain Hill plant. He has identified four
alternatives, and has constructed the following payoff table which shows payoffs (in
$1,000,000's) for the three possible levels of market demand.
If Trey uses the maximax criterion, the appropriate alternative would be:
_____________.

a) Lease New Equipment
b) Purchase New Equipment
c) Add Third Shift
d) Do Nothing
e) Do everything


