
A company has established an experiment with its production process in which three
temperature settings are used and five elapsed times are used for each setting. The
company then produces one product under each and measures the resulting strength of
the product. This experimental design is called a randomized complete block design.
In a recent study at First National Bank, a frequency count was made for the variable
marital status for the bank’s 10,000 customers. It would also be appropriate to develop a
histogram for this variable to show how marital status is distributed.
If a population is very large, it may be better to select a sample from the population than
to try to obtain a census in an effort to reduce measurement error.
A direct retailer that sells clothing on the Internet has two distribution centers and wants
to determine if there is a difference between the proportion of customer order shipments
that contain errors (wrong color, wrong size, etc.). It calculates a 95 percent confidence

interval on the difference in the sample proportions to be -0.012 to 0.037. Based on this,
it can conclude that the distribution centers differ significantly for the proportion of
orders with errors.
The control limits in the x-bar chart are set so that 95 percent of the values will fall
inside the control limits when there is only common cause variation.
An article in an operations management journal recently stated that a formal hypothesis
test rejected the hypothesis that mean employee productivity was less than $45.70 per
hour in the wood processing industry. Given this conclusion, it is possible that a Type I
statistical error was committed.
An Internet-based or emailed survey is not an alternative method of data collection.

A major insurance company believes that for drivers between 16 years of age and 60
years of age, the number of accidents per year tends to decrease as age increases. If this
is the case, a scatter diagram should show a negative relationship between the two
variables.
An ogive is a graph that shows cumulative relative frequency.
By combining cells we guard against having an inflated test statistic that could have led
us to incorrectly accept the null hypothesis.

In a two-factor ANOVA with replication in which all hypotheses are to be tested using
an alpha = .05 level, if the p-value for interaction is .03467, the decision maker should
conclude that no interaction is present.
The product manager for a large retail store has recently stated that she estimates that
the average purchase per visit for the store’s customers is between $33.00 and $65.00.
The $33.00 and the $65.00 are considered point estimates for the true population mean.
A sample is selected from a population in cases where selecting data from the entire
population is either very difficult or very expensive.
The normal distribution is one of the most frequently used discrete probability
distributions.

The amount of drying time for the paint applied to a plastic component part is thought
to be uniformly distributed between 30 and 60 minutes. Currently, the automated
process selects the part from the drying bin after the part has been there for 50 minutes.
Based on this, the probability that a part selected will not be dry is approximately 0.33.
The margin of error is one-half the width of the confidence interval.
In election years, the polls that are conducted by such companies as Gallup and Harris
typically employ stratified random sampling to reduce the number of people that will
need to be surveyed.
When the decision maker has control over the null and alternative hypotheses, the
alternative hypotheses should be the “research” hypothesis.
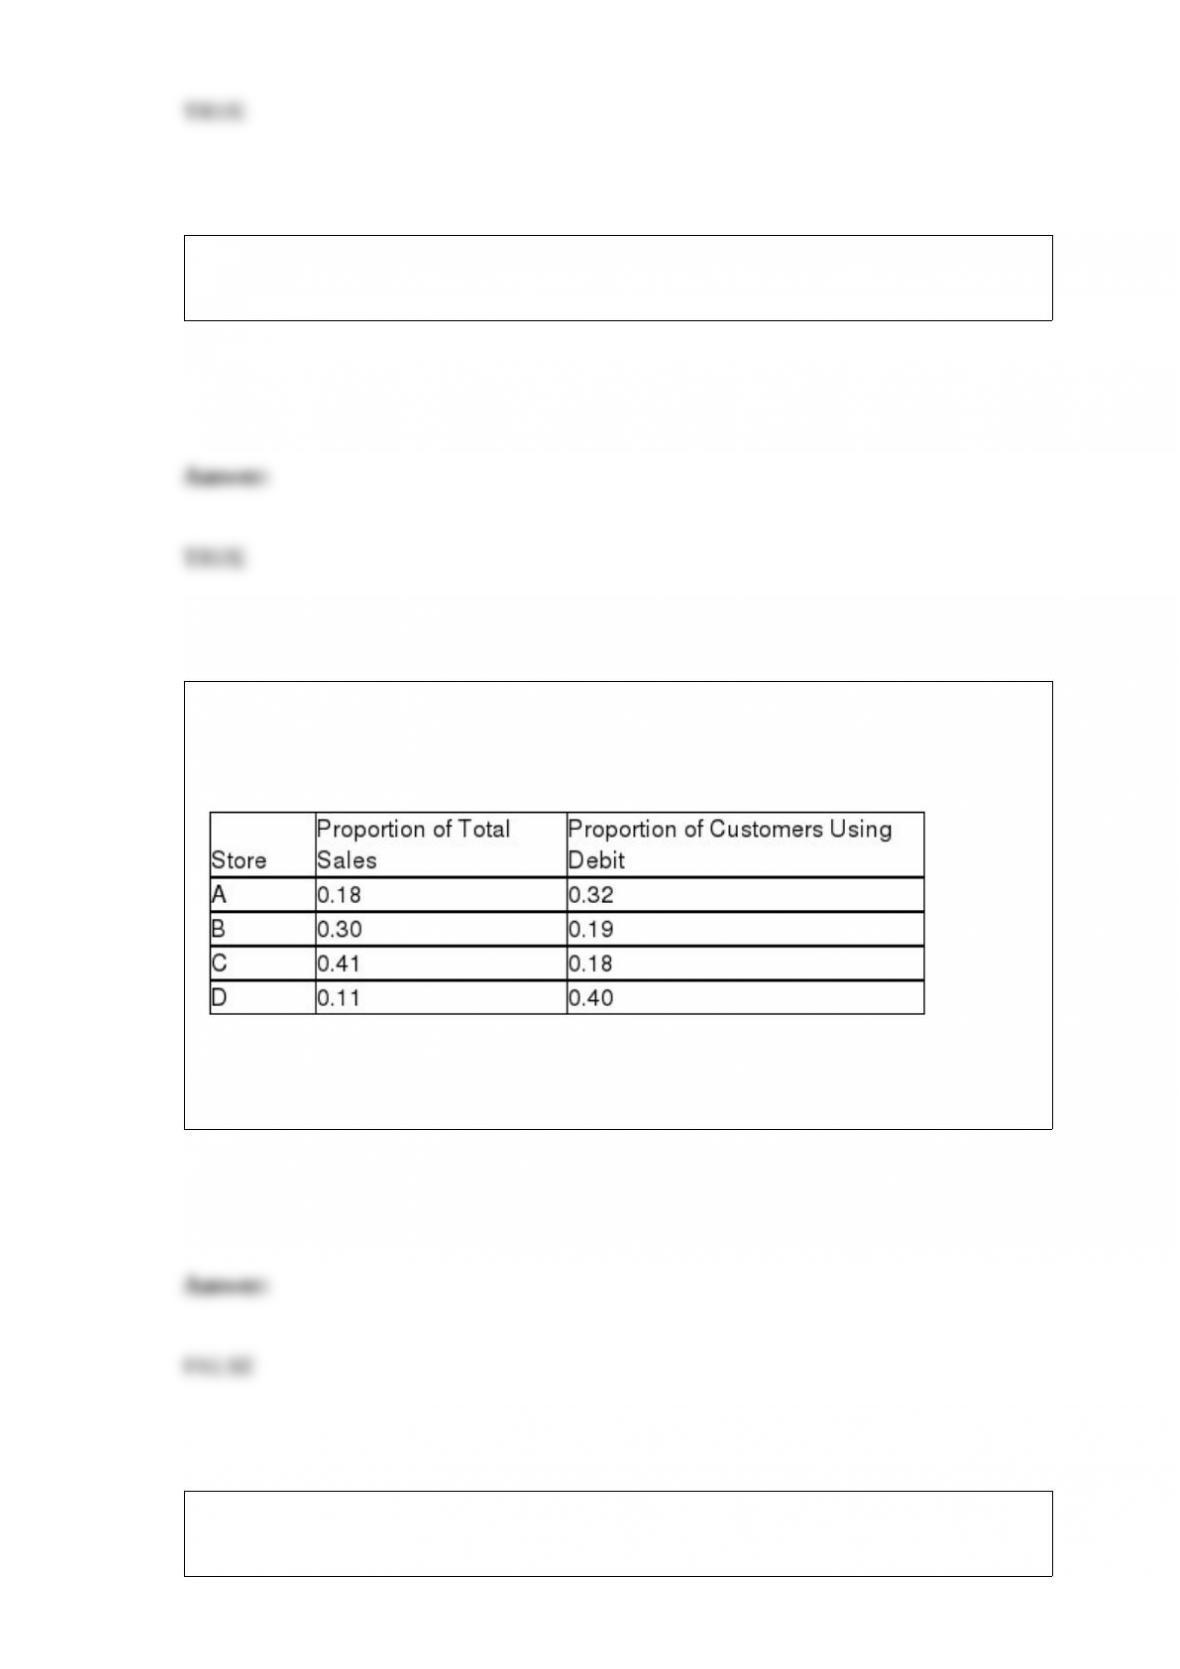
The Baker Oil and Gas Company has four retail locations, code-named A, B, C, and D.
The following table illustrates the percentage of total company sales at each store and
also the percentage of customers at that store who make purchases with debit cards:
Based on this information, the probability that a customer who used a debit card
shopped at store C is 0.0738.
Taking a larger sample size will always result in less sampling error but costs more
money and takes more time.

Because of the way the F-distribution is formed, all F-tests are one-tailed tests.
The significance level in a hypothesis test corresponds to the maximum probability that
a Type I error will be committed.
A stable process is one that has had all its variation removed through quality
improvement efforts on the part of the organization.
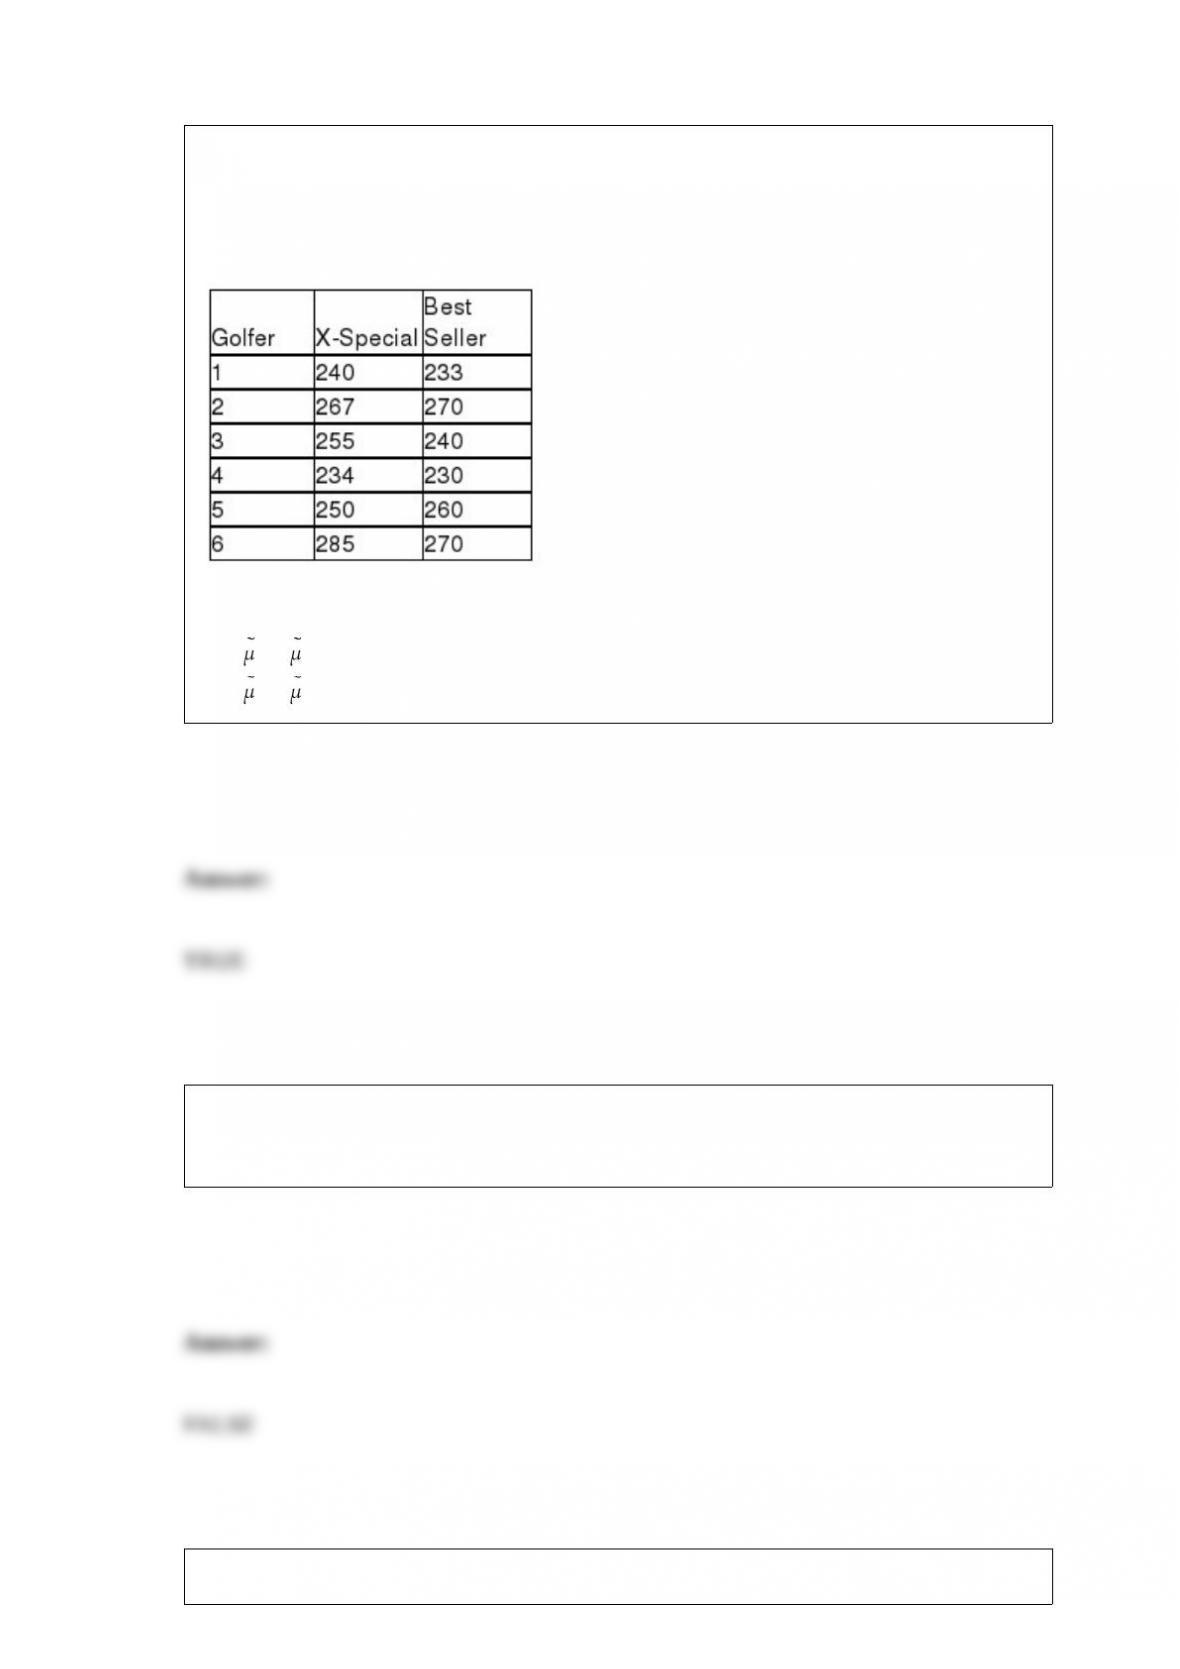
In order to determine whether the median distance for the X-Special golf ball exceeds
the median distance for the best-selling golf ball, six golfers were selected and asked to
hit each ball with their driver. The distance was recorded. The following data were
observed.
The appropriate null and alternative hypotheses are:
H0 : 1 ≤ 2
H0 : 1 > 2
In a two-tailed hypothesis test for the difference between two population variances, if s1
= 3 and s2 = 5, then the test statistic is F = 1.6667.
In most processes, the process control limits are set to correspond with the specification

limits on the product.
In using the Kruskal-Wallis test the sample sizes for each population must be equal.
A goodness-of-fit test can decide whether a set of data comes from a specific
hypothesized distribution.
The right and left edges of the box in a box and whisker plot represent the 3rd and 1st
quartiles, respectively.

Sometime it is necessary to assign probabilities based on a person’s belief that an
outcome will occur.
A pilot sample is one that is used when a decision maker wishes to get an advance idea
of what the mean of the population might be.
If a manager were interested in assessing the probability that a new product will be
successful in a New Jersey market area, she would most likely use relative frequency of
occurrence as the method for assessing the probability.

If a decision maker has several potential independent variables to select from in
building a regression model, the variable that, by itself, will always be the most
effective in explaining the variation in the dependent variable will be the variable that
has a correlation closest to positive 1.00.
A 95 percent confidence interval for a mean will contain 95 percent of the population
within the interval.
If a set of data contains no values of x that are equal to zero, then the regression
coefficient, b0, has no particular meaning.
The Vardon Exploration Company is getting ready to leave for South America to
explore for oil. One piece of equipment requires 10 batteries that must operate for more
than 2 hours. The batteries being used have a 15 percent chance of failing within 2
hours. The exploration leader plans to take 15 batteries. Assuming that the conditions of

the binomial apply, the probability that the supply of batteries will contain enough good
ones to operate the equipment is:
A) 0.0449
B) 0.9832
C) 0.0132
D) 0.9964
There have been complaints recently from homeowners in the north end claiming that
their homes have been assessed at values that are too high compared with other parts of
town. They say that the mean increase from last year to this year has been higher in
their part of town than elsewhere. To test this, the assessor’s office staff plans to select a
random sample of north end properties (group 1) and a random sample of properties
from other areas within the city (group 2) and perform a hypothesis test. Based on the
information provided, the research (or alternate) hypothesis is:
A) μ1 = μ2
B) μ1 ≠ μ2
C) μ1 > μ2
D) μ1 < μ2

The manager for State Bank and Trust has recently examined the credit card account
balances for the customers of her bank and found that 20% have an outstanding balance
at the credit card limit. Suppose the manager randomly selects 15 customers and finds 4
that have balances at the limit. Assume that the properties of the binomial distribution
apply.
What is the probability of finding 4 customers in a sample of 15 who have “maxed out”
their credit cards?
A) 0.1876
B) 0.8358
C) 0.6482
D) 0.3832
An Internet service provider has the capability of tracking the time that each of its
customers spends connected to the Internet during a month. These data would
constitute:
A) a simple random sample.
B) a convenience sample.
C) a cluster sample.
D) a population.
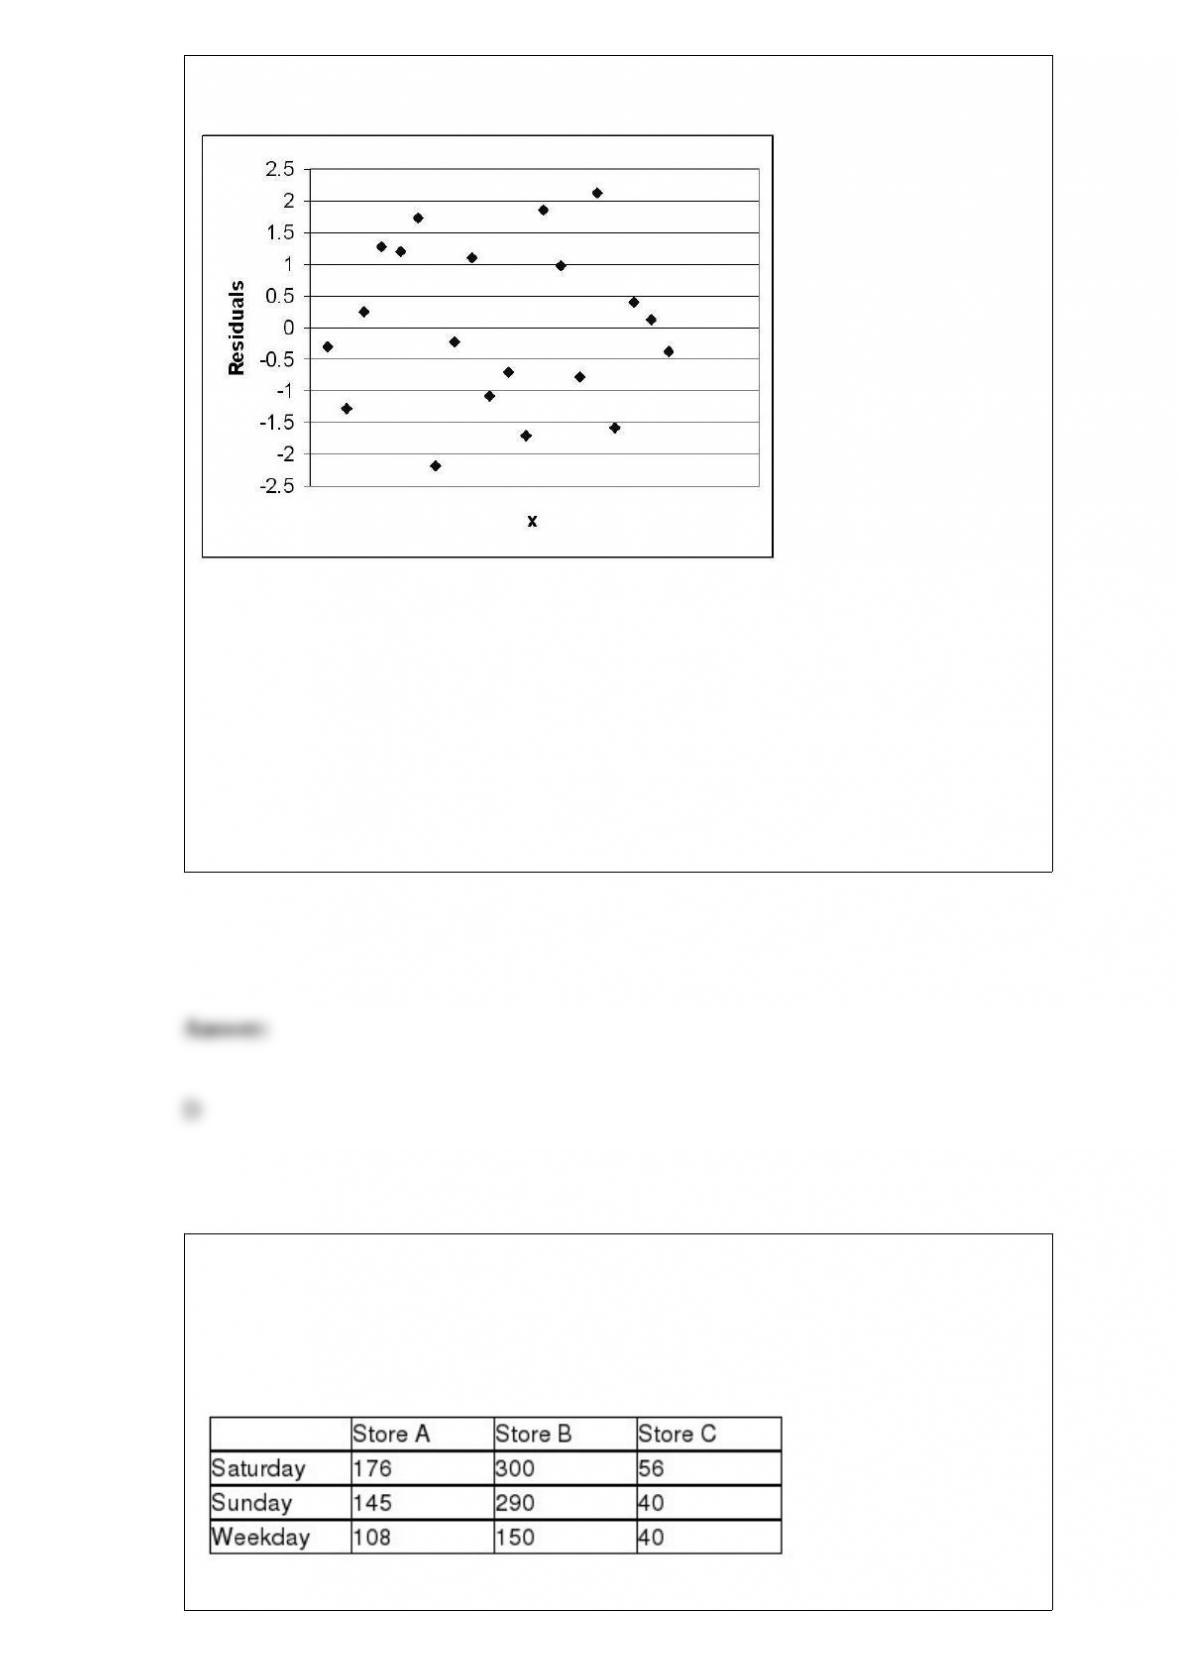
Based on the residual plot below, which of the following is correct?
The above residual plot shows:
A) linearity and nonconstant variance.
B) nonlinearity and constant variance.
C) linearity and constant variance.
D) nonlinearity and nonconstant variance.
Recently, a department store chain was interested in determining if there was a
difference in the mean number of customers who enter the three stores in Seattle. The
analysts set up a study in which the number of people entering the stores was counted
depending on whether the day of the week was Saturday, Sunday, or a weekday. The
following data were collected:

Given this format and testing using an alpha level equal to 0.05, which of the following
statements is true?
A) The total degrees of freedom is 9.
B) The between blocks degrees of freedom equals 8.
C) The between samples degrees of freedom equals 3.
D) The within sample degrees of freedom equals 4.
The Jack In The Box franchise in Bangor, Maine, has determined that the chance a
customer will order a soft drink is 0.90. The probability that a customer will order a
hamburger is 0.60. The probability that a customer will order french fries is 0.50.
The restaurant has also determined that if a customer orders a hamburger, the
probability the customer will also order fries is 0.80. Determine the probability that the
order will include a hamburger and fries.
A) 0.45
B) 0.58
C) 0.68
D) 0.48

The following regression output is available. Notice that some of the values are
missing.
Given this information, what percent of the variation in the y variable is explained by
the independent variable?
A) About 75 percent
B) Approximately 57 percent
C) Can’t be determined without having the actual data available.
D) About 25 percent
Applebee’s International, Inc., is a U.S. company that develops, franchises, and operates
the Applebee’s Neighborhood Grill and Bar restaurant chain. It is the largest chain of
casual dining restaurants in the country, with over 1,500 restaurants across the United
States. The headquarters is located in Overland Park, Kansas. The company is
interested in determining if mean weekly revenue differs among three restaurants in a
particular city. The file entitled Applebees contains revenue data for a sample of weeks
for each of the three locations.
If you did conclude that there was a difference in the average revenue, use Fisher’s LSD
approach to determine which restaurant has the lowest mean sales.
A) There is no difference between the average revenues.
B) Restaurant 1 has the highest average revenue while there is no evidence of a
difference between Restaurant 2’s and 3’s average revenues.
C) Restaurant 3 has the highest average revenue while there is no evidence of a
difference between Restaurant 1’s and 2’s average revenues.
D) Restaurant 2 has the highest average revenue while there is no evidence of a
difference between Restaurant 1’s and 3’s average revenues.
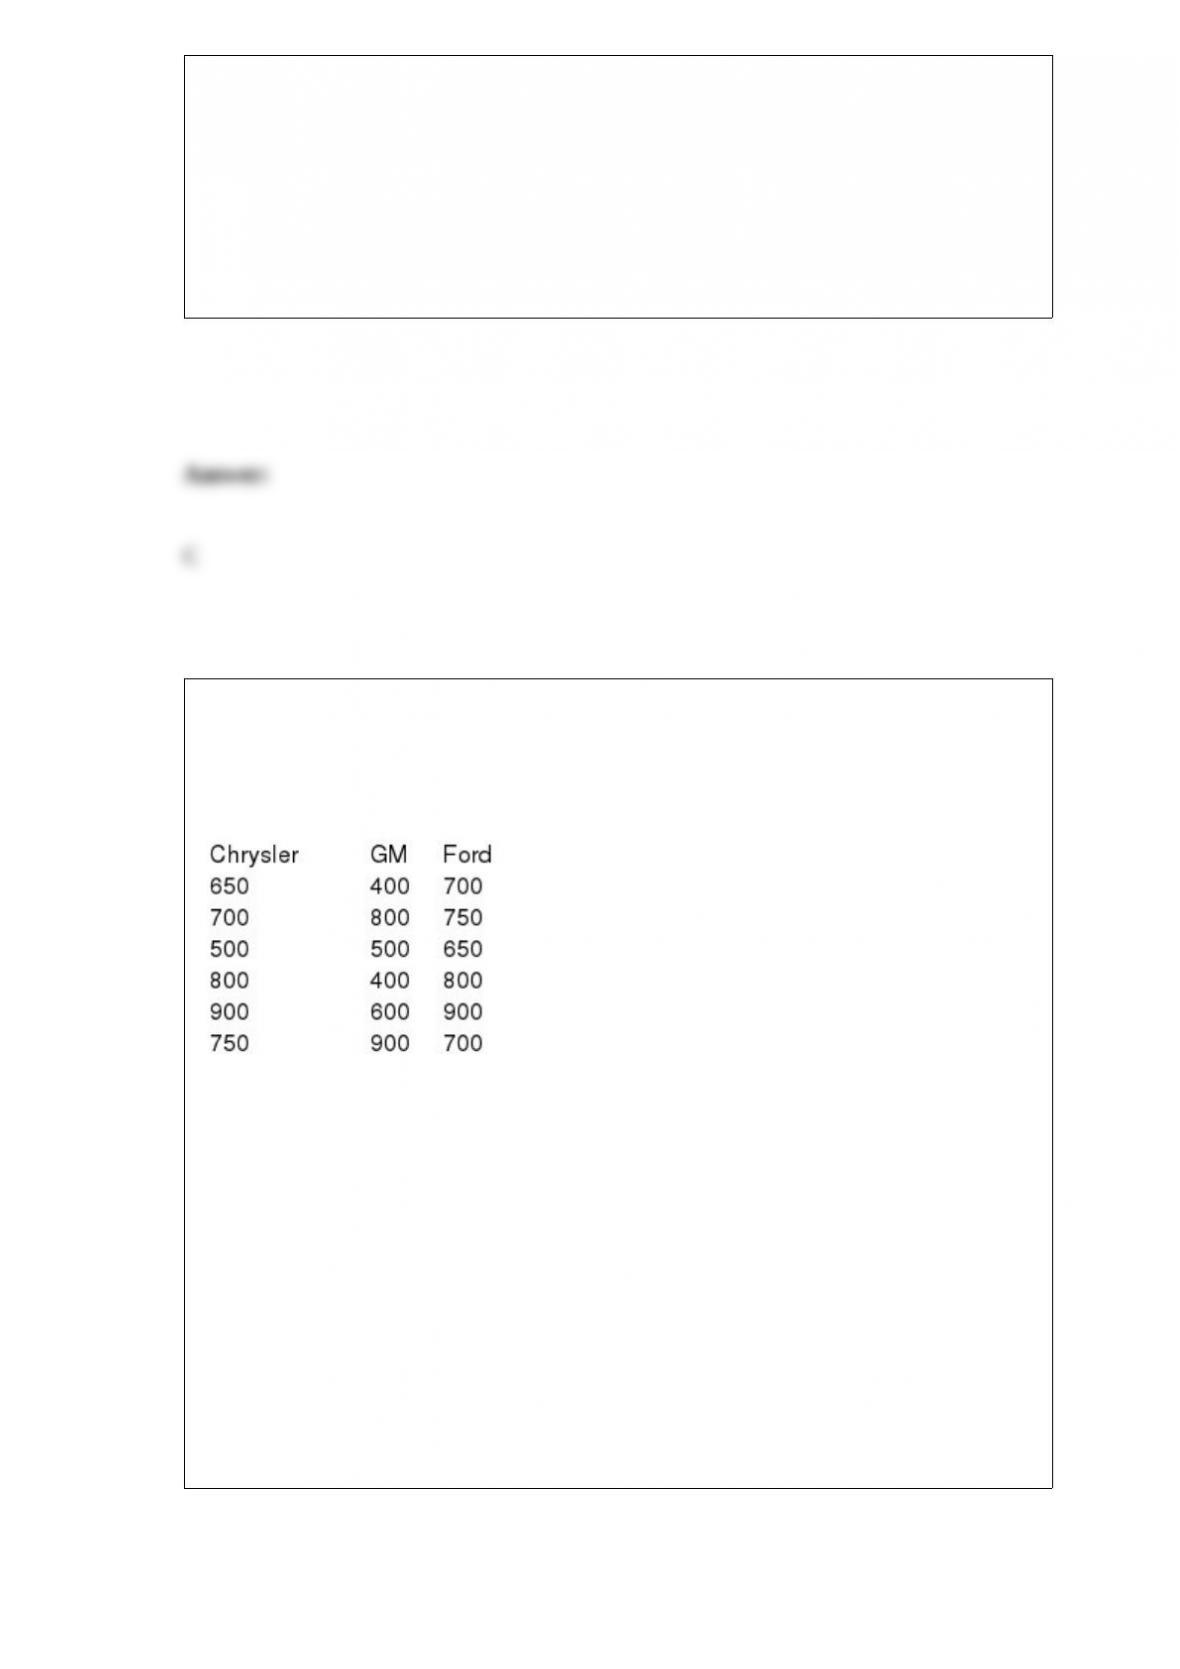
A survey was recently conducted in which random samples of car owners of Chrysler,
GM, and Ford cars were surveyed to determine their satisfaction. Each owner was
asked to rate overall satisfaction on a scale of 1 (poor) to 1000 (excellent). The
following data were recorded:
If the analysts are not willing to assume that the population ratings are normally
distributed and will use the Kruskal-Wallis test to determine if the three companies have
different median ratings, what is the appropriate critical value if the test is to be
conducted using an alpha = .05 level?
A) χ2= 5.05
B) χ2 = 5.99
C) χ2 = 24.99
D) χ2= 3.67

A recent study in the restaurant business determined that the mean tips for male waiters
per hour of work are $6.78 with a standard deviation of $2.11. The mean tips per hour
for female waiters are $7.86 with a standard deviation of $2.20. Based on this
information, which of the following statements do we know to be true?
A) The distribution of tips for both males and females is right-skewed.
B) The variation in tips received by females is more variable than males.
C) The median tips for females exceeds that of males.
D) On a relative basis, males have more variation in tips per hour than do females.
Employees at a large computer company earn sick leave in one-minute increments
depending on how many hours per month they work. They can then use the sick leave
time any time throughout the year. Any unused time goes into a sick bank account that
they or other employees can use in the case of emergencies. The human resources
department has determined that the amount of unused sick time for individual
employees is uniformly distributed between 0 and 480 minutes. The company has
decided to give a cash payment to any employee that returns over 400 minutes of sick
leave at the end of the year. What percentage of employees could expect a cash
payment?
A) 16.67 percent
B) 0.1667 percent
C) Just over 43 percent
D) 80 percent

If the number of defective items selected at random from a parts inventory is considered
to follow a binomial distribution with n = 50 and p = 0.10, the standard deviation of the
number of defective parts is:
A) 5
B) 4.5
C) 45
D) about 2.12
If a distribution is considered to be Poisson with a mean equal to 11, the most
frequently occurring value for the random variable will be:
A) 10.5
B) 11
C) 10 and 11
D) 22

The Olsen Agricultural Company has determined that the weight of hay bales is
normally distributed with a mean equal to 80 pounds and a standard deviation equal to 8
pounds. Based on this, what is the probability that the mean weight of the bales in a
sample of n = 64 bales will be between 78 and 82 pounds?
A) 0.4772
B) 0.0228
C) 0.6346
D) 0.9544
If a hypothesis test for a single population variance is to be conducted, which of the
following statements is true?
A) The null hypothesis must be stated in terms of the population variance.
B) The chi-square distribution is used.
C) If the sample size is increased, the critical value is also increased for a given level of
statistical significance.
D) All of the above are true.
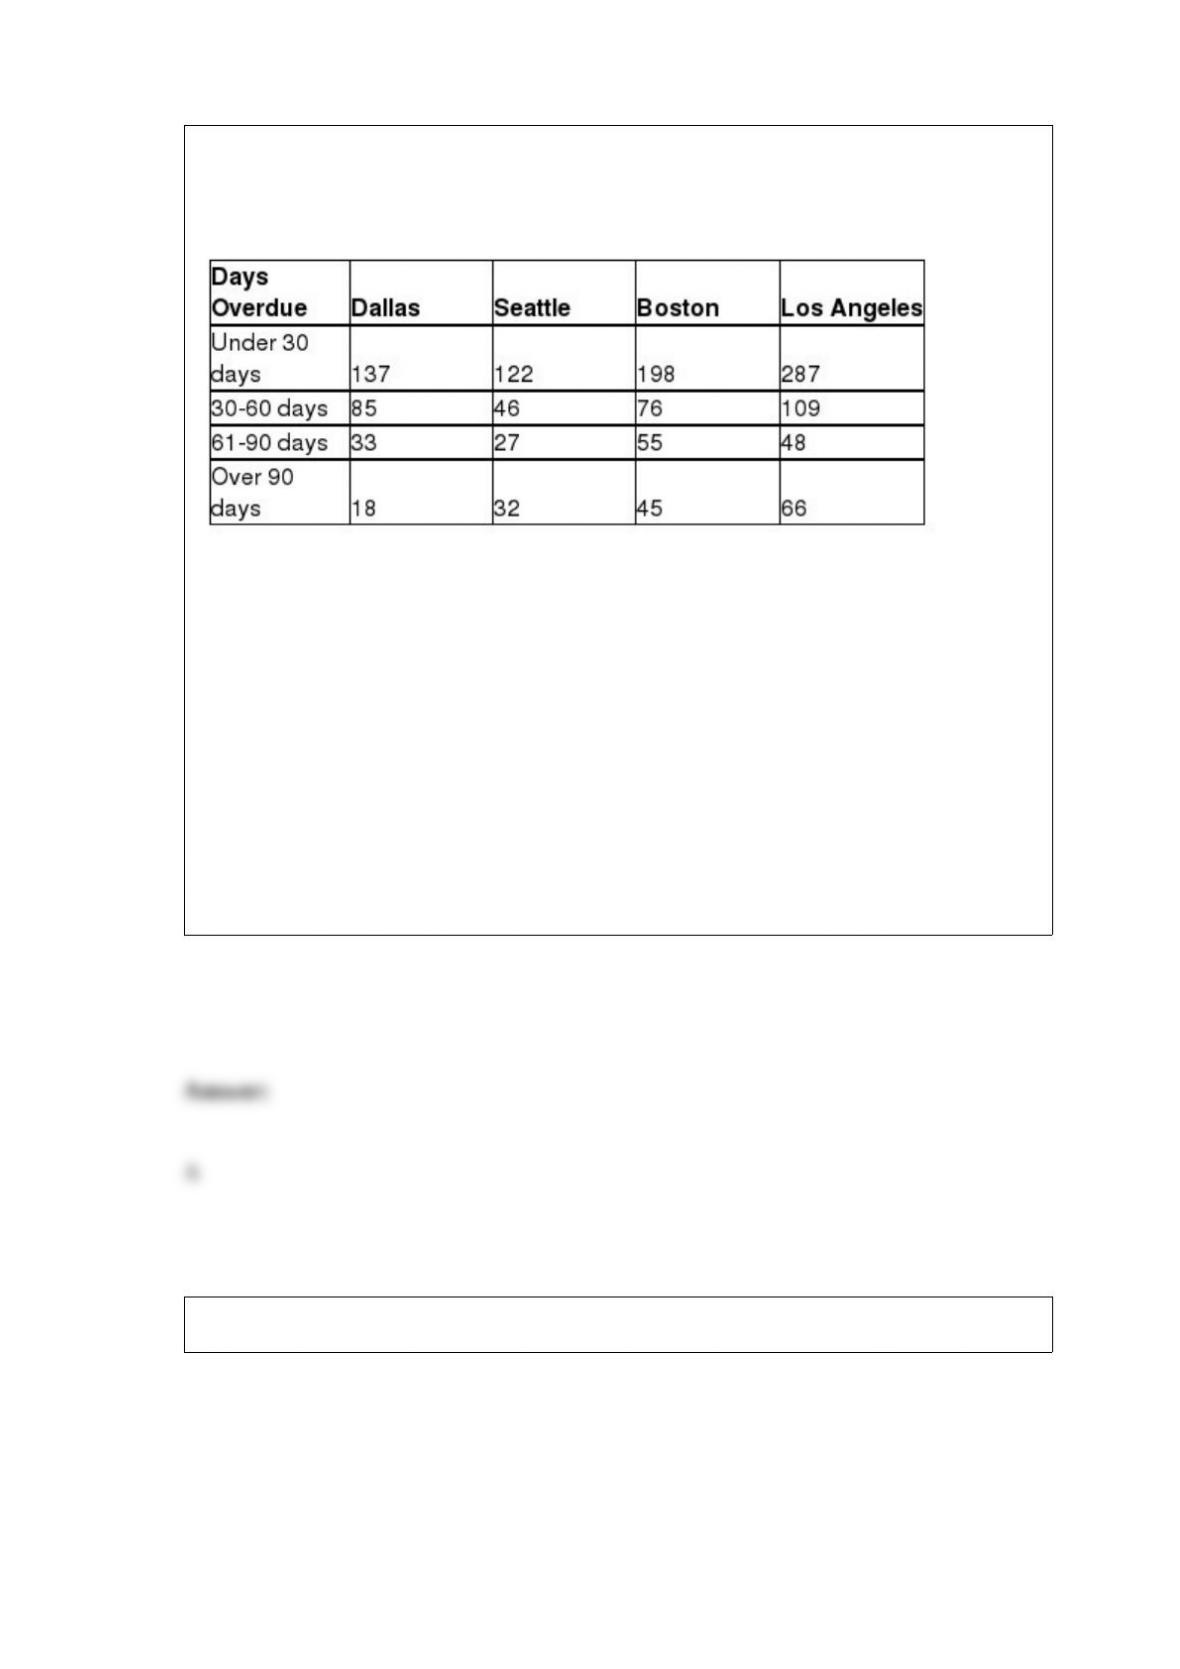
Micron Technology has sales offices located in four cities: Dallas, Seattle, Boston, and
Los Angeles. An analysis of the company’s accounts receivables reveals the number of
overdue invoices by days, as shown here.
Assume the invoices are stored and managed from a central database.
What is the probability that a randomly selected invoice from the database is from the
Boston sales office?
A) 0.2702
B) 0.0231
C) 0.3461
D) 0.7765
The following regression output is from a multiple regression model:
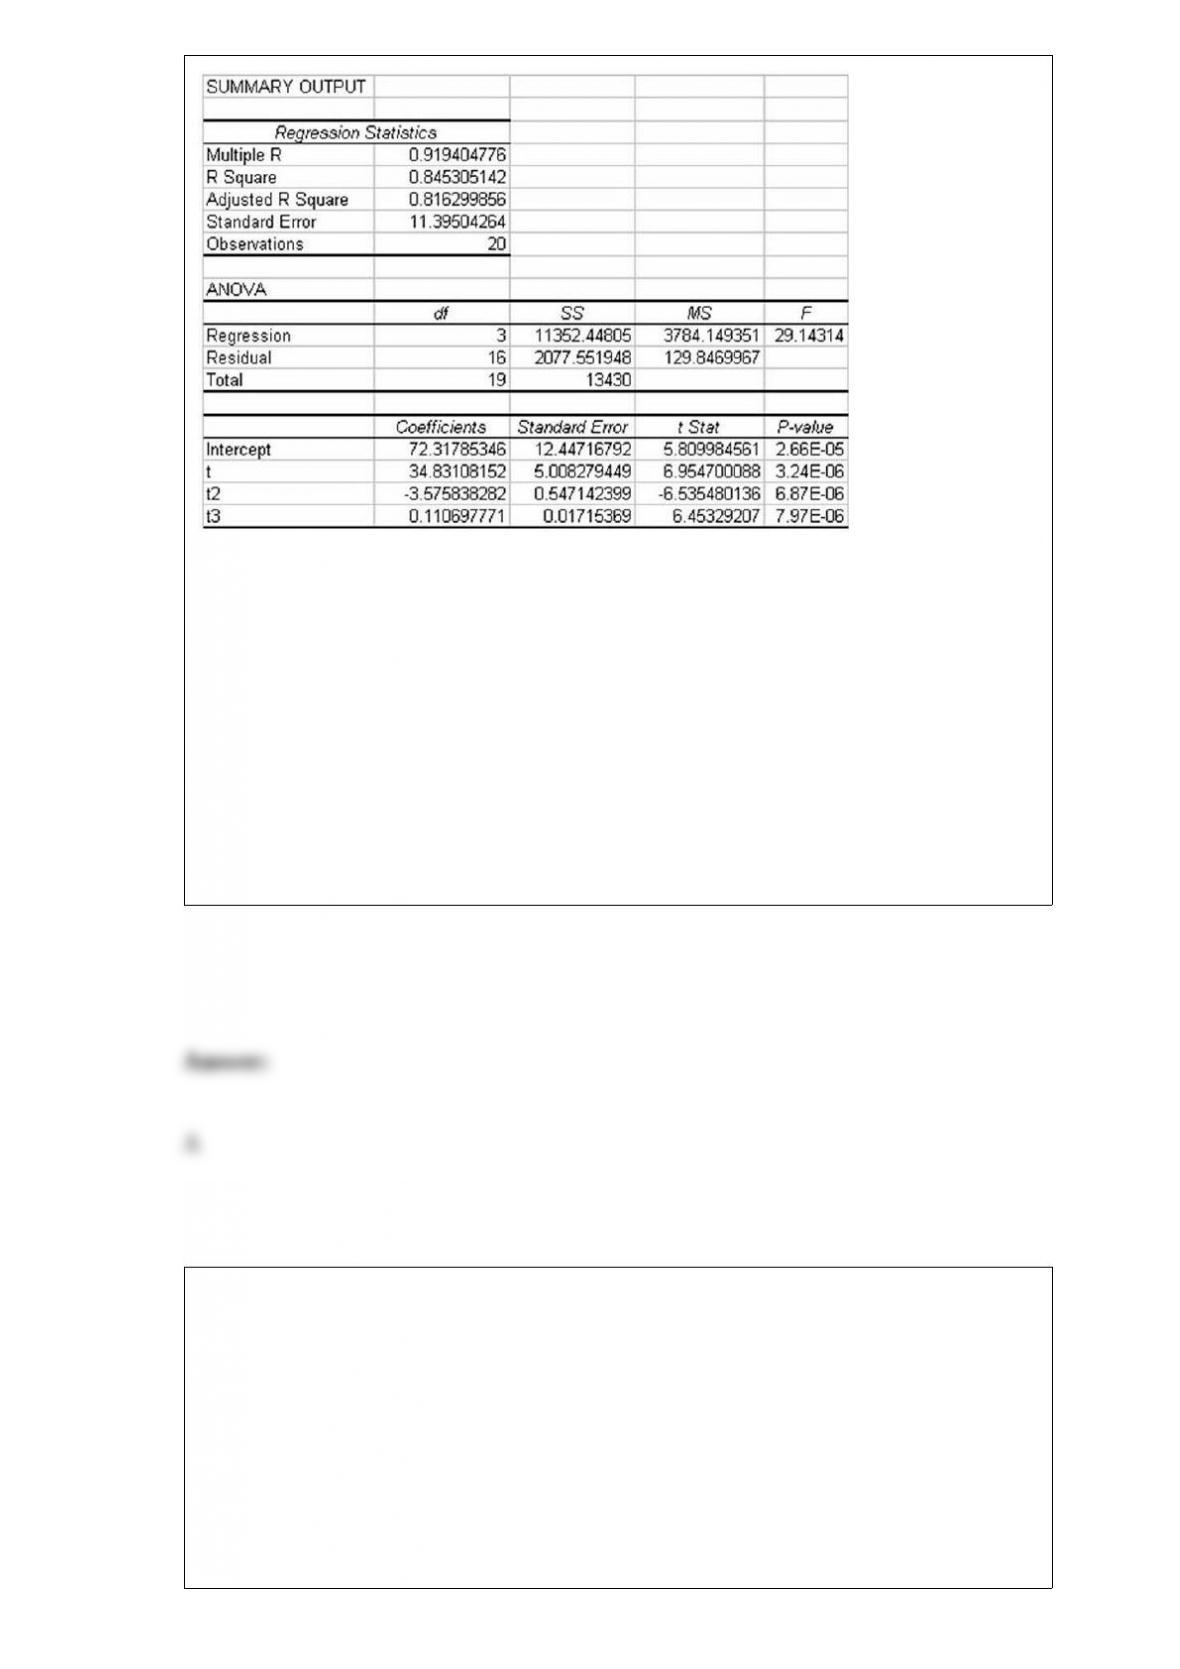
The variables t, t2, and t3 represent the t, t-squared, and t-cubed respectively where t is
the indicator of time from periods t = 1 to t = 20. Which of the following best describes
the type of forecasting model that has been developed?
A) A complete third-order polynomial model
B) A tri-variate smoothed regression model
C) A nonlinear trend model
D) A qualitative regression model
A production process that fills 12-ounce cereal boxes is known to have a population
standard deviation of 0.009 ounce. If a consumer protection agency would like to
estimate the mean fill, in ounces, for 12-ounce cereal boxes with a confidence level of
92% and a margin of error of 0.001, what size sample must be used?
A) 249
B) 351
C) 512
D) 211
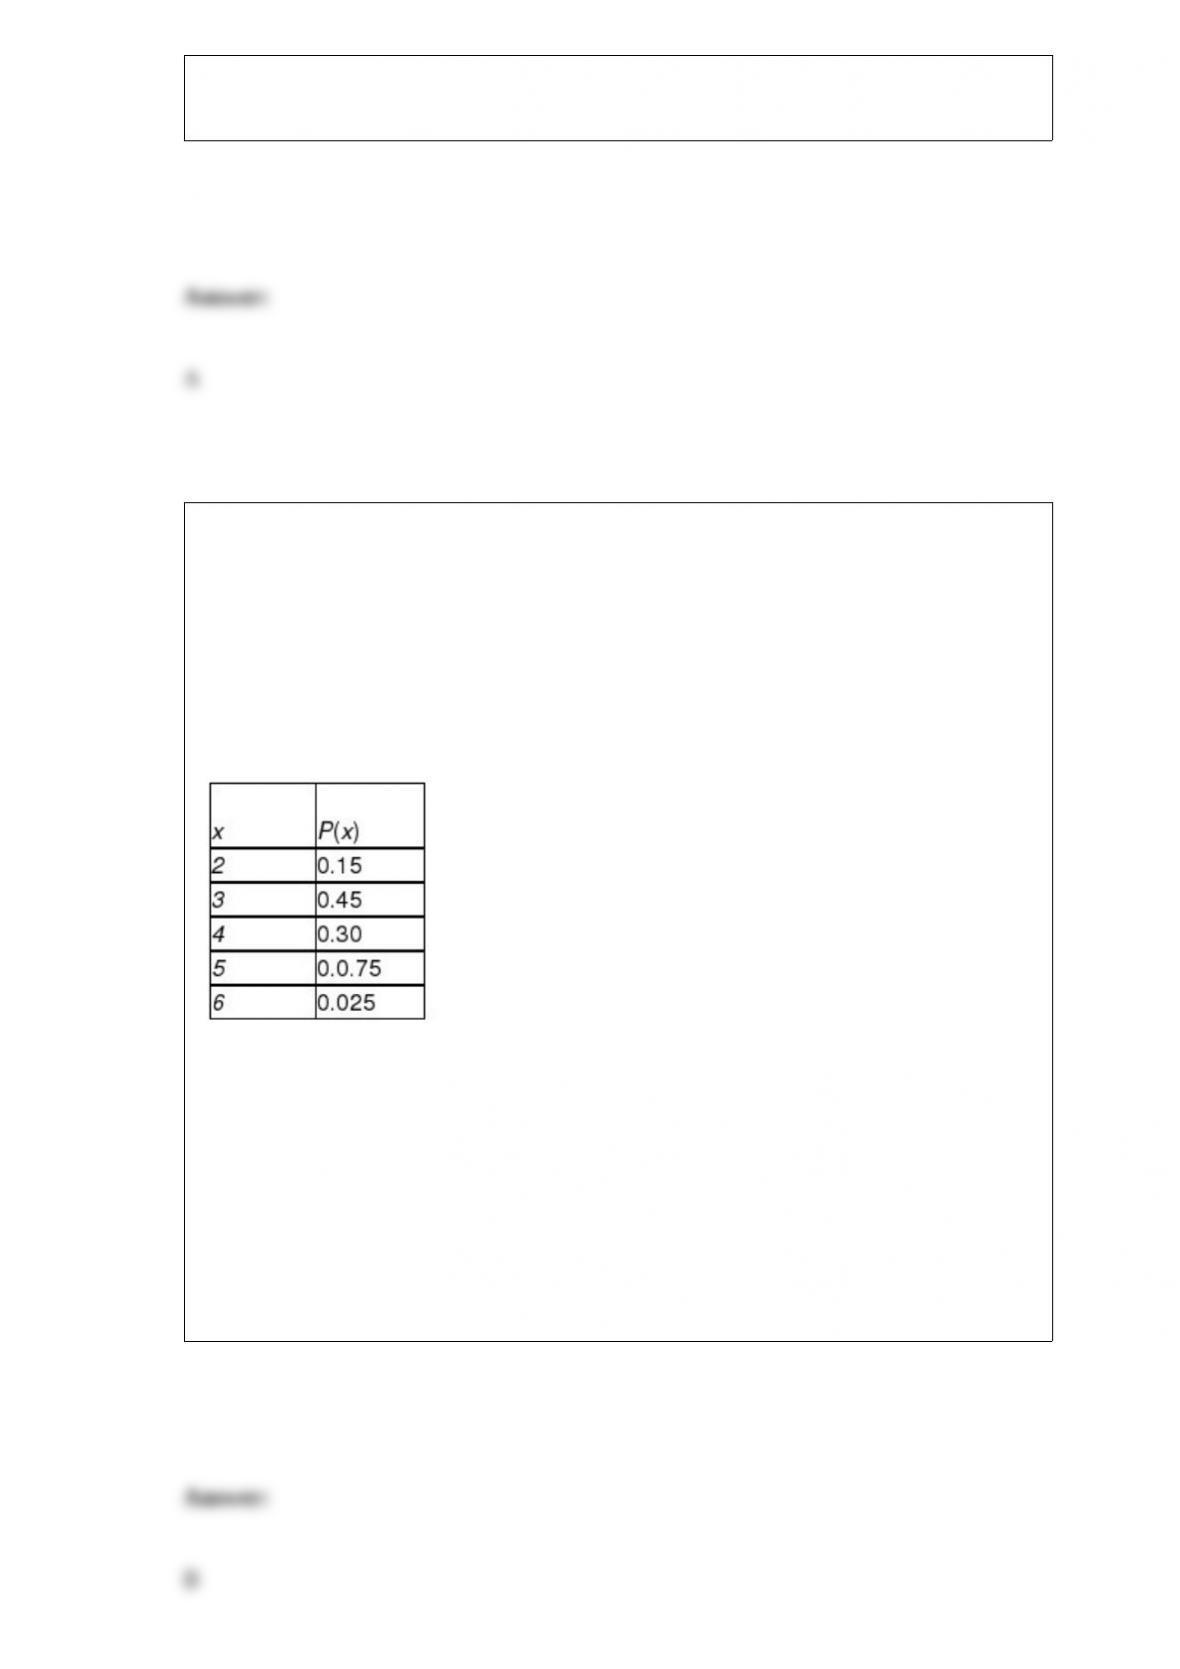
Jennings Assembly in Hartford, Connecticut, uses a component supplied by a company
in Brazil. The component is expensive to carry in inventory and consequently is not
always available in stock when requested. Furthermore, shipping schedules are such
that the lead time for transportation of the component is not a constant. Using historical
records, the manufacturing firm has developed the following probability distribution for
the product’s lead time. The distribution is shown here, where the random variable is the
number of days between the placement of the replenishment order and the receipt of the
item.
What is the coefficient of variation for delivery lead time?
A) 38.461%
B) 27.065%
C) 27.891%
D) 31.772%
The URS construction company has submitted two bids, one to build a large hotel in
London and the other to build a commercial office building in New York City. The
company believes it has a 40% chance of winning the hotel bid and a 25% chance of
winning the office building bid. The company also believes that winning the hotel bid is
independent of winning the office building bid.
What is the probability the company will win both contracts?
A) 0.55
B) 0.44
C) 0.10
D) 0.75
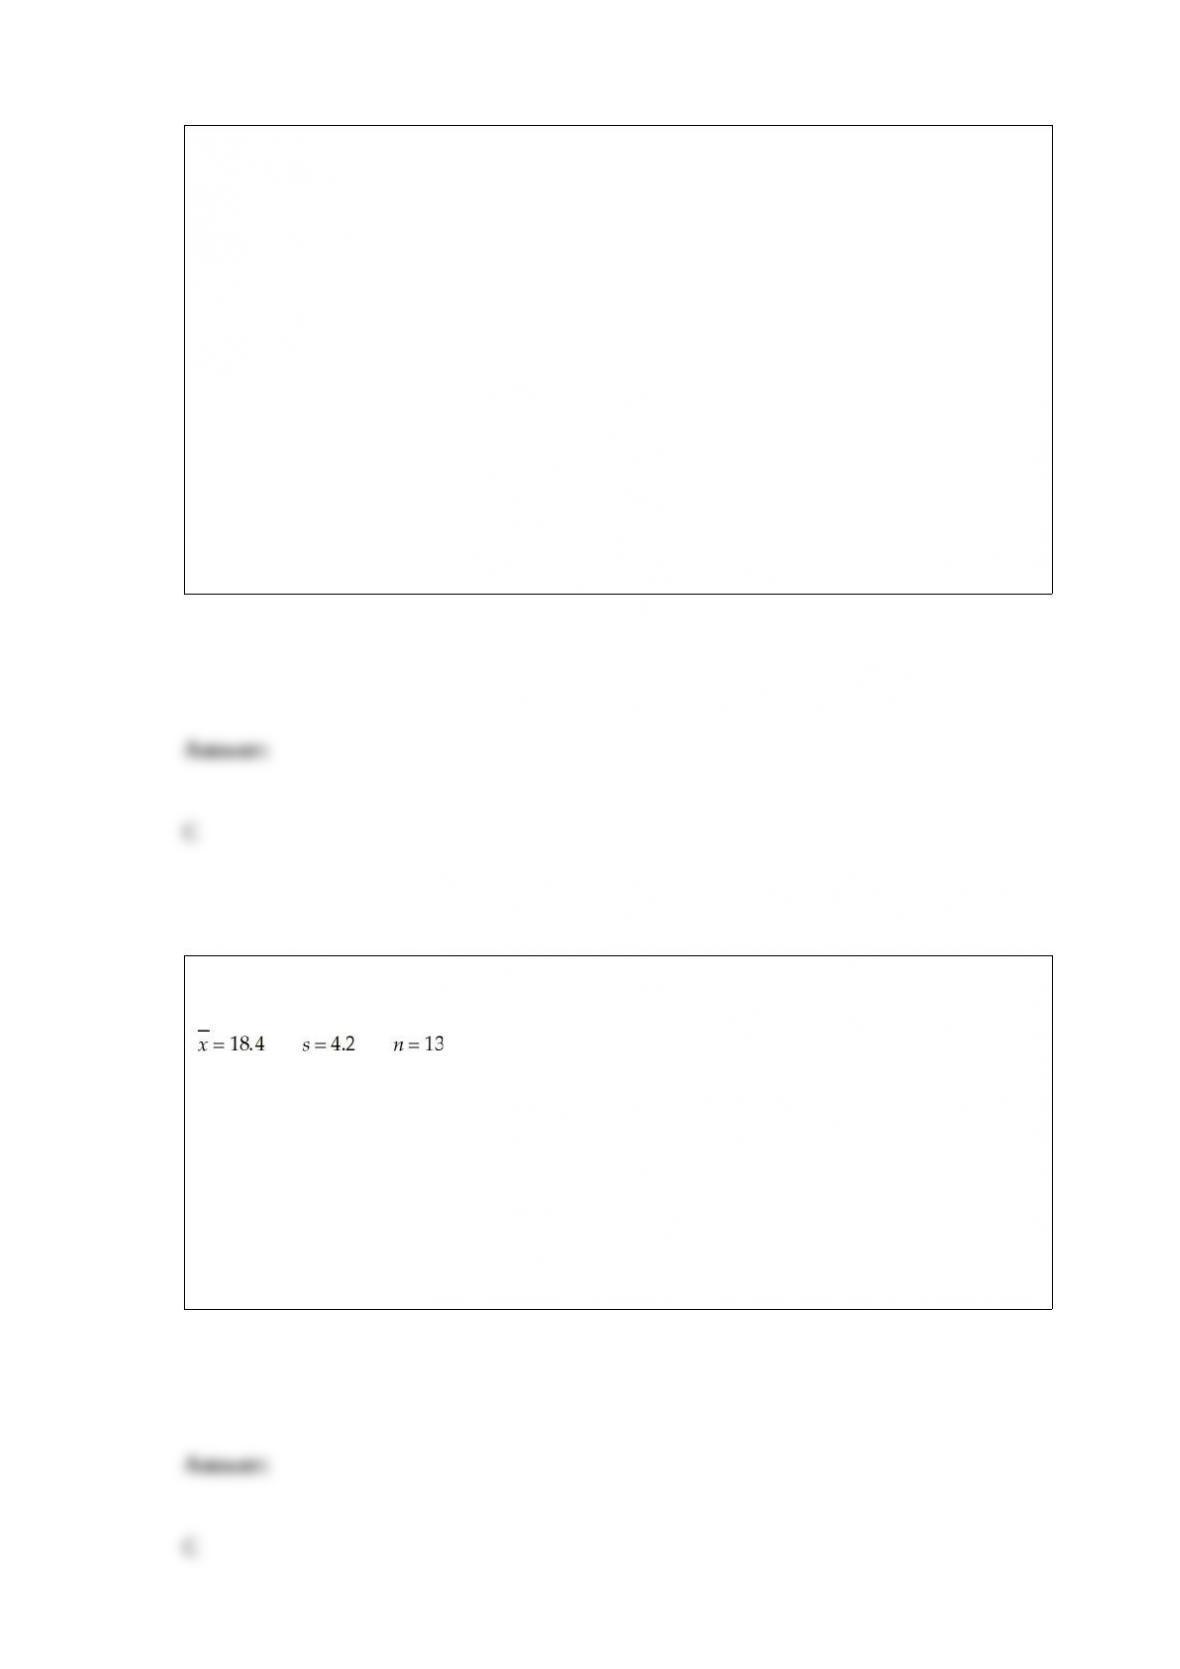
Assuming the population of interest is approximately normally distributed, construct a
95% confidence interval estimate for the population mean given the following values:
A) (16.73, 20.07)
B) (13.22, 23.58)
C) (15.86, 20.94)
D) (14.20, 22.60)

To determine the aptness of the model, which of the following would most likely be
performed?
A) Check to see whether the residuals have a constant variance
B) Determine whether the residuals are normally distributed
C) Check to determine whether the regression model meets the assumption of linearity
D) All of the above
Arrivals to a bank automated teller machine (ATM) are distributed according to a
Poisson distribution with a mean equal to three per 15 minutes.Determine the
probability that in a given 15-minute segment no customers will arrive at the ATM.
A) 0.0124
B) 0.0281
C) 0.0314
D) 0.0498
A consumer products company is planning to introduce a new product. The method that
is least likely to be used to assess the probability of the product being successful is:

A) classical probability assessment.
B) subjective assessment.
C) relative frequency of occurrence.
D) elementary events.
In the annual report, a major food chain stated that the distribution of daily sales at its
Detroit stores is known to be bell-shaped, and that 95 percent of all daily sales fell
between $19,200 and $36,400. Based on this information, what were the mean sales?
A) Around $20,000
B) Close to $30,000
C) Approximately $27,800
D) Can’t be determined without more information.
A company that sells an online course aimed at helping high-school students improve
their SAT scores has claimed that SAT scores will improve by more than 90 points on
average if students successfully complete the course. To test this, a national school
counseling organization plans to select a random sample of n = 100 students who have
previously taken the SAT test. These students will take the company’s course and then
retake the SAT test. Assuming that the population standard deviation for improvement

in test scores is thought to be 30 points and the level of significance for the hypothesis
test is 0.05, find the critical value in terms of improvement in SAT points, which would
be needed prior to finding a beta.
A) Reject the null if SAT improvement is > 95 points.
B) Reject the null if SAT improvement is < 85.065 points.
C) Reject the null if SAT improvement is > 95.88 points.
D) Reject the null if SAT improvement is > 94.935 points.
A population with a mean of 1,250 and a standard deviation of 400 is known to be
highly skewed to the right. If a random sample of 64 items is selected from the
population, what is the probability that the sample mean will be less than 1,325?
A) 0.8981
B) 0.8141
C) 0.7141
D) 0.9332
The asking price for homes on the real estate market in Baltimore has a mean value of
$286,455 and a standard deviation of $11,200. The mean and standard deviation in
asking price for homes in Denver are $188,468 and $8,230, respectively. Recently, one
home sold in each city where the asking price for each home was $193,000. Assuming
that both distributions are bell-shaped, which of the following statements is true?
A) The Baltimore home has the higher standard z-value.
B) The coefficient of variation for Denver is less than for Baltimore.
C) The Denver home has a higher standard z-value.
D) Both cities have the same coefficient of variation.
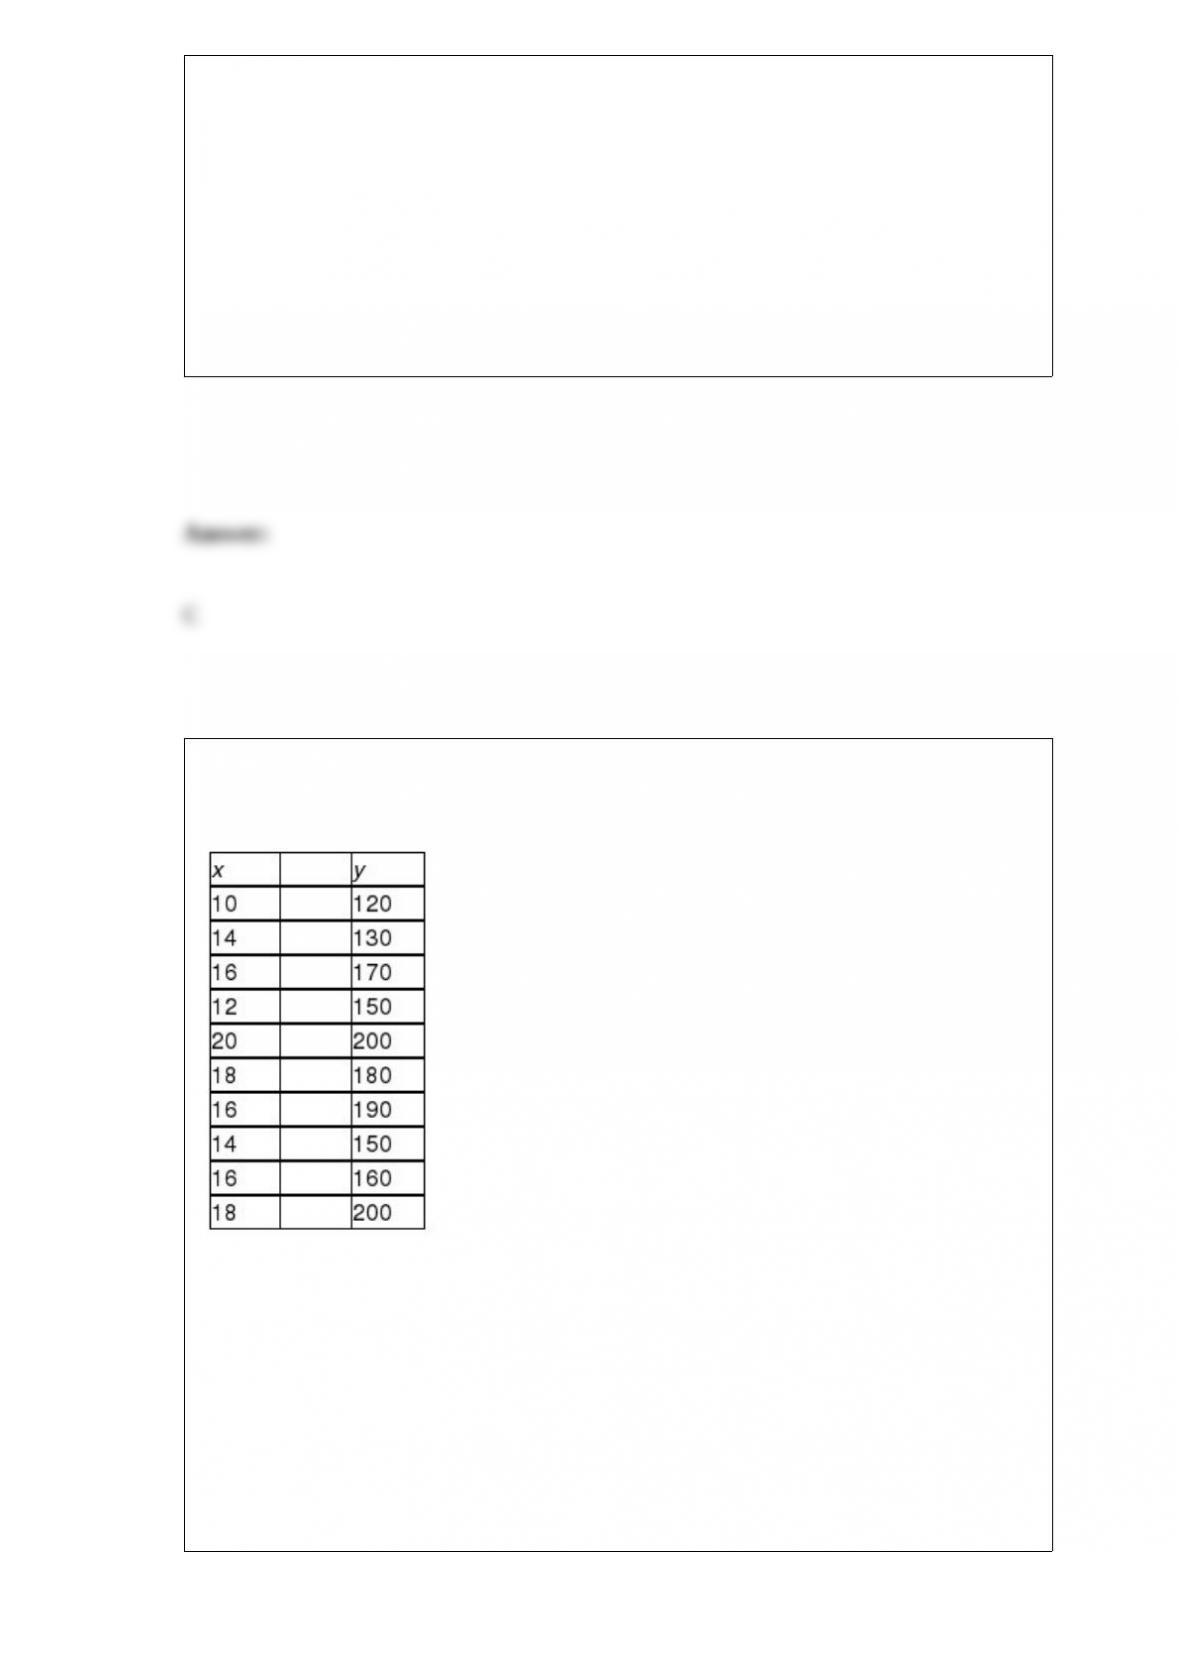
The following data for the dependent variable, y, and the independent variable, x, have
been collected using simple random sampling:
Compute the correlation coefficient.
A) 0.52
B) 0.71
C) 0.62
D) 0.89

Which of the following regression output values is used in computing the variance
inflation factors?
A) The standard error of the estimate
B) The regression intercept value
C) The F critical value from the F distribution for the appropriate number of degrees of
freedom and the appropriate level of significance
D) The R-squared value
For a standardized normal distribution, determine a value, say z0, so that P(-z0 ≤ z ≤ z0)
= 0.95.
A) 2.14
B) 1.65
C) 1.96
D) 1.24

After completing sales training for a large company, it is expected that the salesperson
will generate a sale on at least 15 percent of the calls he or she makes. To make sure
that the sales training process is working, a random sample of n = 400 sales calls made
by sales representatives who have completed the training have been selected and the
null hypothesis is to be tested at 0.05 alpha level. Suppose that a sale is made on 36 of
the calls. Based on this information, what is the test statistic for this test?
A) Approximately 0.1417
B) About z = -3.35
C) z = -1.645
D) t = -4.567
A study has indicated that the sample size necessary to estimate the average electricity
use by residential customers of a large western utility company is 900 customers.
Assuming that the margin of error associated with the estimate will be 30 watts and the
confidence level is stated to be 90 percent, what was the value for the population
standard deviation?
A) 265 watts
B) Approximately 547.1 watts
C) About 490 watts
D) Can’t be determined without knowing the size of the population.

Which of the following statements is true with respect to a simple linear regression
model?
A) The regression slope coefficient is the square of the correlation coefficient.
B) The percentage of variation in the dependent variable that is explained by the
independent variable can be determined by squaring the correlation coefficient.
C) It is possible that the correlation between a y and x variable might be statistically
significant, but the regression slope coefficient could be determined to be zero since
they measure different things.
D) The standard error of the estimate is equal to the standard error of the slope.