
To employ ANOVA, the populations being studied must be approximately normally
distributed.
A marketing research agency was hired to test a new DVD player. Consumers rated it
outstanding, very good, fair, or poor. The level of measurement for this experiment is
ordinal.
Non-stop Airlines determined that the mean number of passengers per flight is 152 with
a standard deviation of 10 passengers. Practically all flights have between 142 and 162
passengers.

Stepwise regression analysis is a method that assists in selecting the most significant
variables for a multiple regression equation.
The probability of rolling a 3 or 2 on a single die is an example of conditional
probability.
When using stratified random sampling, the sampling error will be zero.

The standard error of the mean is also called sampling error.
If we are testing for the difference between two population means and assume that the
two populations have equal and unknown standard deviations, the degrees of freedom
are computed as (n1)(n2) – 1.
The standard error of estimate measures the accuracy of a prediction.

To employ ANOVA, the populations should have approximately equal standard
deviations.
The standard error of the mean measures the dispersion of the sampling distribution of
the sample mean.
In frequency distributions, classes are mutually exclusive if each individual, object, or
measurement is included in only one category.
An alternate hypothesis is a statement about a population parameter that is accepted
when the null hypothesis is rejected.

When referring to the normal probability distribution, there is not just one; there is a
“family” of normal probability distributions.
The midpoint of a class, which is also called a class mark, is halfway between the lower
and upper limits.
If the null hypothesis is false and the researchers do not reject it, a Type I error has been
made.

A random variable represents the outcome of an experiment.
In multiple regression analysis, an F-statistic is used to test the global hypothesis, H0:
.
If we want to determine which treatment means differ, we compute a confidence
interval for the difference between each pair of means.
There are four levels of measurement: qualitative, quantitative, discrete, and
continuous.

A dot plot is an easy way to represent the relationship between two variables.
The mode is the value of the observation that appears most frequently.
The hypothesis to test the slope of a regression equation is H0: α = 0.

A scatter plot is a useful graphical method to determine if a set of sample data is from a
normal population.
For a set of data arranged or sorted in numerical order, the value of the observation in
the center is called the weighted mean.
An example of a hypothesis is: A person is innocent until proven guilty.

The claim that “male and female students at Coastal Carolina University prefer different
parking lots on campus” is an example of a chi-square null hypothesis.
The “box” in a box plot shows the interquartile range.
A t-statistic is useful for computing an expected normal distribution.

A scatter diagram of sales versus production may be constructed by plotting the
minimum, first quartile, median, third quartile, and the maximum values of each
variable.
In cluster sampling, a population is divided into subgroups called clusters and a sample
is randomly selected from each cluster.
If there are “m” ways of doing one thing, and “n” ways of doing another thing, the
multiplication formula states that there are (m) (n) ways of doing both.
To convert a frequency distribution to a relative frequency distribution, divide each
class frequency by the sum of the class frequencies.
The alternate hypothesis can be accepted only if the null hypothesis is shown to be
_________.
A scatter diagram of sales versus production is labeled with sales on the Y-axis and
production on the X-axis.

A survey of 50 retail stores revealed that the average price of a microwave was $375,
with a sample standard deviation of $20. Assuming the population is normally
distributed, what is the 95% confidence interval to estimate the true cost of the
microwave?
A. $323.40 to $426.60
B. $328.40 to $421.60
C. $350.80 to $395.80
D. $369.31 to $380.69
The annual commissions per salesperson employed by a retailer of mobile
communication devices averaged $40,000, with a standard deviation of $5,000. What
percent of the salespersons earn between $32,000 and $42,000?
A. 60.06%
B. 39.94%
C. 34.13%
D. 81.66%
A survey of 25 grocery stores revealed that the mean price of a gallon of milk was
$2.98, with a standard error of $0.10. What is the 95% confidence interval to estimate
the true cost of a gallon of milk?
A. $2.81 to $3.15
B. $2.94 to $3.02
C. $2.77 to $3.19
D. $2.95 to $3.01
A machine shop has 100 drill presses and other machines in constant use. The
probability that a machine will become inoperative during a given day is 0.002. During
some days, no machines are inoperative, but during some days, one, two, three, or more
are broken down. What is the probability that fewer than two machines will be
inoperative during a particular day?
A. 0.0200

B. 0.1637
C. 0.8187
D. 0.9824
An F statistic is __________.
A. A ratio of two means
B. A ratio of two variances
C. The difference between three means
D. A population parameter
What is the difference between a sample mean and the population mean called?
A. Standard error of the mean
B. Sampling error
C. Interval estimate
D. Point estimate
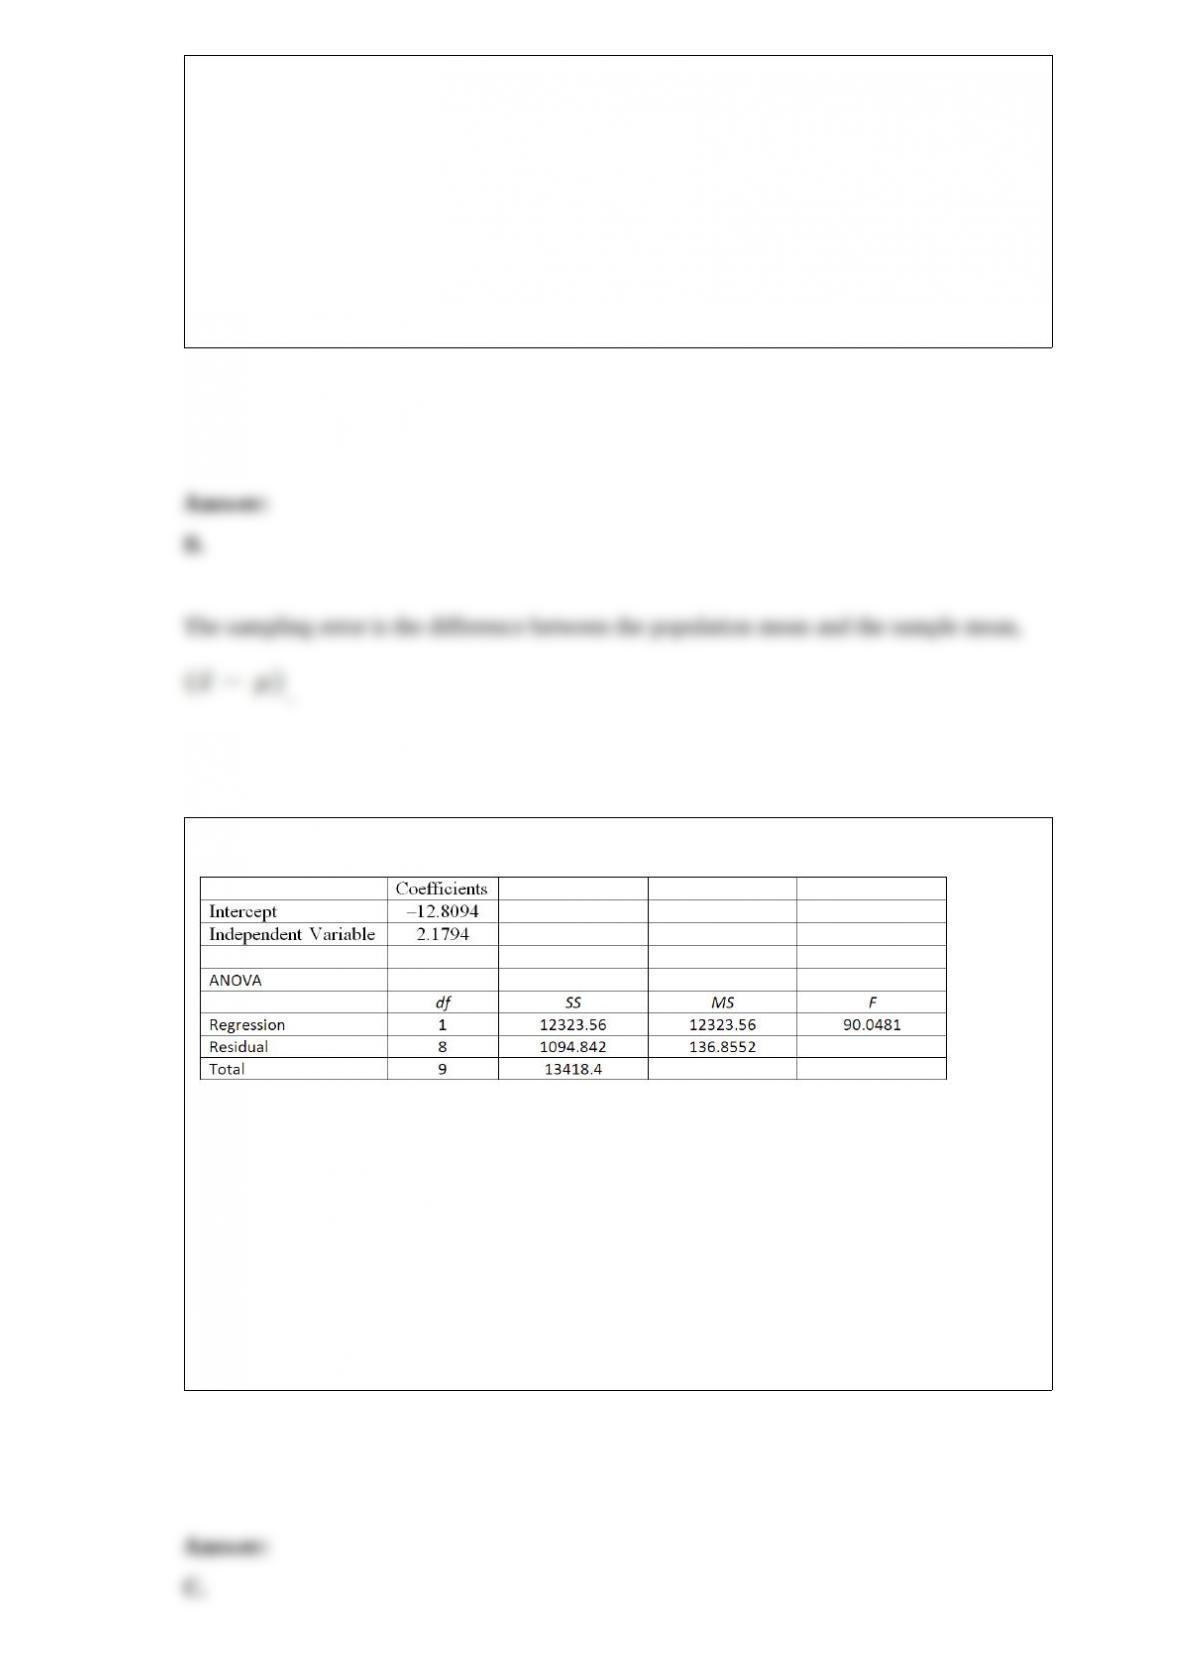
Using the following information:
What is the standard error of the estimate?
A. 136.8552
B. 1094.842
C. 11.6985
D. 13418.4
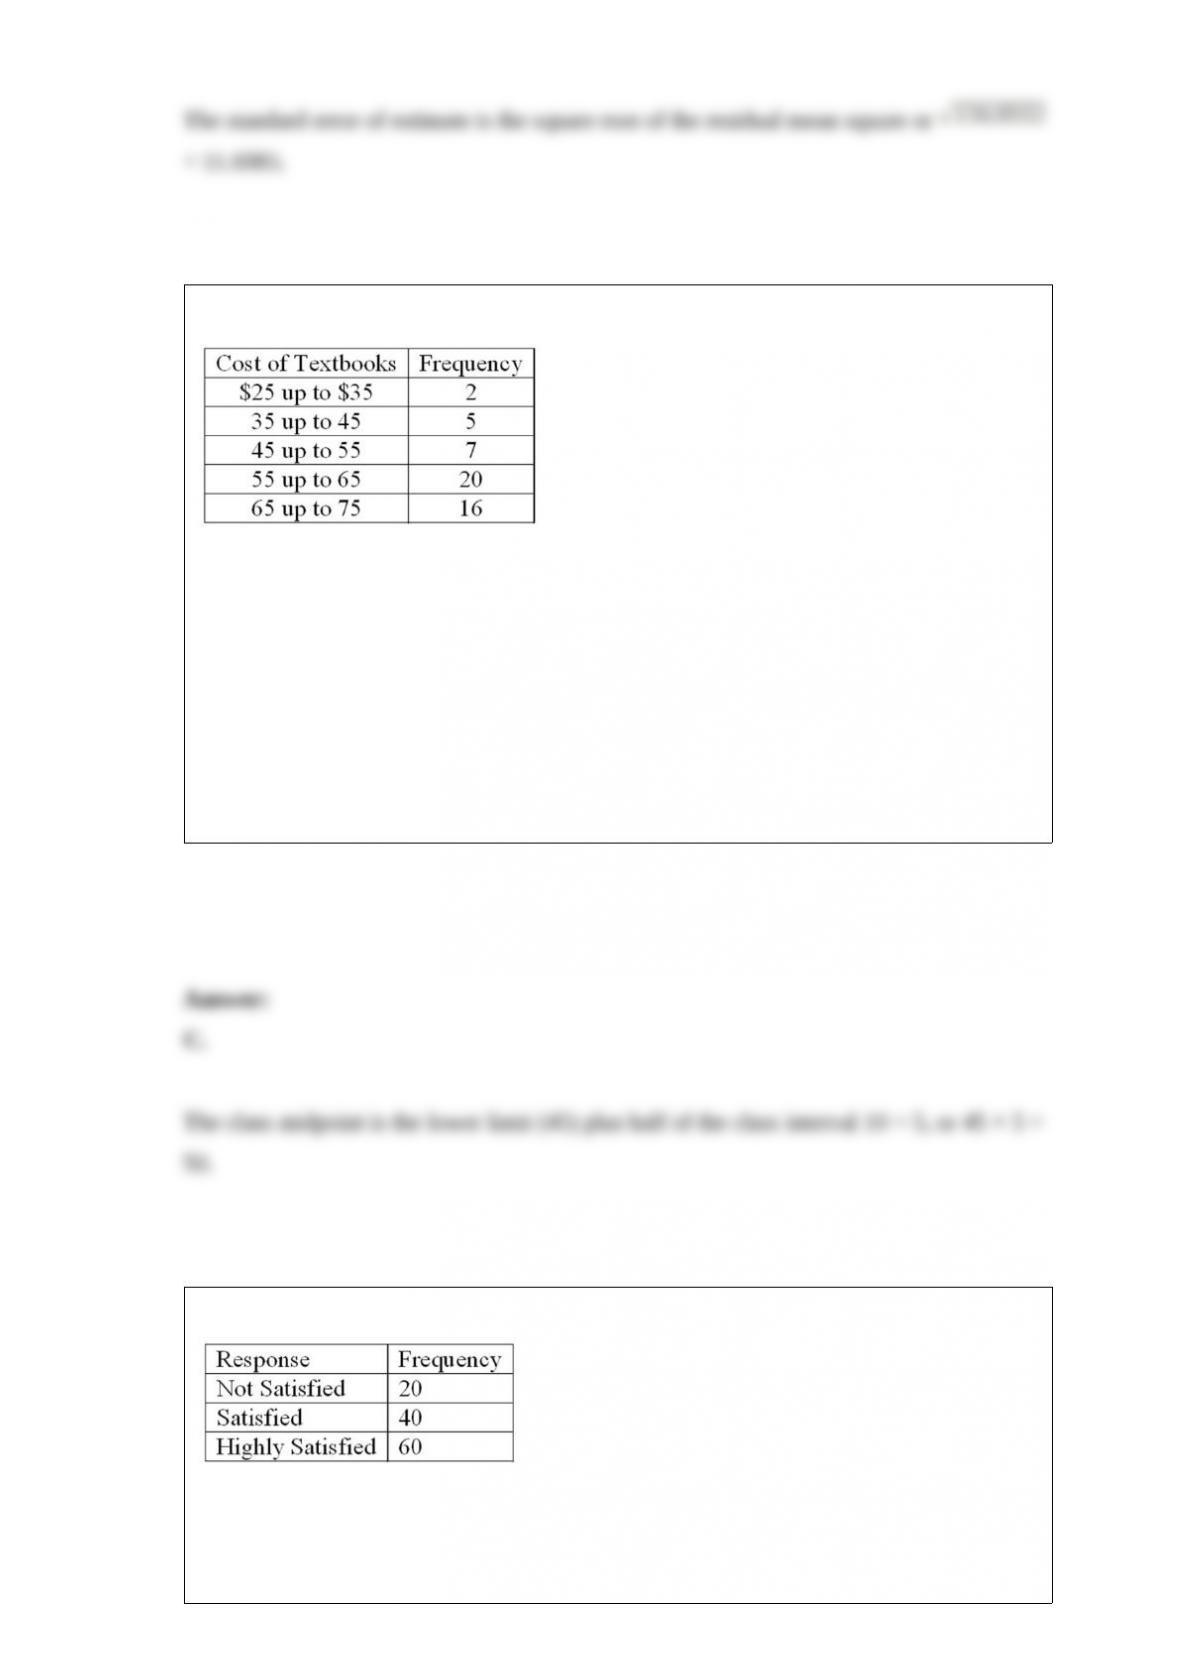
Refer to the following distribution:
What is the class midpoint for the $45 up to $55 class?
A. 49
B. 49.5
C. 50
D. 50.5
Refer to the following breakdown of responses to a survey of room service in a hotel.
What percent of the responses indicated that customers were satisfied?
A. 40%

B. 33%
C. 50%
D. 100%
We test for a hypothesized difference between two population means: H0: μ1 = μ2. The
population standard deviations are unknown but assumed equal. The number of
observations in the first sample is 15, and 12 in the second sample. How many degrees
of freedom are associated with the critical value?
A. 24
B. 25
C. 26
D. 27
A new car was put into production. It involved many assembly tasks. Each car was
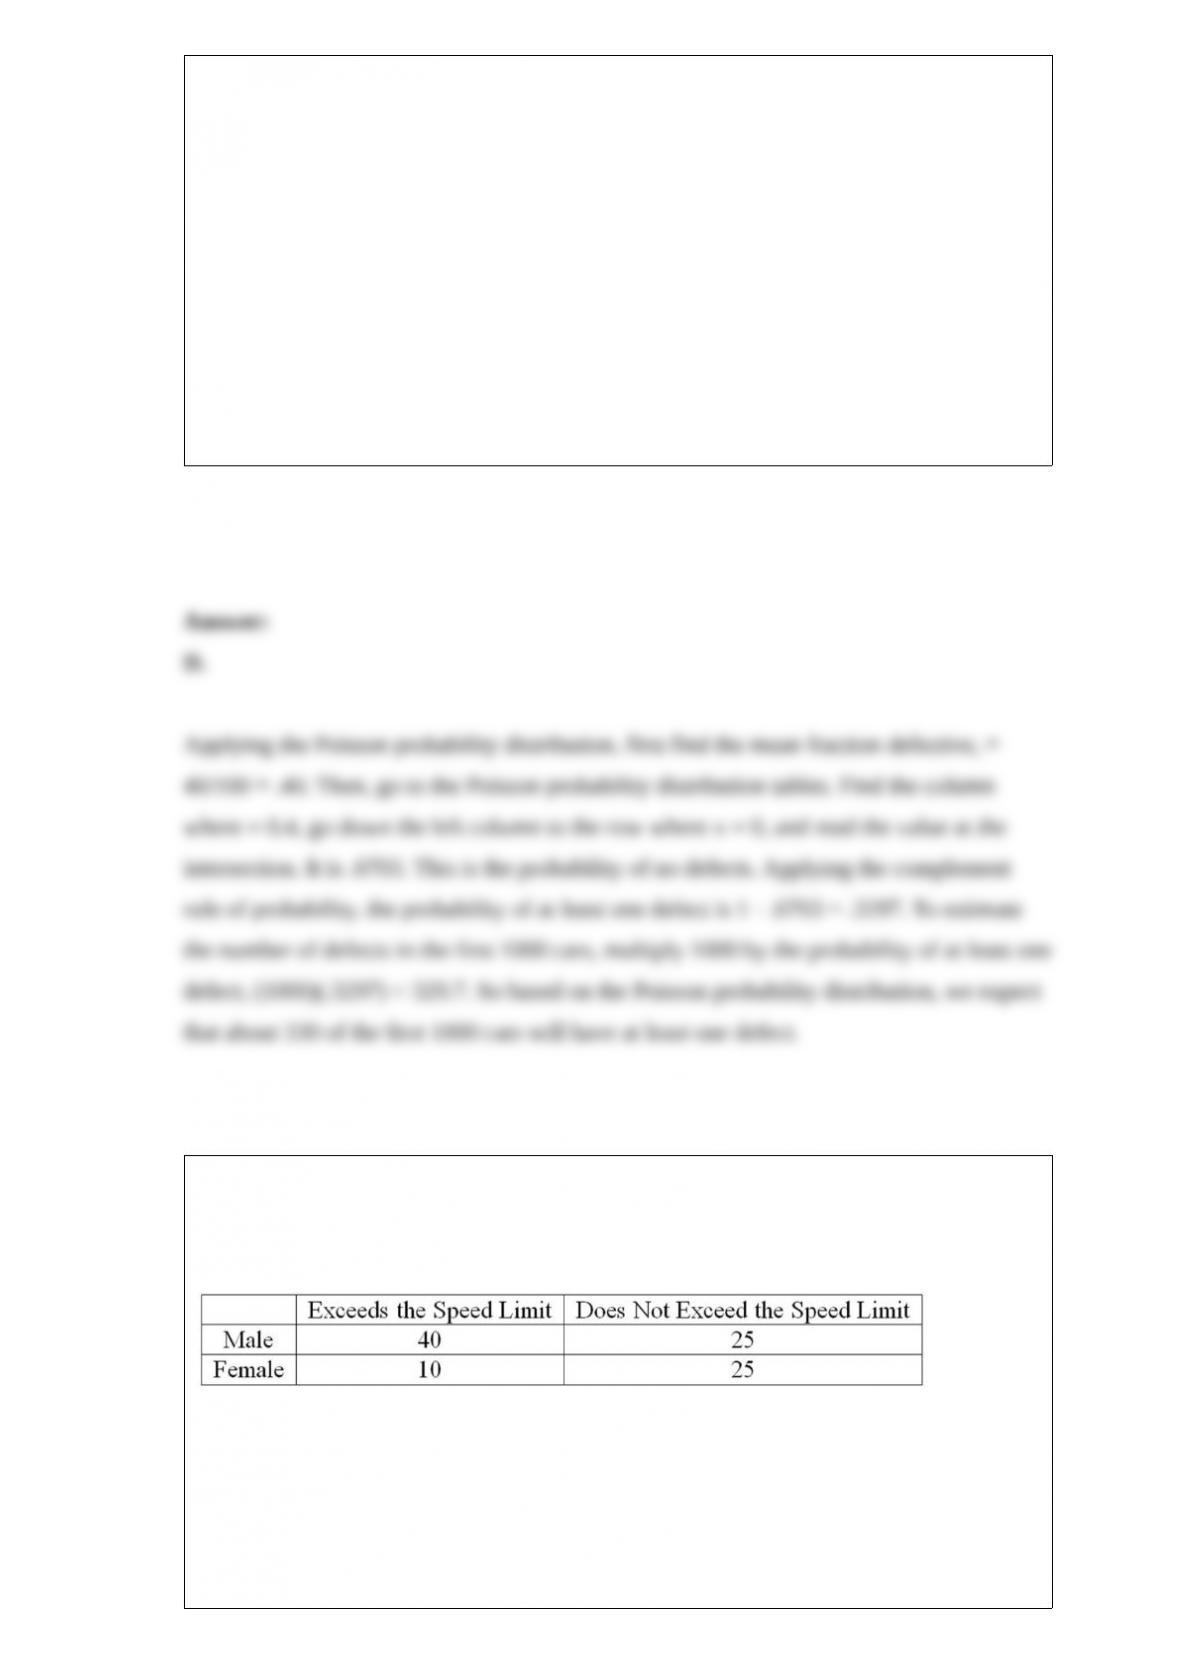
inspected at the end of the assembly line and the number of defects per unit was
recorded. For the first 100 cars produced, there were 40 defective cars. Some of the cars
had no defects, a few had one defect, and so on. The distribution of defects followed a
Poisson distribution. Based on the first 100 cars produced, about how many out of
every 1,000 cars assembled should have one or more defects?
A. About 660
B. About 165
C. About 630
D. About 330
Recently, students in a marketing research class were interested in the driving behavior
of students. Specifically, the marketing students were interested in finding out if
exceeding the speed limit was related to social activity. They collected the following
responses from 100 randomly selected students:
The degrees of freedom for the analysis are ________.
A. 1
B. 2

C. 3
D. 4
If the coefficient of skewness is equal to zero, the shape of the distribution is
__________.
A. Negatively skewed
B. Symmetric
C. Positively skewed
D. Unknown
The order that runners finish in a race would be an example of continuous data.

What is a unique characteristic of the mean deviation?
A. It is based on only two observations.
B. It is based on deviations from the mean.
C. It uses absolute values.
D. It is only applied to skewed distributions.
For a sample of similar sized all-electric homes, the March electric bills were (to the
nearest dollar): $212, $191, $176, $129, $106, $92, $108, $109, $103, $121, $175, and
$194. What is the range?
A. $100
B. $130
C. $120
D. $112

When testing the difference between two population means, the sample variances are
pooled to estimate the population variance when ________________.
A. The population variances are known and equal
B. The population means are known
C. The population variances are assumed unequal and unknown
D. The population variances are assumed equal but unknown
A recent study focused on the number of times men and women send a Twitter message
in a day. The sample information is summarized below.
At the .01 significance level, is there a difference in the mean number of times men and
women send a Twitter message in a day? What is the test statistic for this hypothesis?
A. z-statistic
B. t-statistic
C. p-statistic
D. df-statistic
Data show that the weight of an offensive linesman may be any weight between 200
and 350 pounds. The distribution of weight is based on a ______________.
A. Continuous random variable
B. Discrete random variable
C. Qualitative variable
D. All apply
A personnel manager is concerned about absenteeism. She decides to sample employee
records to determine if absenteeism is distributed evenly throughout the six-day
workweek. The null hypothesis is: Absenteeism is distributed evenly throughout the
week. The 0.01 level is to be used. The sample results are:
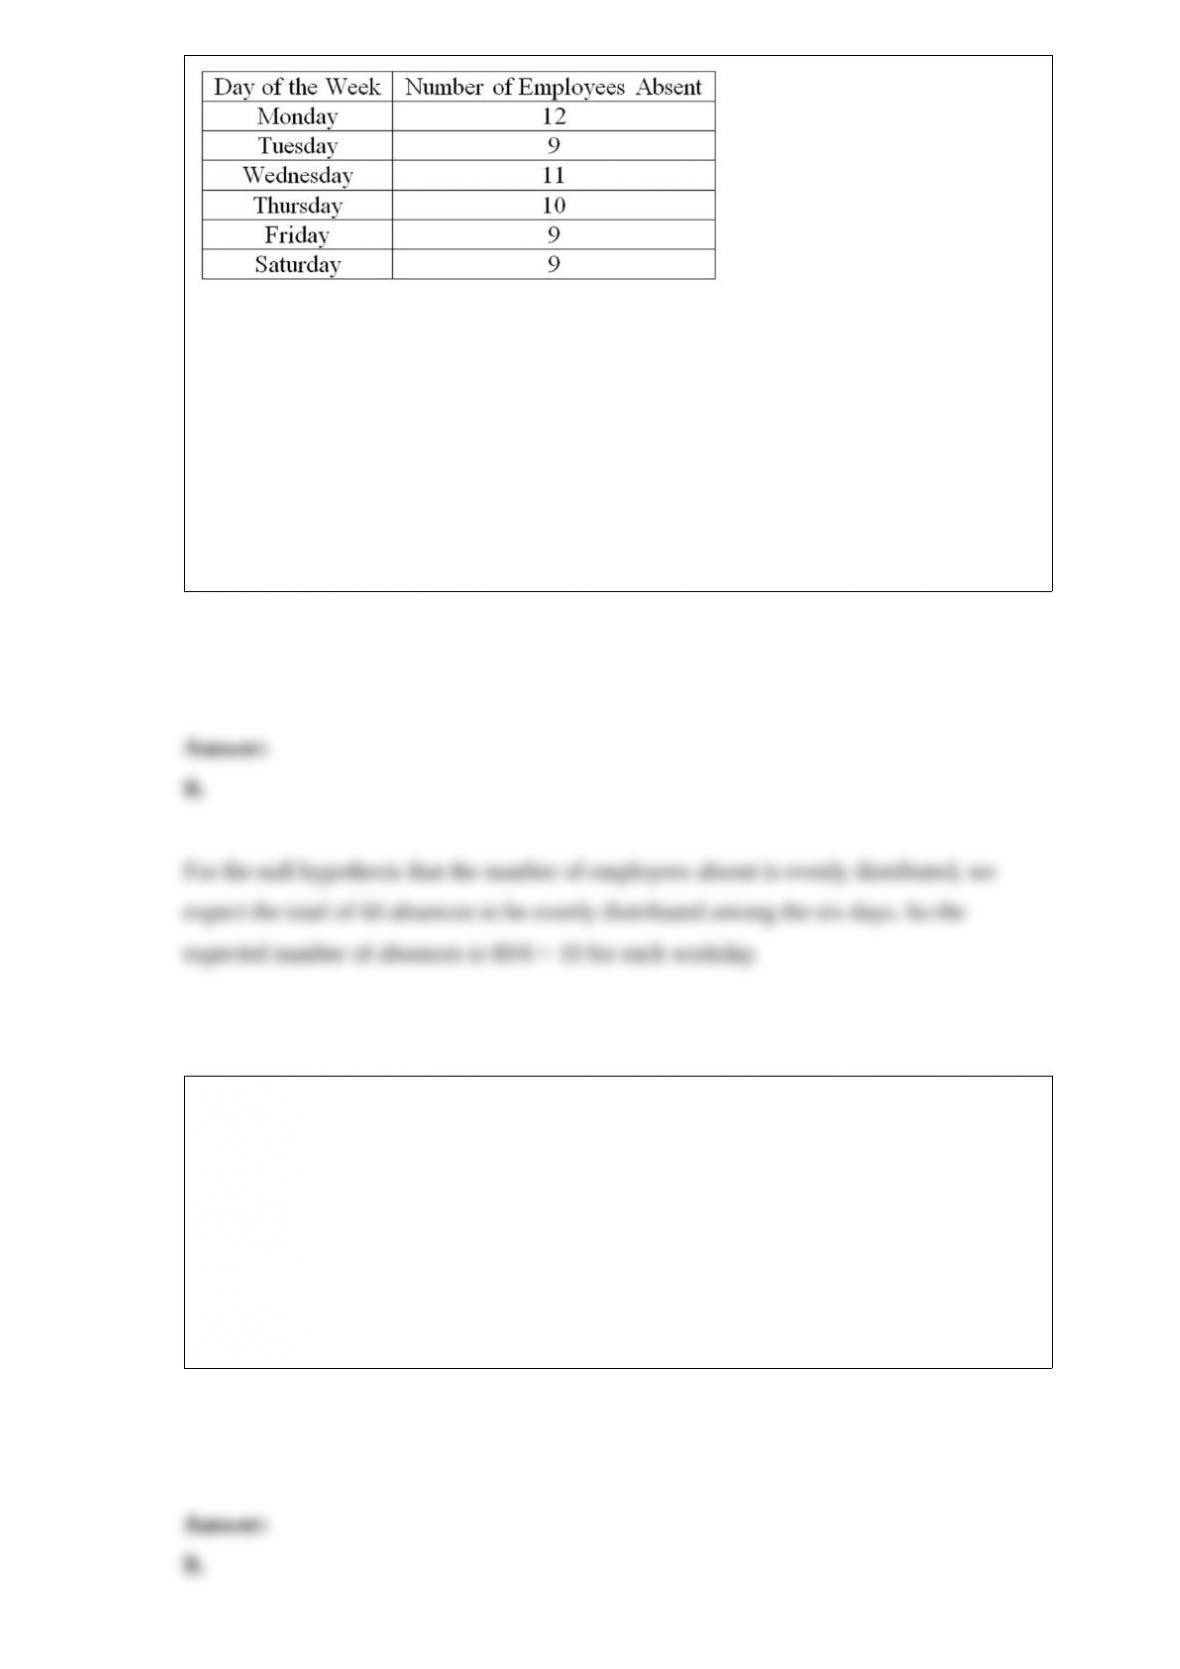
What is the expected frequency?
A. 9
B. 10
C. 11
D. 12
When are two experimental outcomes mutually exclusive?
A. When they overlap on a Venn diagram.
B. If one outcome occurs, then the other cannot.
C. When the probability of one affects the probability of the other.
D. When the joint probability of the two outcomes is not equal to zero.

The ages of all the patients in the isolation ward of the hospital are 38, 26, 13, 41, and
22. What is the population variance?
A. 106.8
B. 91.4
C. 240.3
D. 42.4
The distribution of the annual incomes of a group of middle management employees
approximated a normal distribution with a mean of $37,200 and a standard deviation of
$800. About 68% of the incomes lie between what two incomes?
A. $30,000 and $40,000
B. $36,400 and $38,000
C. $34,800 and $39,600
D. $35,600 and $38,800

Judging from recent experience, 5% of the computer keyboards produced by an
automatic, high-speed machine are defective. If six keyboards are randomly selected,
what is the probability that none of the keyboards are defective?
A. 0.001
B. 0.167
C. 0.735
D. 0.500
The average cost of tuition and room and board at small private liberal arts colleges is
reported to be $8,500 per term, but a financial administrator believes that the average
cost is higher. A study conducted using 350 small liberal arts colleges showed that the
average cost per term is $8,745. The population standard deviation is $1,200. Let α =
0.05. Based on the computed test statistic or p-value, what is our decision about the
average cost?
A. Equal to $8,500
B. Greater than $8,500
C. Less than $8,500
D. Not equal to $8,500
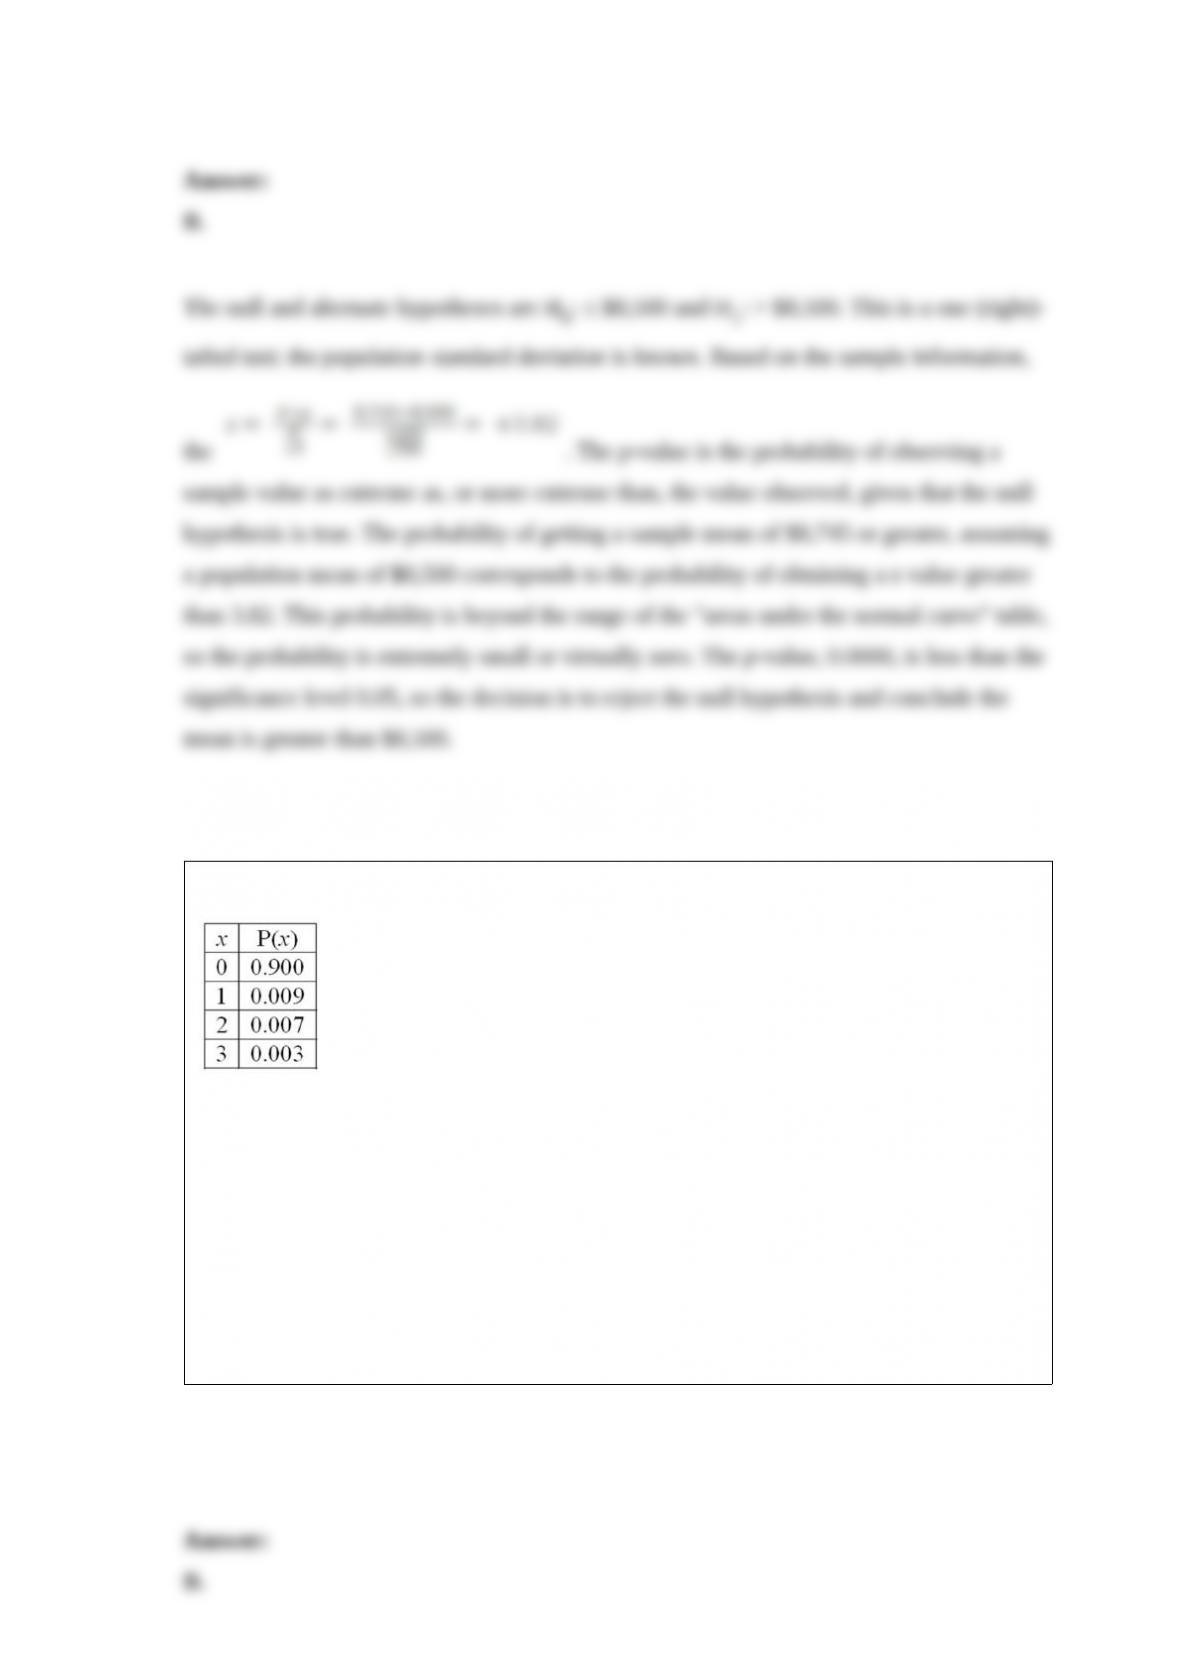
For the following distribution:
What is the variance of the distribution?
A. 2.1
B. 0.132
C. 0.364
D. 1.000

For a chi-square test involving a contingency table, suppose the null hypothesis is
rejected. We conclude that the two variables are __________.
A. Linear
B. Curvilinear
C. Not related
D. Related
The ABCD football association is considering a Super Ten Football Conference. The
top 10 football teams in the country, based on past records, would be members of the
Super Ten Conference. Each team would play every other team in the conference during
the season and the team winning the most games would be declared the national
champion. How many games would the conference commissioner have to schedule
each year? (Remember, Oklahoma versus Michigan is the same as Michigan versus
Oklahoma.)
A. 45
B. 50
C. 125
D. 14

It is claimed that in a bushel of peaches, less than 10% are defective. A sample of 400
peaches is examined and 50 are found to be defective. What is the critical value for α =
0.025?
A. +1.960
B. 1.645
C. -1.960
D. -1.645
Which symbol represents a test statistic used to test a hypothesis about a population
mean?
A. α
B. β
C. μ
D. z
From the easiest to the hardest “ease of interpretation,” rank the measures of dispersion.
A. Mode, median, mean
B. Range, mean deviation, variance
C. Variance, mean deviation, range
D. There is no difference.
What kind of distributions are the binomial and Poisson probability distributions?
A. Discrete
B. Continuous
C. Both discrete and continuous
D. Neither discrete or continuous
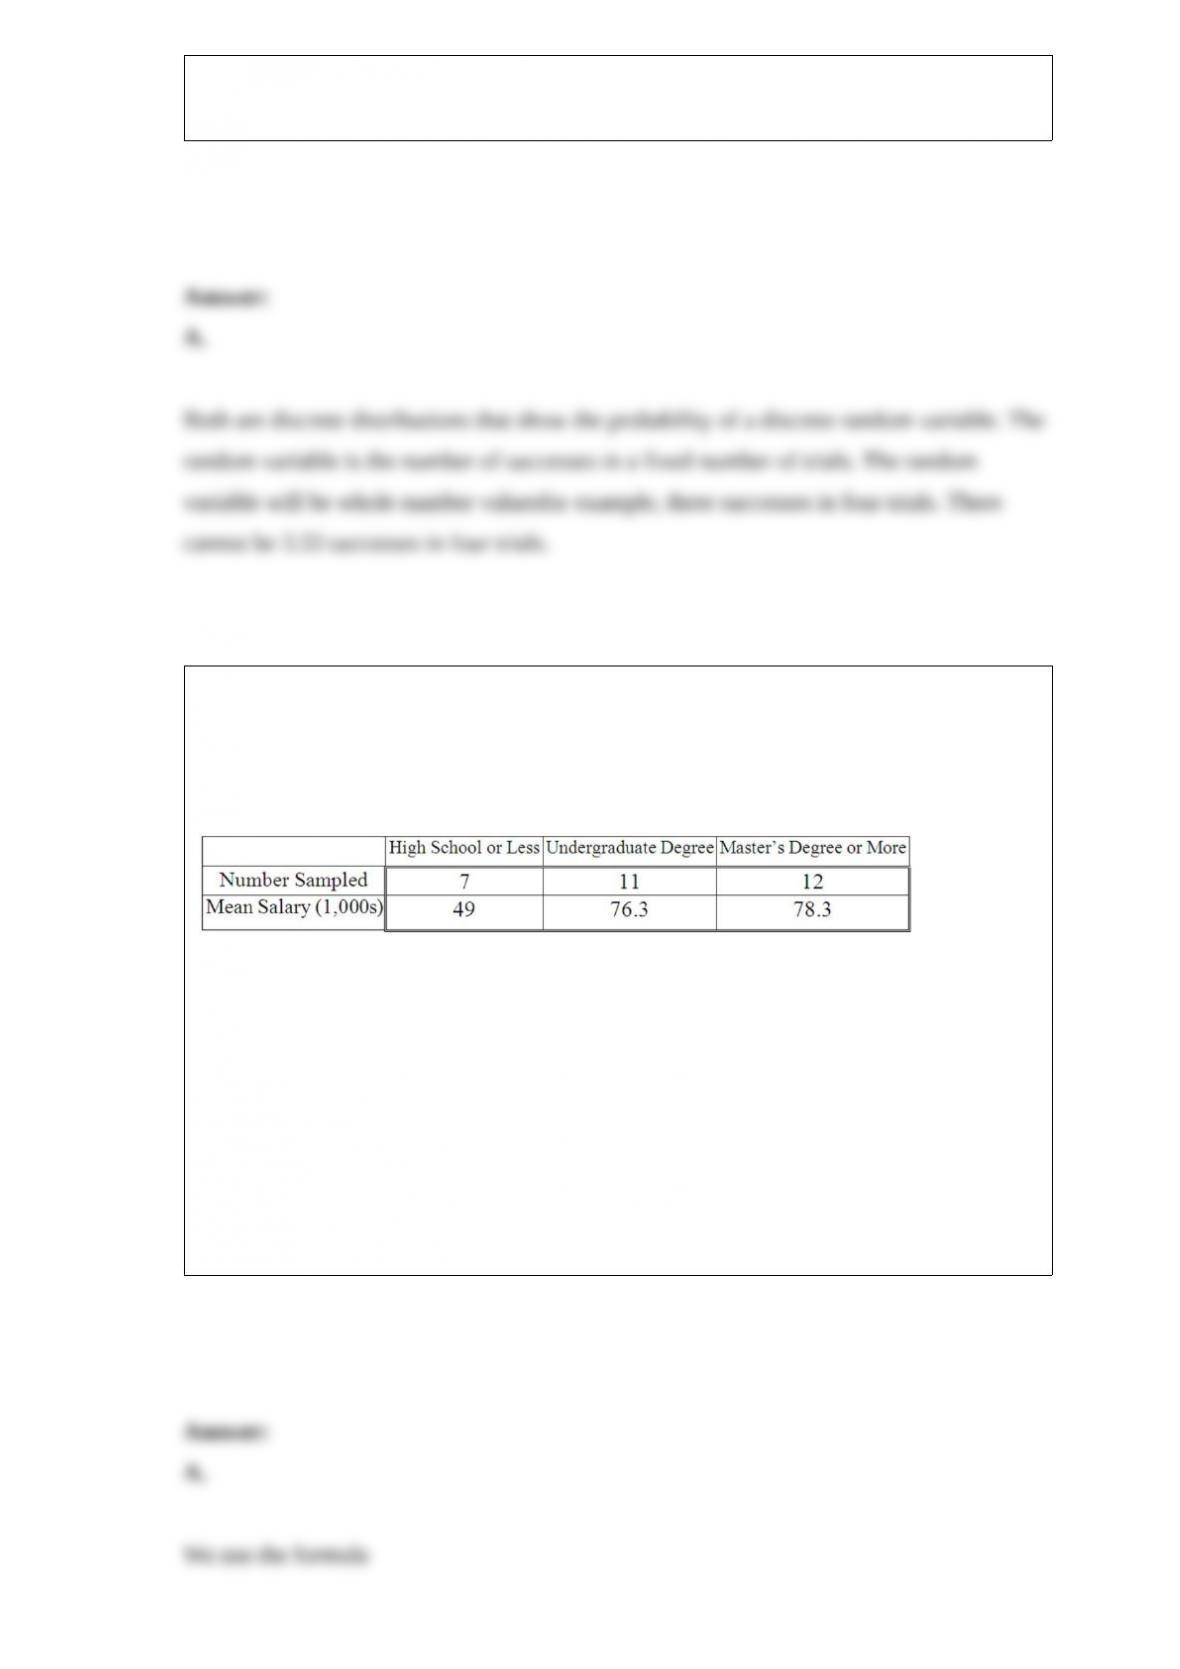
A random sample of 30 executives from companies with assets over $1 million was
selected and asked for their annual income and level of education. The ANOVA
comparing the average income among three levels of education rejected the null
hypothesis. The Mean Square Error (MSE) was 243.7. The following table summarized
the results:
When comparing the mean annual incomes for executives with undergraduate and
master’s degrees or more, the following 95% confidence interval can be constructed:
A. 2.0 2.052 * 6.52
B. 2.0 3.182 * 6.52
C. 2.0 2.052 * 42.46
D. 2.0 3.182 * 42.46
The main purpose of descriptive statistics is to:
A. Summarize data in a useful and informative manner.
B. Make inferences about a population.
C. Determine if the data adequately represents the population.
D. Gather or collect data.
The American Auto Association reports the mean price per gallon of regular gasoline is
$3.10, with a population standard deviation of $0.20. Assume a random sample of 16
gasoline stations is selected and their mean cost for regular gasoline is computed. What
is the likelihood the sample mean is greater than $3.08?
A measured or observed activity is called a(n) ___________.
Other things being equal, a smaller sample size would result in a wider confidence
interval because the standard error of the mean is ______________.
The _______________ principle is applied when calculating the regression coefficients.
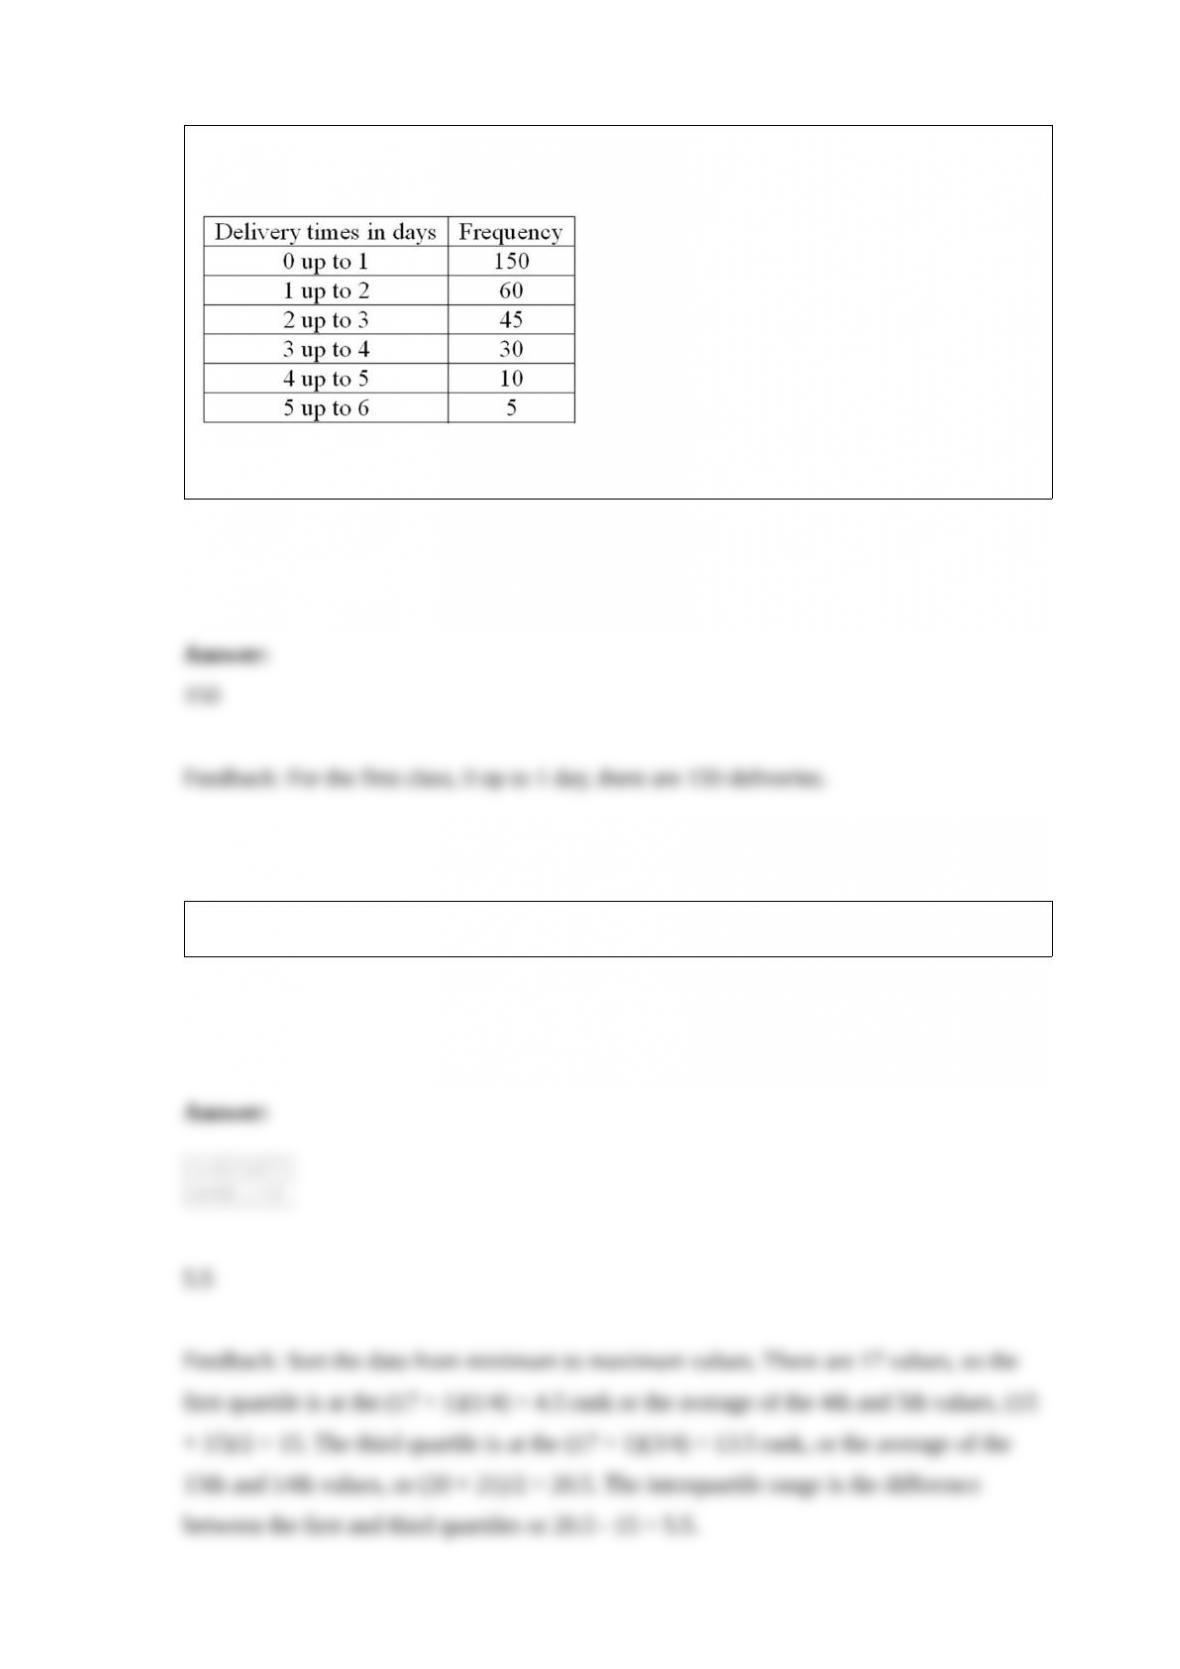
The following frequency distribution shows the distribution of delivery times (in days)
for swimstuff.com customer orders during the last month.
How many orders were delivered in less than one day?
For the following data, what is the interquartile range?
What are the five assumptions of linear multiple regression?
When independent samples with unknown but equal standard deviations are used to test
for differences in the means, we pool the sample _________________.
A major credit card company has determined that customers charge between $100 and
$1,100 per month. If the average monthly amount charged is uniformly distributed, the
percent of monthly charges between $600 and $889 would be ______.
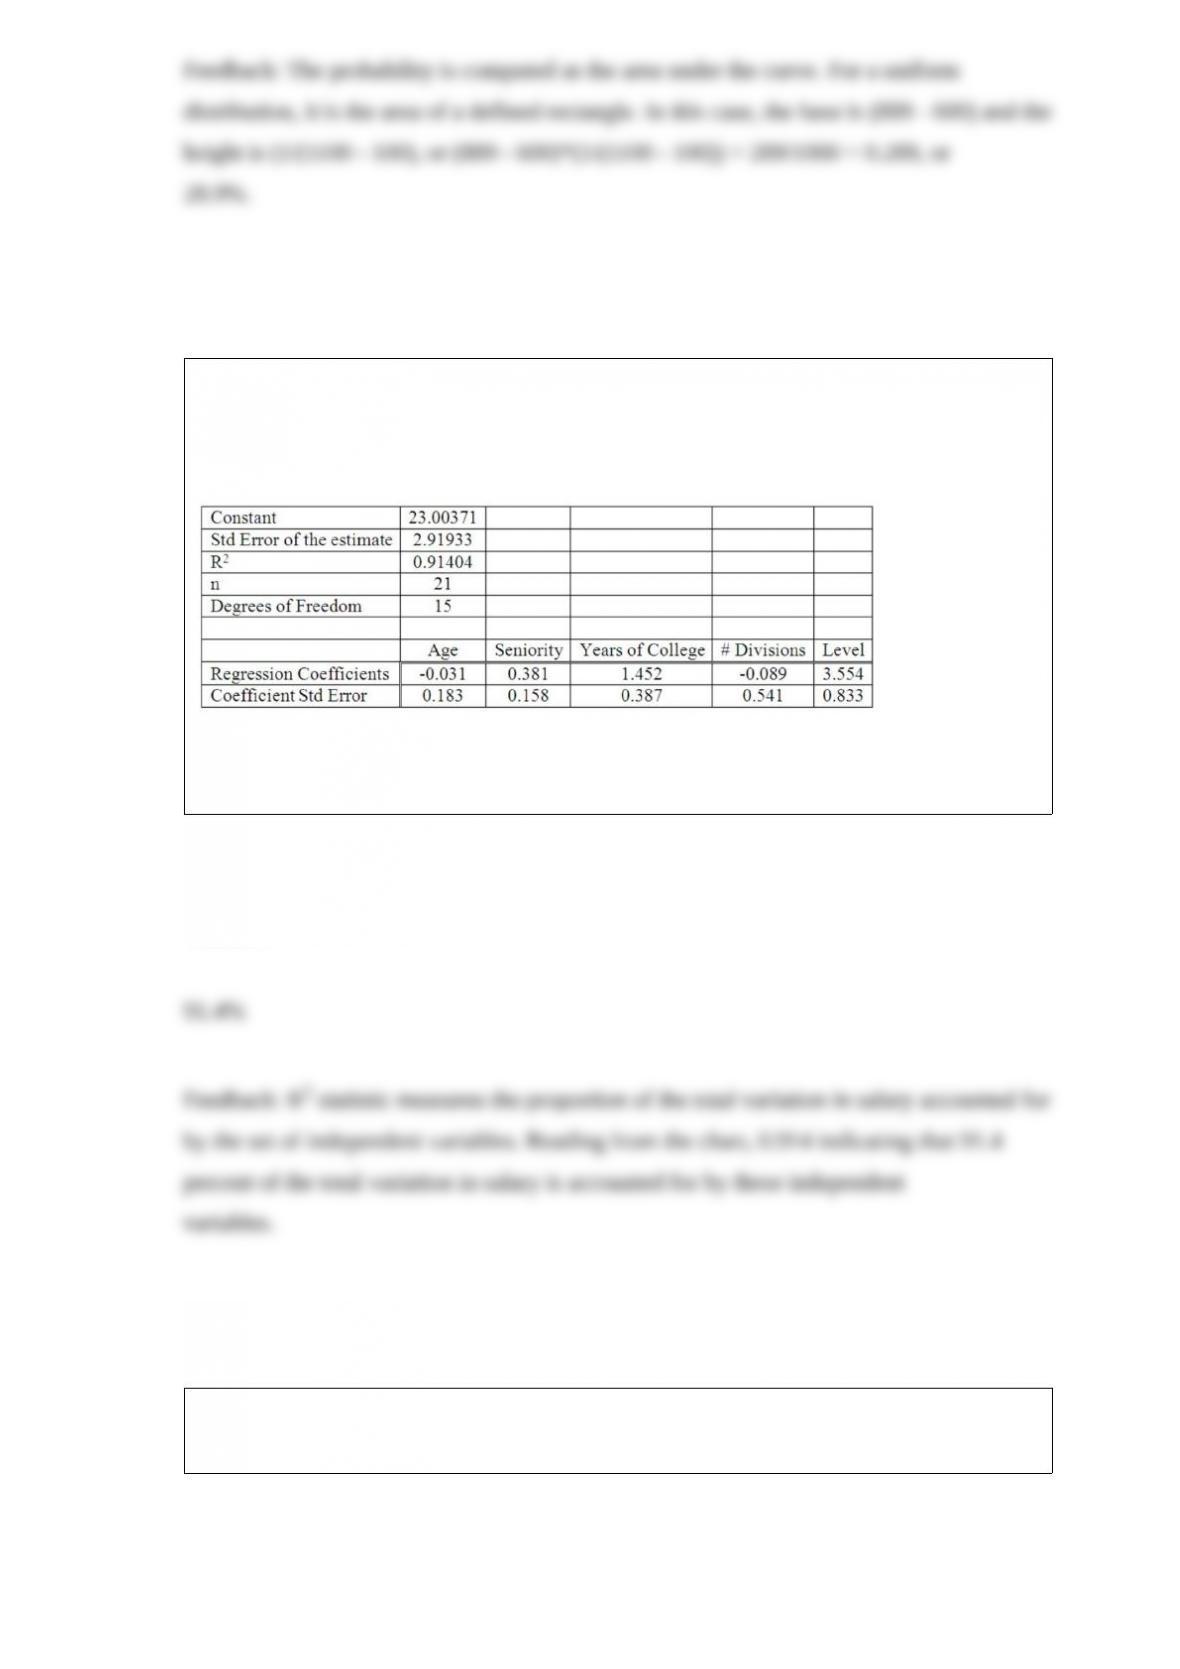
Twenty-one executives in a large corporation were randomly selected to study the effect
of several factors on annual salary (expressed in $000s). The factors selected were age,
seniority, years of college, number of company divisions they had been exposed to, and
the level of their responsibility. The results of the regression analysis follow:
What proportion of the total variation in salary is accounted for by the set of
independent variables?
The standard deviation of the sampling distribution of the sample means is called the
______________.

As the sample size increases, the curve of the t-distribution approaches the
_____________________________.
The Anderson-Darling test for normality tests a null hypothesis that the sample data are
______ distributed.
A sample of the homes currently offered for sale revealed that the mean asking price is
$75,900, the median $70,100, and the modal price is $67,200. The standard deviation of
the distribution is $5,900. What is Pearson’s coefficient of skewness in this sample?

For a trial, the number of possible outcomes for the binomial experiment is _____.
The p-value is determined by the value of a ______________________.