A multiple regression model of the form = B0 + B1x + B2x2 + ε is called a
second-degree polynomial model.
Data collected using open-end questions is generally easier to analyze than data
collected from closed-end questions.
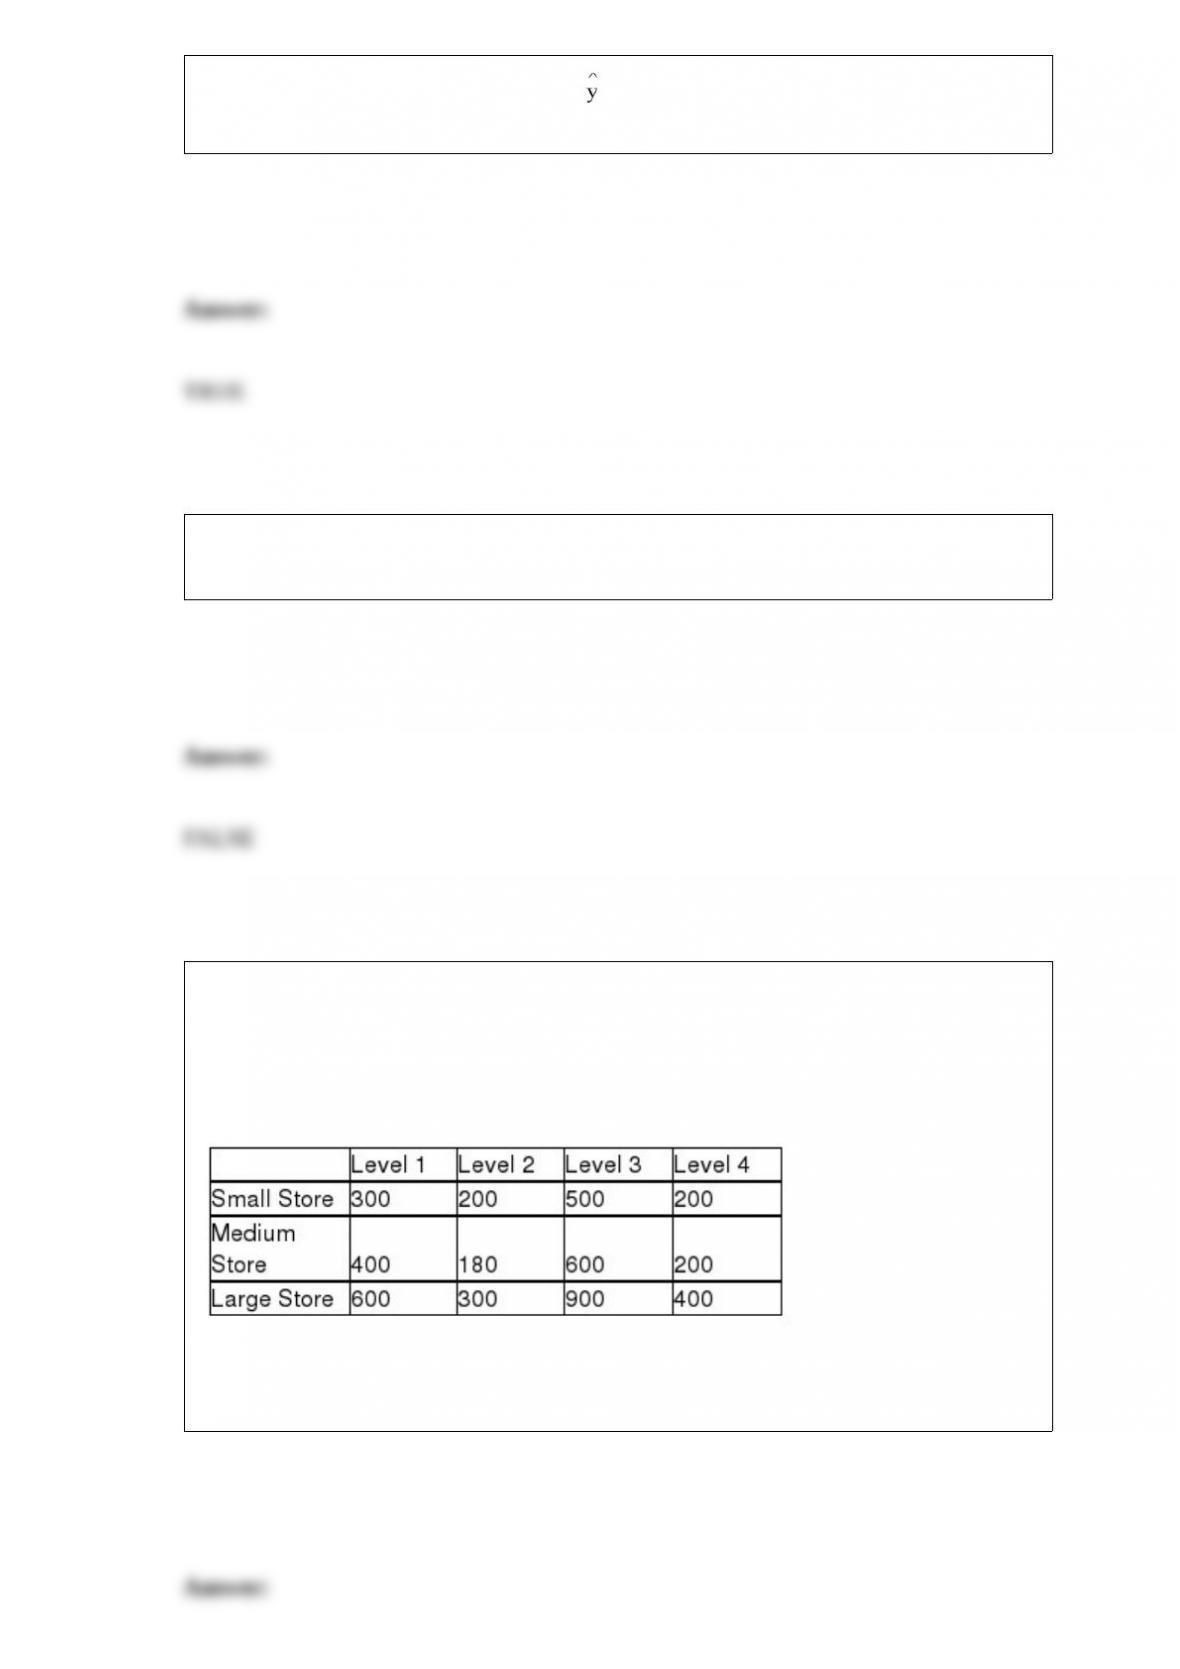
An advertising company is interested in determining if there is a difference in the mean
sales that will be generated for a soft drink company based on which shelf the soft
drinks are located. There are four possible shelf levels. The ad company wants to
control for store size. The following data reflect the sales for one week at each
combination of shelf level and store size.
Based on the experimental design, the managers should conclude that they were
justified in blocking on store size if they test using a 0.05 level of significance.
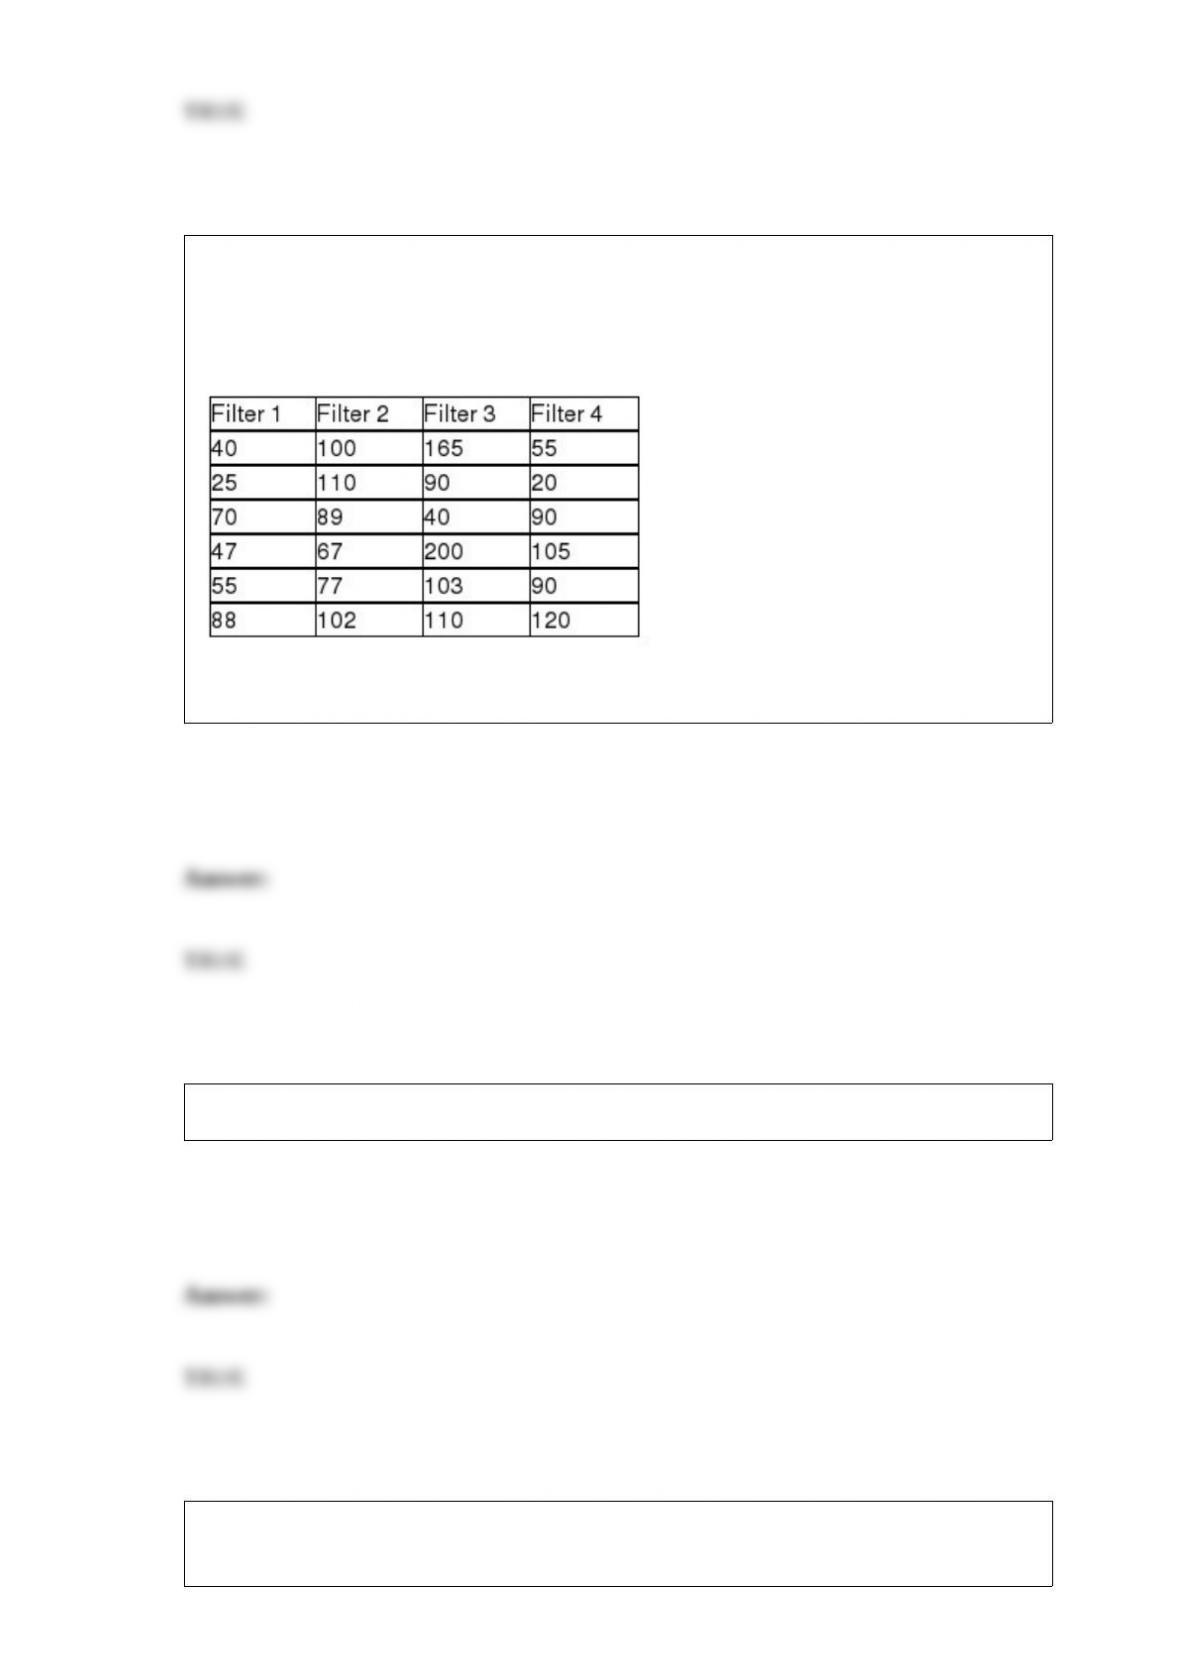
The makers of furnace filters recently conducted a test to determine whether the median
number of particulates that would pass through their four leading filters was the same. A
random sample of 6 of each type of filter was used with the following data being
recorded:
If the Kruskal-Wallis test is used, the critical value for an alpha = .05 is 7.814
Contingency analysis helps to make decisions when multiple proportions are involved.
The difference between a scatter plot and a scatter diagram is that the scatter plot has
the independent variable on the x-axis while the independent variable is on the Y-axis in

a scatter diagram.
The Crystal Window Company makes windows at three locations: Reno, Las Vegas,
and Boise. Some windows made by the company contain a visible defect and must be
replaced. Each defect costs the company $45.00. The Reno plant makes 40 percent of
all windows while the Las Vegas and Boise plants split the remaining production
evenly. A recent quality study shows that 8 percent of the Reno windows contain a
defect, 11 percent of the Las Vegas windows contain a defect, while 4 percent of the
windows made in Boise have a defect. Once the windows are made, they are shipped to
a central warehouse where they are commingled and the location where they were made
is lost.
Based on this information, if a defective window is discovered, it was most likely made
by the Las Vegas plant.
The six most common sources of variation are people, machines, materials, methods,
measurement, and environment.

Recently an article in a newspaper stated that 75 percent of the households in the state
had incomes of $20,200 or below. Given this input, it is certain that mean household
income is less than $20,200.
A company that makes and markets a device that is aimed at helping people quit
smoking claims that at least 70 percent of the people who have used the product have
quit smoking. To test this, a random sample of n = 100 product users was selected. The
critical value for the hypothesis test using a significance level of 0.05 would be
approximately -1.645.
If a one-tailed F-test is employed when testing a null hypothesis about two population
variances, the test statistic is an F-value formed by taking the ratio of the two sample
variances so that the sample variance predicted to be larger is placed in the numerator.

The variance inflation factor (VIF) provides a measure for each independent variable of
how much multicollinearity is associated with that particular independent variable.
When a correlation is found between a pair of variables, this always means that there is
a direct cause and effect relationship between the variables.
If two variables are uncorrelated, the sample correlation coefficient will be r = 0.00.
The sampling distribution for a goodness-of-fit test is the Poisson distribution.
In most situations, there is no difference between the events and the elementary events.
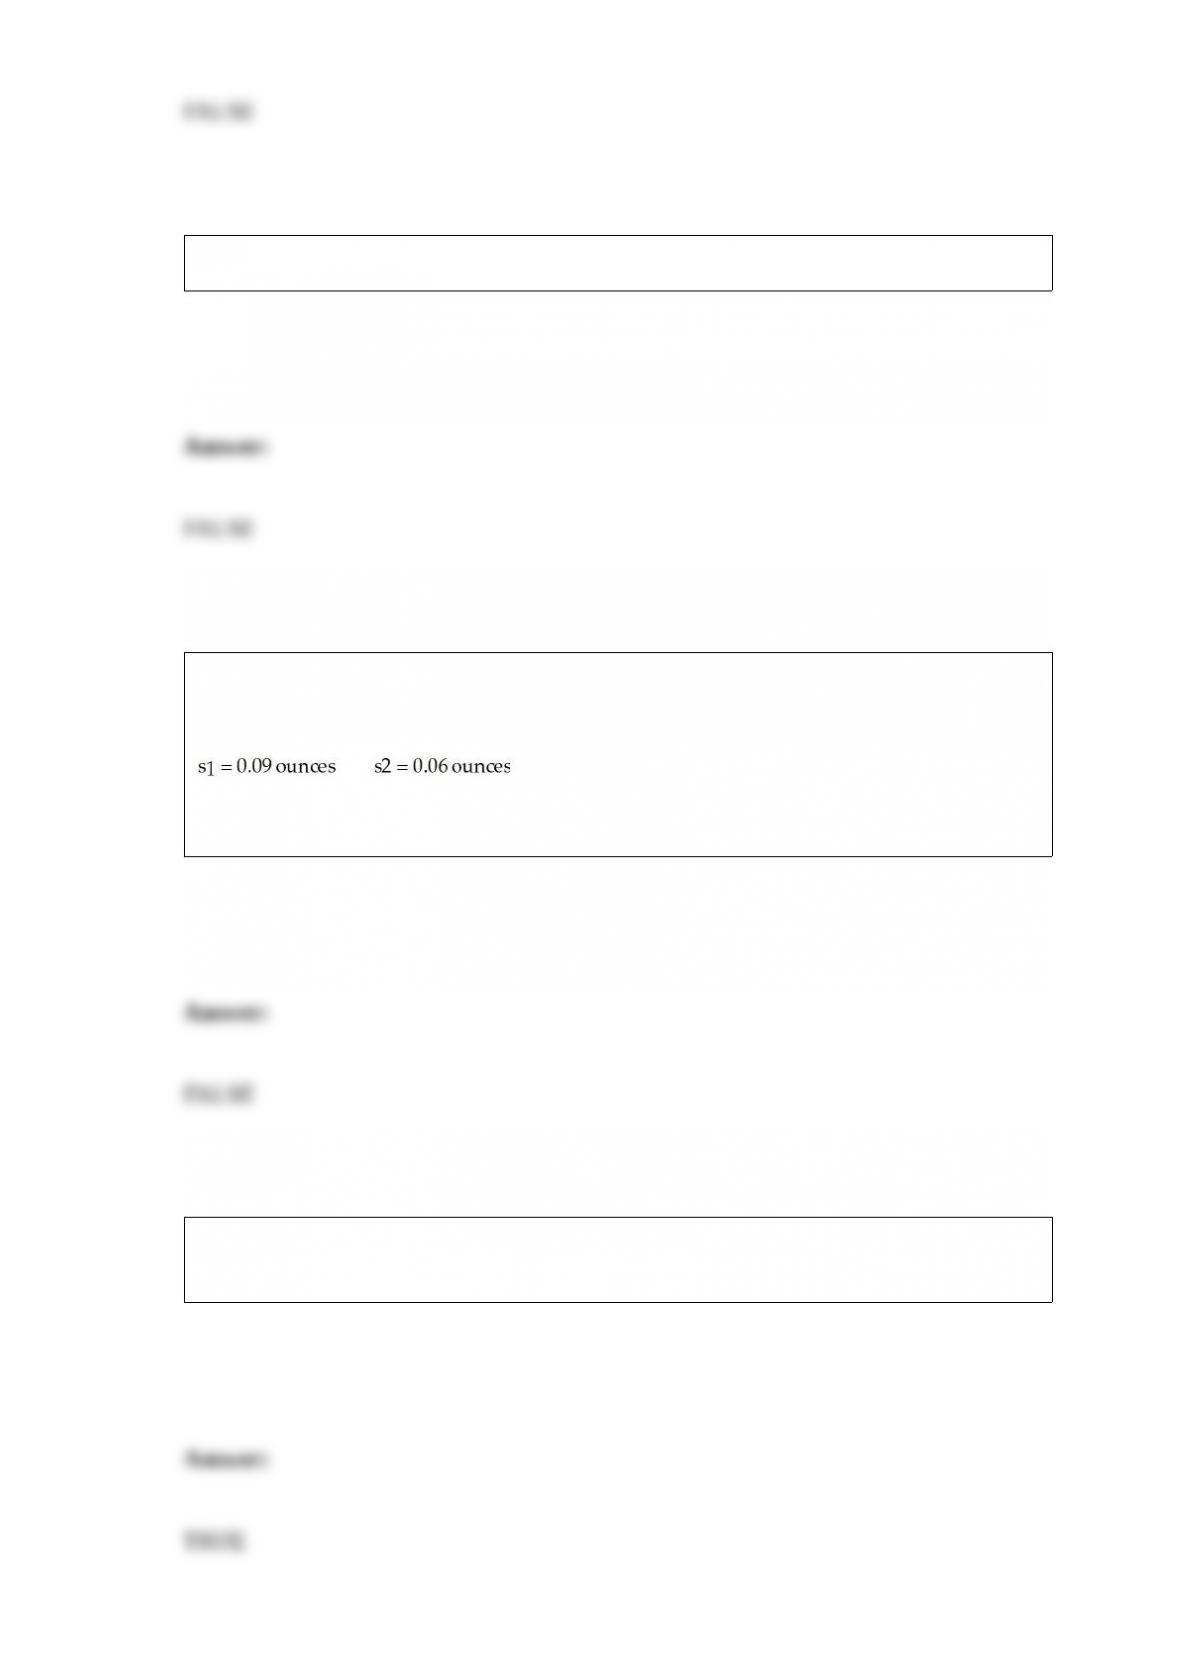
A potato chip manufacturer has two packaging lines and wants to determine if the
variances differ between the two lines. They take a sample of n= 15 bags from each line
and find the following:
The value of the test statistic is F = 1.5
One of the reasons that the standard deviation is preferred as a measure of variation
over the variance is that the standard deviation is measured in the original units.

The standard normal distribution has a mean of 0 and a standard deviation of 1.0.
The Hawkins Company randomly samples 10 items from every large batch before the
batch is packaged and shipped. According to the contract specifications, 5 percent of the
items shipped can be defective. If the inspectors find 1 or fewer defects in the sample of
10, they ship the batch without further inspection. If they find 2 or more, the entire
batch is inspected. Based on this sampling plan, the probability that a batch that meets
the contract requirements will be shipped without further inspection is approximately .
9139.
Once you have determined the class width using the formula, high-low divided by the
number of classes, it is appropriate to round to the nearest integer to make the analysis
easier.
A survey conducted by a local real estate agency asked respondents to indicate whether
they preferred natural gas, electric, or oil furnaces for heating their home. The data
collected for this variable would be of ordinal level.
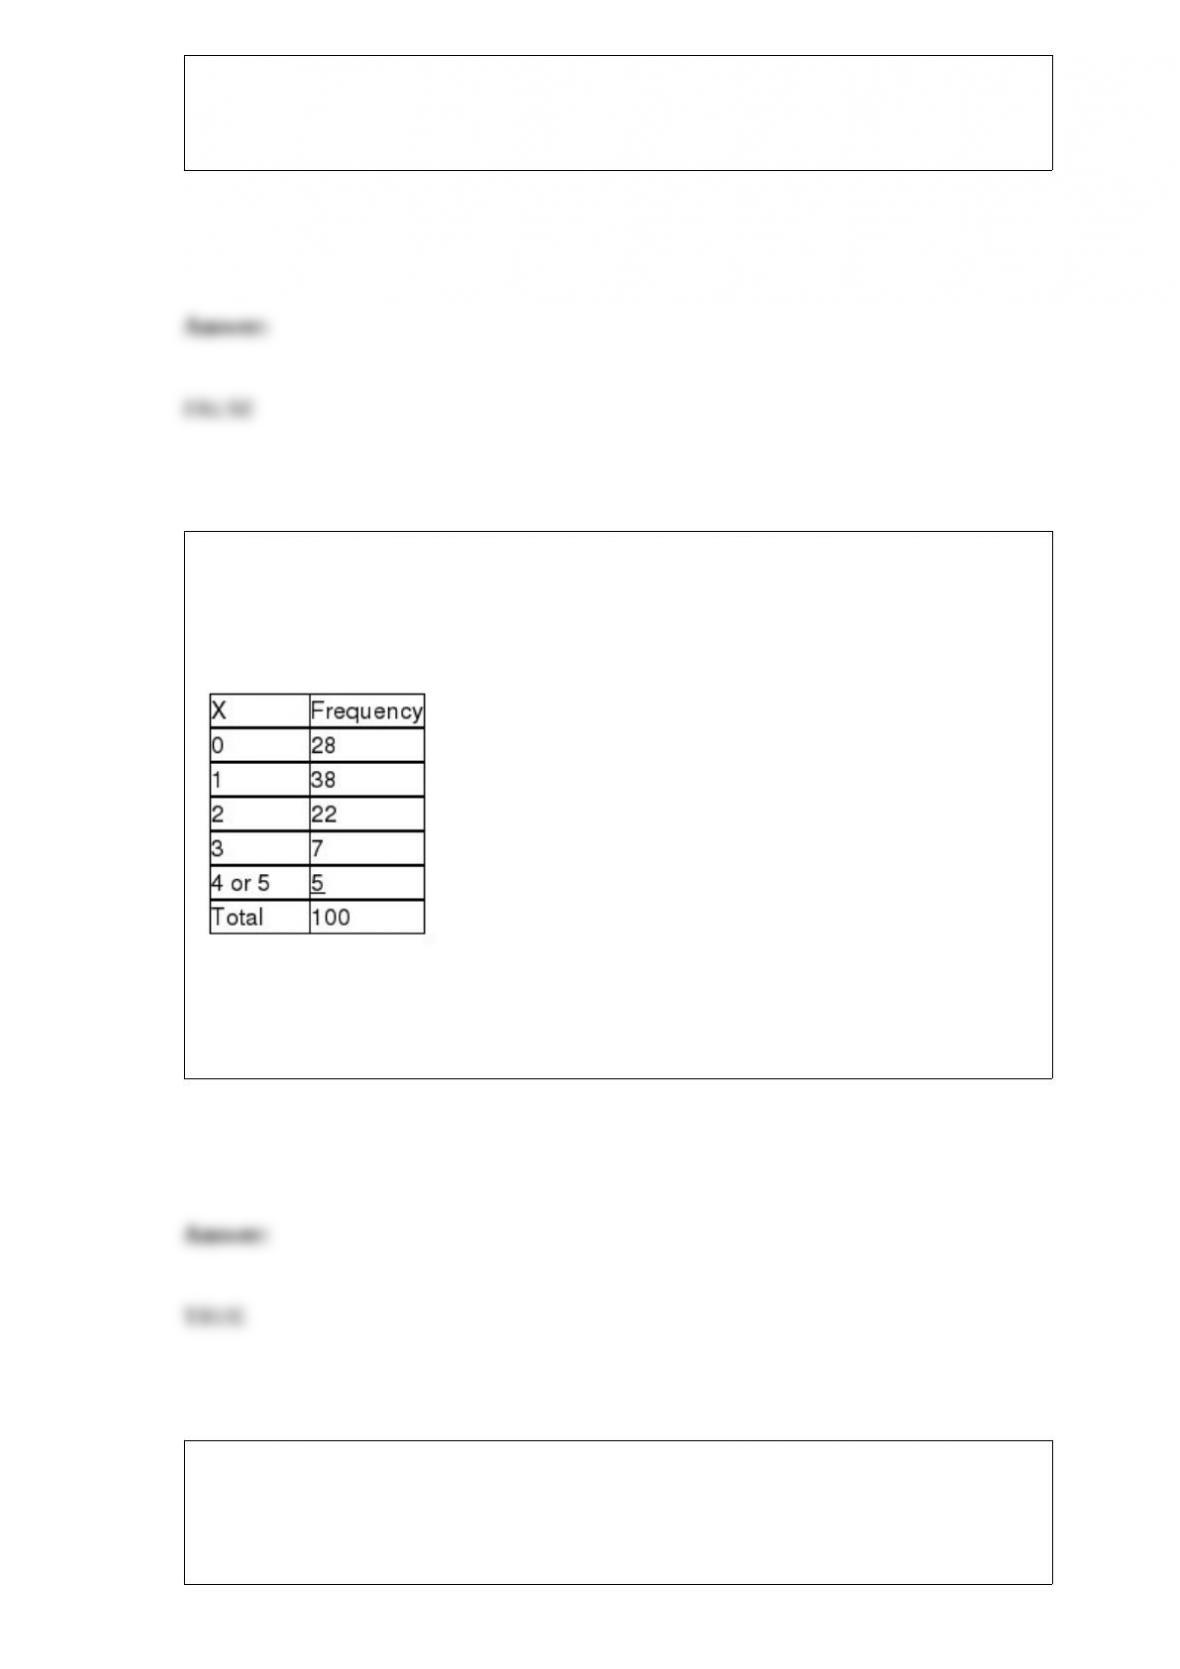
A business with 5 copy machines keeps track of how many copy machines need service
on a given day. It believes this is binomially distributed with a probability of p = 0.2 of
each machine needing service on any given day. It has collected the following based on
a random sample of 100 days.
Given this information, assuming that all expected values are sufficiently large to use
the classes as shown above, the critical value based on a 0.05 level of significance is
9.4877.
The director of the city Park and Recreation Department claims that the mean distance
people travel to the city’s greenbelt is more than 5.0 miles. Assume that the population
standard deviation is known to be 1.2 miles and the significance level to be used to test
the hypothesis is 0.05 when a sample size of n = 64 people are surveyed. Given this

information, if the sample mean is 15.90 miles, the null hypothesis should be rejected.
The higher the level of confidence, the wider the confidence interval must be.
A manufacturing company makes three types of products. Each time it makes a product,
the item can be either good or defective and it can be either customized or standard. The
events consisting of customized and defective would be considered mutually exclusive
since they apply to different attributes of the product.
A point estimate for the population mean will always fall within the confidence interval
estimate.

The sum of the residuals in a least squares regression model will be zero only when the
correlation between the x and y variables is statistically significant.
Consider a situation involving two populations where population 1 is known to have a
higher coefficient of variation than population 2. In this situation, we know that
population 1 has a higher standard deviation than population 2.
A pizza restaurant uses 7 different toppings on its pizzas. At lunch time it has a pizza
buffet and makes pizzas with 2 toppings. If it wants to serve every possible combination
of 2 toppings, it would need to make 14 different pizzas.

The values of the regression coefficients are found such the sum of the residuals is
minimized.
The monthly electrical utility bills of all customers for the Far East Power and Light
Company are known to be distributed as a normal distribution with mean equal to
$87.00 a month and standard deviation of $36.00. If a statistical sample of n = 100
customers is selected at random, what is the probability that the mean bill for those
sampled will exceed $75.00?
A) -0.33
B) Approximately 0.63
C) About 1.00
D) 3.33
If a decision maker wishes to reduce the margin of error associated with a confidence
interval estimate for a population mean, she can:
A) decrease the sample size.
B) increase the confidence level.
C) increase the sample size.
D) use the t-distribution.
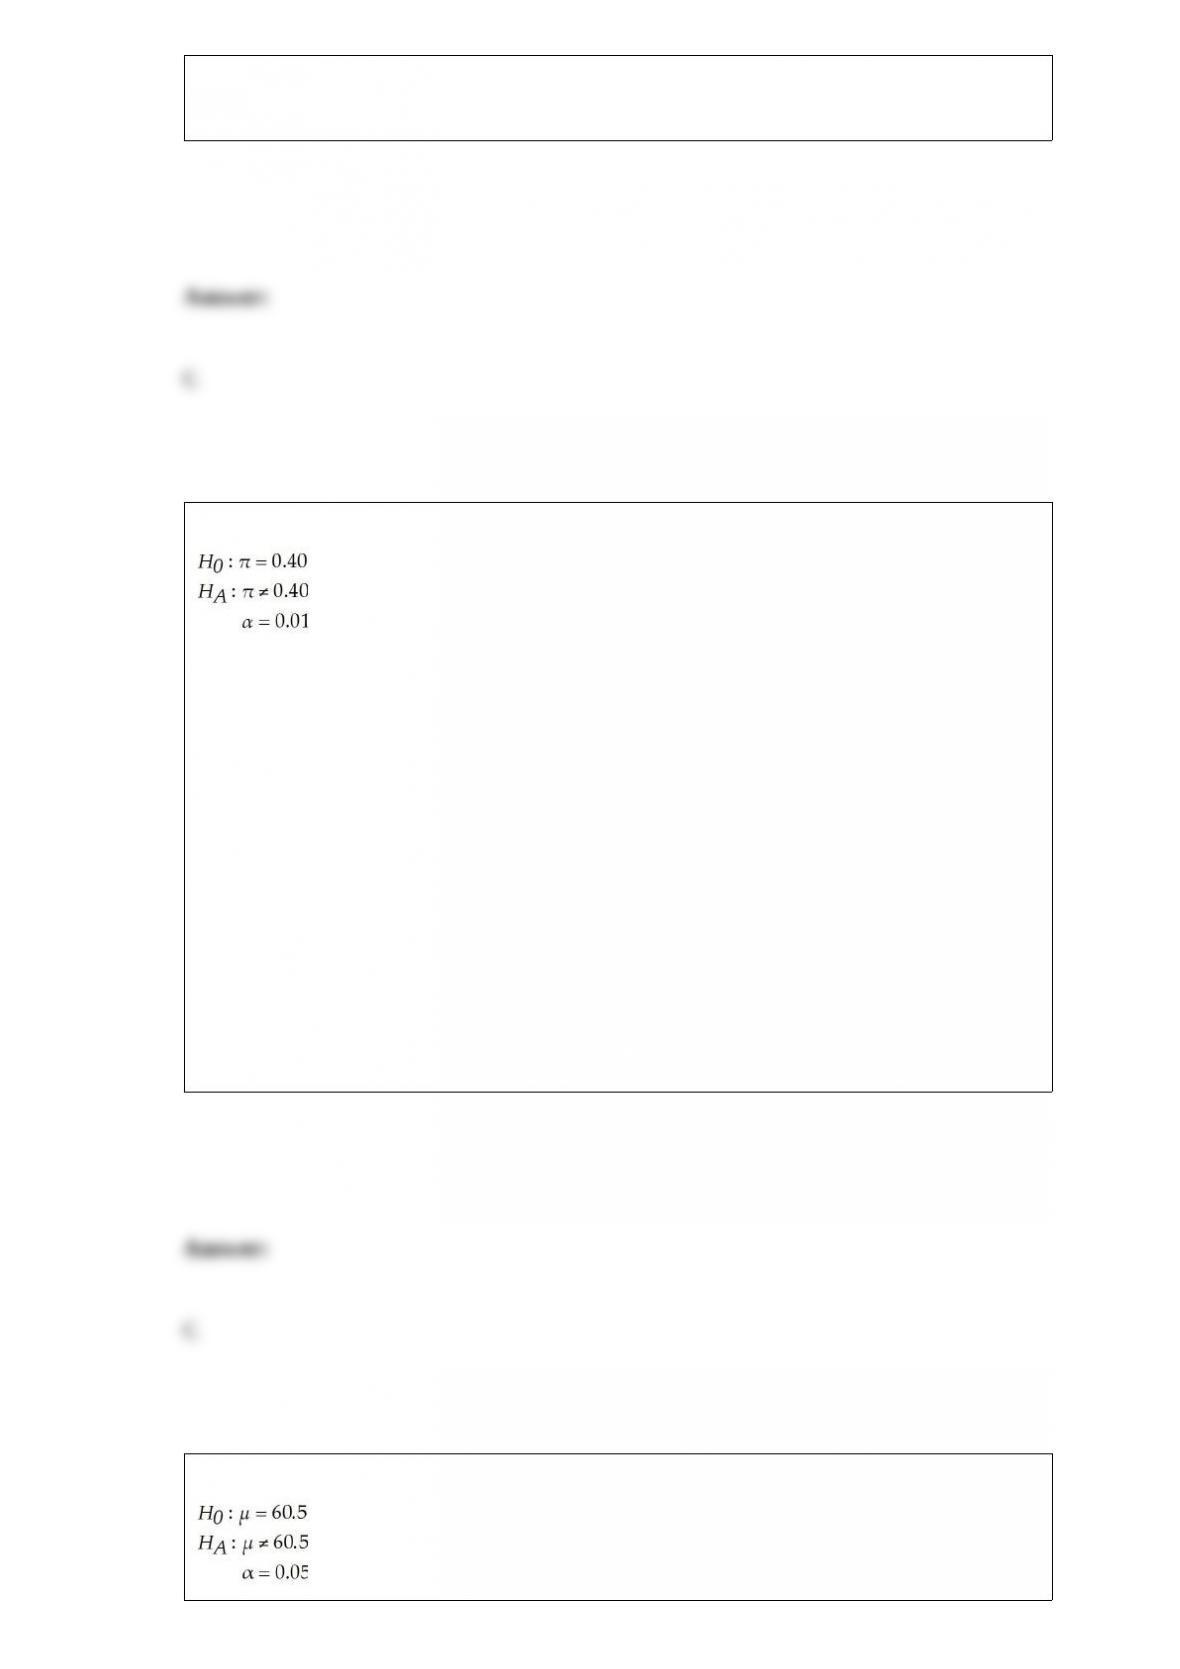
For the following hypothesis test:
With n= 64 and p= 0.42, state the decision rule in terms of the critical value of the test
statistic
A) The decision rule is: reject the null hypothesis if the calculated value of the test
statistic, z, is greater than 2.013 or less than -2.013. Otherwise, do not reject.
B) The decision rule is: reject the null hypothesis if the calculated value of the test
statistic, z, is less than 2.013 or greater than -2.013. Otherwise, do not reject.
C) The decision rule is: reject the null hypothesis if the calculated value of the test
statistic, z, is greater than 2.575 or less than -2.575. Otherwise, do not reject.
D) The decision rule is: reject the null hypothesis if the calculated value of the test
statistic, z, is less than 2.575 or greater than -2.575. Otherwise, do not reject.
For the following hypothesis test:

With n = 15, s = 7.5, and = 62.2, state the conclusion.
A) Because the computed value of t = 0.878 is not less than -2.1448 and not greater
than 2.1448, do not reject the null hypothesis.
B) Because the computed value of t = 1.312 is not less than -2.1448 and not greater than
2.1448, do not reject the null hypothesis.
C) Because the computed value of t = 0.878 is not less than -2.1448 and not greater than
2.1448, reject the null hypothesis
D) Because the computed value of t = 1.312 is not less than -2.1448 and not greater
than 2.1448, reject the null hypothesis
Which of the following is the difference between forward selection and standard
stepwise regression?
A) In the standard stepwise regression, variables that were added at earlier steps can be
removed at later steps, which is not the case with forward selection.
B) The standard stepwise approach will generally produce a regression model with a
higher R-square value than the forward selection approach.
C) Forward selection begins by selecting the variable with the highest correlation with
the dependent variable and then proceeds to select subsequent variables in order of their
F-to-enter value, while standard stepwise selects the variables in the order specified by
the decision maker and then removes them from the model as needed.
D) There are no appreciable differences between the two methods, just different names
for the same technique.
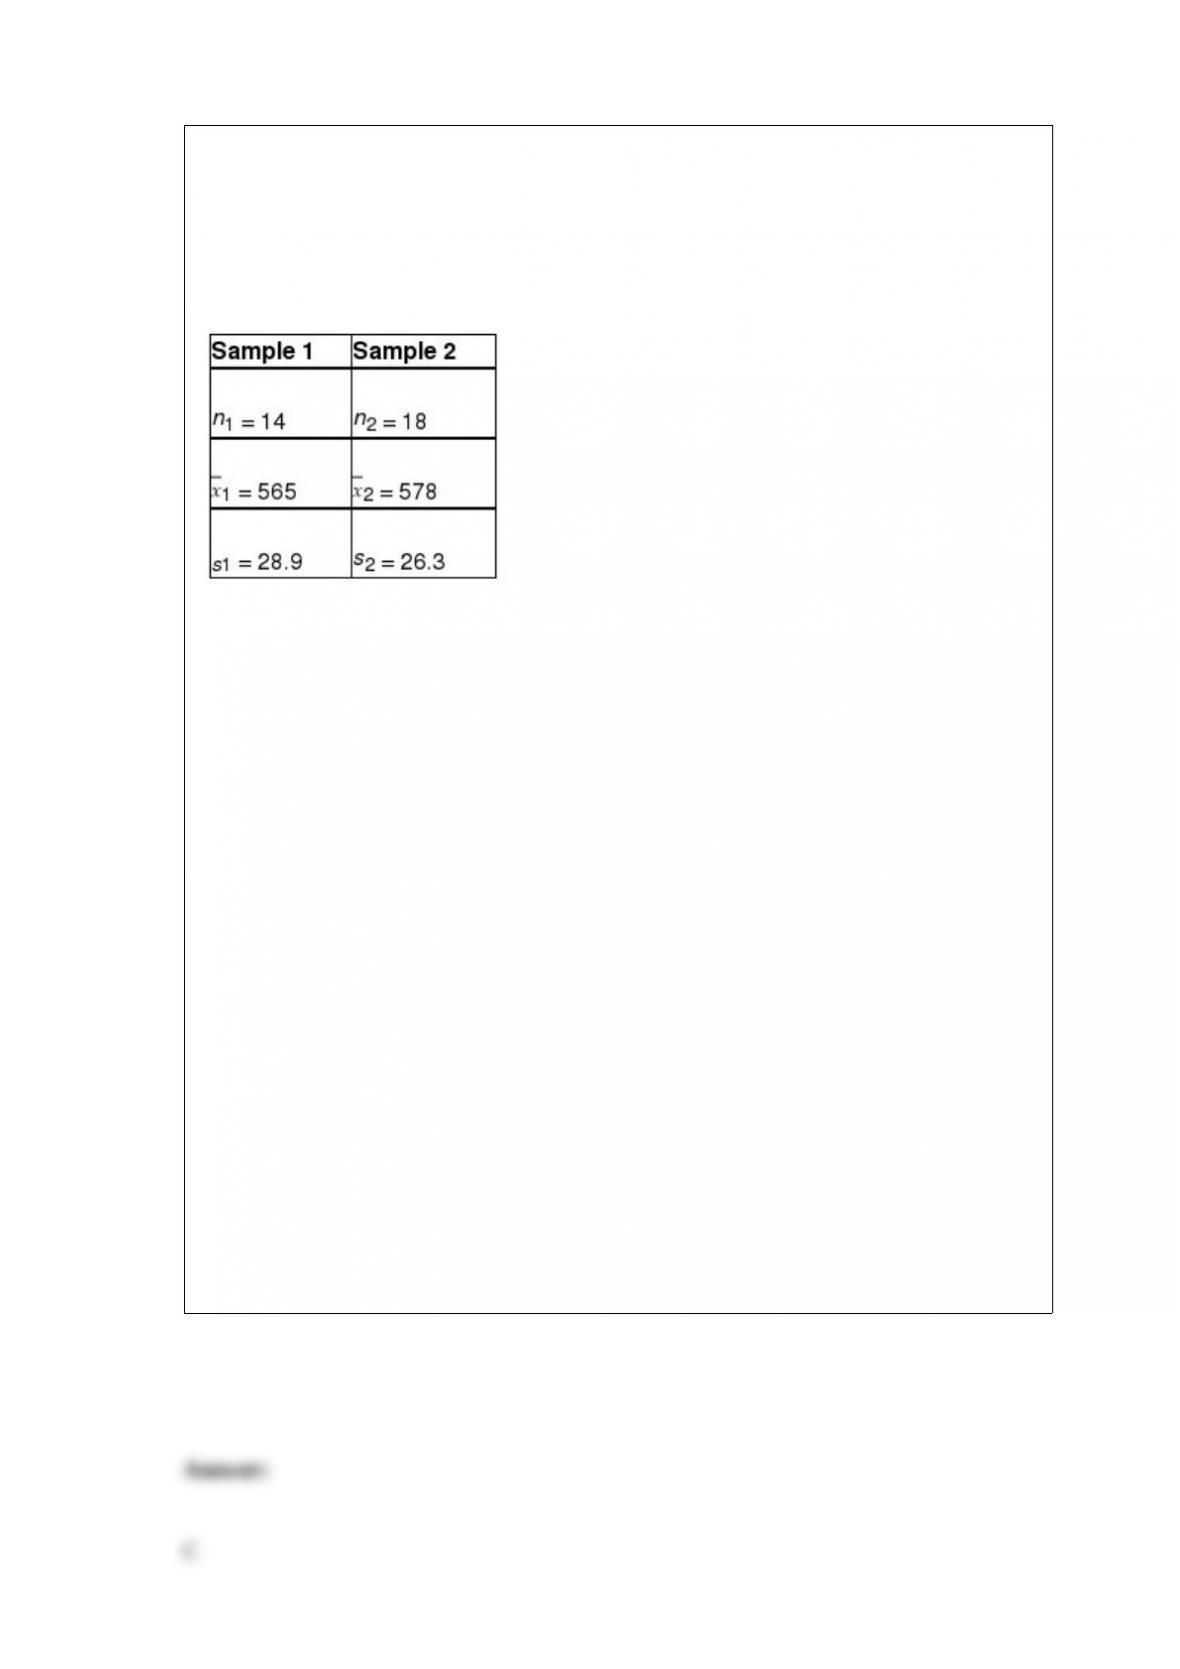
Given the following null and alternative hypotheses
H0 : μ1 ≥ μ2
HA : μ1 < μ2
Together with the following sample information
Assuming that the populations are normally distributed with equal variances, test at the
0.05 level of significance whether you would reject the null hypothesis based on the
sample information. Use the test statistic approach.
A) Because the calculated value of t = -2.145 is less than the critical value of t =
-1.6973, reject the null hypothesis. Based on these sample data, at the α = 0.05 level of
significance there is sufficient evidence to conclude that the mean for population 1 is
less than the mean for population 2.
B) Because the calculated value of t = -1.814 is less than the critical value of t =
-1.6973, reject the null hypothesis. Based on these sample data, at the α = 0.05 level of
significance there is sufficient evidence to conclude that the mean for population 1 is
less than the mean for population 2.
C) Because the calculated value of t = -1.329 is not less than the critical value of t =
-1.6973, do not reject the null hypothesis. Based on these sample data, at the α = 0.05
level of significance there is not sufficient evidence to conclude that the mean for
population 1 is less than the mean for population 2.
D) Because the calculated value of t = -1.415 is not less than the critical value of t =
-1.6973, do not reject the null hypothesis. Based on these sample data, at the α = 0.05
level of significance there is not sufficient evidence to conclude that the mean for
population 1 is less than the mean for population 2.

When the Mann-Whitney U test is performed, which of the following is true?
A) We assume that the populations are normally distributed.
B) We are interested in testing whether the medians from two populations are equal.
C) The data are nominal level.
D) The samples are independent.
The margin of error is:
A) the largest possible sampling error at a specified level of confidence.
B) the critical value multiplied by the standard error of the sampling distribution.
C) Both A and B
D) the difference between the point estimate and the parameter.
For a standardized normal distribution, calculate P(z ≥ 0.85).
A) 0.8033
B) 0.1977

C) 0.2340
D) 0.7660
A random variable is normally distributed with a mean of 25 and a standard deviation of
5. If an observation is randomly selected from the distribution, what value will 15% of
the observations be below?
A) 19.8
B) 16.2
C) 18.7
D) 17.2
You are given the following null and alternative hypotheses:
If the true population mean is 4,345, determine the value of beta. Assume the
population standard deviation is known to be 200 and the sample size is 100.
A) 0.9192

B) 0.8233
C) 0.6124
D) 0.0314
A normally distributed population has a mean of 500 and a standard deviation of 60.
Determine the probability that a random sample of size 25 selected from the population
will have a sample mean greater than or equal to 515.
A) 0.1056
B) 0.1761
C) 0.0712
D) 0.0151
Which of the following statements is true with respect to a simple linear regression
model?
A) The percent of variation in the dependent variable that is explained by the regression
model is equal to the square of the correlation coefficient between the x and y variables.
B) If the correlation coefficient between the x and y variables is negative, the sign on
the regression slope coefficient will also be negative.

C) If the correlation between the dependent and the independent variable is determined
to be significant, the regression model for y given x will also be significant.
D) All of the above are true.
If a distribution for a quantitative variable is thought to be nearly symmetric with very
little variation, and a box and whisker plot is created for this distribution, which of the
following is true?
A) The box will be quite wide but the whisker will be very short.
B) The left and right-hand edges of the box will be approximately equal distance from
the median.
C) The whiskers should be about half as long as the box is wide.
D) The upper whisker will be much longer than the lower whisker.
The summaries of data, which may be in forms of tabular, graphical, or numerical, are
referred to as:
A) inferential statistics.
B) descriptive statistics.
C) statistical inference.

D) report generation.
In a one-way analysis of variance test in which the levels of the factor being analyzed
are randomly selected from a large set of possible factors, the design is referred to as:
A) a fixed-effects design.
B) a random-effects design.
C) an undetermined results design.
D) a balanced design.
If the Type I error (α) for a given test is to be decreased, then for a fixed sample size n:
A) the Type II error (β) will also decrease.
B) the Type II error (β) will increase.
C) the power of the test will increase.
D) a one-tailed test must be utilized.
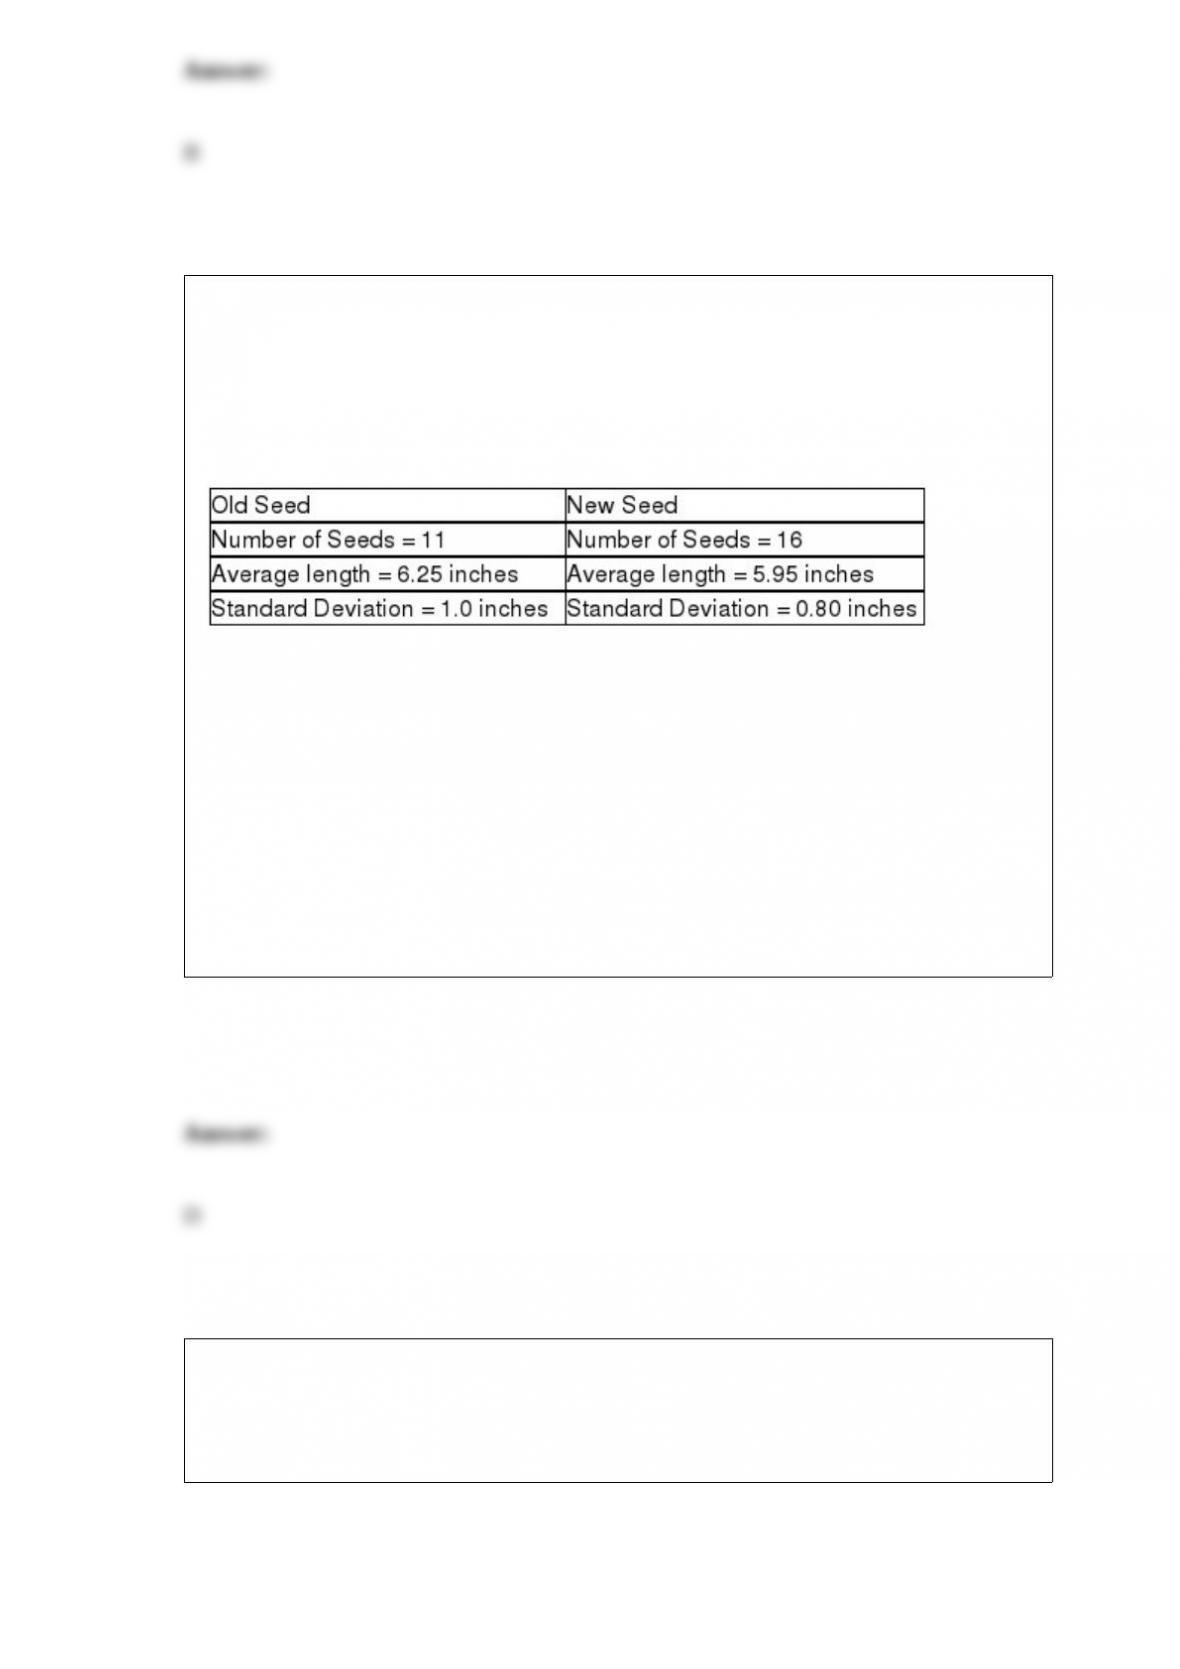
The Russet Potato Company has been working on the development of a new potato
seed that is hoped to be an improvement over the existing seed that is being used.
Specifically, the company hopes that the new seed will result in less variability in
individual potato length than the existing seed without reducing the mean length. To test
whether this is the case, a sample of each seed is used to grow potatoes to maturity. The
following information is given:
The on these data, if the hypothesis test is conducted using a 0.05 level of significance,
the calculated test statistic is:
A) = 1.25
B) = 0.80
C) = 0.64
D) = 1.56
A recent study by a major financial investment company was interested in determining
whether the annual percentage change in stock price for companies is linearly related to
the annual percent change in profits for the company. The following data was
determined for 7 randomly selected companies:
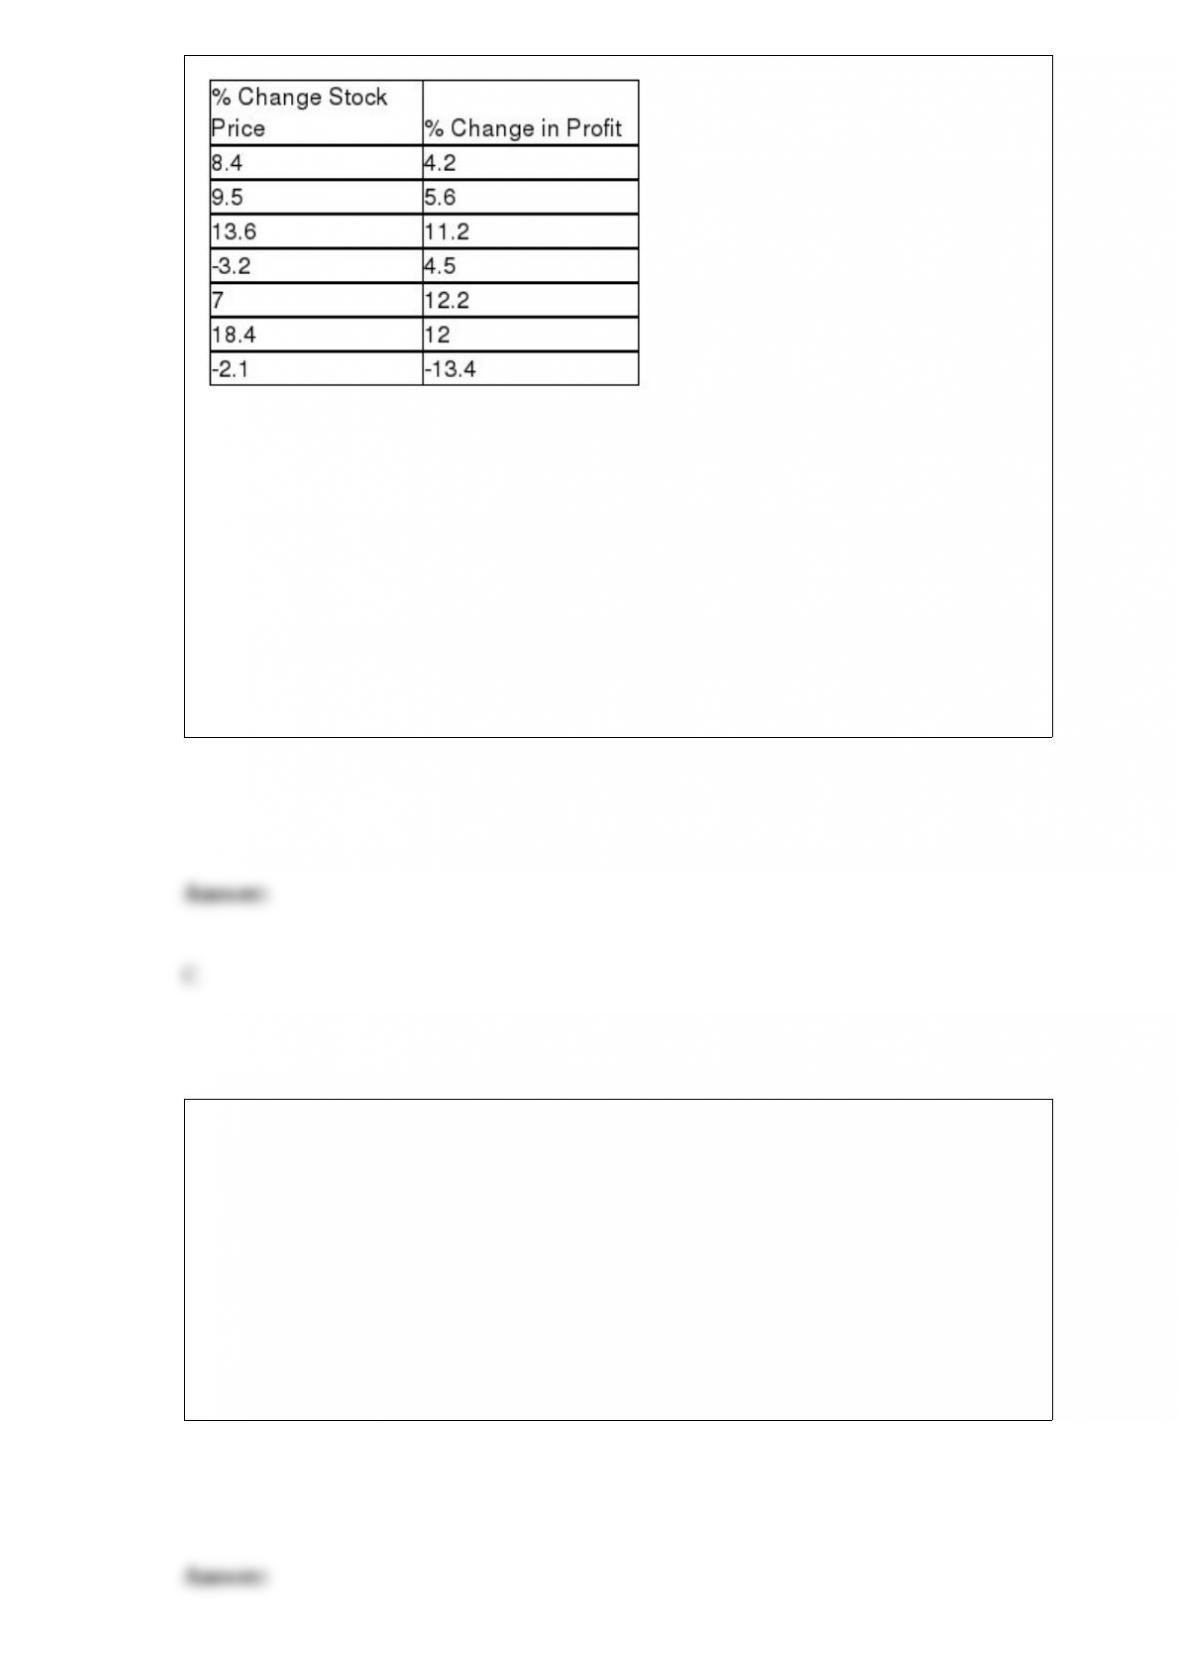
Based upon this sample information, what portion of variation in stock price percentage
change is explained by the percent change in yearly profit?
A) Approximately 70 percent
B) Nearly 19 percent
C) About 49 percent
D) None of the above
The advantage of using the interquartile range versus the range as a measure of
variation is:
A) it is easier to compute.
B) it utilizes all the data in its computation.
C) it gives a value that is closer to the true variation.
D) it is less affected by extremes in the data.

A cell phone service provider has 14,000 customers. Recently, the sales department
selected a random sample of 400 customer accounts and recorded the number of
minutes of long distance time used during the previous billing period. The data for this
variable is considered to be nominal since the values are based on sample data.
Previous research shows that 60 percent of adults who drink non-diet cola prefer
Coca-Cola to Pepsi. Recently, an independent research firm questioned a random
sample of 25 adult non-diet cola drinkers. That chance that 20 or more of these people
will prefer Coca-Cola is:
A) essentially zero.
B) 0.0199.
C) 0.0294.
D) None of the above
The asking price for homes on the real estate market in Baltimore has a mean value of
$286,455 and a standard deviation of $11,200. Four homes are listed by one real estate
company with the following prices:
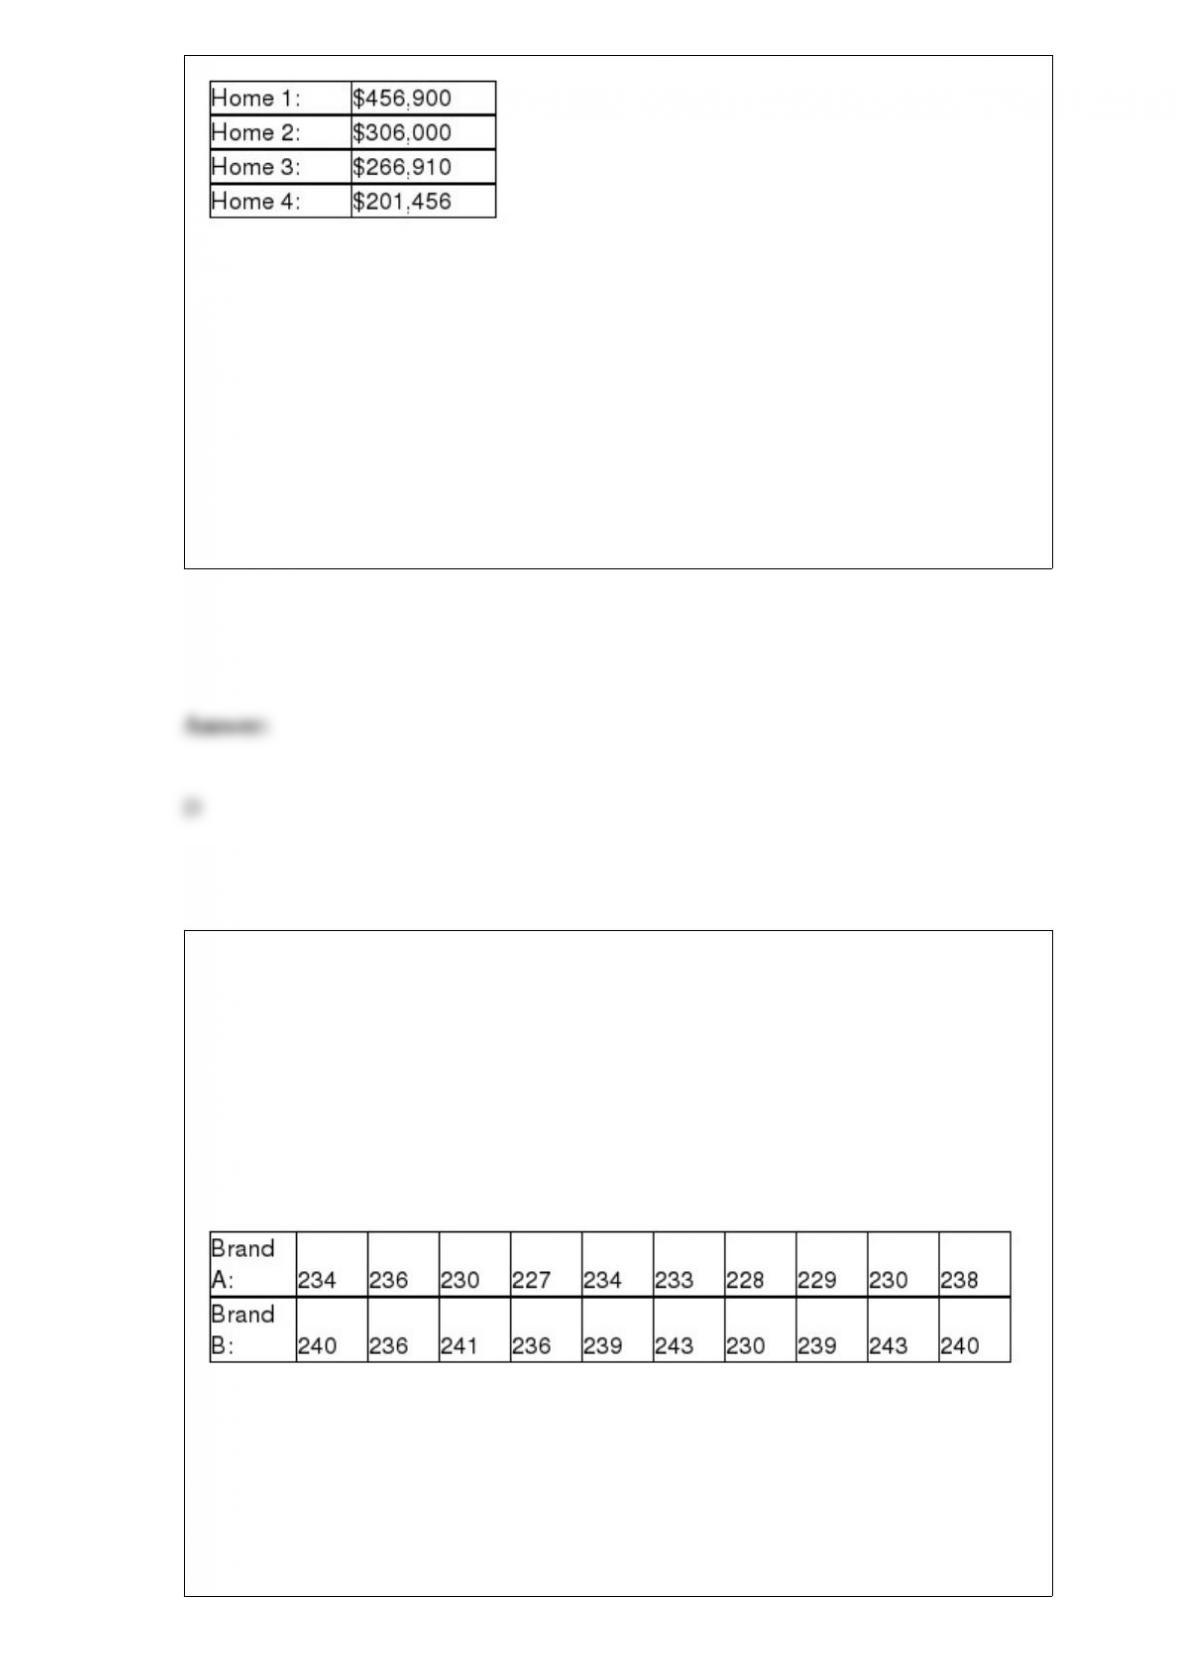
Based upon this information, which house has a standardized value that is relatively
closest to zero?
A) Home 1
B) Home 2
C) Home 3
D) Home 2 and home 3
The U.S. Golf Association provides a number of services for its members. One of these
is the evaluation of golf equipment to make sure that the equipment satisfies the rules of
golf. For example, they regularly test the golf balls made by the various companies that
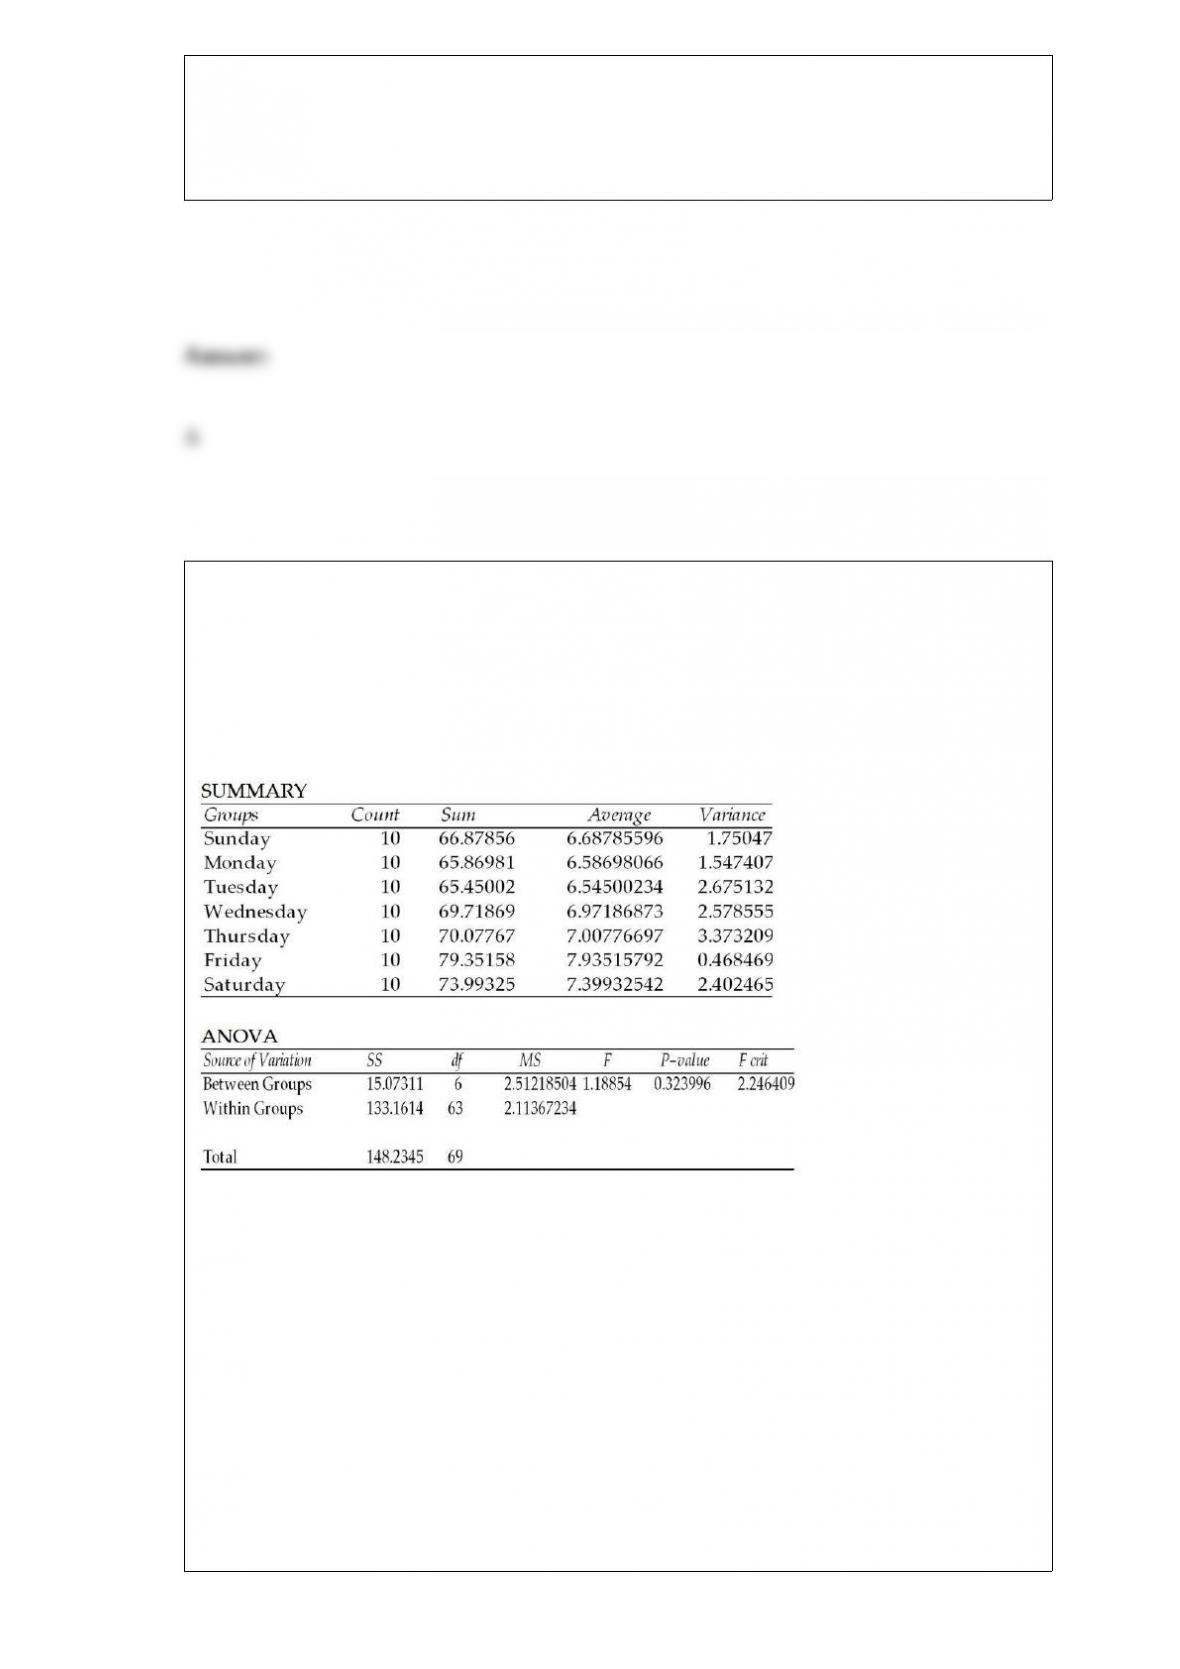
sell balls in the United States. Recently, they undertook a study of two brands of golf
balls with the objective to see whether there is a difference in the mean distance that the
two golf ball brands will fly off the tee. To conduct the test, the U.S.G.A. uses a robot
named “Iron Byron,” which swings the club at the same speed and with the same swing
pattern each time it is used. The following data reflect sample data for a random sample
of balls of each brand.
Given this information, what is the test statistic for testing whether the two population
variances are equal?
A) Approximately F = 1.145
B) t = 1.96
C) t = -4.04
D) None of the above
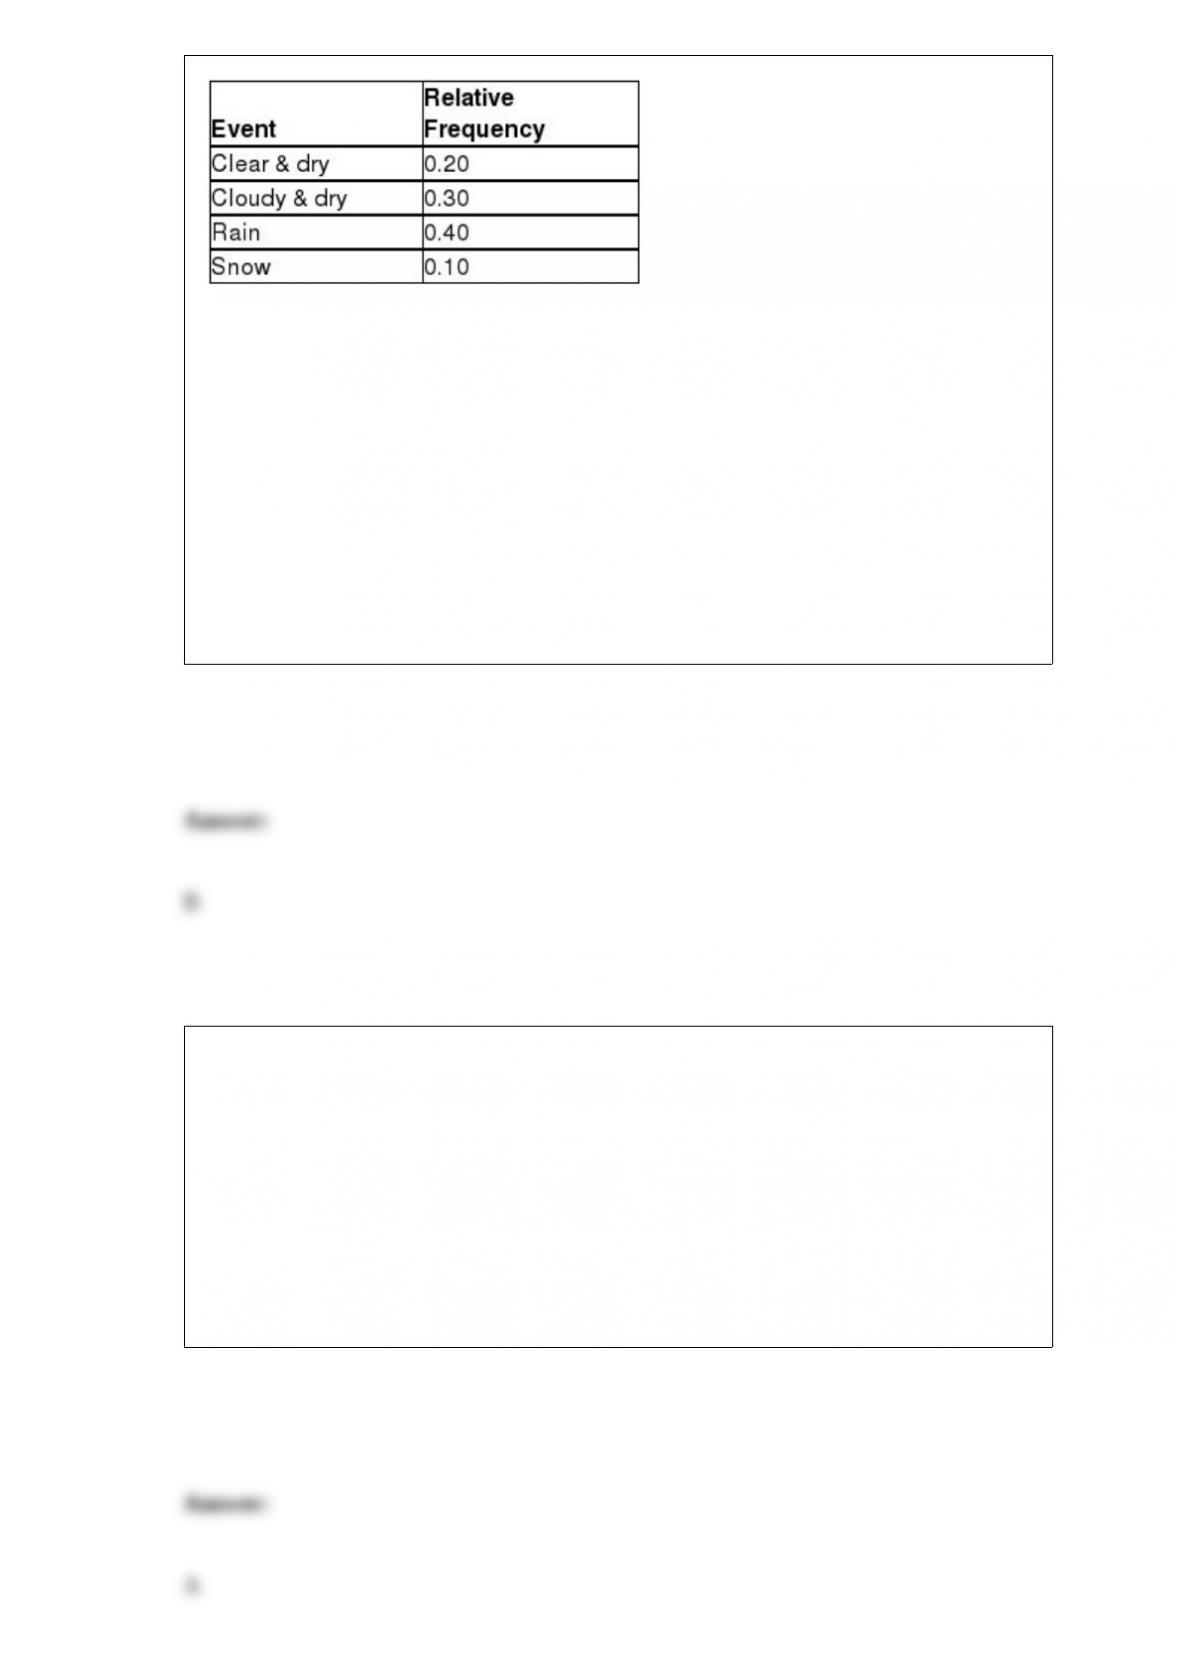
A fast food chain operation is interested in determining whether the mean per customer
purchase differs by day of the week. To test this, it has selected random samples of
customers for each day of the week. The analysts then ran a one-way analysis of
variance generating the following output:
ANOVA: Single Factor
Based upon this output, which of the following statements is true if the test is conducted
at the 0.05 level of significance?
A) There is no basis for concluding that mean sales is different for the different days of
the week.
B) Based on the p-value, the null hypothesis should be rejected since the p-value
exceeds the alpha level.
C) The experiment is conducted as an unbalanced design.
D) Based on the critical value, the null should be rejected.

In conducting a hypothesis test for the difference between two population means where
the standard deviations are known and the null hypothesis is:
H0 : μA – μβ ≥ 0
What is the p-value assuming that the test statistic has been found to be z = 2.52?
A) 0.0059
B) 0.9882
C) 0.0118
D) 0.4941
The following data represent a random sample of bank balances for a population of
checking account customers at a large eastern bank. Based on these data, what is the
critical value for a 95 percent confidence interval estimate for the true population
mean?
A) 1.96
B) 2.1009

C) 2.1098
D) None of the above
Golf handicaps are used to allow players of differing abilities to play against one
another in a fair match. Recently a sample of golfers was selected in an effort to
develop a model for explaining the difference in handicaps. One independent variable
of interest is the number of rounds played per year. Another is whether or not the player
is using an “original” name brand club or a copy. In recent years, a number of smaller
golf club manufacturers have attempted to copy major golf club designs and sell
“copies” of original clubs such as the Big Bertha by Calloway. To incorporate the type
of club used, which of the following methods could be used?
A) Create a dummy variable called “Club Used” and code it “O” for original and “C”
for copy.
B) Create a dummy variable called “Club Used” and code it 1 for copy and 0 for
original.
C) Create a dummy variable called Club Used” and code it 1 for original and 0 for copy.
D) Either B or C would work.
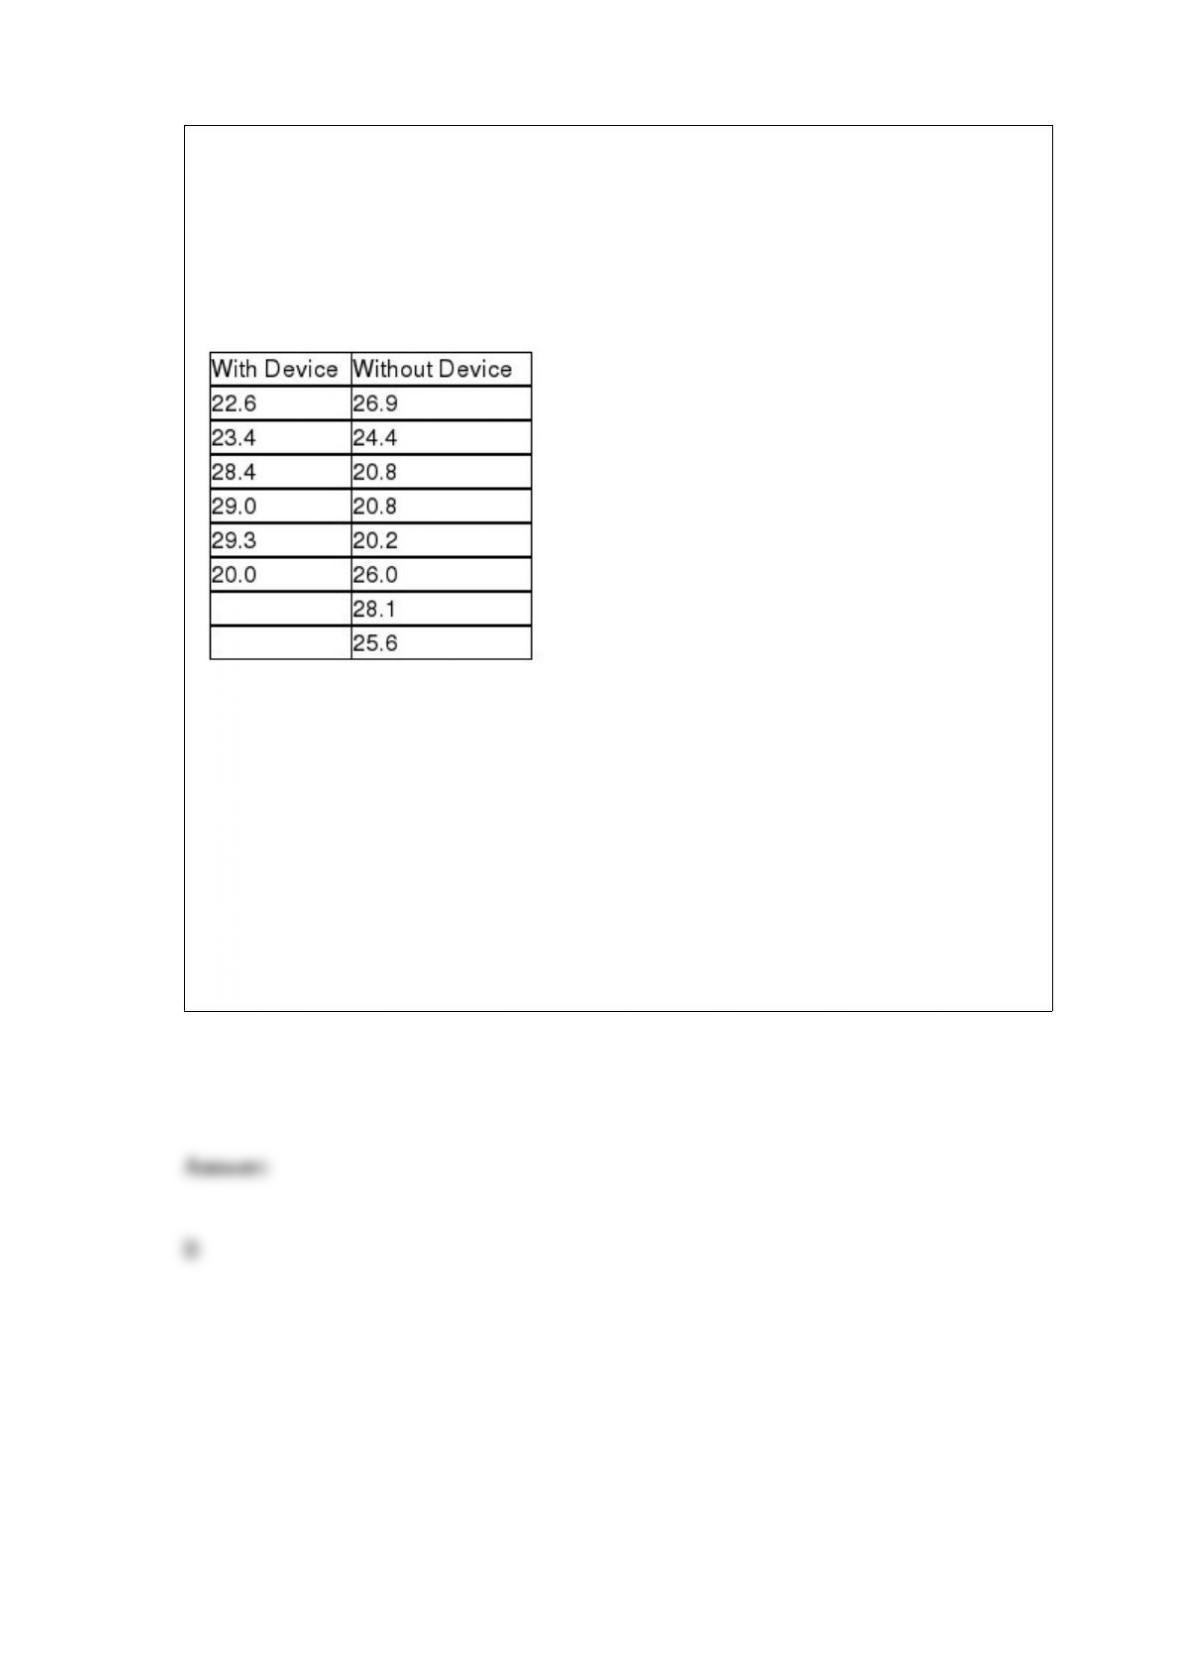
Based on weather data collected in Racine, Wisconsin, on Christmas Day, the weather
had the following distribution:
/Thompson_sn3t_WordExports/Thompson_sn3t_WordExports
Based on these data, what is the probability that next Christmas will be dry?
A) 0.45
B) 0.50
C) 0.60
D) 0.70
Given a binomial distribution with n = 8 and p = 0.40, obtain the probability that the
number of successes is larger than the mean.
A) 0.4059
B) 0.3882
C) 0.2582
D) 0.6070
A company in Maryland has developed a device that can be attached to car engines,
which it believes will increase the miles per gallon that cars will get. The owners are
interested in estimating the difference between mean mpg for cars using the device
versus those that are not using the device. The following data represent the mpg for
independent random samples of cars from each population. The variances are assumed
equal and the populations normally distributed.
Given this data, what is the critical value if the owners wish to have a 90 percent
confidence interval estimate?
A) t = 2.015
B) t = 1.7823
C) z = 1.645
D) z = 1.96