
Analysis of variance can only be done for fixed effects.
A pie chart is almost always constructed when the variable of interest is qualitative.
The forecasting interval is the unit of time for which forecasts are made.
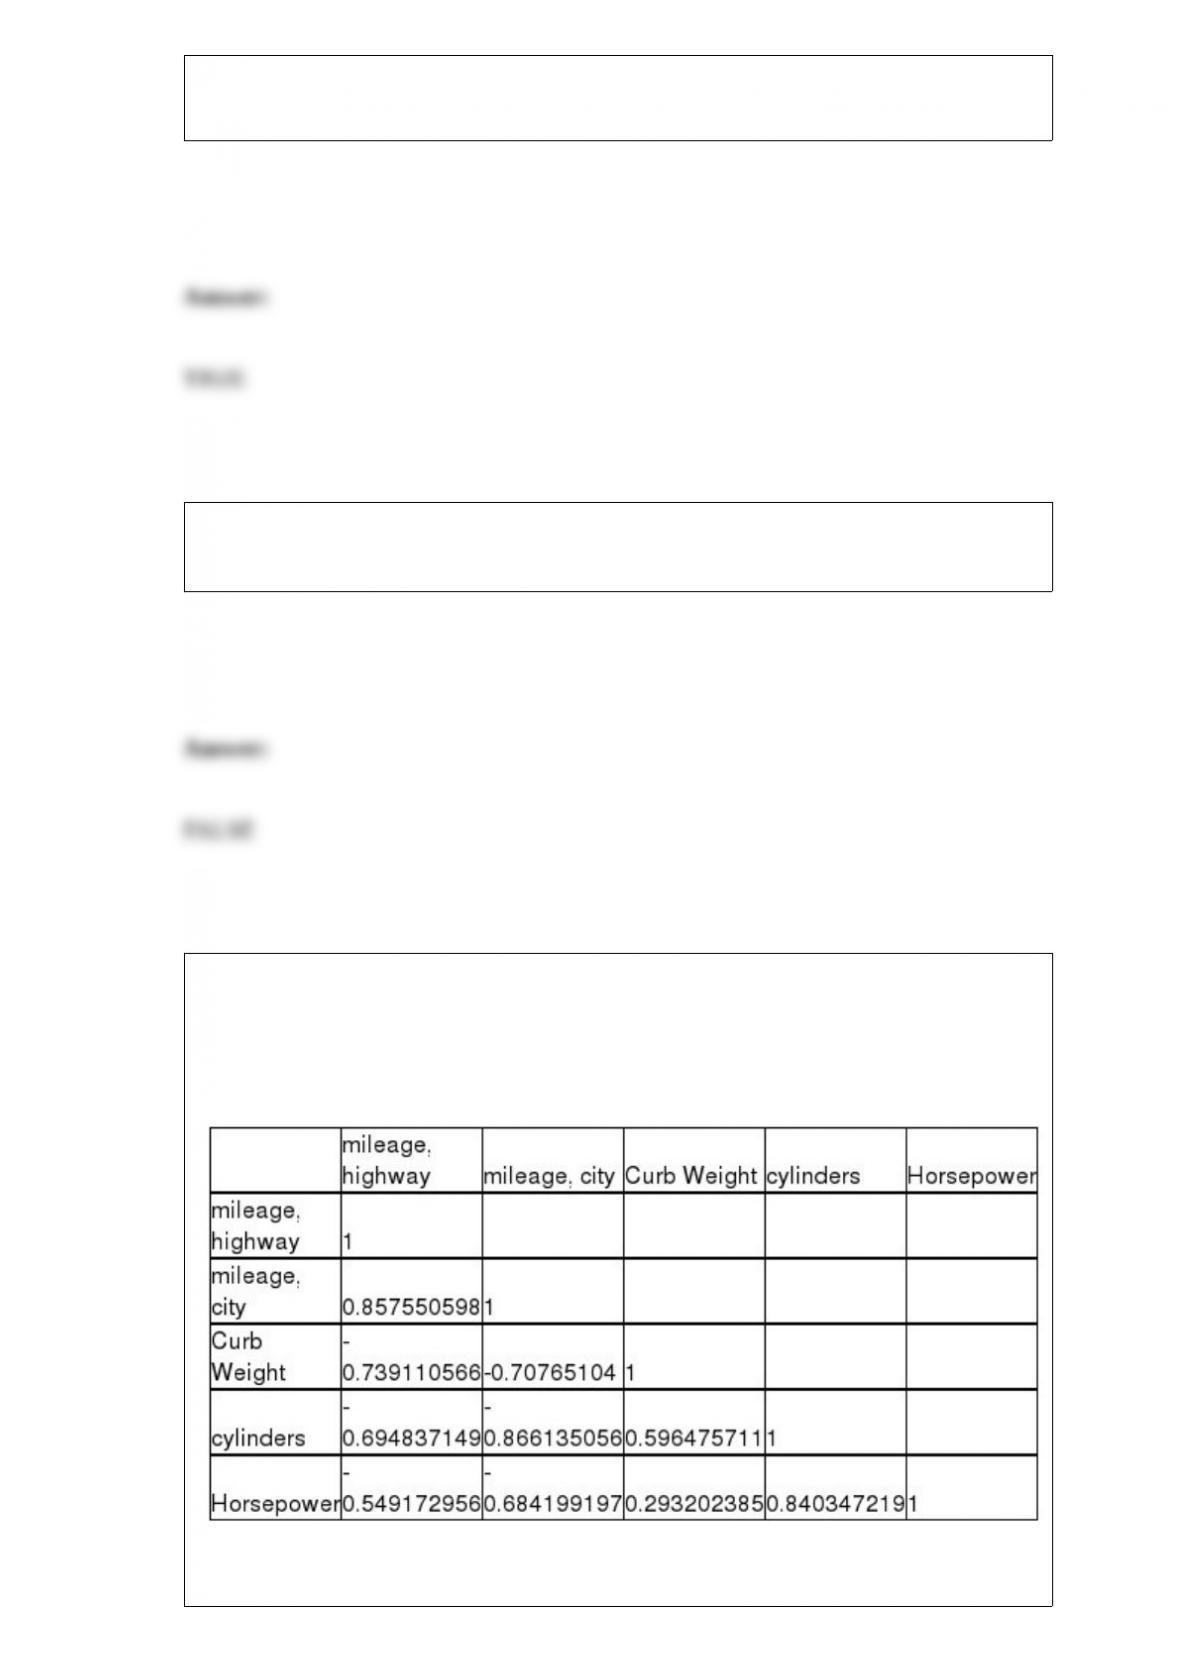
A major car magazine has recently collected data on 30 leading cars in the U.S. market.
It is interested in building a multiple regression model to explain the variation in
highway miles. The following correltion matrix has been computed from the data
collected:
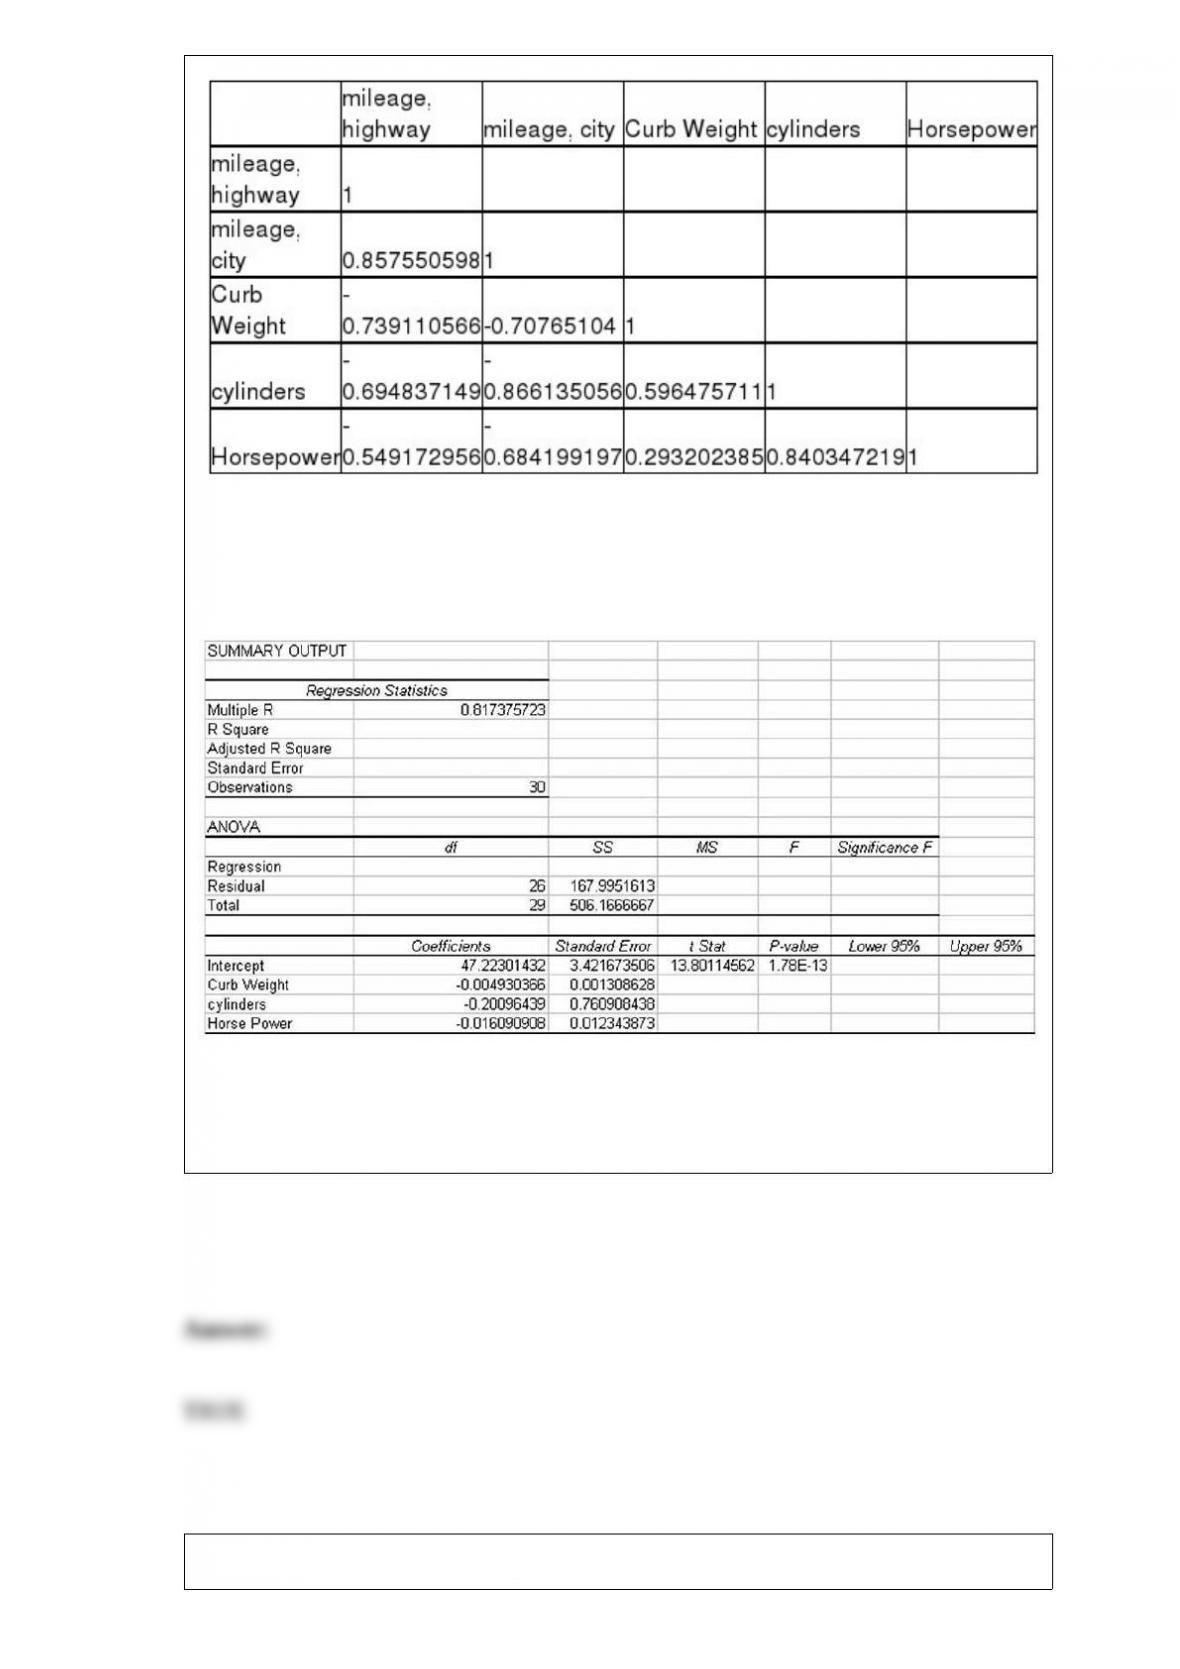
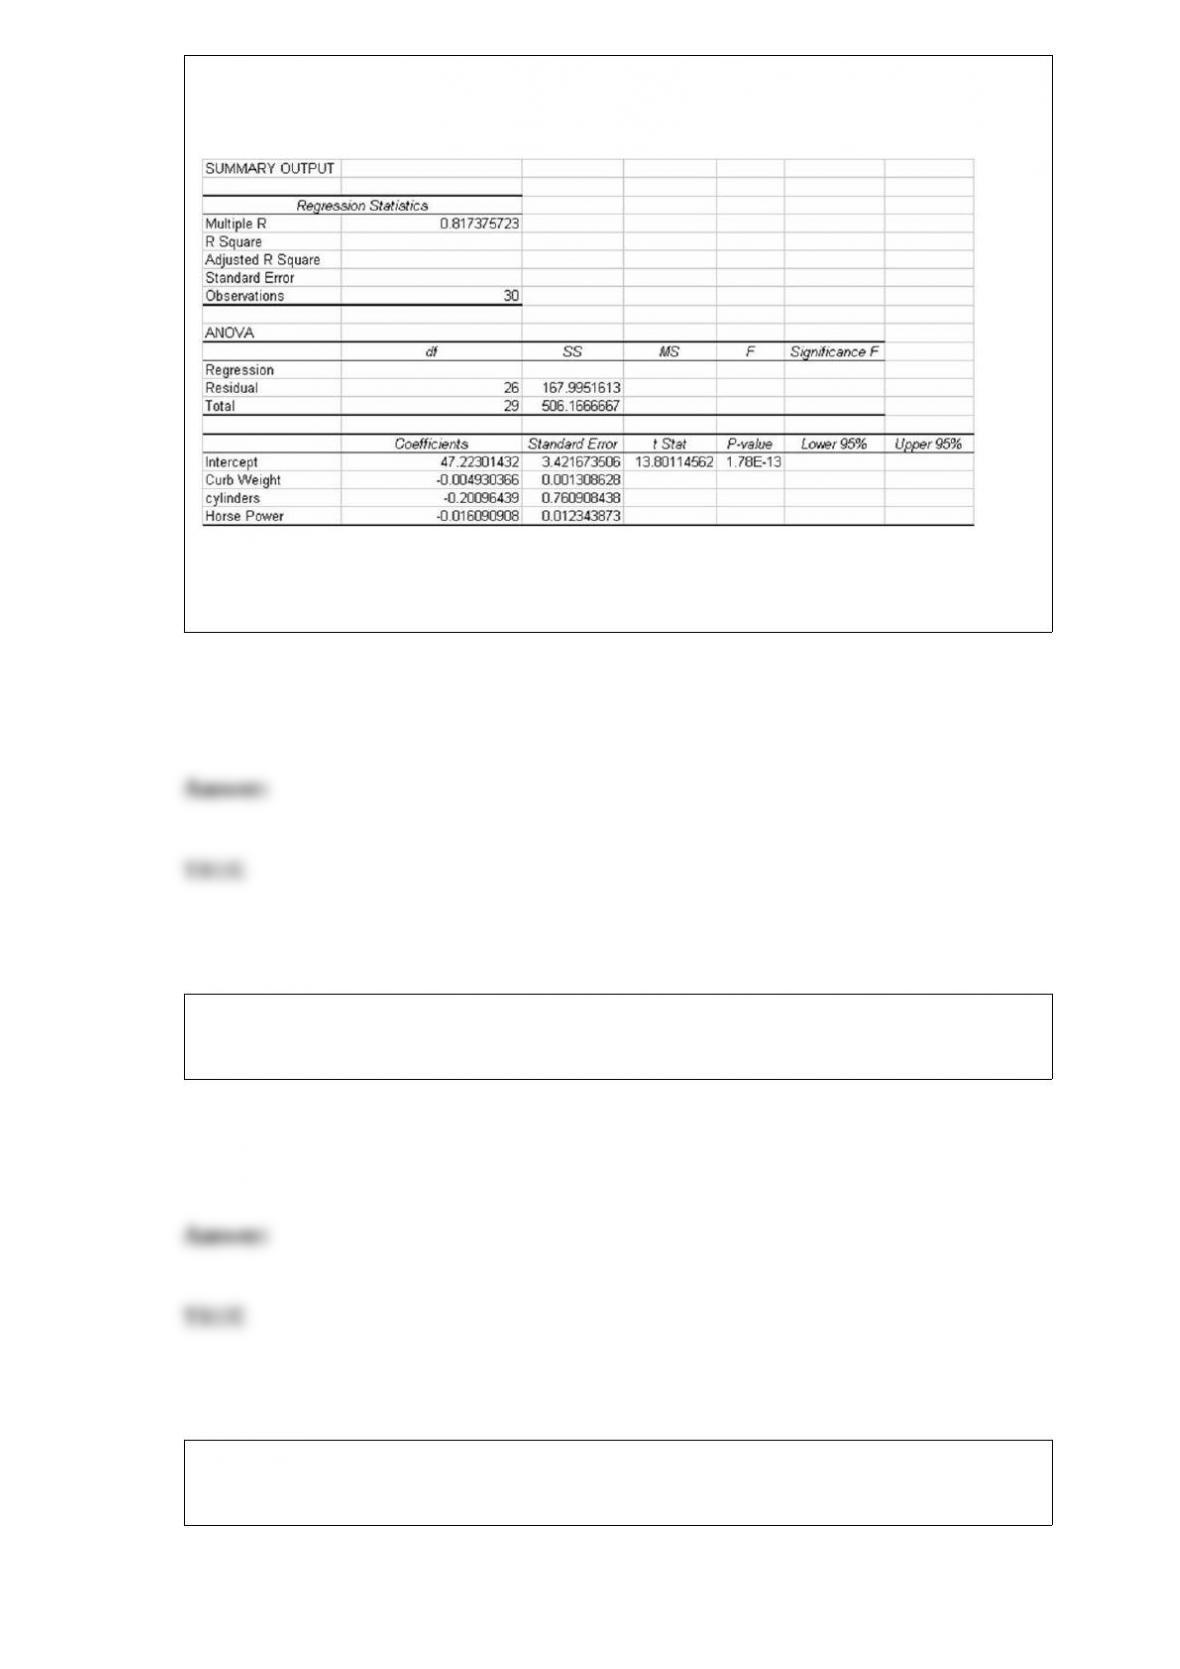
The analysts also produced the following multiple regression output using curb weight,
cylinders, and horsepower as the three independent variables. Note, a number of the
output fields are missing, but can be determined from the information provided.
Based on the information provided, holding the other variables constant, increasing
horsepower by one unit results in an average decrease in highway mileage by 0.016
miles per gallon.
To check out whether the regression assumption involving normality of the error terms
is valid, it is appropriate to construct a normal probability plot. If this plot forms a
straight line from the lower left-hand corner diagonally up to the upper right-hand
corner, the error terms may be assumed to be normally distributed.
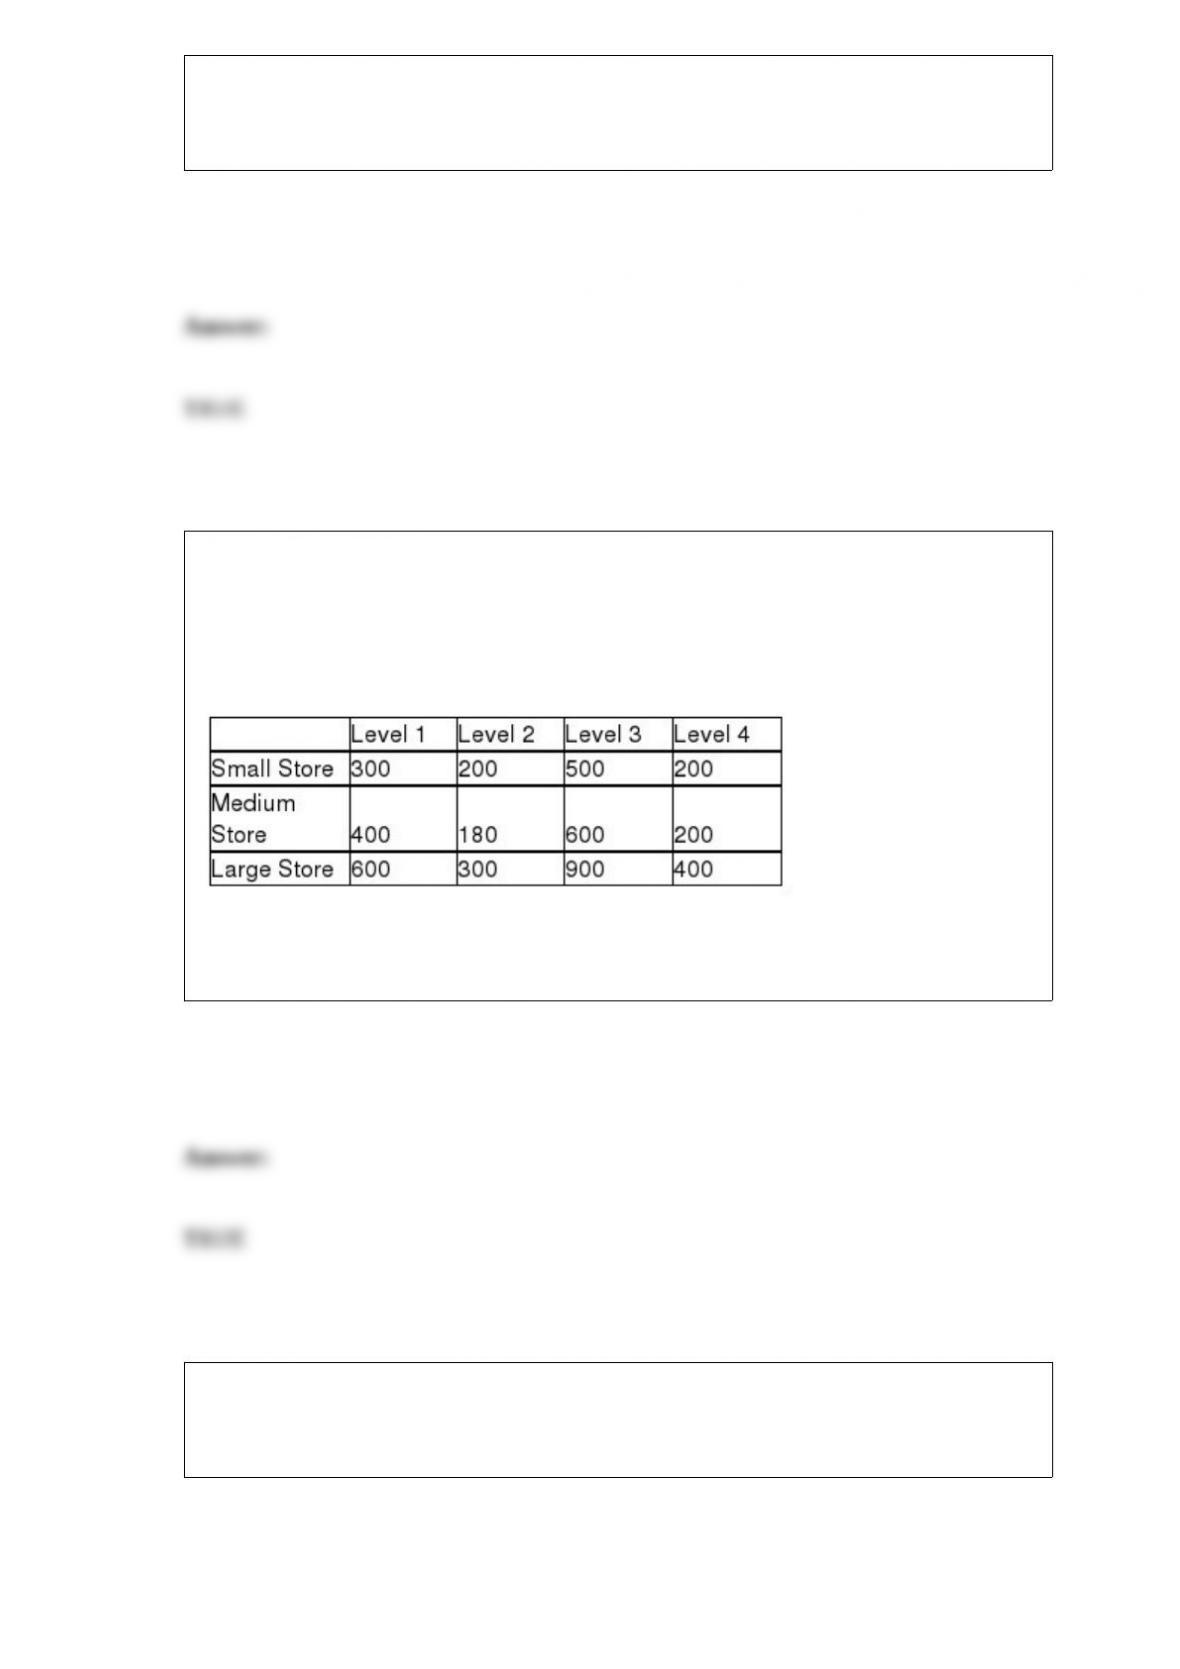
An advertising company is interested in determining if there is a difference in the mean
sales that will be generated for a soft drink company based on which shelf the soft
drinks are located. There are four possible shelf levels. The ad company wants to
control for store size. The following data reflect the sales for one week at each
combination of shelf level and store size.
Based on the experimental design, the calculated F-test statistic value for testing
whether blocking on store size was effective is approximately 16.3.
If you have constructed a joint frequency distribution manually and now wish to
convert it to a joint relative distribution, the proper method is to divide each cell
frequency by the cell’s row total.

To deseasonalize a time series, assuming a multiplicative model, the observed values
are divided by the appropriate seasonal index.
One of the reasons that managers prefer statistical sampling to nonstatistical sampling is
that statistical sampling is generally easier to perform and less expensive.
A regression model that is deemed to have a regression slope coefficient that could be
equal to zero should not be used for prediction since there is no established linear
relationship between the x and y variable.
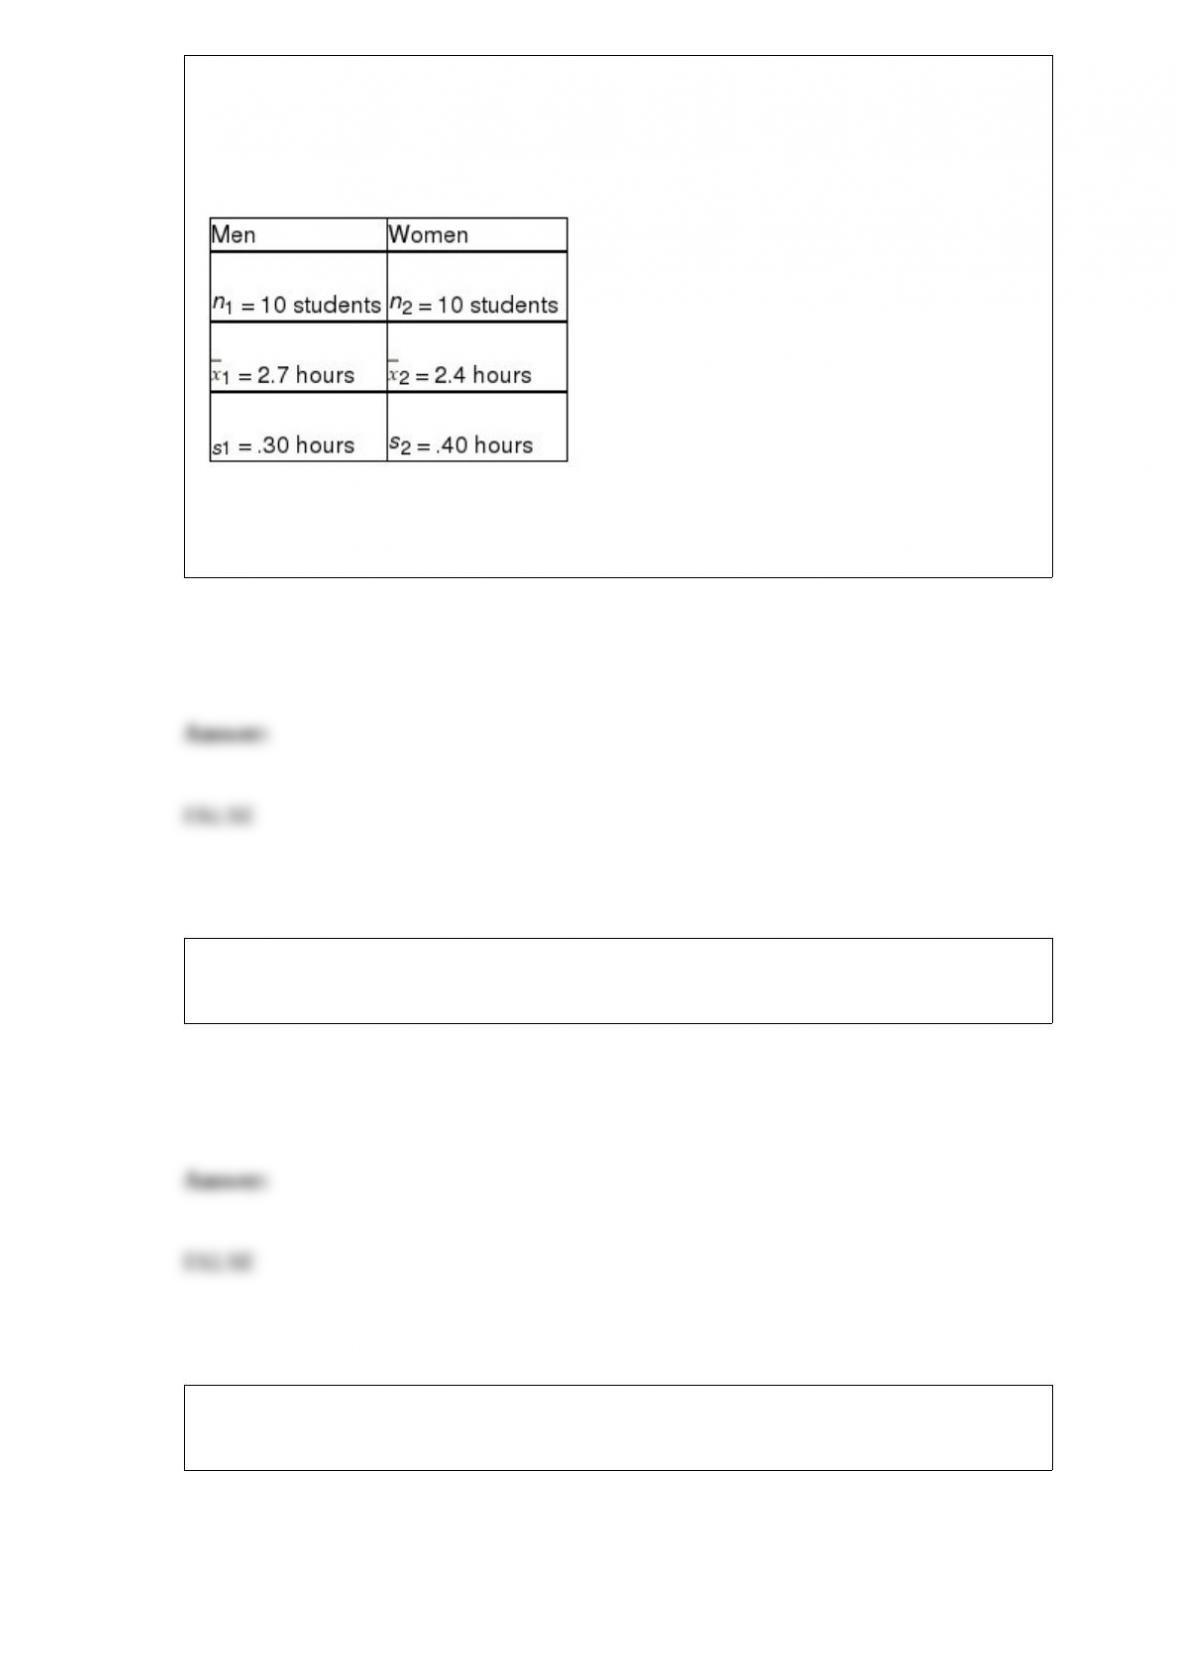
The NCAA is interested in estimating the difference in mean number of daily training
hours for men and women athletes on college campuses. It wants 95 percent confidence
and will select a sample of 10 men and 10 women for the study. The variances are
assumed equal and the populations normally distributed. The sample results are:
Based on these data, the lower limit for the difference between population means is 0.15
hours.
When dealing with the number of occurrences of an event over a specified interval of
time or space, the appropriate probability distribution is hypergeometric.
The Morgan Company is interested in developing a forecast for next month’s sales. It
has collected sales data for the past 12 months.
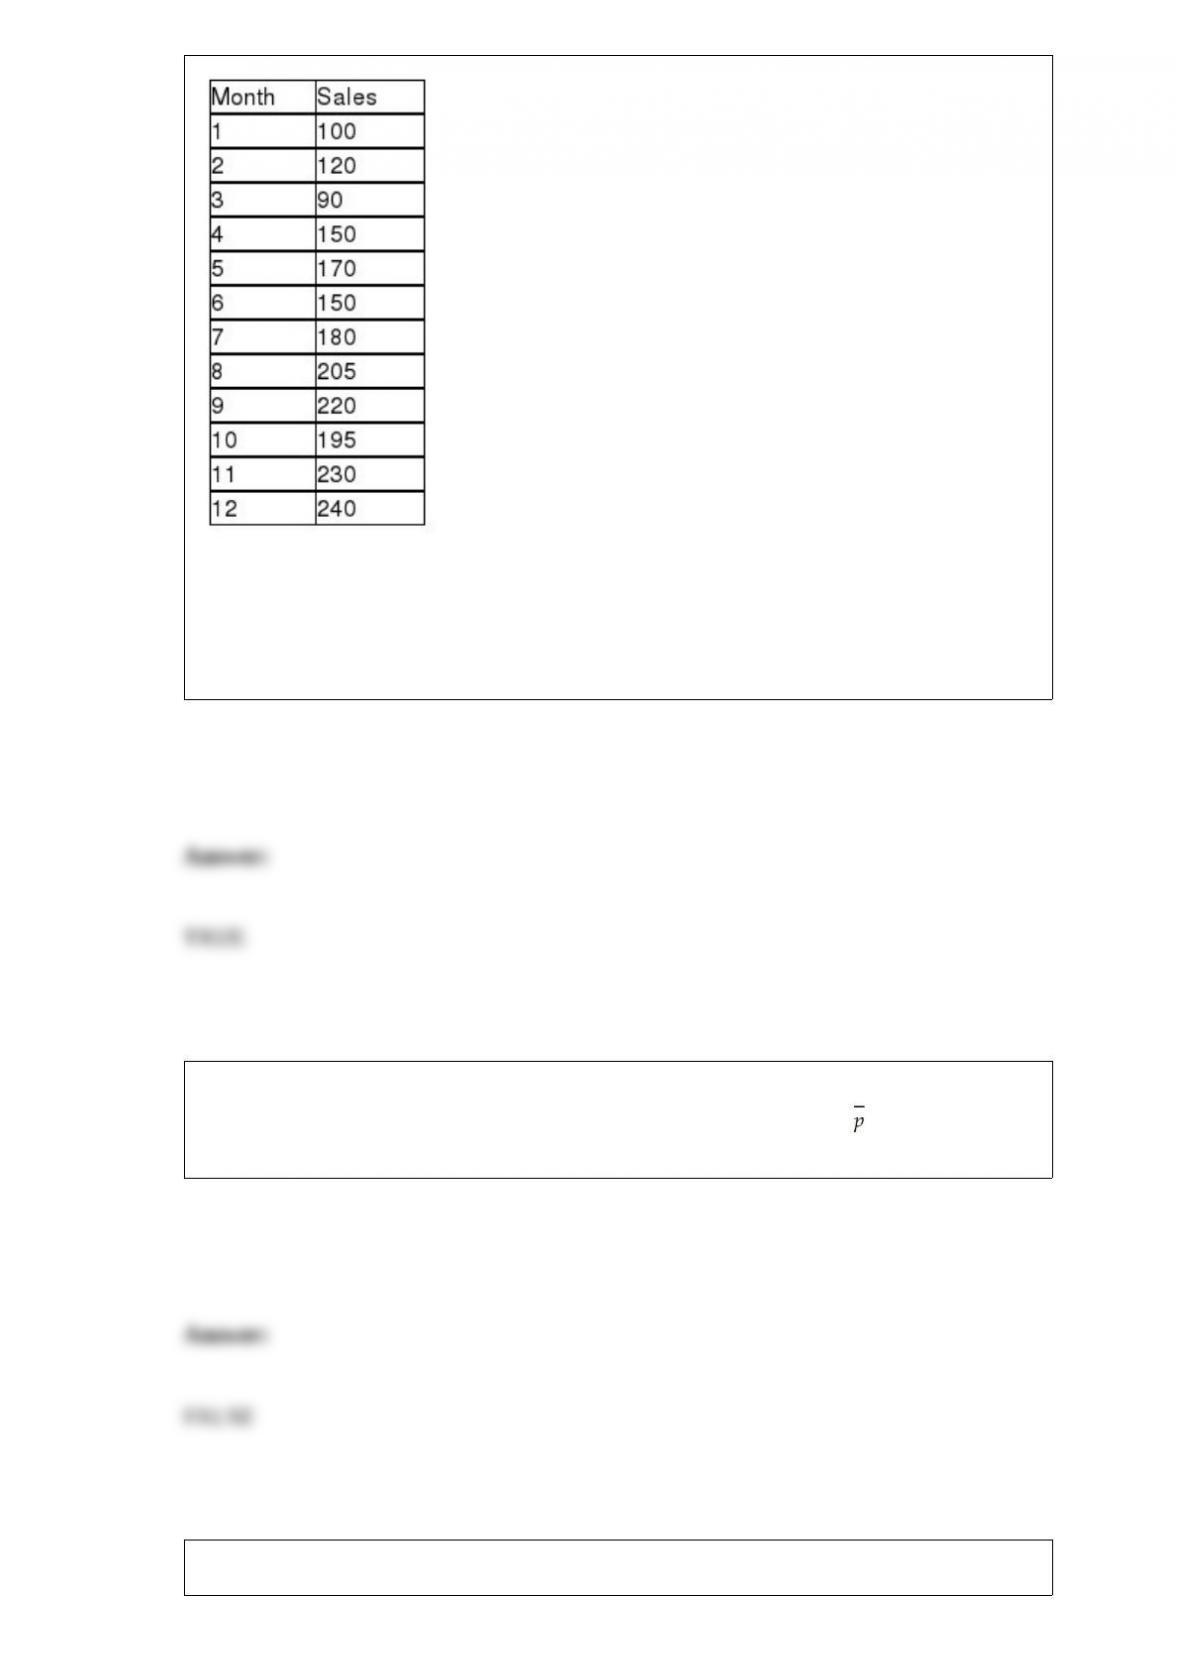
Assuming that the company plans to use double exponential smoothing with starting
values for the smoothed constant process value and smoothed trend value of 98.97 and
13.16 respectively, the MAD value for periods 2-12 is greater when alpha = 0.20 and
beta = 0.20 than when alpha = 0.10 and beta = 0.10.
Regardless of the value of the population proportion, p, (with the obvious exceptions of
p = 0 and p = 1) the sampling distribution for the sample proportion, will be
approximately normally distributed providing that the sample size is large enough.
Renton Industries makes replacement parts for the automobile industry. As part of the
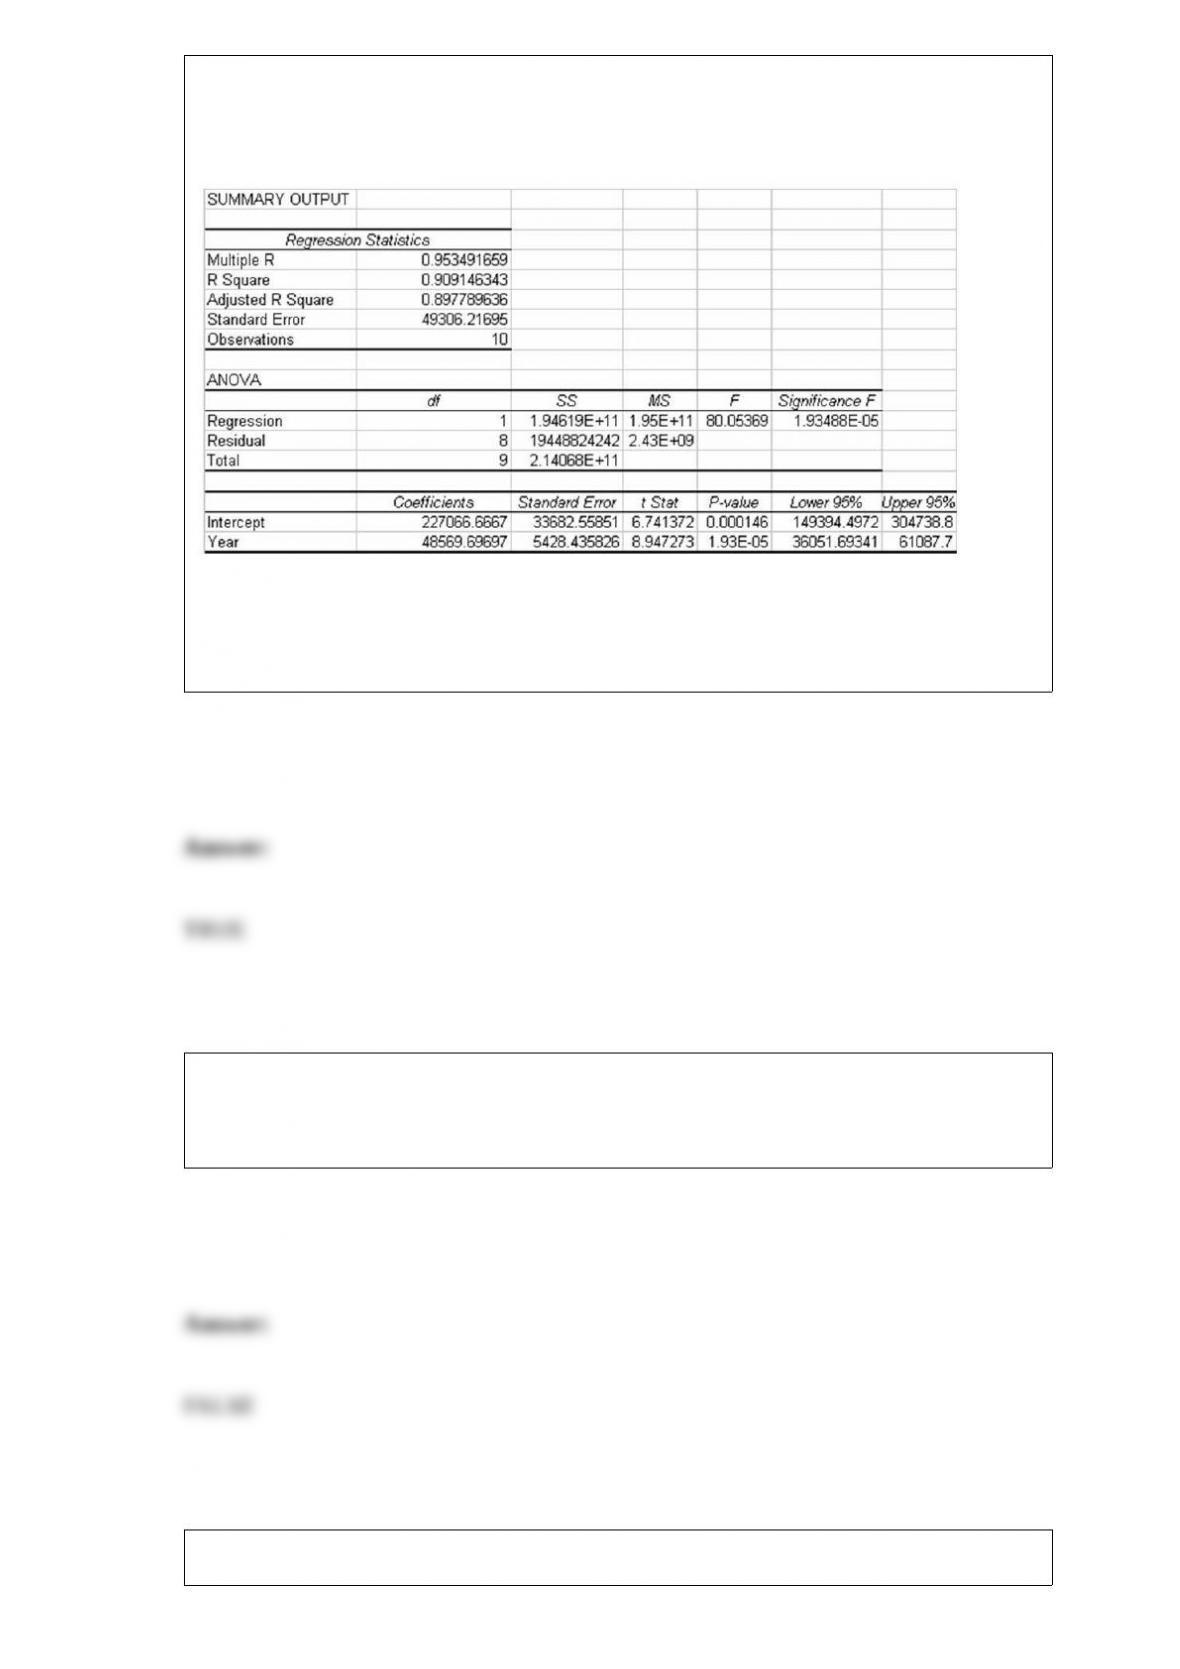
company’s capacity planning, it needs a long-range total demand forecast. The
following information was generated based on 10 years of historical data on total
number of parts sold each year.
Based on this information we can conclude that the linear trend model explains a
significant proportion of the variation in the number of parts sold, because the p-value
is much smaller than any reasonable α that we might use.
In a hypothesis test for the equality of two variances, the lower-tail critical value does
not need to be found as long as the larger sample variance is placed in the denominator
of the test statistic.
In a university statistics course a correlation of -0.8 was found between numbers of
classes missed and course grade. This means that the fewer classes students missed, the
higher the grade.
The adjusted R2 value can be larger or smaller that the R2 values depending on the data
set.
A major car magazine has recently collected data on 30 leading cars in the U.S. market.
It is interested in building a multiple regression model to explain the variation in
highway miles. The following correlation matrix has been computed from the data
collected:
The analysts also produced the following multiple regression output using curb weight,
cylinders, and horsepower as the three independent variables. Note that a number of the
output fields are missing, but can be determined from the information provided.
Based on the information provided, the three independent variables explain
approximately 67 percent of the variation in the highway mileage among these 30 cars.
When a single die is rolled, each of the six sides are equally likely. This is an example
of a uniform distribution.
The Wilcoxon signed rank test is used for testing hypotheses about a population median
if the data are at nominal level.

If a decision maker desires a small margin of error and a high level of confidence, it is
certain that the required sample size will be quite large.
If you have an ordinal variable, it is possible to precisely measure the magnitude of the
difference between the possible values of the variable.
If two variables are spuriously correlated, it means that the correlation coefficient
between them is near zero.
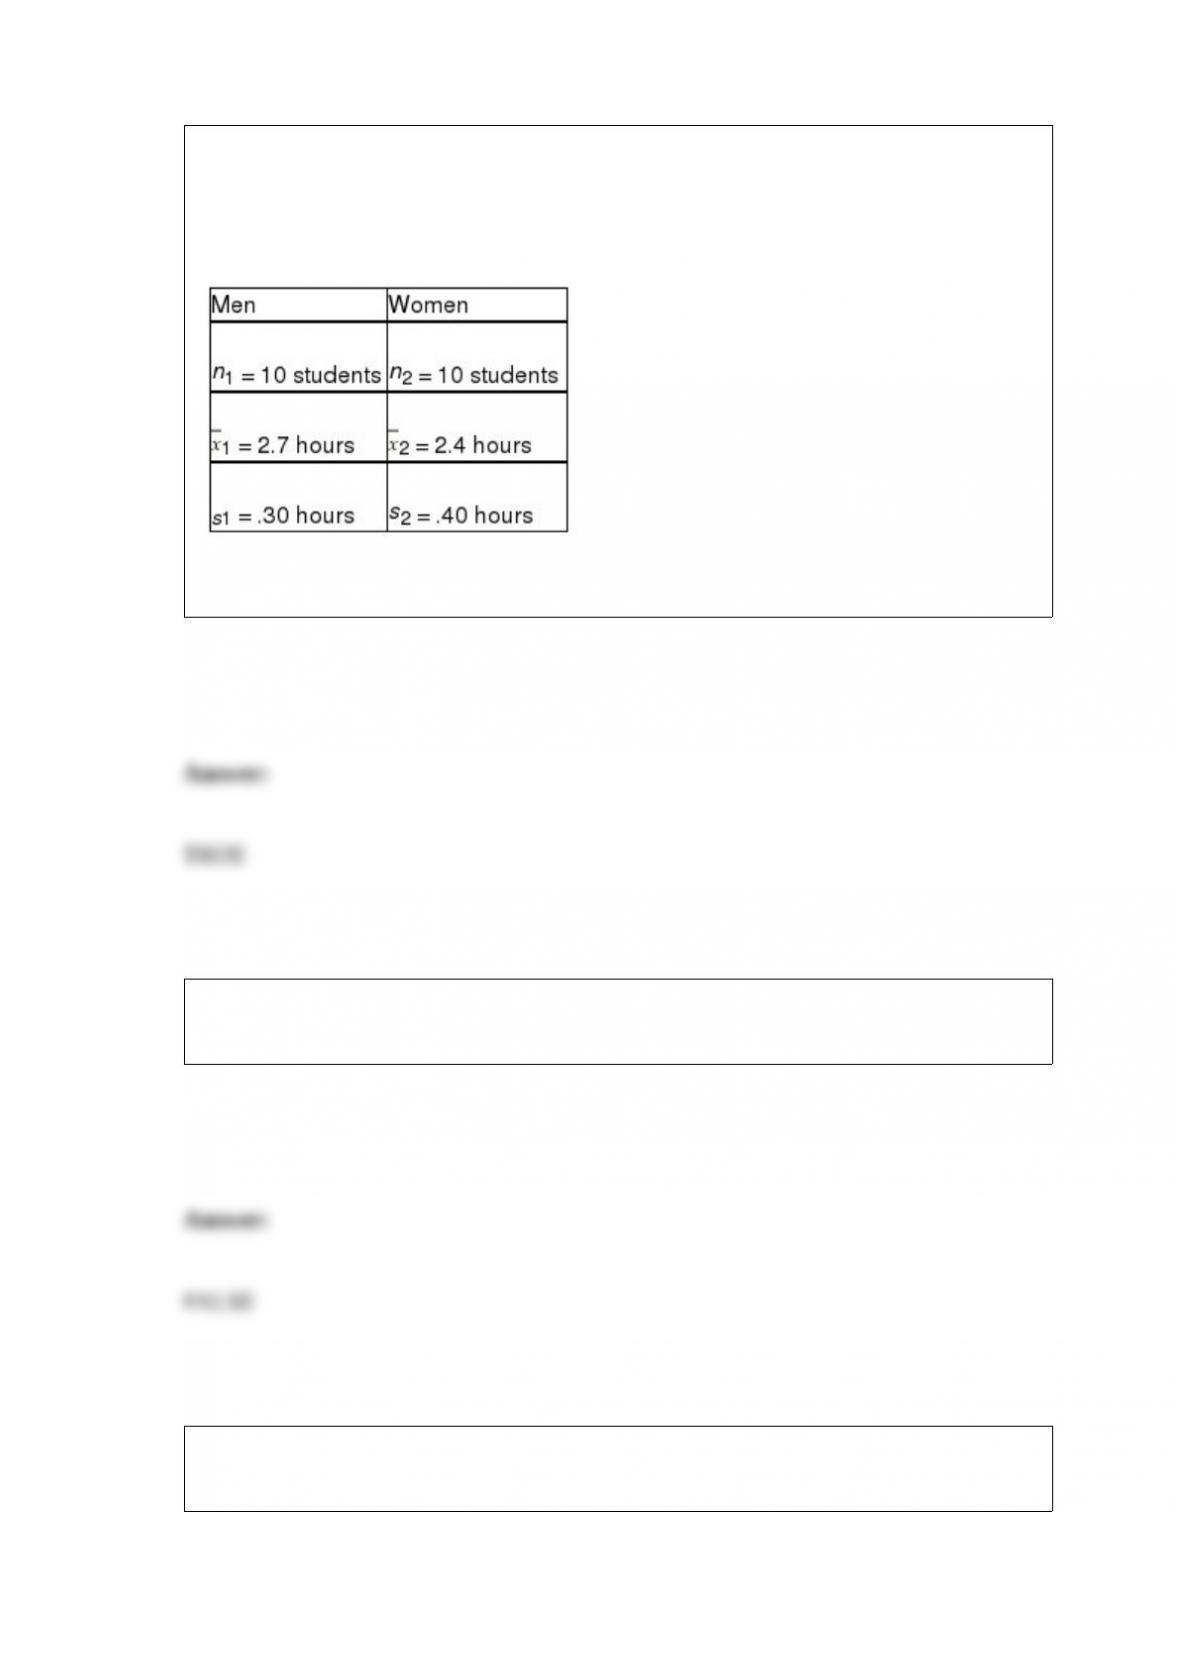
The NCAA is interested in estimating the difference in mean number of daily training
hours for men and women athletes on college campuses. They want 95 percent
confidence and will select a sample of 10 men and 10 women for the study. The sample
results are:
Based on these data, the point estimate is .30 hours.
A random variable is generated when a variable’s value is determined by using classical
probability.
A survey was recently conducted in which males and females were asked whether they
owned a laptop personal computer. The following data were observed:
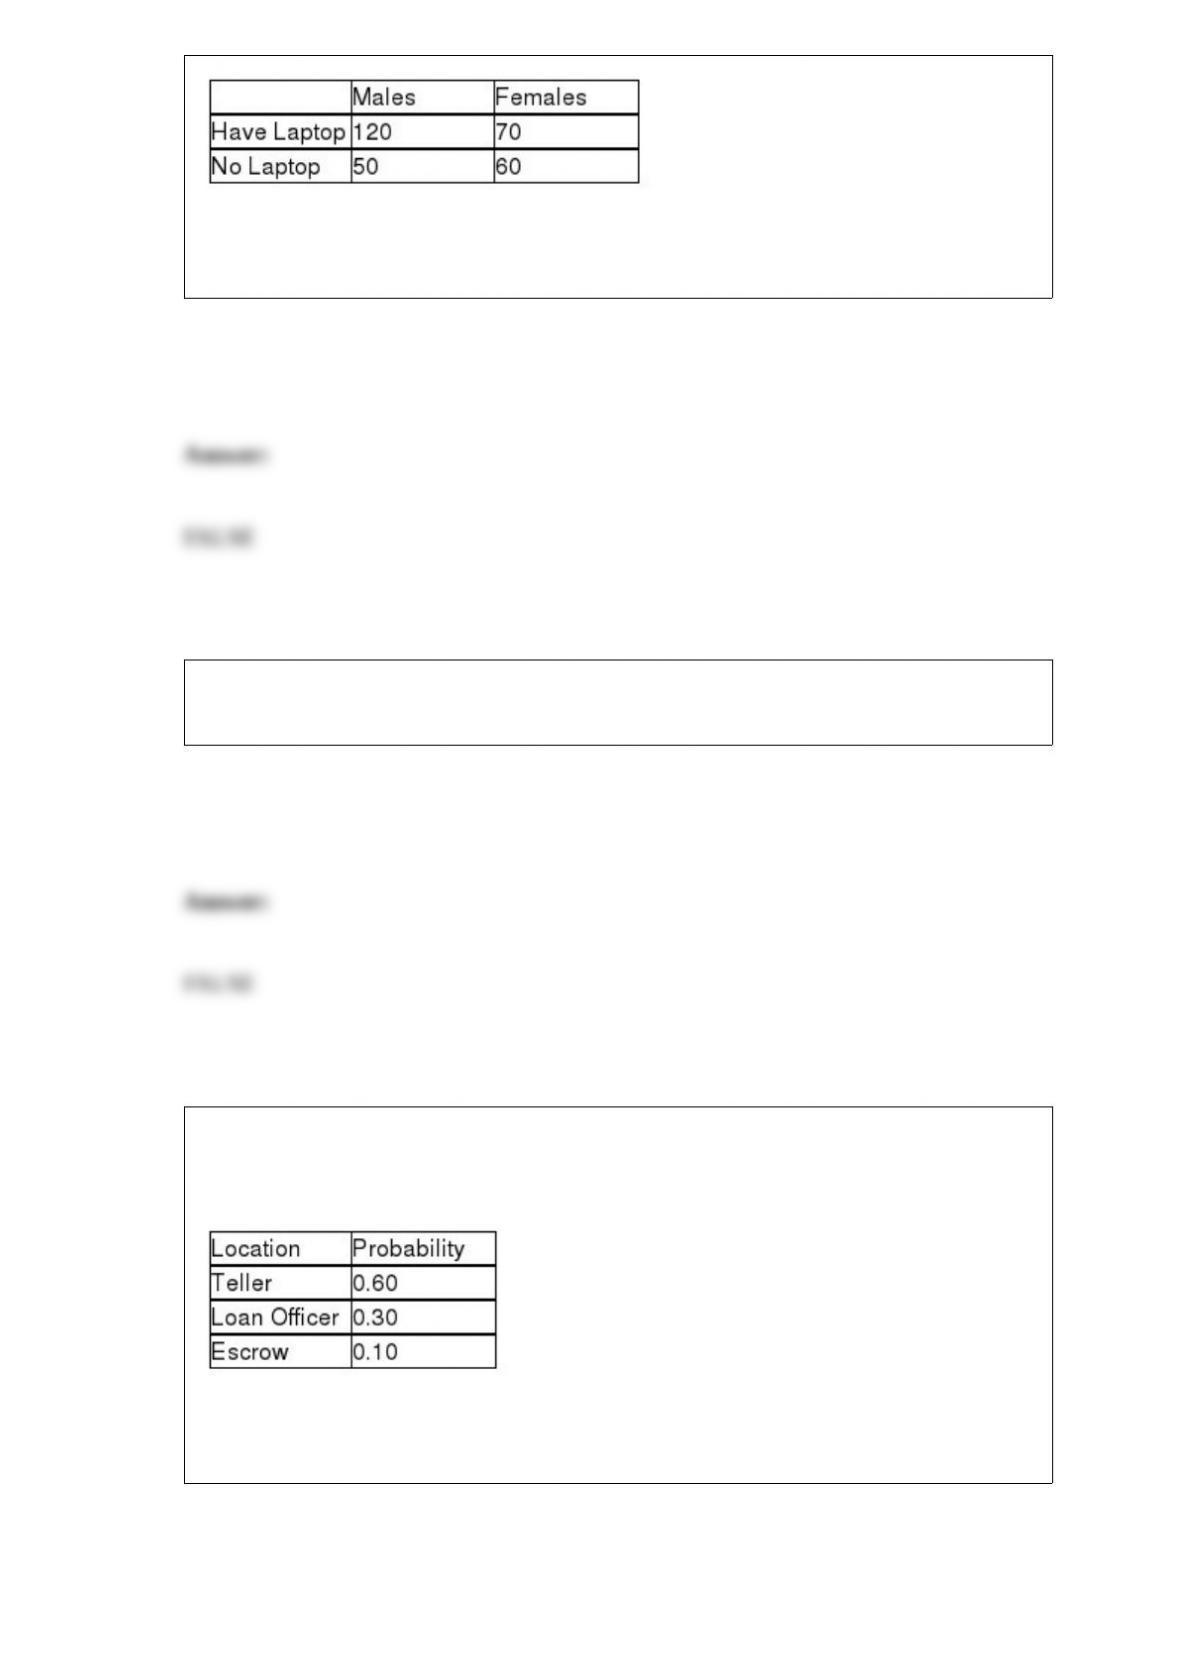
Given this information, if an alpha level of .05 is used, the test statistic for determining
whether having a laptop is independent of gender is approximately 14.23.
In most processes, the process control limits are set to correspond with the specification
limits on the product.
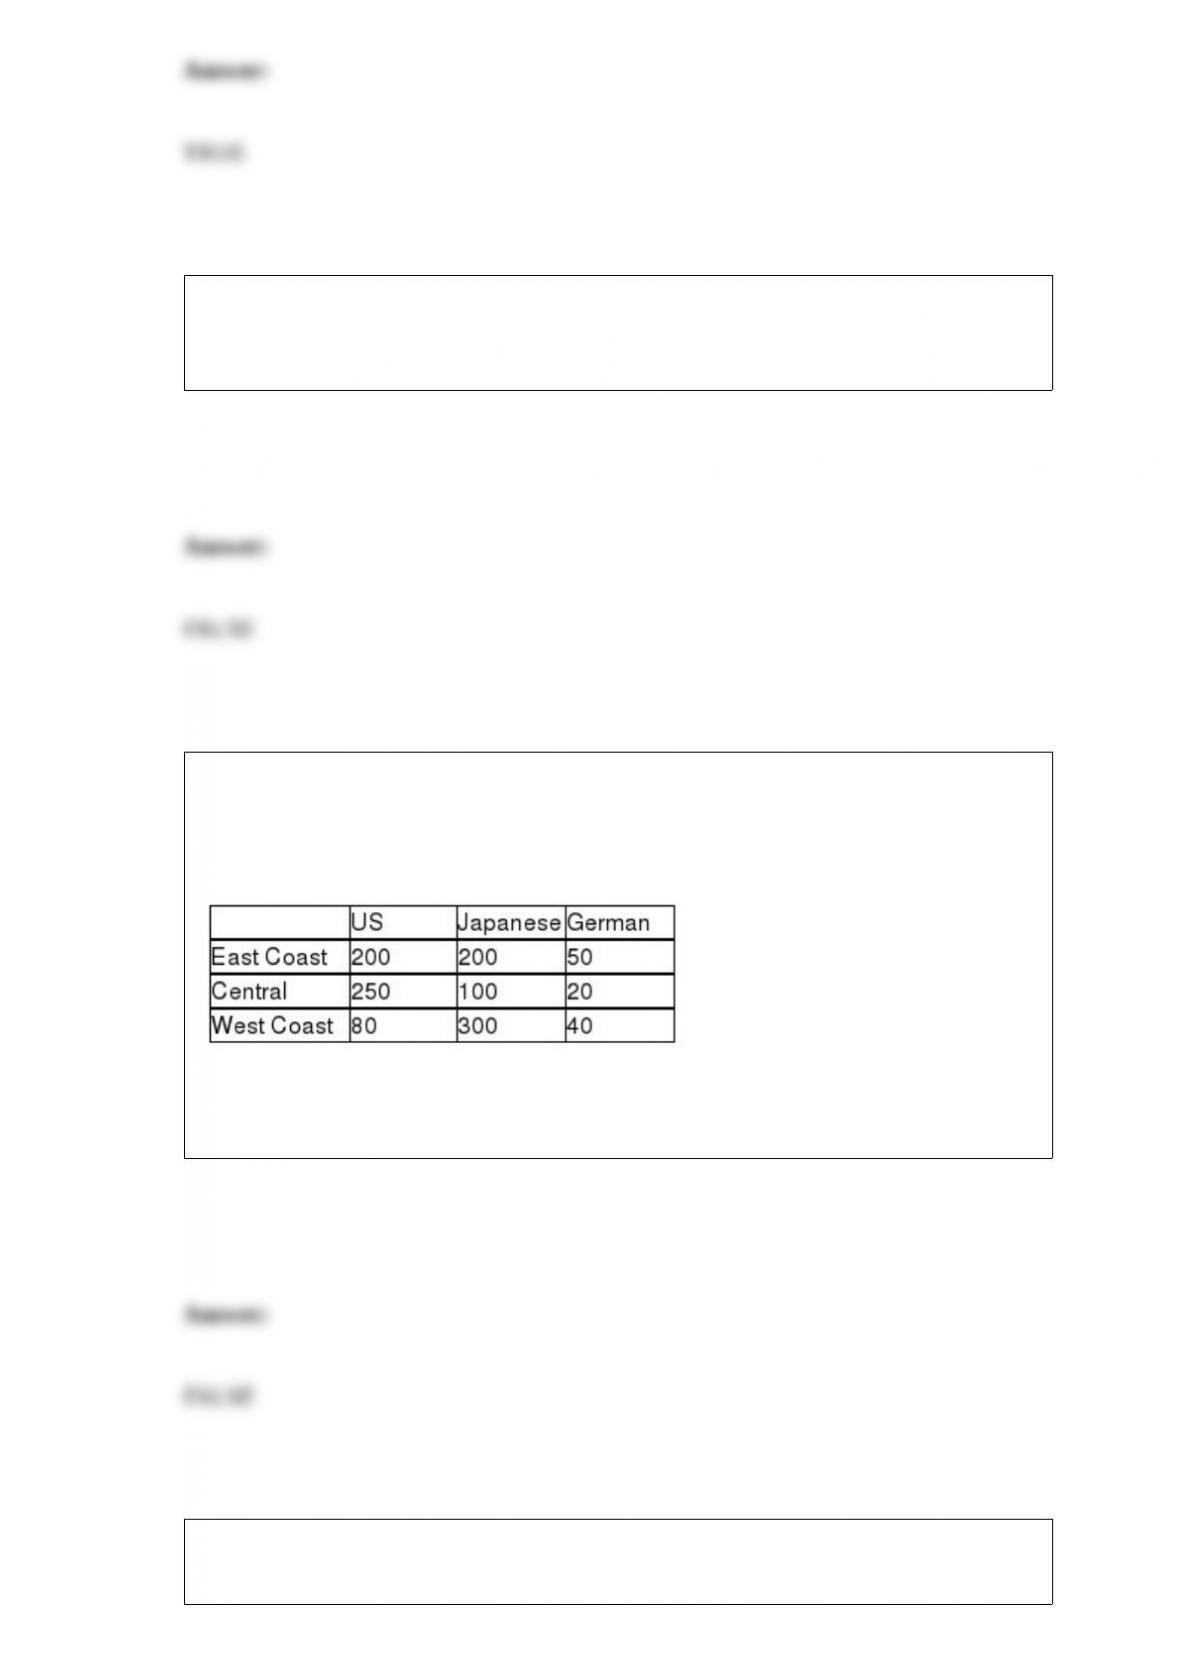
When customers come to a bank, there are three primary locations they may select to go
to: teller, loan officer, or escrow department. Based on past experience, the following
probability distribution applies:
Seventy percent of customers are males. The probability that the next customer will be
male and will go to either the teller or the escrow department is 0.49.
If a time-series plot indicates that the data do not appear to exhibit a trend, then a
double exponential smoothing model would likely be the most appropriate to use rather
than simple exponential smoothing model.
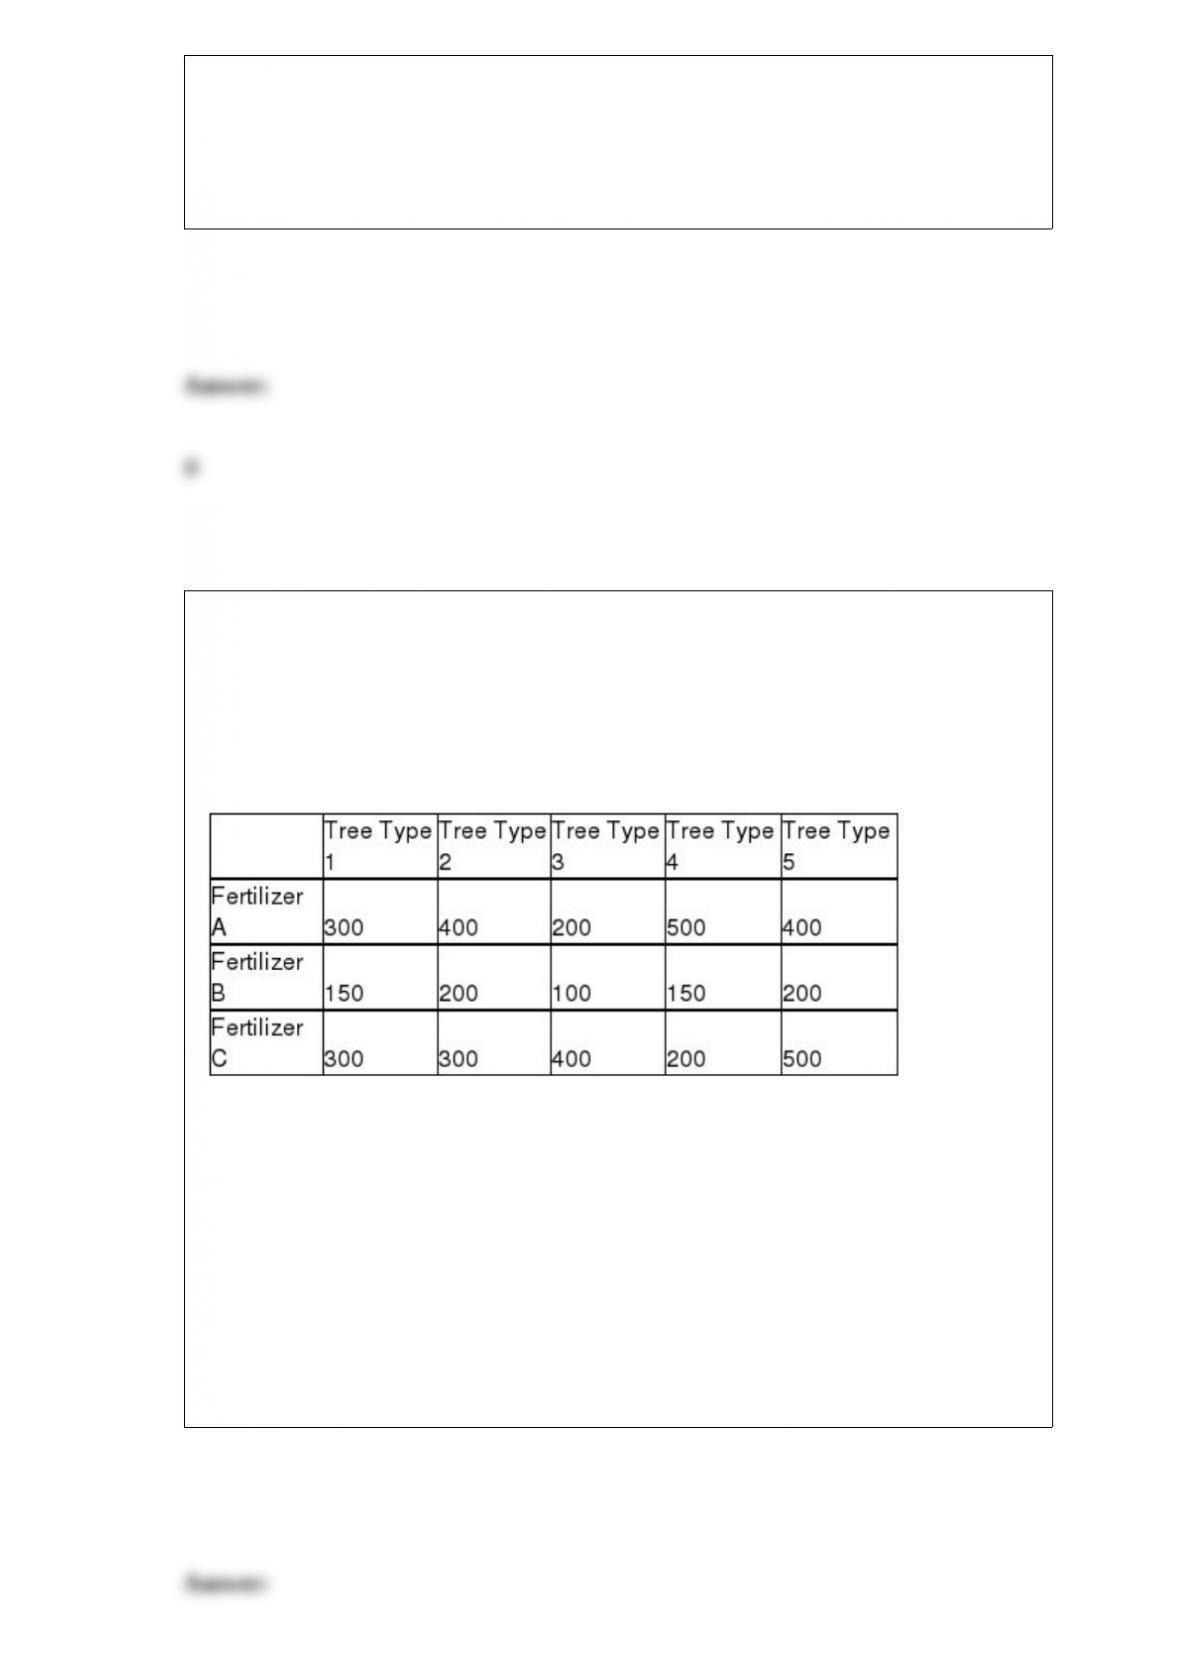
A study was recently done in the United States in which car owners were asked to
indicate whether their most recent car purchase was a U.S. car, a German car, or a
Japanese car. The people in the survey were divided by geographic region in the United
States. The following data were recorded.
Given this situation, to test whether the car origin is independent of the geographical
location of the buyer, the critical value for alpha = .10 is 14.6837.
A local paint store carries 4 brands of paint (W, X, Y, and Z). The store has 5 cans of W,
3 cans of X, 6 cans of Y, and 15 cans of Z, all in white. It is thought that customers have

no preference for one of these brands over another. If this is the case, what is the
probability that the next 5 customers will select 1 can of W, X, Y and 2 cans of brand Z?
A) About .23
B) Approximately .08
C) Over .30
D) 0.25
To use contingency analysis for numerical data, which of the following is true?
A) Contingency analysis cannot be used for numerical data.
B) Numerical data must be broken up into specific categories.
C) Contingency analysis can be used for numerical data only if both variables are
numerical.
D) Contingency analysis can be used for numerical data only if it is interval data.
At gambling casinos all over the country, a popular dice game is called craps. The
probability of a player winning at this game can be assessed using:
A) subjective assessment.
B) classical probability.
C) relative frequency of occurrence.
D) None of the above
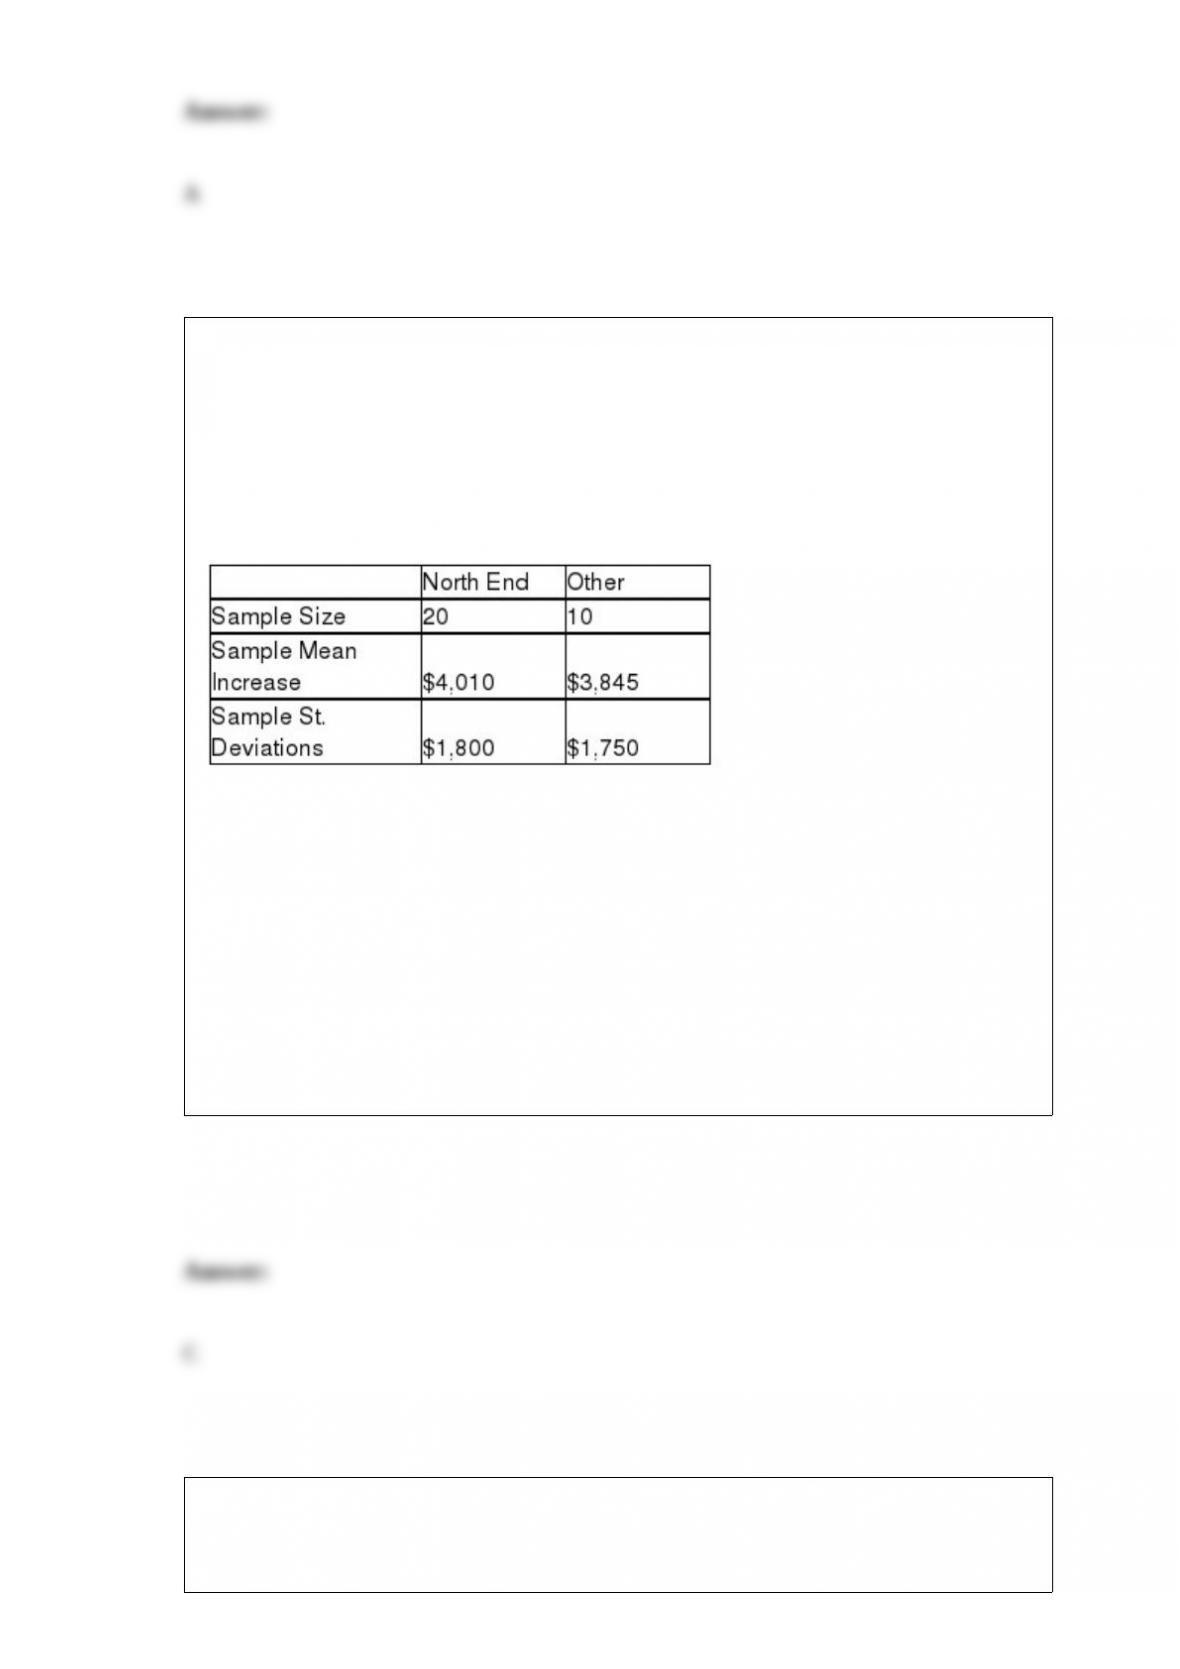
A large orchard owner in the state of Washington is interested in determining whether
the mean number of bushels of peaches per acre is the same or different depending on
the type of tree that is used. He also thinks that production may be affected by the type
of fertilizer that is used. To test, he has set up a test in which a one-acre plot of peach
trees with a combination each of 5 varieties and 3 fertilizer types are studied. The
following data reflect the number of bushels of peaches on each acre plot.
Assuming that the hypothesis tests will be conducted using an alpha equal 0.05 level,
what is the value of the Fisher’s LSD critical value for doing the multiple comparisons?
A) Approximately 16.78
B) About 11.30
C) Approximately 186.7
D) Need to know the number of trees planted on each acre.

The Internal Revenue Service (IRS) is interested in estimating the mean amount of
money spent on outside tax service by income tax filers filing as single on their
individual form. To do this, they have selected a random sample of n = 16 people from
this population and surveyed them to determine the sample mean and sample standard
deviation. The following information was observed:
Given this information, what is the 95 percent confidence interval for the mean dollars
spent on outside tax assistance by taxpayers who file as single?
A) Approximately $72.19 – $105.01
B) About $22.97 – $154.23
C) Approximately $80.90 – $96.30
D) About $28.25 – $148.95
The chamber of commerce in a beach resort town wants to estimate the proportion of
visitors who are repeat visitors. From previous experience they believe the portion is in
the vicinity of 0.5 and they want to estimate the proportion to within 0.03 percentage
points with 95 percent confidence. The sample size they should use is:
A) n = 1068
B) n = 545
C) n = 33
D) n = 95
There have been complaints recently from homeowners in the north end claiming that
their homes have been assessed at values that are too high compare with other parts of
town. They say that the mean increase from last year to this year has been higher in
their part of town than elsewhere. To test this, the assessor’s office staff plans to select a
random sample of north end properties (group 1) and a random sample of properties
from other areas within the city (group 2) and perform a hypothesis test. The following
sample information is available:
Assuming that the null hypothesis will be tested using an alpha level equal to 0.05, what
is the value of the test statistic?
A) z = 1.578
B) t = 1.7011
C) t = 0.2388
D) t = 0.3944
Ponderosa Paint and Glass carries three brands of paint. A customer wants to buy
another gallon of paint to match paint she purchased at the store previously. She can’t
recall the brand name and does not wish to return home to find the old can of paint. So

she selects two of the three brands of paint at random and buys them.
Her husband also goes to the paint store and fails to remember what brand to buy. So he
also purchases two of the three brands of paint at random. Determine the probability
that both the woman and her husband fail to get the correct brand of paint. (Hint: Are
the husband’s selections independent of his wife’s selections?)
A) 3/2
B) 2/3
C) 1/9
D) 3/4
Three events occur with probabilities P(E1) = 0.35, P(E2) = 0.15, P(E3) = 0.40. If the
event B occurs, the probability becomes P(E1|B) = 0.25, P(B) = 0.30.
Assume that E1, E2, and E3 are independent events. Calculate P(E1 and E2 and E3).
A) 0.575
B) 0.075
C) 0.021
D) 0.475

Recently, a legislative committee commissioned a study of incomes in a western state.
At issue was whether the ratings of the legislature’s performance differed between rural
citizens and city residents. A random sample of 25 city residents and 35 rural residents
was asked to rate the performance of the legislature on a scale of 1 to 100. The analysts
believe that the population distribution of ratings would be highly skewed so they
decided to use the Mann-Whiney U test to test whether there is a difference in median
ratings by the two groups. Given this information, which of the following is the correct
critical value if the test is to be conducted at the .10 level of significance?
A) z = 1.96
B) t = 2.0357
C) U = 437.5
D) z = 1.645
A study was recently conducted at a major university to determine whether there is a
difference in the proportion of business school graduates who go on to graduate school
within five years after graduation and the proportion of non-business school graduates
who attend graduate school. A random sample of 400 business school graduates showed
that 75 had gone to graduate school while in a random sample of 500 non-business
graduates, 137 had gone on to graduate school. Based on these sample data, and testing
at the 0.10 level of significance, what is the value of the test statistic?
A) Approximately z = 1.645
B) About z = -3.04
C) Approximately z = 3.45
D) About z = 1.96
At a manufacturing plant workers are divided into 4 different teams that rotate shifts.
The number of units produced by each team is recorded. The best type of chart to
display the data is a:
A) pie chart.
B) histogram.
C) ogive.
D) line chart.
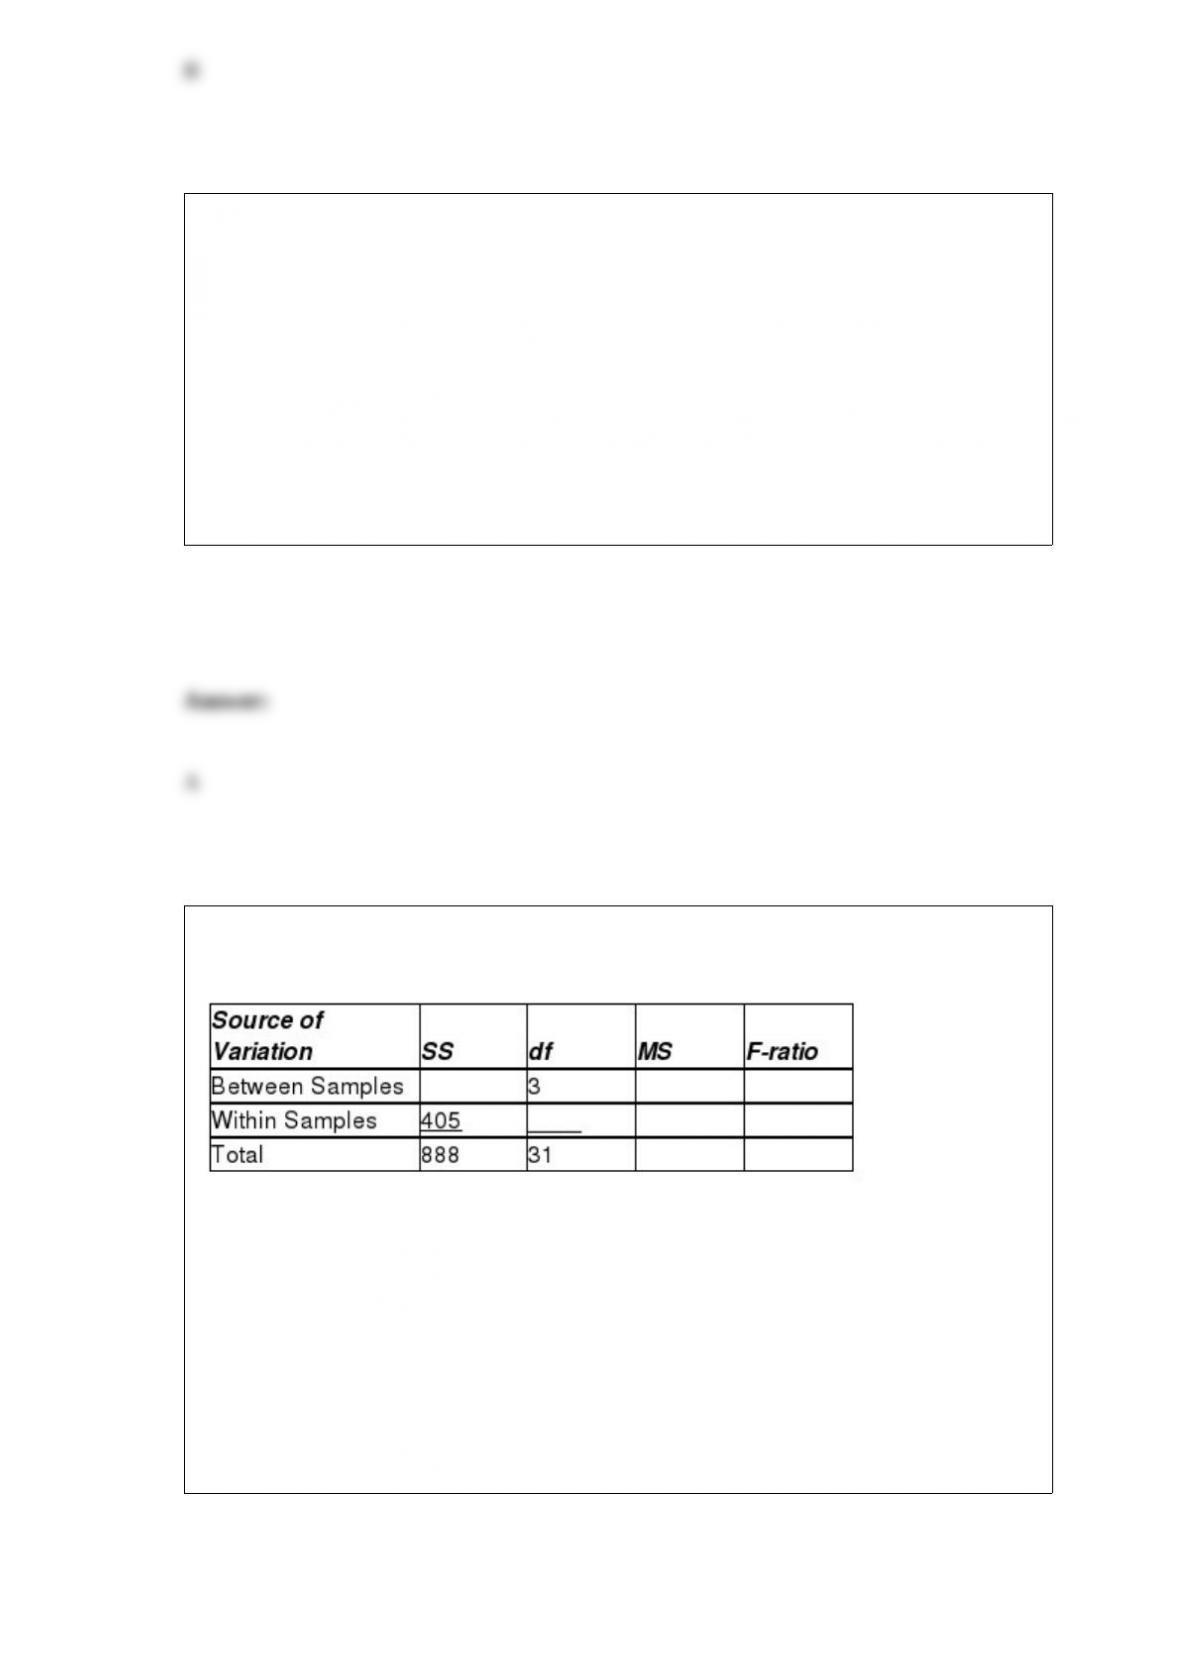
Respond to the following questions using this partially completed one-way ANOVA
table:
How many different populations are being considered in this analysis?
A) 2
B) 4
C) 6
D) 5

A professor wishes to develop a numerical method for giving grades. He intends to base
the grade on homework, two midterms, a project, and a final examination. He wishes
the final exam to have the largest influence on the grade. He wants the project to have
10%, each midterm to have 20%, and the homework to have 10% of the influence of
the semester grade.
For a student with the following grades during the quarter, calculate a weighted average
for the course:
A) 68.50
B) 73.30
C) 68.30
D) 70.30
The number of customers who enter a bank is thought to be Poisson distributed with a
mean equal to 10 per hour. What are the chances that 2 or 3 customers will arrive in a
15-minute period?
A) 0.0099
B) 0.4703

C) 0.0427
D) 0.0053
The Jack In The Box franchise in Bangor, Maine, has determined that the chance a
customer will order a soft drink is 0.90. The probability that a customer will order a
hamburger is 0.60. The probability that a customer will order french fries is 0.50.
If a customer places an order, what is the probability that the order will include a soft
drink and no fries if these two events are independent?
A) 0.45
B) 0.50
C) 0.65
D) 0.70
In conjunction with the housing foreclosure crisis of 2009, many economists expressed
increasing concern about the level of credit card debt and efforts of banks to raise
interest rates on these cards. The banks claimed the increases were justified. A Senate
subcommittee decided to determine if the average credit card balance depends on the
type of credit card used. Under consideration are Visa, MasterCard, Discover, and
American Express. The sample sizes to be used for each level are 25, 25, 26, and 23,
respectively.

State the number of degrees of freedom available for determining the total variation.
A) 93
B) 95
C) 98
D) 97
A manager wishes to estimate a population mean using a 95% confidence interval
estimate that has a margin of error of 44.0. If the population standard deviation is
thought to be 680, what is the required sample size?
A) 1215
B) 871
C) 1050
D) 918
The t-test for the mean difference between 2 related populations assumes that the
respective:
A) sample sizes are equal.

B) sample variances are equal.
C) populations are approximately normal or sample sizes are large.
D) All of the above
Which of the following statements is true?
A) Random samples are easier to select than nonstatistical samples.
B) Nonstatistical samples can provide useful data.
C) Stratified random sampling involves breaking the population down into geographic
subgroups.
D) Systematic sampling is an example of nonstatistical sampling.
The following regression output was generated based on a sample of utility customers.
The dependent variable was the dollar amount of the monthly bill and the independent
variable was the size of the house in square feet.
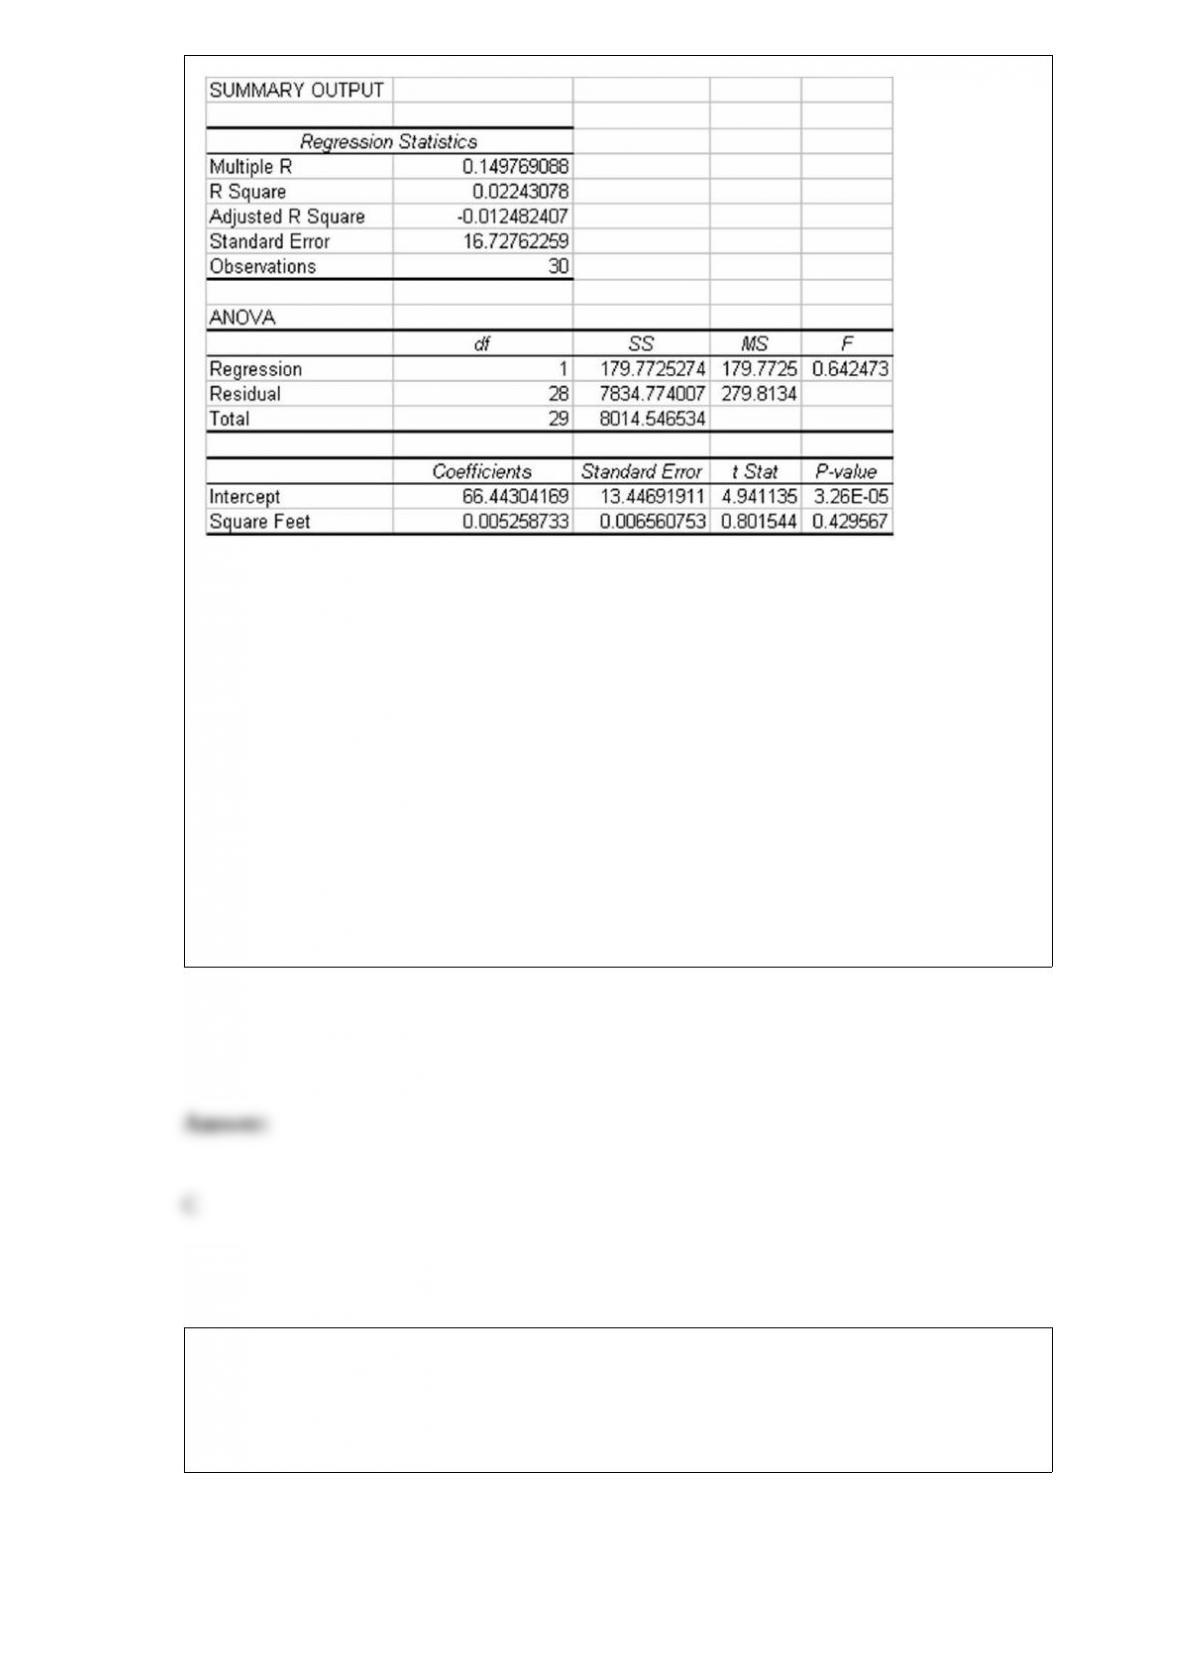
Based on this regression output, which of the following statements is not true?
A) The number of square feet in the house explains only about 2 percent of the variation
in the monthly power bill.
B) At an alpha level equal to 0.05, there is no basis for rejecting the hypothesis that the
slope coefficient is equal to zero.
C) The average increase in the monthly power bill is about 66.4 for each additional
square foot of space in the house.
D) The correlation of the monthly power bill with the square footage of the house is
0.149
The management of the Seaside Golf Club regularly monitors the golfers on its course
for speed of play. Suppose a random sample of golfers was taken in 2011 and another
random sample of golfers was selected in 2006. The results of the two samples are as
follows:

Based on the sample results, can the management of the Seaside Golf Club conclude
that average speed of play was different in 2012 than in 2011? Conduct the appropriate
hypothesis test at the 0.10 level of significance. Assume that the management of the
club is willing to accept the assumption that the populations of playing times for each
year are approximately normally distributed with equal variances.
A) Because the calculated value of t = -2.03 is less than the lower tail critical value of t
= – 1.6686, reject the null hypothesis. Based on these sample data, at the α = 0.10 level
of significance there is sufficient evidence to conclude that the average speed of play is
different in 2012 than in 2011.
B) Because the calculated value of t = 1.84 is greater than the upper tail critical value of
t = 1.6686, reject the null hypothesis. Based on these sample data, at the α = 0.10 level
of significance there is sufficient evidence to conclude that the average speed of play is
different in 2012 than in 2011.
C) Because the calculated value of t = 0.89 is neither less than the lower tail critical
value of t = – 1.6686, nor greater than the upper tail critical value of t = 1.6686, do not
reject the null hypothesis. Based on these sample data, at the α = 0.10 level of
significance there is not sufficient evidence to conclude that the average speed of play is
different in 2012 than in 2011.
D) Because the calculated value of t = 1.17 is neither less than the lower tail critical
value of t = – 1.6686, nor greater than the upper tail critical value of t = 1.6686, do not
reject the null hypothesis. Based on these sample data, at the α = 0.10 level of
significance there is not sufficient evidence to conclude that the average speed of play is
different in 2012 than in 2011.
When a pair of dice are rolled, the outcome for each die can be said to be:

A) mutually exclusive.
B) mutually inclusive.
C) dependent.
D) independent.
Harrison Water Sports has three retail outlets: Seattle, Portland, and Phoenix. The
Seattle store does 50 percent of the total sales in a year, while the Portland store does 35
percent of the total sales. Further analysis indicates that of the sales in Seattle, 20
percent are in boat accessories. The percentage of boat accessories at the Portland store
is 30 and the percentage at the Phoenix store is 25. Overall, the probability that a sale
by Harrison Water Sports will be for a boat accessory is:
A) 0.105
B) 0.2425
C) 0.75
D) None of the above
If a binomial distribution applies with a sample size of n = 20, find the probability of 5
successes if the probability of a success is 0.40.

A) 0.1246
B) 0.1286
C) 0.0746
D) 0.0866
For the following hypothesis test:
With n= 64 and p= 0.42, state the decision rule in terms of the critical value of the test
statistic
A) The decision rule is: reject the null hypothesis if the calculated value of the test
statistic, z, is greater than 2.013 or less than -2.013. Otherwise, do not reject.
B) The decision rule is: reject the null hypothesis if the calculated value of the test
statistic, z, is less than 2.013 or greater than -2.013. Otherwise, do not reject.
C) The decision rule is: reject the null hypothesis if the calculated value of the test
statistic, z, is greater than 2.575 or less than -2.575. Otherwise, do not reject.
D) The decision rule is: reject the null hypothesis if the calculated value of the test
statistic, z, is less than 2.575 or greater than -2.575. Otherwise, do not reject.
In conducting a one-way analysis of variance where the test statistic is less than the
critical value, which of the following is correct?
A) Conclude that the means are not all the same and that that the Tukey-Kramer
procedure should be conducted.
B) Conclude that the means are not all the same and that that the Tukey-Kramer
procedure is not needed.
C) Conclude that all means are the same and that the Tukey-Kramer procedure should
be conducted.
D) Conclude that all means are the same and there is no need to conduct the
Tukey-Kramer procedure.
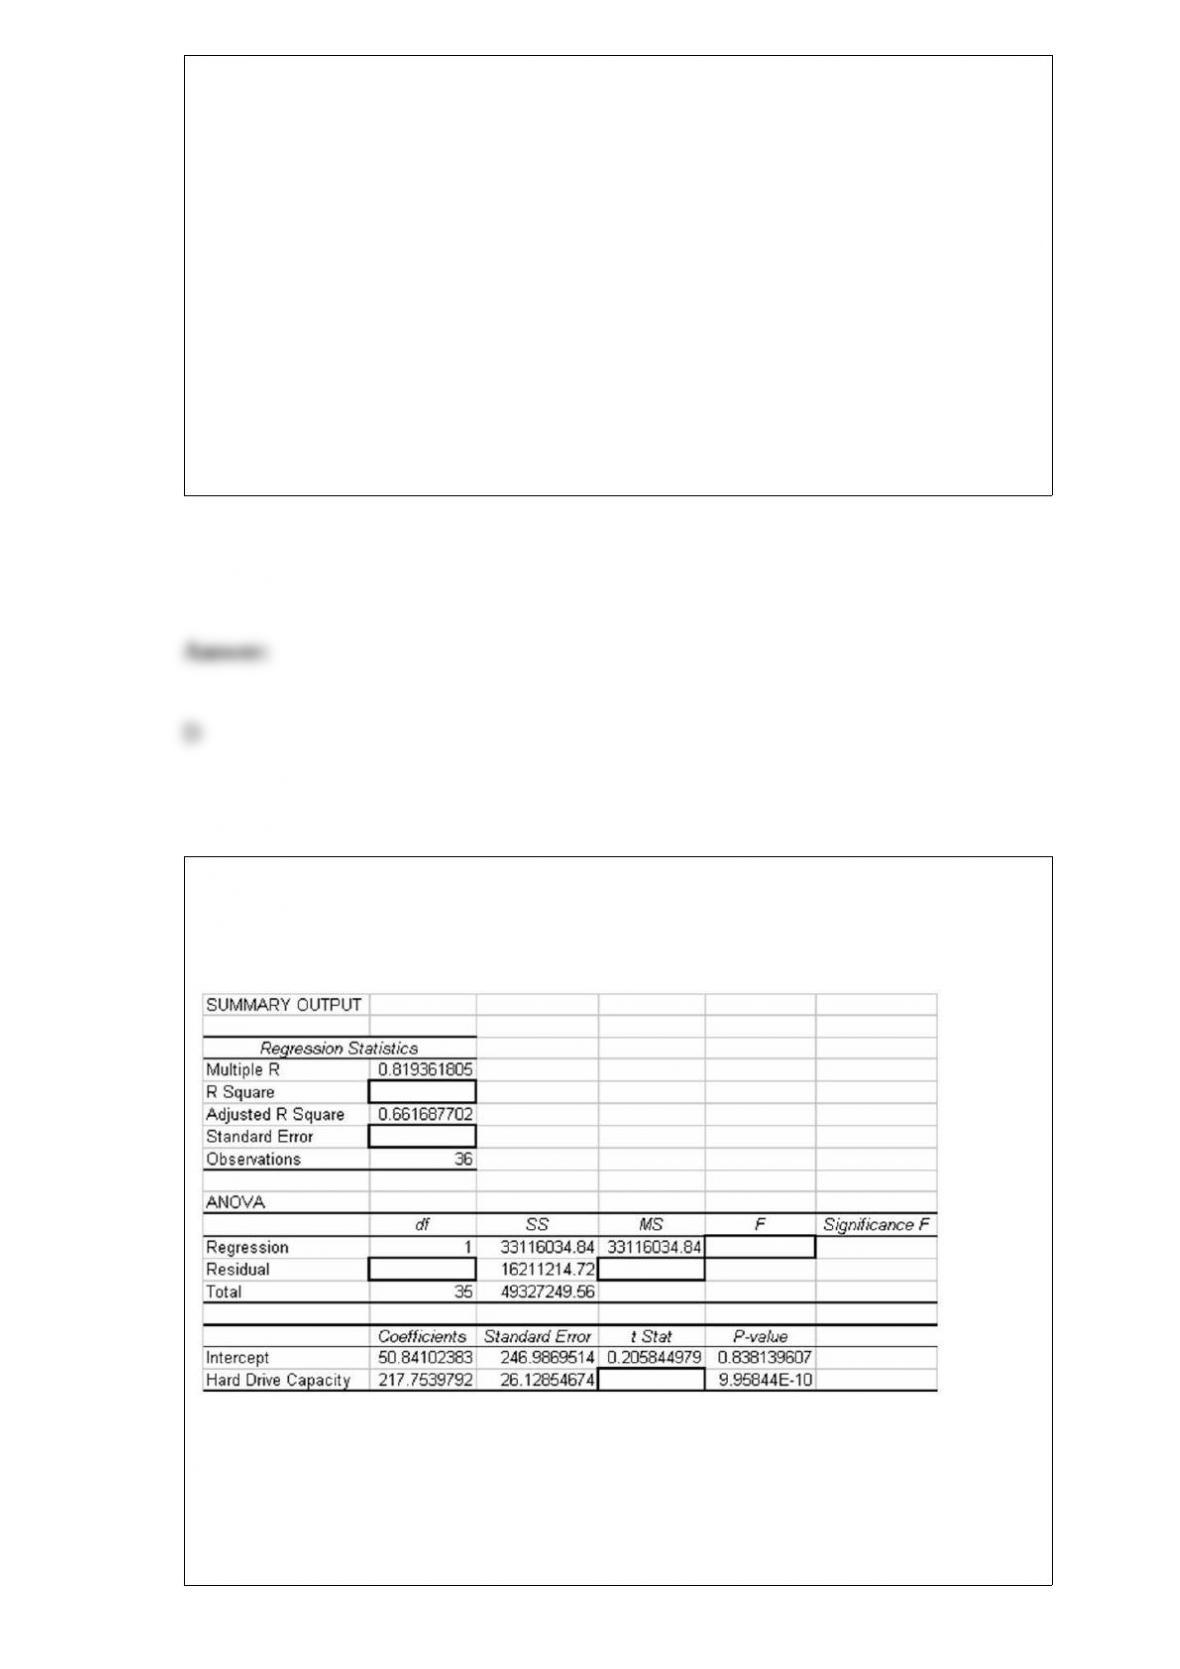
Consider the following partially completed computer printout for a regression analysis
where the dependent variable is the price of a personal computer and the independent
variable is the size of the hard drive.
Based on the information provided, what is the F statistic?
A) About 8 .33
B) Just over 2.35

C) About 4.76
D) About 69.5
Employees at a large computer company earn sick leave in one-minute increments
depending on how many hours per month they work. They can then use the sick leave
time any time throughout the year. Any unused time goes into a sick bank account that
they or other employees can use in the case of emergencies. The human resources
department has determined that the amount of unused sick time for individual
employees is uniformly distributed between 0 and 480 minutes. The company has
decided to give a cash payment to any employee that returns over 400 minutes of sick
leave at the end of the year. What percentage of employees could expect a cash
payment?
A) 16.67 percent
B) 0.1667 percent
C) Just over 43 percent
D) 80 percent
The Boxer Company has been in business since 1998. The following sales data are
recorded by quarter for the years 2010-2012.

The managers at the company wish to determine the seasonal indexes for each quarter
during the year. The first step in the process is to remove the seasonal and random
components. To do this, they will begin by computing a four period moving average.
What is the four-period moving average based on Winter 99 – Fall 99?
A) 280
B) 70
C) 60
D) 55
The transportation manager for the State of New Jersey has determined that the time
between arrivals at a toll booth on the state’s turnpike is exponentially distributed with λ
= 4 cars per minute. Based on this information, the standard deviation for the time
between arrivals is:
A) 25 seconds.
B) 3.87 seconds.

C) 15 seconds.
D) 2 minutes.
A major textbook publisher has a contract with a printing company. Part of the contract
stipulates that no more than 5 percent of the pages should have any type of printing
error. As a quality control measure, the publisher periodically selects a random sample
of n = 100 pages. Then, depending on the proportion of pages with errors, they either
say nothing to the printer or they complain that the quality has slipped. Suppose the
publisher wants no more than a .10 chance of mistakenly blaming the printer for poor
quality, what should the cut-off proportion be?
A) About 0.0279
B) Approximately 0.0779
C) About 0.0221
D) About 0.10
The results of a census of 2,500 employees of a mid-sized company with 401(k)
retirement accounts are as follows:

Suppose researchers are going to sample employees from the company for further
study.
Compute the probability that a randomly selected employee will be a female with an
account balance between $50,000 and $99,999.
A) 0.1580
B) 0.1040
C) 0.6160
D) 0.4040