An ordered pair is a set of x and y values that pertain to a specific observation.
The goal of the minimax regret criterion is to minimize the decision maker’s regret of
making a wrong choice.
Percentile ranks are very useful when comparing values from two different data sets.
A wider the margin of error will result in a more precise confidence interval.

A weighted moving average assigns the average value of a set of data points to the
center time period.
It is recommended that personal demographic questions be placed at the beginning of
the questionnaire because respondents find these questions easy to answer.
Because hypothesis testing relies on a sample, we expose ourselves to the risk that our
conclusions about the population will be wrong because of a sampling error.
The power of a hypothesis test is the probability of correctly rejecting the null
hypothesis.
The experiment-wide error rate is the probability of committing a Type II error for at
least one pair of population means being compared.
Some data sets may not have a mode.
The test statistic for hypothesis tests comparing two population proportions follows the
Student’s t-distribution.

If the null hypothesis is true for one-way ANOVA, we would expect MSB to be larger
than MSW, causing the critical F-score to exceed 1.0.
A relationship is linear if the scatter plot of the independent and dependent variables has
a straight-line pattern.
Sampling without replacement means that once a member of a population is chosen for
a sample, it cannot be chosen again for the same sample.
Pareto charts display the categories in an increasing order with the least problematic
categories shown first.
Decision making under certainty is used to choose an alternative when we have
probability information for each state of nature.
If a pilot sample is not available, it is recommended to set the sample proportion equal
to 0.50 to calculate the required sample size for a confidence interval for the proportion.
A limitation of descriptive statistics is that, by summarizing large quantities of data, you
lose information.
Nominal data has all the properties of interval data with the added benefit of having a
true zero point.
When using exponential smoothing, there is no forecasting error for Period 1 because
we arbitrarily assign to start the forecasting technique.
The area under the curve of the normal probability distribution is always equal to 1.0.
One of the assumptions for the multiple regression model is that the residuals have a
constant variance.
Typically, it is very easy for a hypothesis test to accurately reject the null hypothesis
when there is little difference between the hypothesized and actual population mean.
The margin of error for a sample is dependent on the sample mean.
The sample means for a population that follows the normal distribution will also be
normally distributed, regardless of the size of the samples.
The slope of the regression line in trend projection measures the rate at which the
forecasted variable changes from one time period to the next.
Given that a 95% confidence interval is (6.5, 12.5), we can state that there is a 95%
probability that the true population mean is between 6.5 and 12.5.
One disadvantage of using the median is that it can be heavily influenced by outliers.
Equal-size classes refer to classes for a frequency distribution using grouped
quantitative data that do not overlap.
Continuous random variables can take on values between whole integers that contain
decimal points.
One method to reduce nonsampling errors is to increase the size of the sample.
The addition rule for probabilities is used to calculate the probability of the union of
events.
When using general stepwise regression, all possible combinations of independent
variables are considered when choosing a final model.
Contingency tables help us identify relationships between two or more variables.
The hypothesis test for autocorrelation in a time series is a two-tail test because we only
test for the presence of positive autocorrelation.
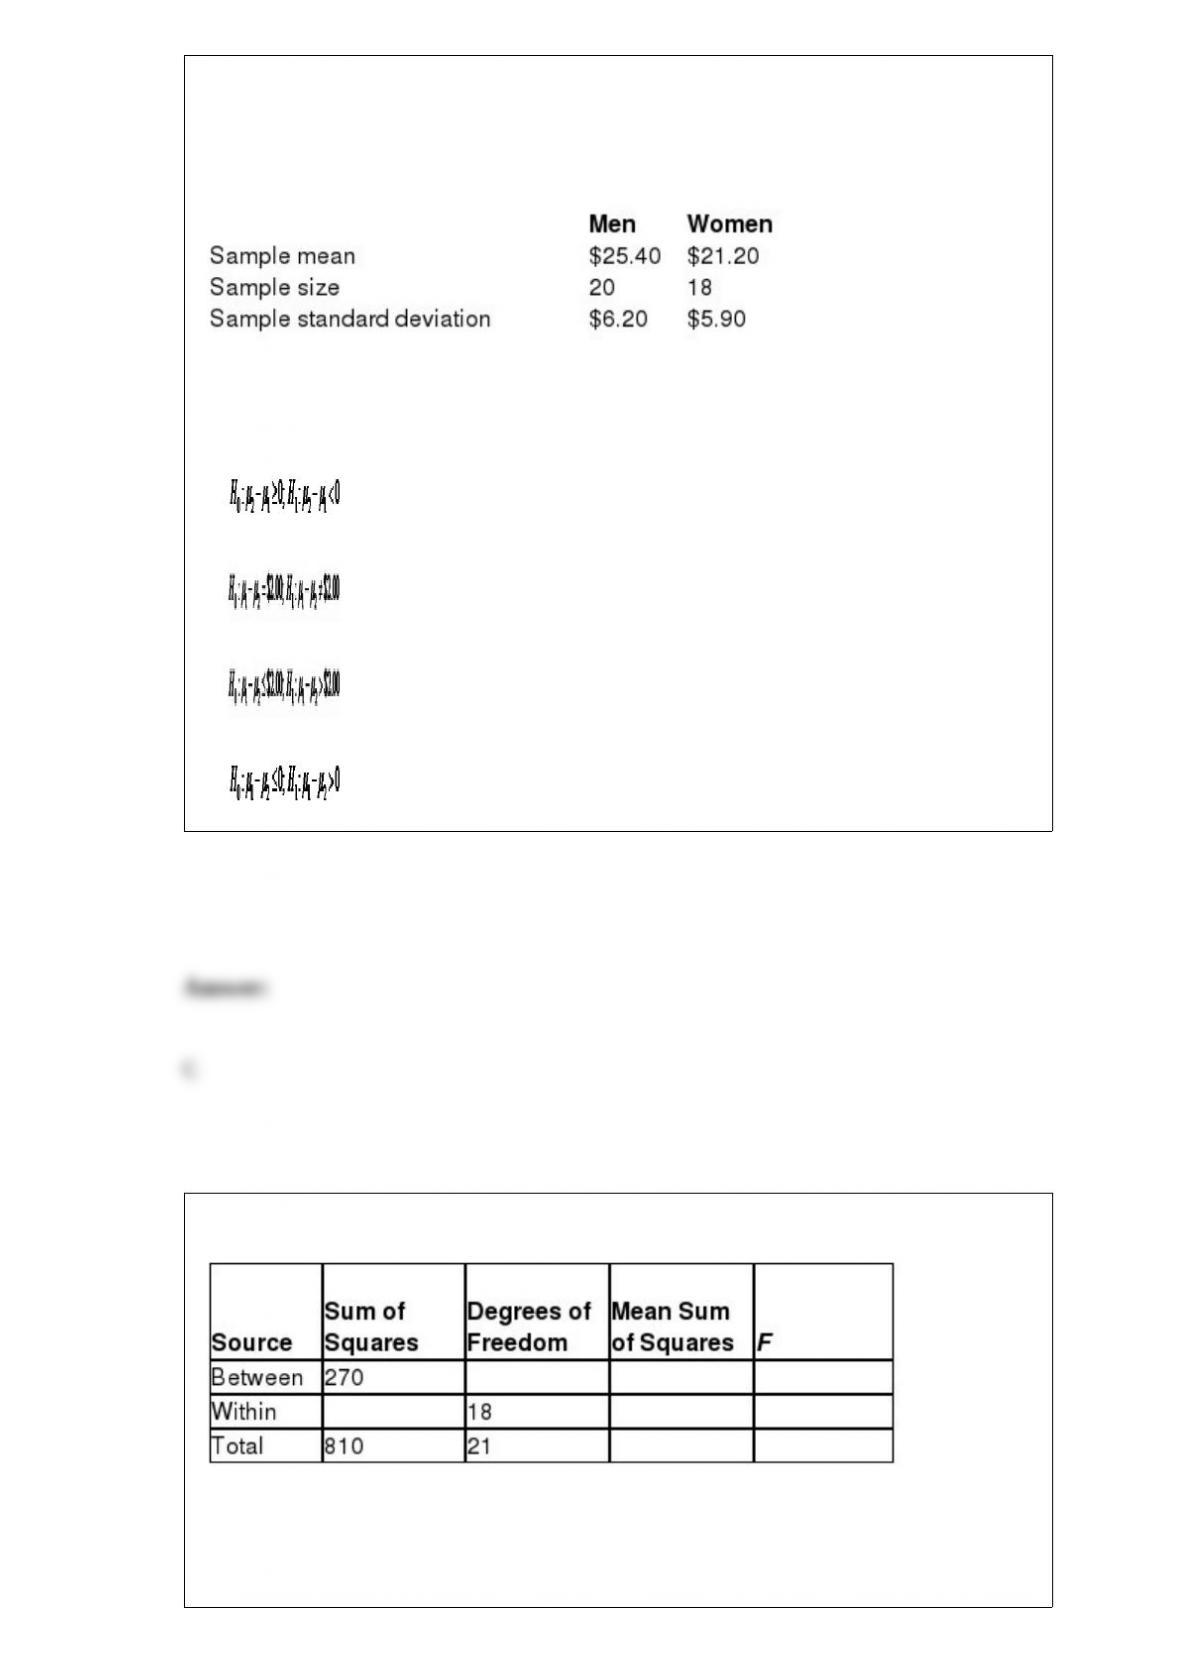
The Canadian government would like to test the hypothesis that the average hourly
wage for men is more than $2.00 higher than the average hourly wage for women. The
following data summarizes the sample statistics for hourly wages for men and women.
Assume that the population variances are equal.
If Population 1 is defined as men and Population 2 is defined as women, the correct
hypothesis statement for this hypothesis test would be ____________________.
A)
B)
C)
D)
Consider the partially completed one-way ANOVA summary table.
The mean square within for this ANOVA procedure is ____.
A) 30.

B) 46.
C) 72.
D) 90.
The ________ is the best measure of central tendency for categorical data.
A) mean
B) median
C) weighted mean
D) mode
A decision tree is a tree-shaped diagram that shows the alternatives, states of nature,
probabilities, and payoffs for decision making under___________.
A) risk
B) certainty
C) uncertainty
D) probabilities
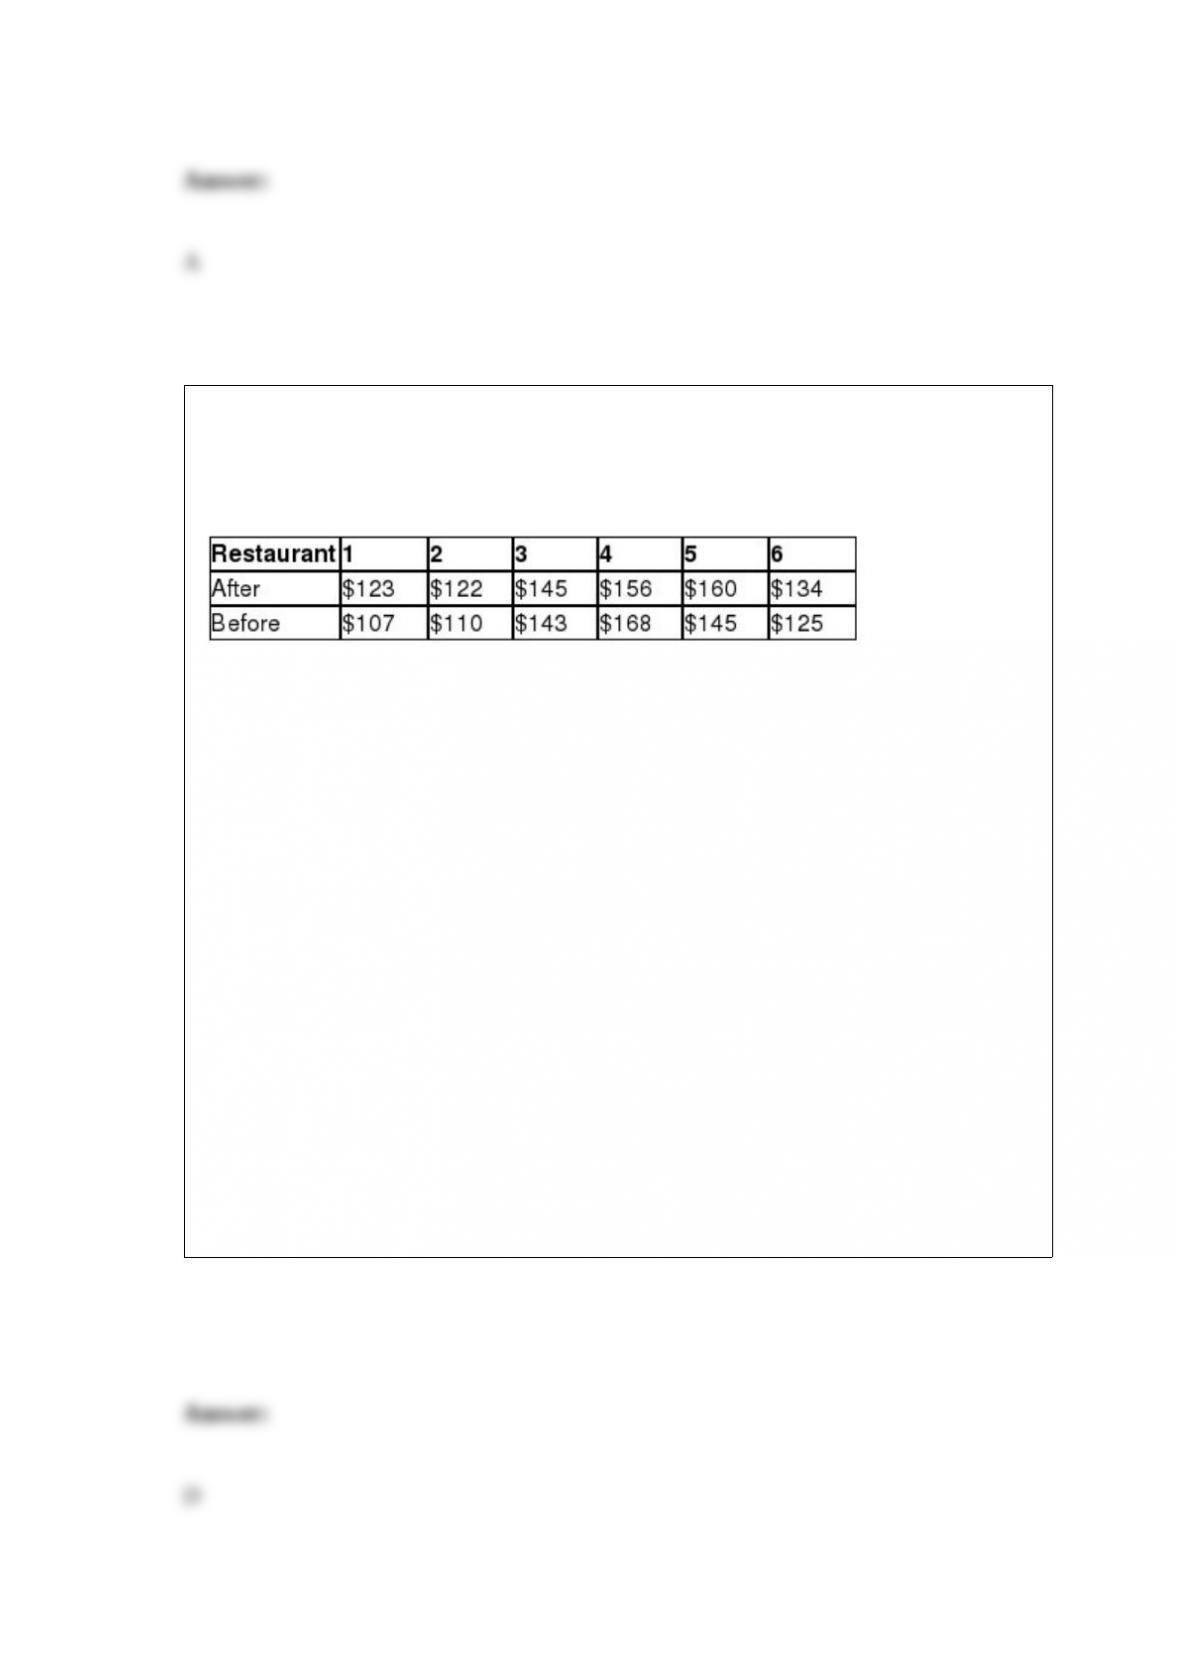
Suppose Burger King has run a major advertising campaign in the hopes of increasing
monthly sales. To investigate the effectiveness of this campaign, Burger King randomly
selected seven restaurants and recorded the monthly sales before and after the
advertising. The following data represents these sales figures in thousands of dollars.
If Population 1 is defined as sales after the advertising campaign and Population 2 is
defined as sales before the advertising campaign, and using α = 0.05, which one of the
following statements is true?
A) Because the p-value is less than α, we can conclude that the average restaurant sales
per month after the advertising campaign are higher than the average restaurant sales
per month before the advertising campaign.
B) Because the p-value is greater than α, we can conclude that the average restaurant
sales per month after the advertising campaign are lower than the average restaurant
sales per month before the advertising campaign.
C) Because the p-value is less than α, we cannot conclude that the average restaurant
sales per month after the advertising campaign are higher than the average restaurant
sales per month before the advertising campaign.
D) Because the p-value is greater than α, we cannot conclude that the average restaurant
sales per month after the advertising campaign are higher than the average restaurant
sales per month before the advertising campaign.
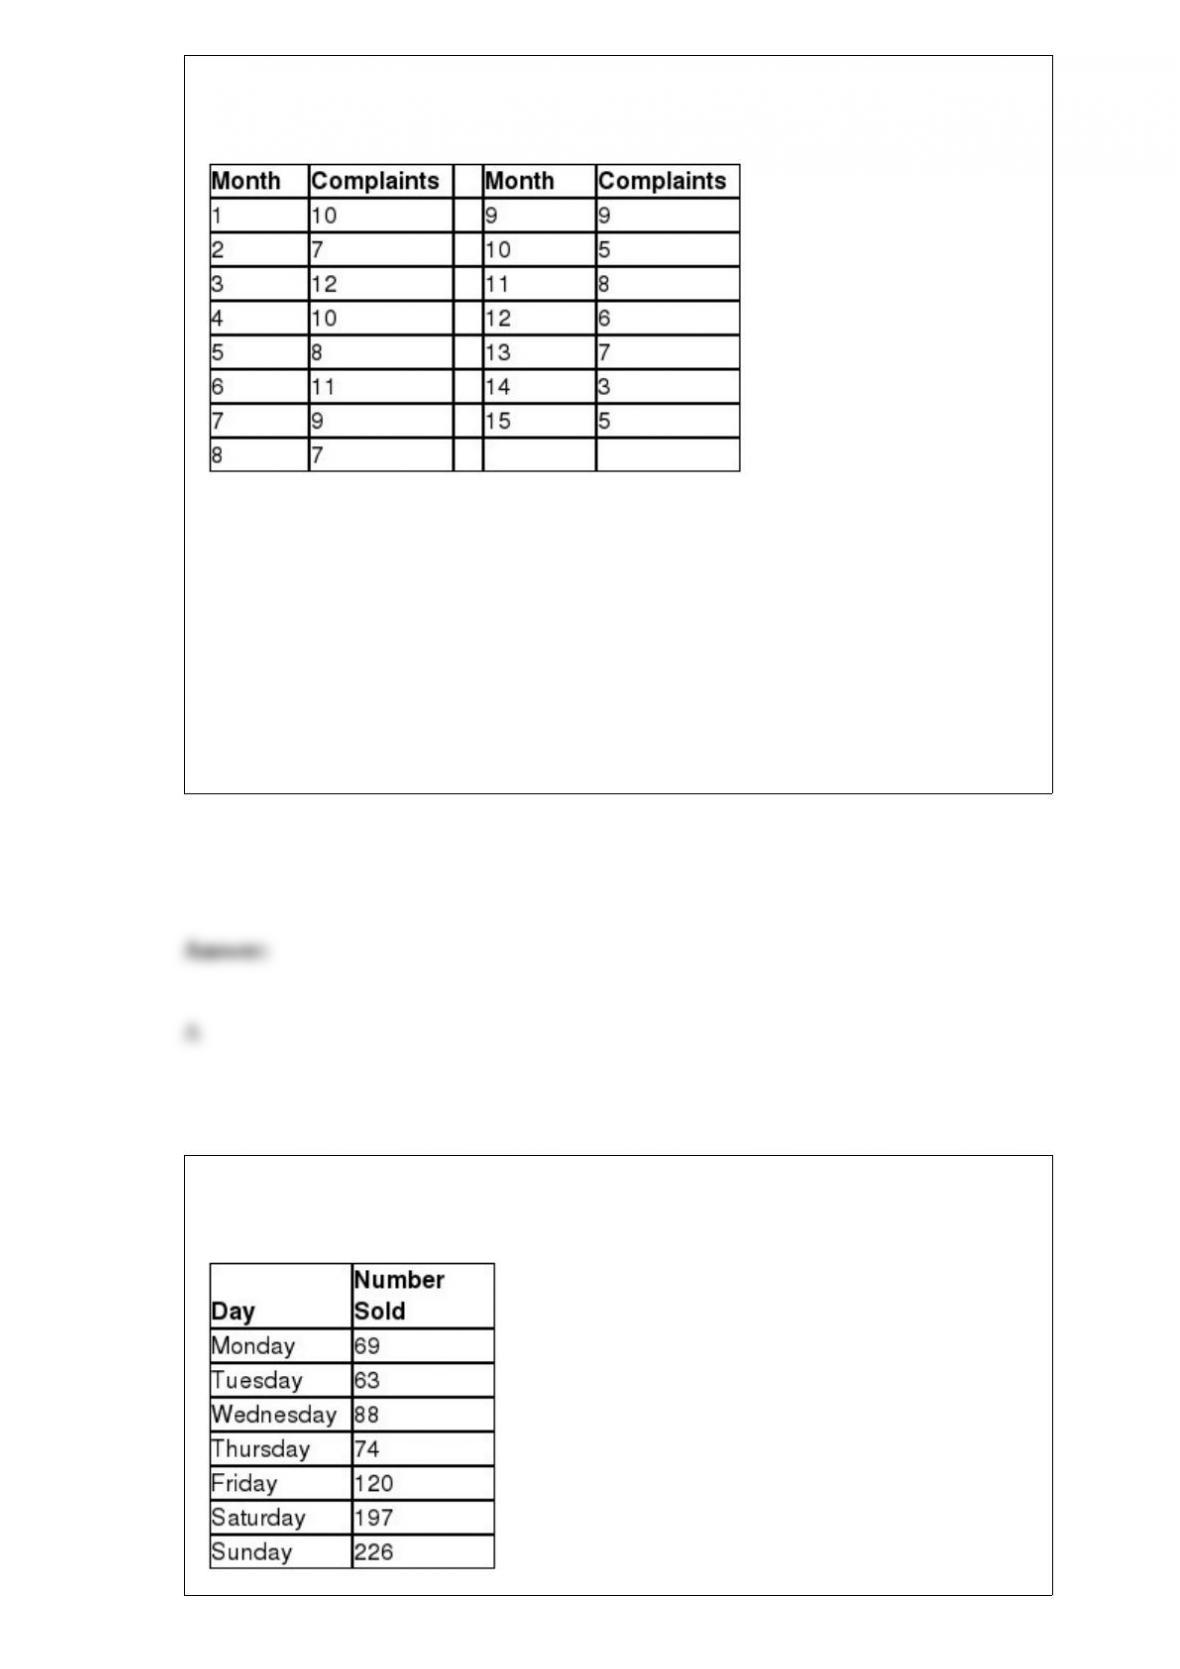
The following data represent the number of complaints per month that customer service
received at a large retailer over the last 15 months.
The trend projection slope for this data is ________.
A) -0.400
B) -0.105
C) 1.651
D) 3.250
The following table shows the number of bagels sold at the Avalon Coffee and Bagel
over the past seven days.

Which of the following data types best describe these values?
A) cross-sectional
B) nominal
C) time series
D) ordinal
In general, the number of dummy variables used is always equal to the number of
categories in the qualitative data.
The U.S. Census Bureau would like to estimate the average square footage of a new
single-family home with a 95% confidence interval and a margin of error within plus or
minus 100 square feet. Assuming the standard deviation for the square footage of new
single-family homes is 850 square feet, the required sample size is ________.
A) 203
B) 232
C) 278
D) 295

When calculating a confidence interval for the mean using a sample size of 30 or more
with a known population standard deviation, the ________ is used.
A) normal distribution
B) Poisson distribution
C) binomial distribution
D) Student’s t-distribution
A ________ in two-way ANOVA is a specific combination of one level from Factor A
and one level from Factor B.
A) cell
B) block
C) level
D) replication
A statistics class at Wilmington College has 25 students of which 15 are math majors
and 10 are business majors. The professor randomly selects five students to work
together on a group project. What is the probability that less than three of the students
in this group are business majors?
A) 0.2561
B) 0.3447
C) 0.6988
D) 0.7582
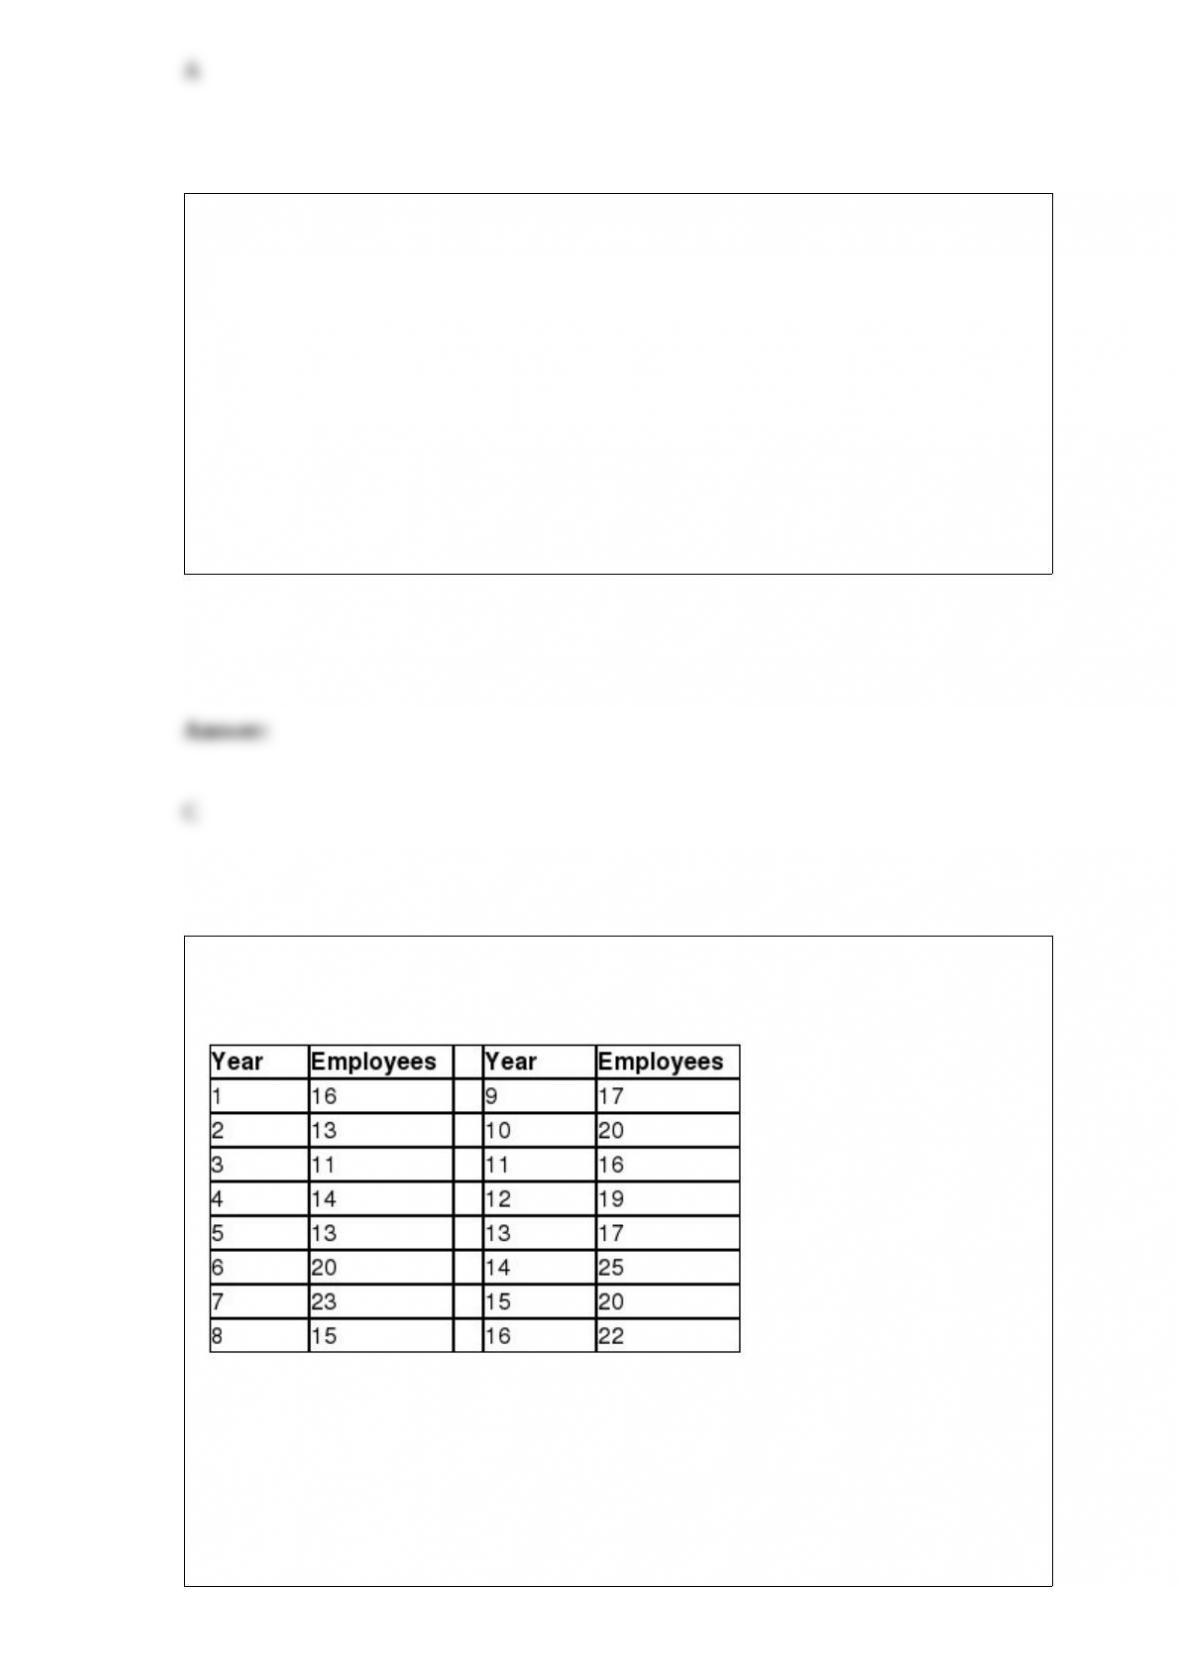
The following table shows the number of employees at Diamond Corporation over the
past 16 years.
The mean absolute deviation using trend projection is ________.
A) 0.77
B) 1.40
C) 2.38
D) 3.62
A respondent of a survey is asked whether their most recent dining experience was
excellent, good, fair, or poor. The person indicates that the experience was “good”. This
is an example of __________ data.
A) nominal
B) ordinal
C) interval
D) ratio
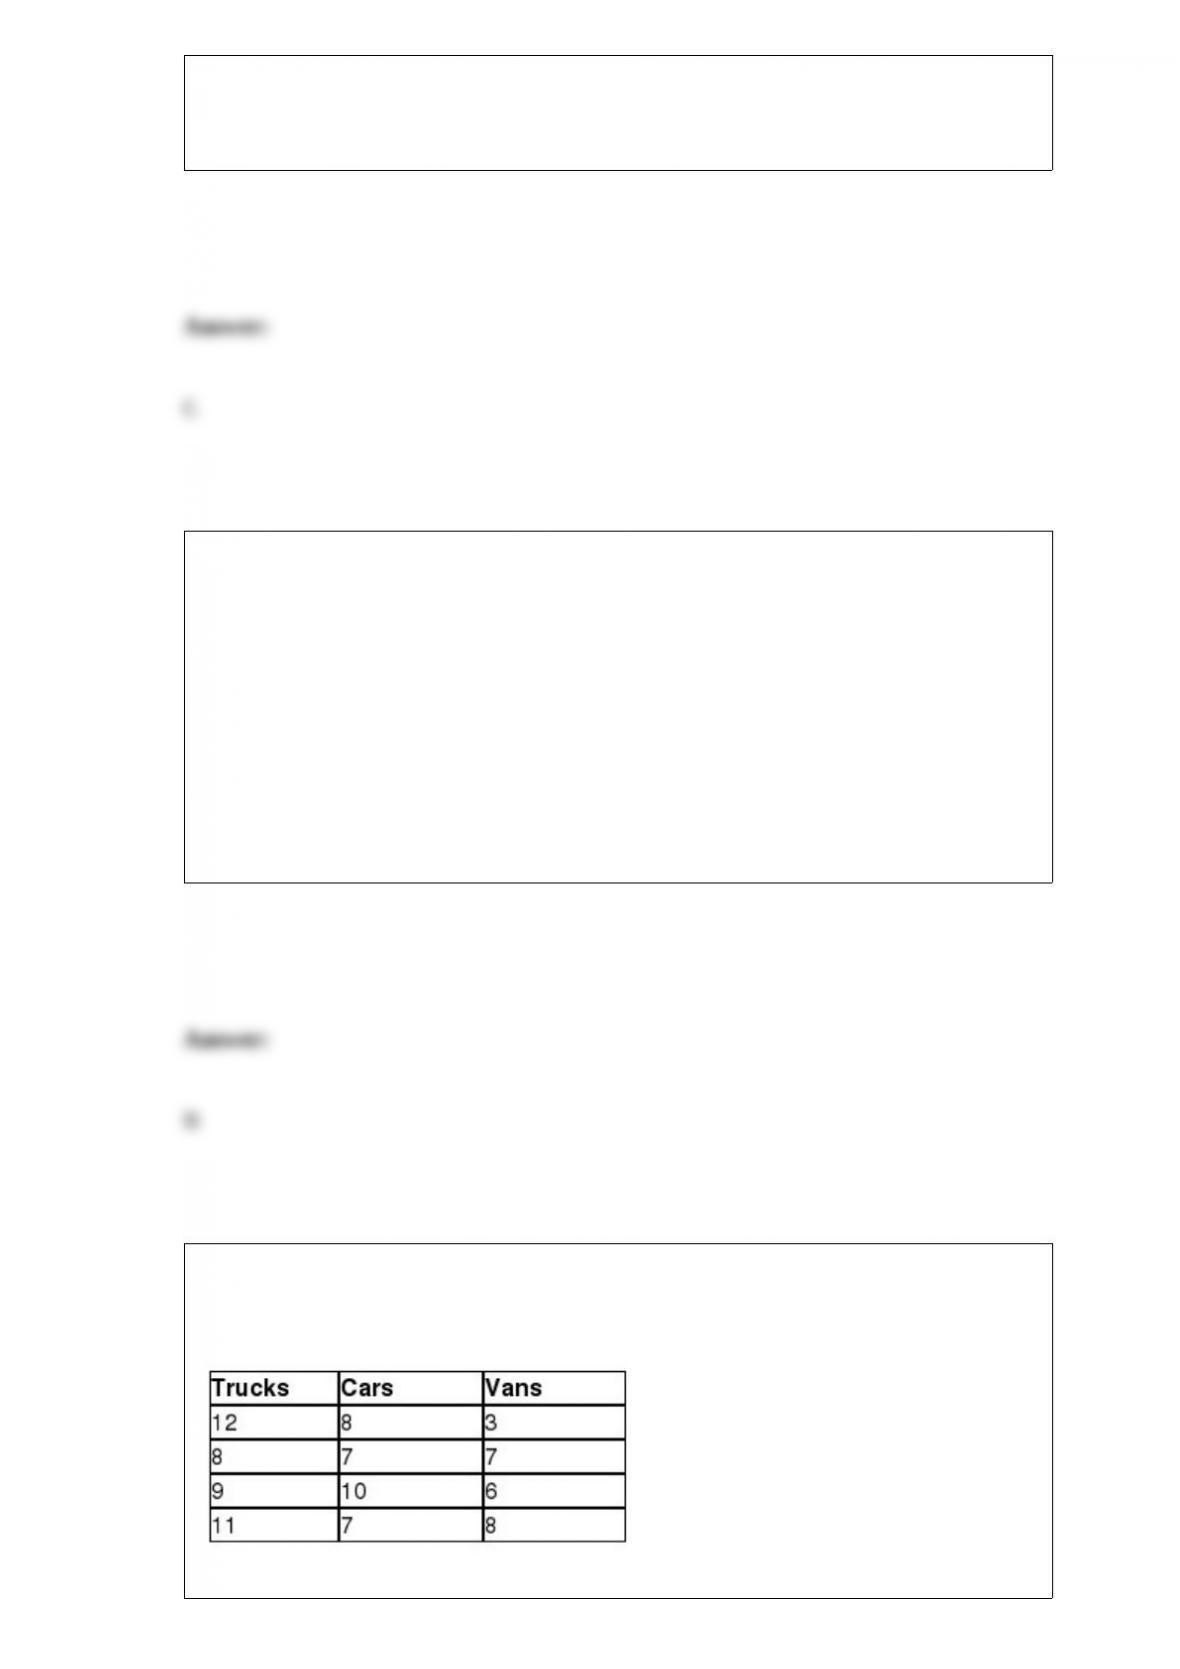
AutoTrader.com would like to test if a difference exists in the median age of three
different types of vehicles currently on the road–trucks, cars, and vans. The following
data represent the age of a random sample of trucks, cars, and vans.
Using α = 0.10, which one of the following statements is true?
A) Because the test statistic is greater than the critical value, we can conclude that a
difference exists between the median age of trucks, cars, and vans on the road today.
B) Because the test statistic is greater than the critical value, we cannot conclude that
that a difference exists between the median age of trucks, cars, and vans on the road
today.
C) Because the test statistic is less than the critical value, we can conclude that that a
difference exists between the median age of trucks, cars, and vans on the road today.
D) Because the test statistic is less than the critical value, we cannot conclude that that a
difference exists between the median age of trucks, cars, and vans on the road today.
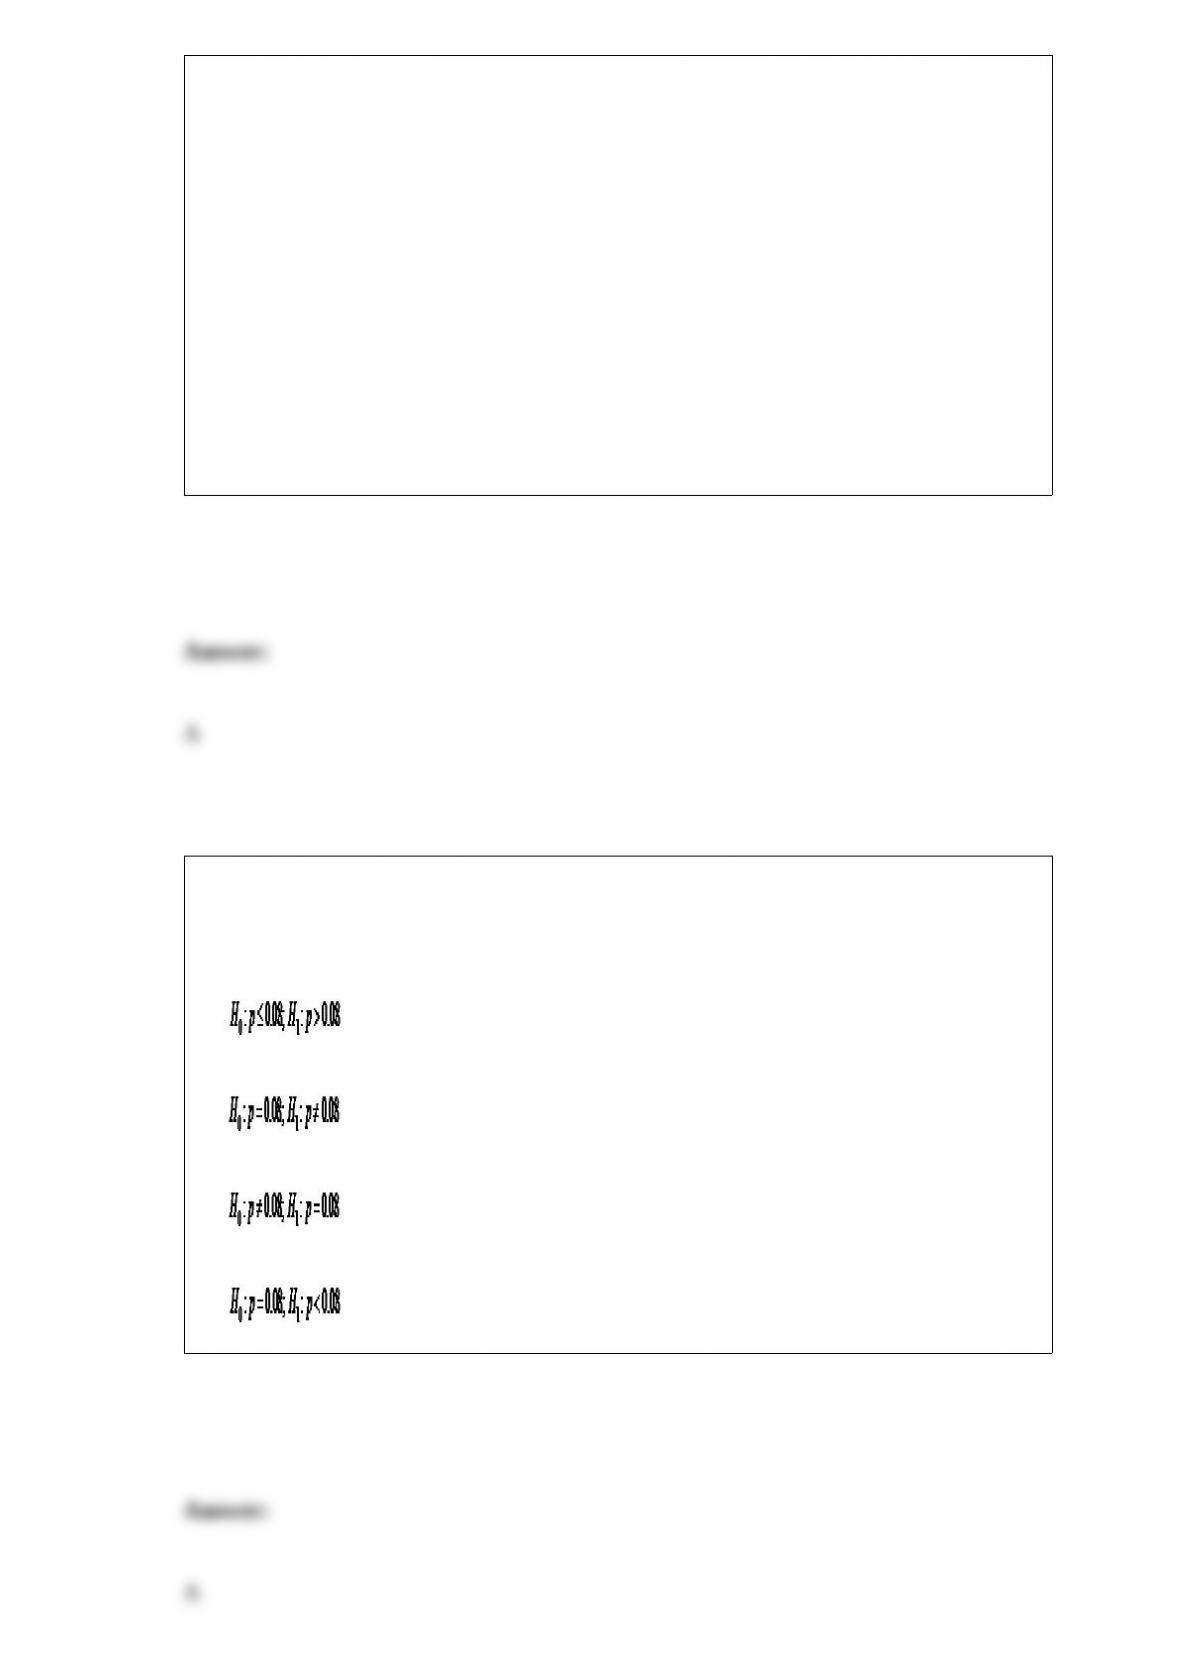
CoStar would like to test if the vacancy rate for “warehouse” stores is more than 8%.
The correct hypothesis statement to test for this vacancy rate would be
______________________.
A)
B)
C)
D)
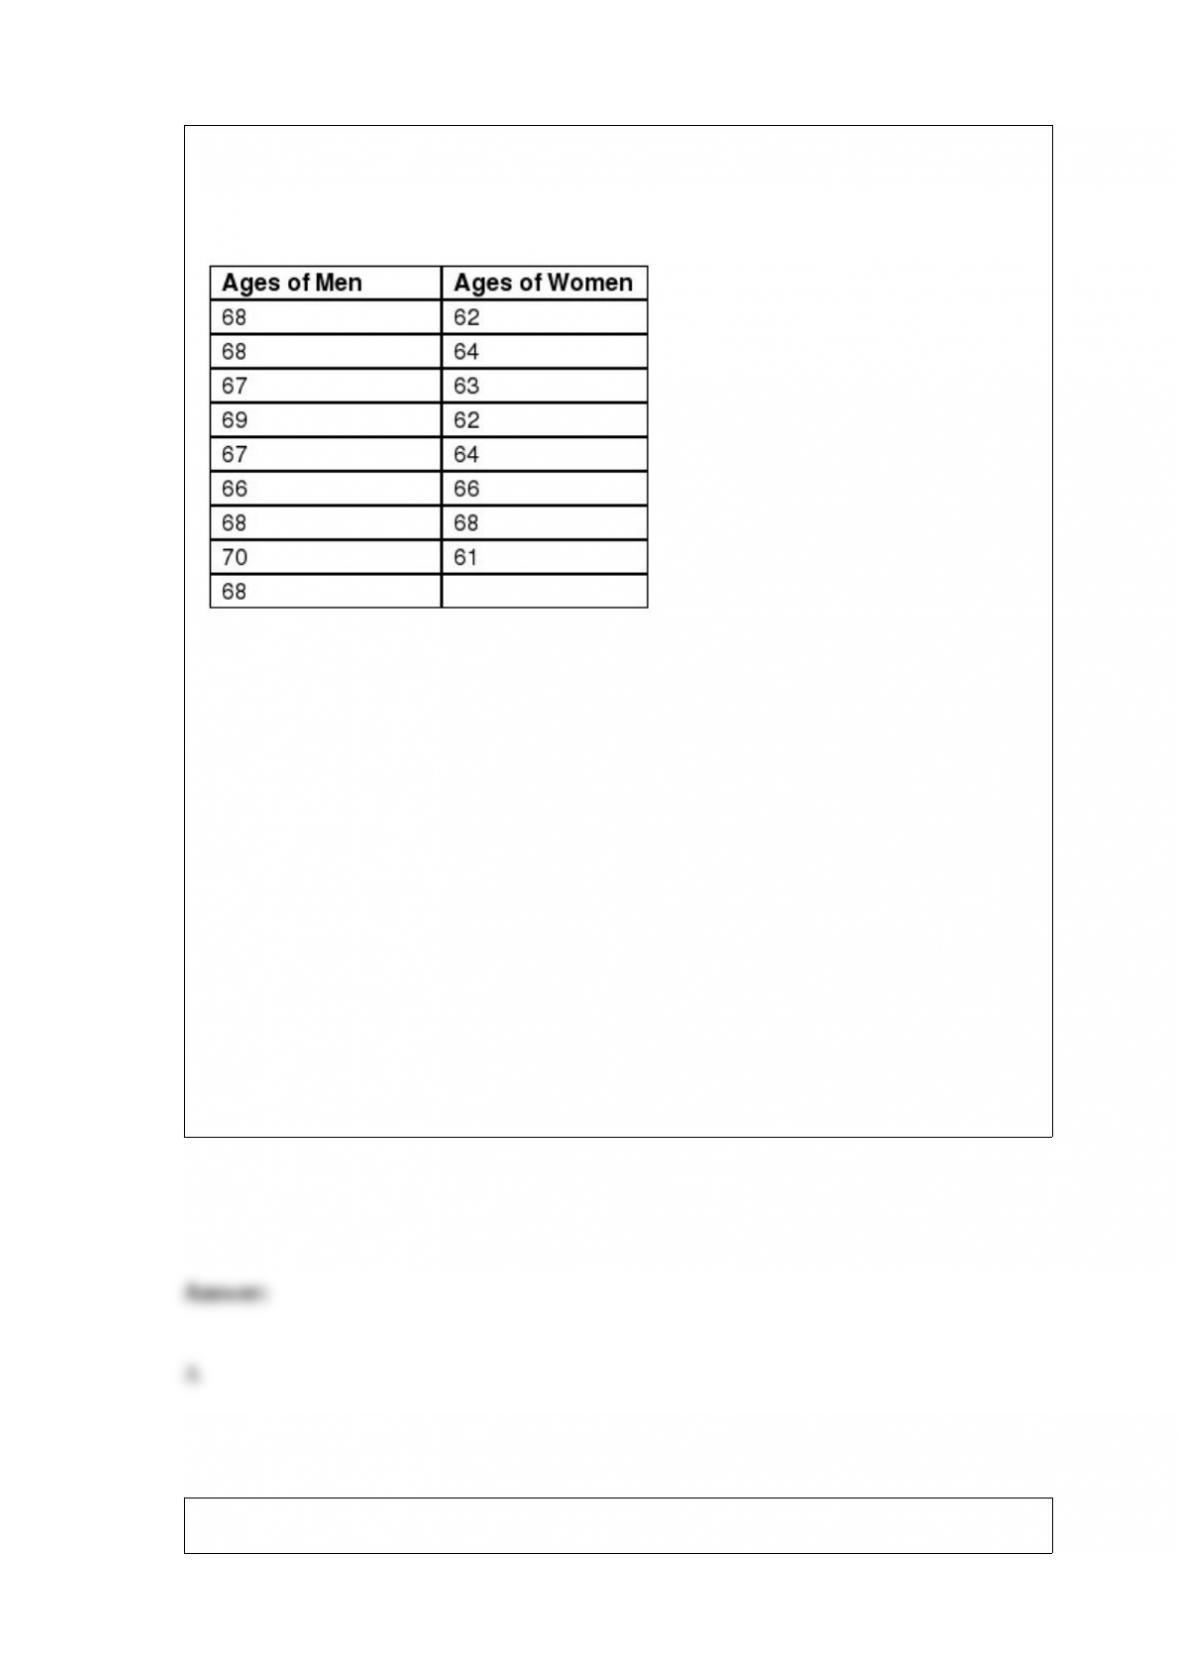
The federal government would like to test the hypothesis that the median age of men
filing for Social Security is higher than the median age of women set using α = 0.05
with the following sample data:
Which one of the following statements is true?
A) Because the test statistic is less than the lower critical value, we conclude that the
median age for men filing for social security is higher than the age of women who file.
B) Because the test statistic is less than the lower critical value, we cannot conclude that
the median age for men filing for social security is higher than the age of women who
file.
C) Because the test statistic is between the lower and the upper critical values, we
conclude that the median age for men filing for social security is higher than the age of
women who file.
D) Because the test statistic is between the lower and the upper critical values, we
cannot conclude that the median age for men filing for social security is higher than the
age of women who file.
Consider the partially completed one-way ANOVA summary table.
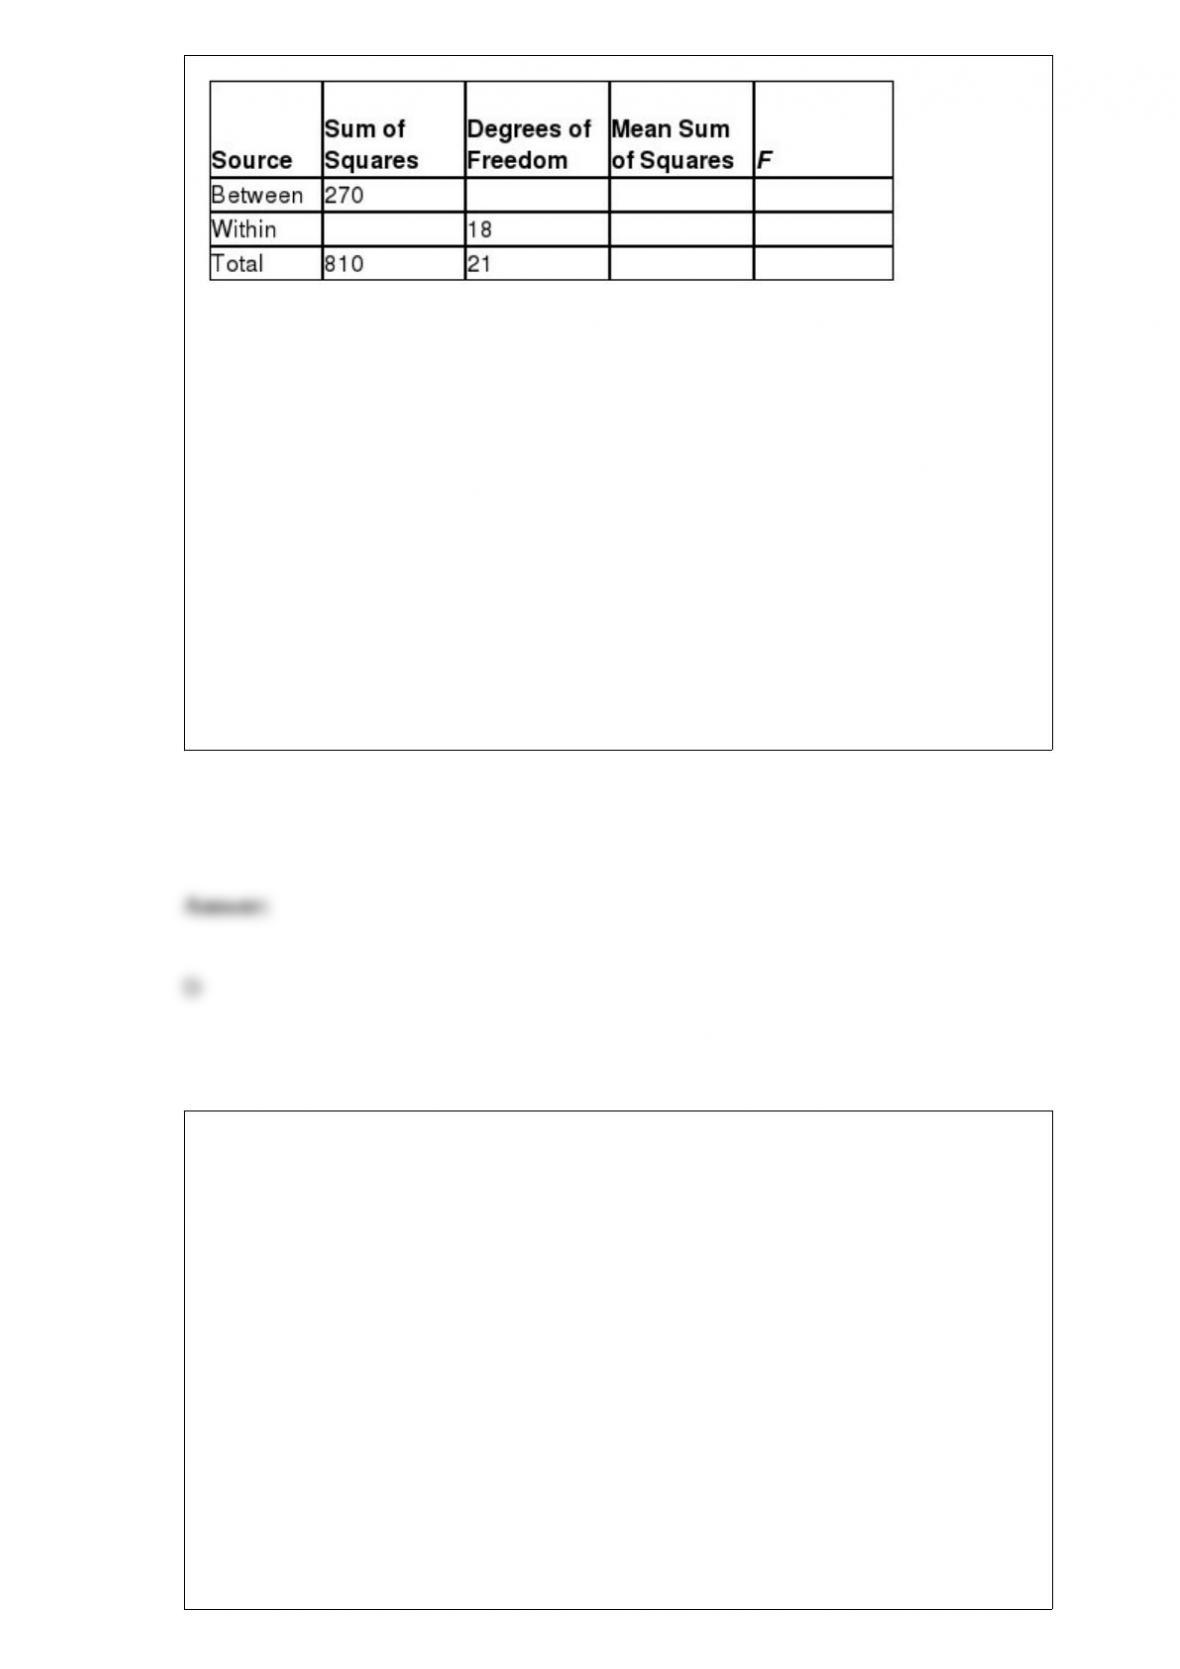
Using α = 0.025, the conclusion for this ANOVA procedure would be that because the
test statistic is _____________________.
A) more than the critical value, we can reject the null hypothesis and conclude that
there is a difference in population means
B) less than the critical value, we can reject the null hypothesis and conclude that there
is no difference in population means
C) more than the critical value, we cannot reject the null hypothesis and conclude that
there is a difference in population means
D) less than the critical value, we cannot reject the null hypothesis and cannot conclude
that there is a difference in population means
YouTube would like to test the hypothesis that the average length of an online video
watched by a user is more than 8 minutes. A random sample of 37 people watched
online videos that averaged 8.7 minutes in length. It is believed that the population
standard deviation for the length of online videos is 2.5 minutes. YouTube would like to
set α = 0.02. Which one of the following statements is true?
A) Because the p-value is greater than α, we reject the null hypothesis and conclude that
the average length of an online video is more than 8 minutes.
B) Because the p-value is greater than α, we fail to reject the null hypothesis and
conclude that the average length of an online video is not more than 8 minutes.
C) Because the p-value is less than α, we fail to reject the null hypothesis and conclude
that the average length of an online video is less than 8 minutes.
D) Because the p-value is less than α, we reject the null hypothesis and conclude that
the average length of an online video is more than 8 minutes.
Use the following information to answer the question(s) below.
Ford would like to develop a regression model that would predict the number of cars
sold per month by a dealership employee based on the employee’s number of years of
sales experience (Exp), the employee’s weekly base salary before commissions (Salary),
and the education level of the employee. There are three levels of education in the sales
forcehigh school degree, associate’s degree, and bachelor’s degree. The following
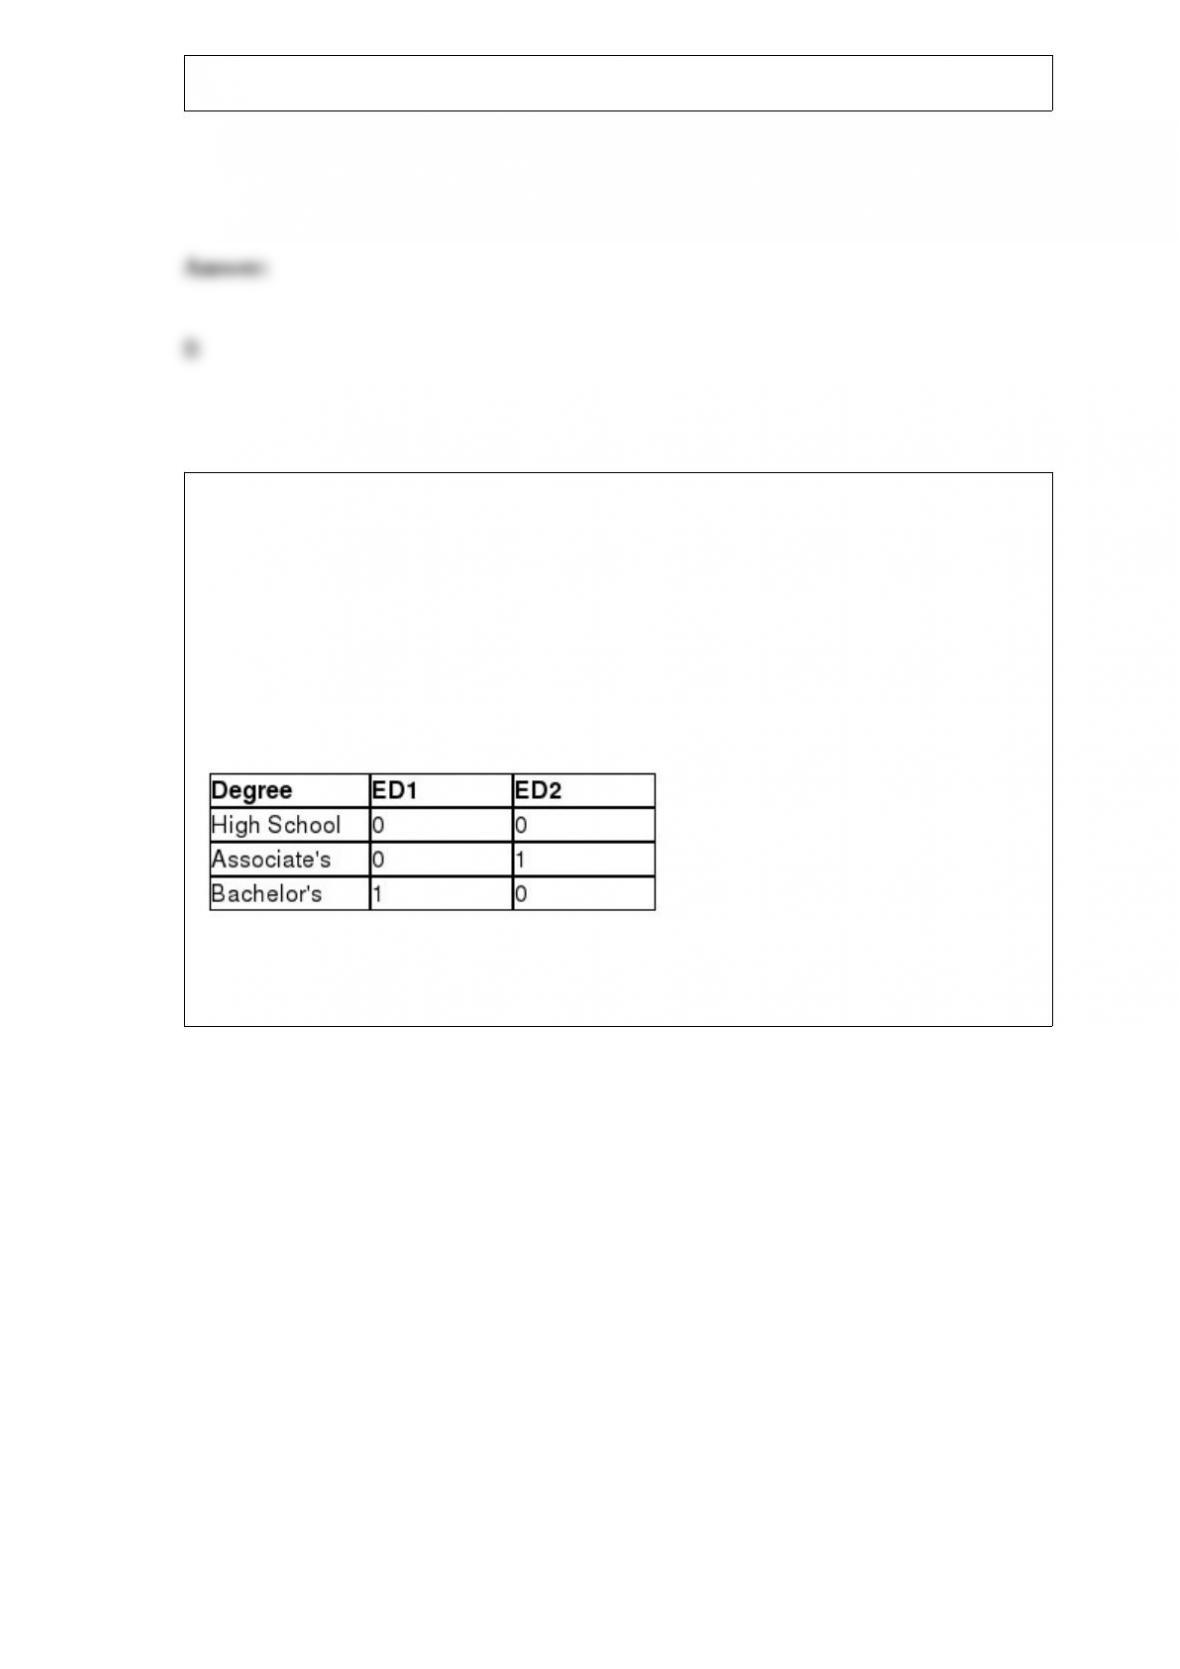
dummy variables have been defined.
The following Excel output shows the partially completed regression output from a
random sample of employees from the previous month.
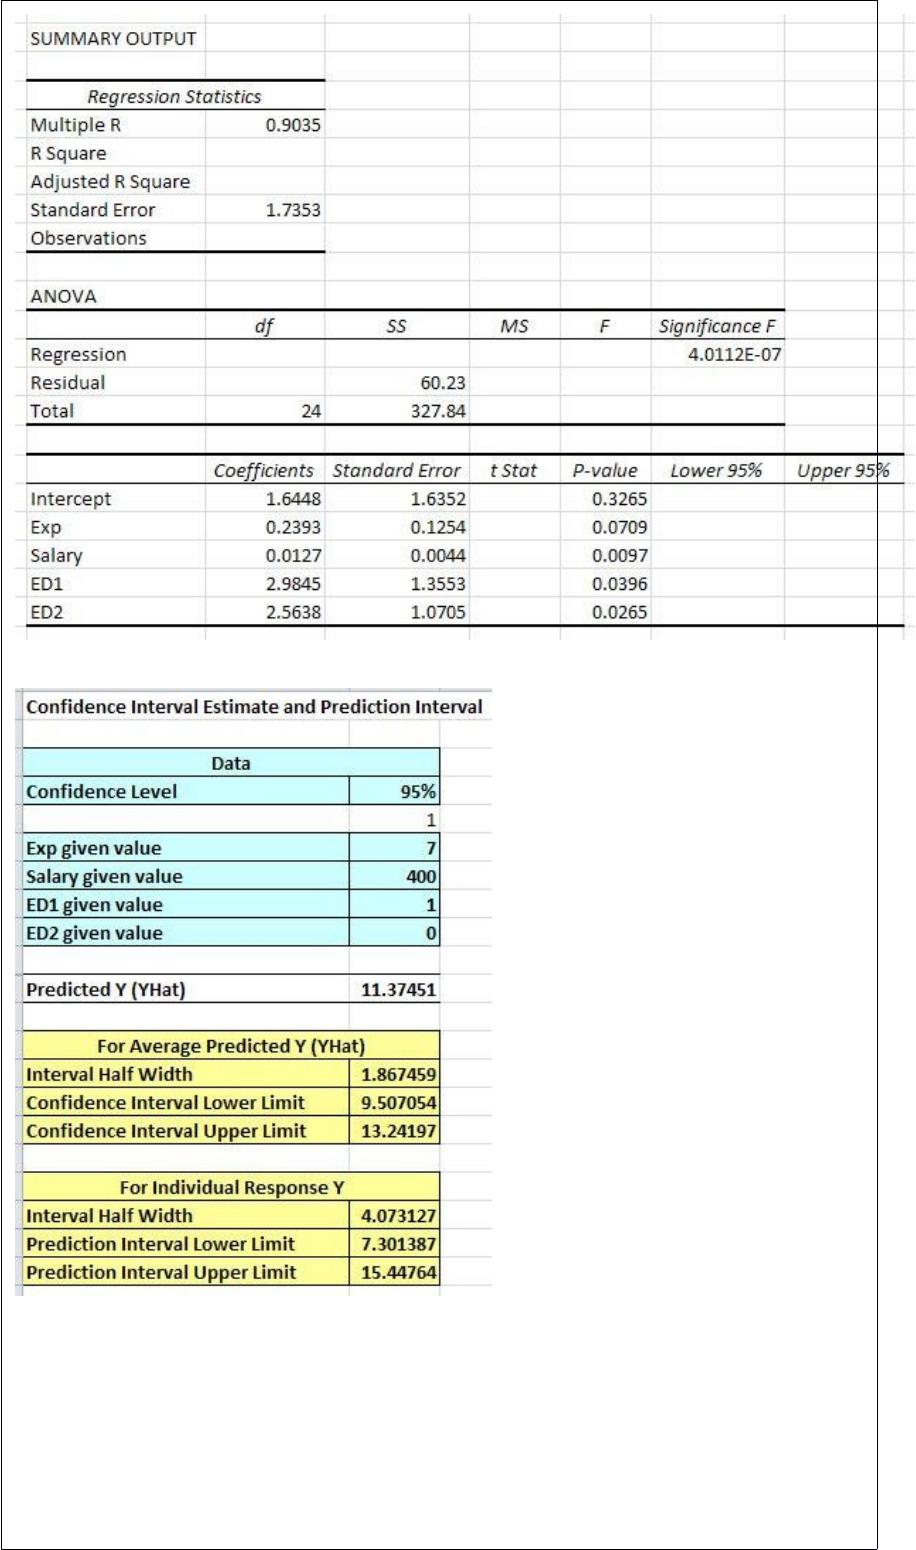
Which one of the following statements is true concerning the 95% confidence interval
for the regression coefficient for the Salary variable?
A) Because the confidence interval includes zero, we have evidence to conclude that
there is a relationship between the base salary of the employee and the number of cars
sold per month.

B) Because the confidence interval includes zero, we have evidence to conclude that
there is no relationship between the base salary of the employee and the number of cars
sold per month.
C) Because the confidence interval does not include zero, we have evidence to conclude
that there is a relationship between the base salary of the employee and the number of
cars sold per month.
D) Because the confidence interval does not include zero, we have evidence to
conclude that there is no relationship between the base salary of the employee and the
number of cars sold per month.
The daily high temperature in Philadelphia over an eight-day period is shown below.
The median for this data set is ________.
A) 69
B) 70
C) 73.5
D) 77
A respondent to a survey indicates that she drives a Ford Taurus. This is an example of
qualitative data.
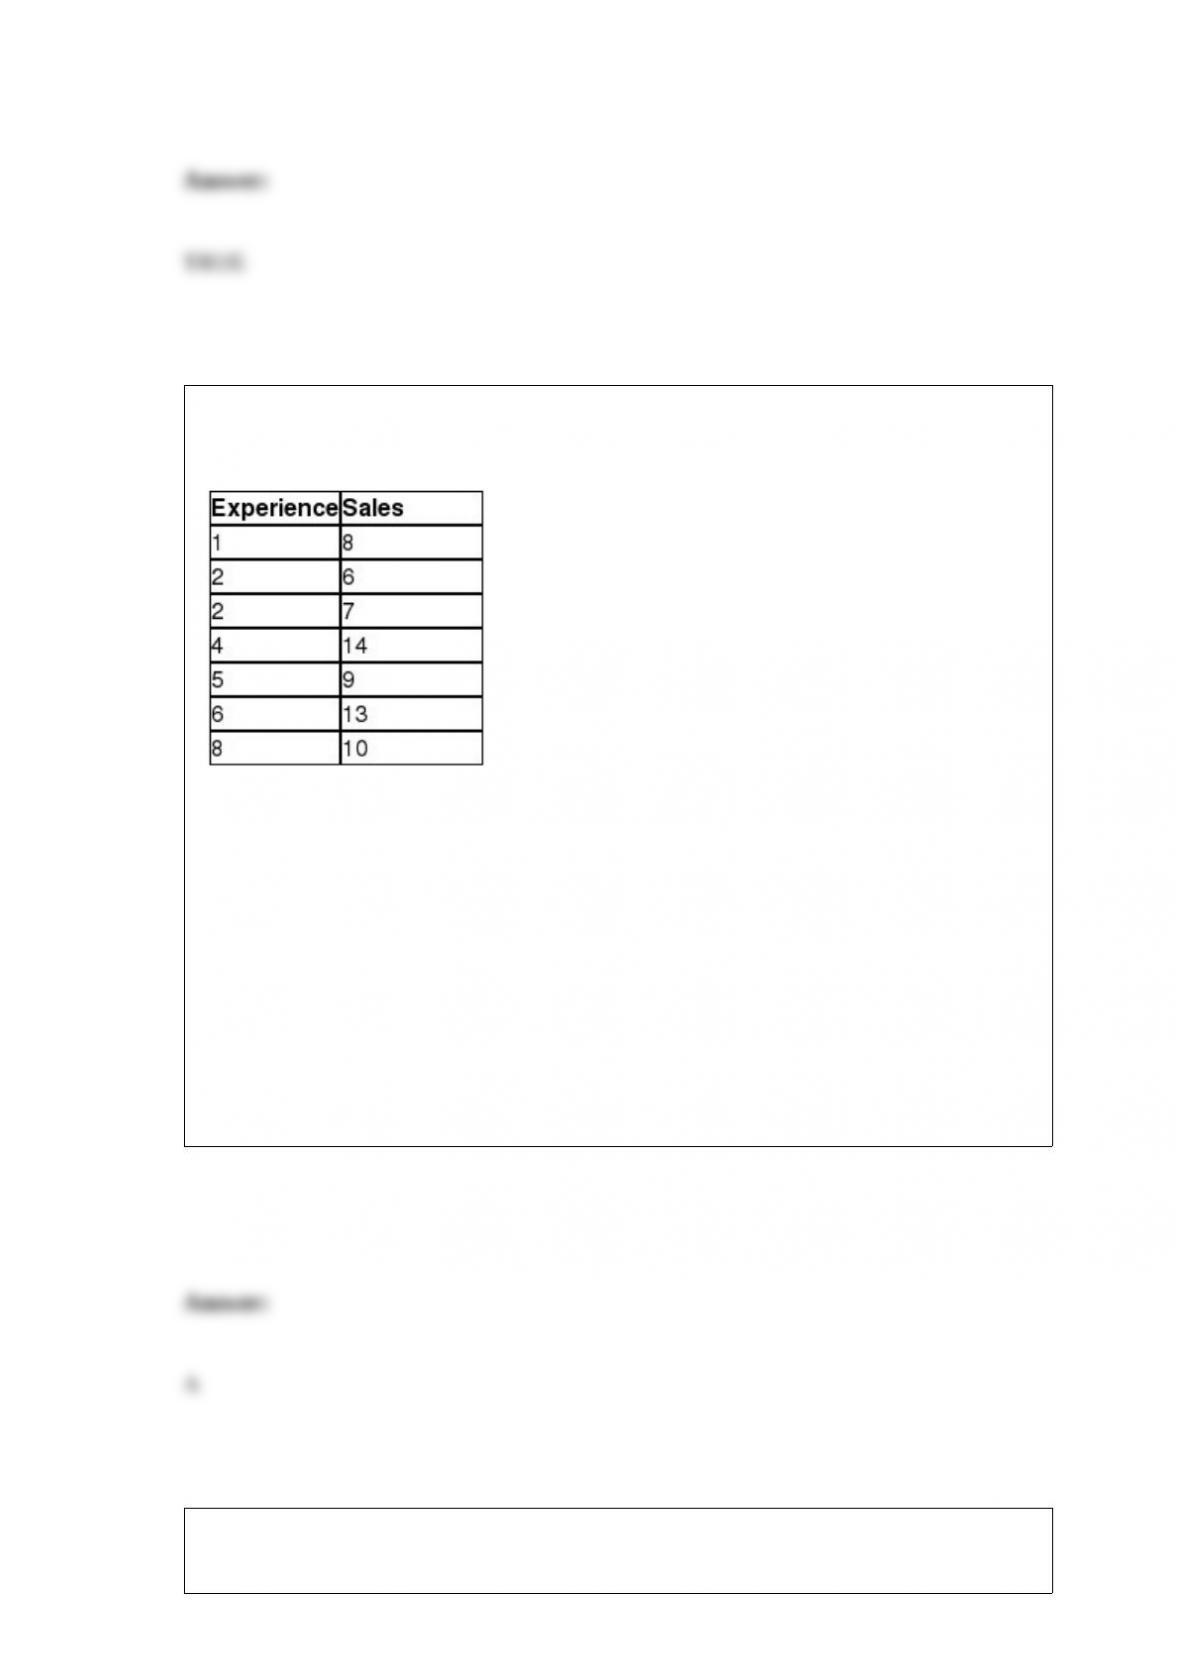
The table below shows the number of cars sold last month by seven employees at
Concord Motors and their number of years of sales experience.
Management would like to use simple regression analysis to estimate monthly car sales
using the number of years of sales experience. The test statistic for testing that the
population slope is not equal to zero is ________.
A) 1.49
B) 2.65
C) 3.22
D) 3.86
According to Eurostat, 55.2% of households in Italy have one child, the highest
percentage in the Euro zone. A random sample of 160 Italian households was selected.

The standard error of the proportion is ________.
A) 0.0165
B) 0.0393
C) 0.0410
D) 0.0454
Craftsman sells 10-digit keypads that are installed on homes to open the garage door.
The consumer chooses a 5-number code when programming the keypad. The total
number of codes that the consumer can choose from is ________.
A) 252
B) 30,240
C) 57,128
D) 100,000
Use the information below to answer the following question(s).
Some research has indicated that as people age they need less sleep. A random sample
of adults was selected and the number of hours that they slept last night was recorded.
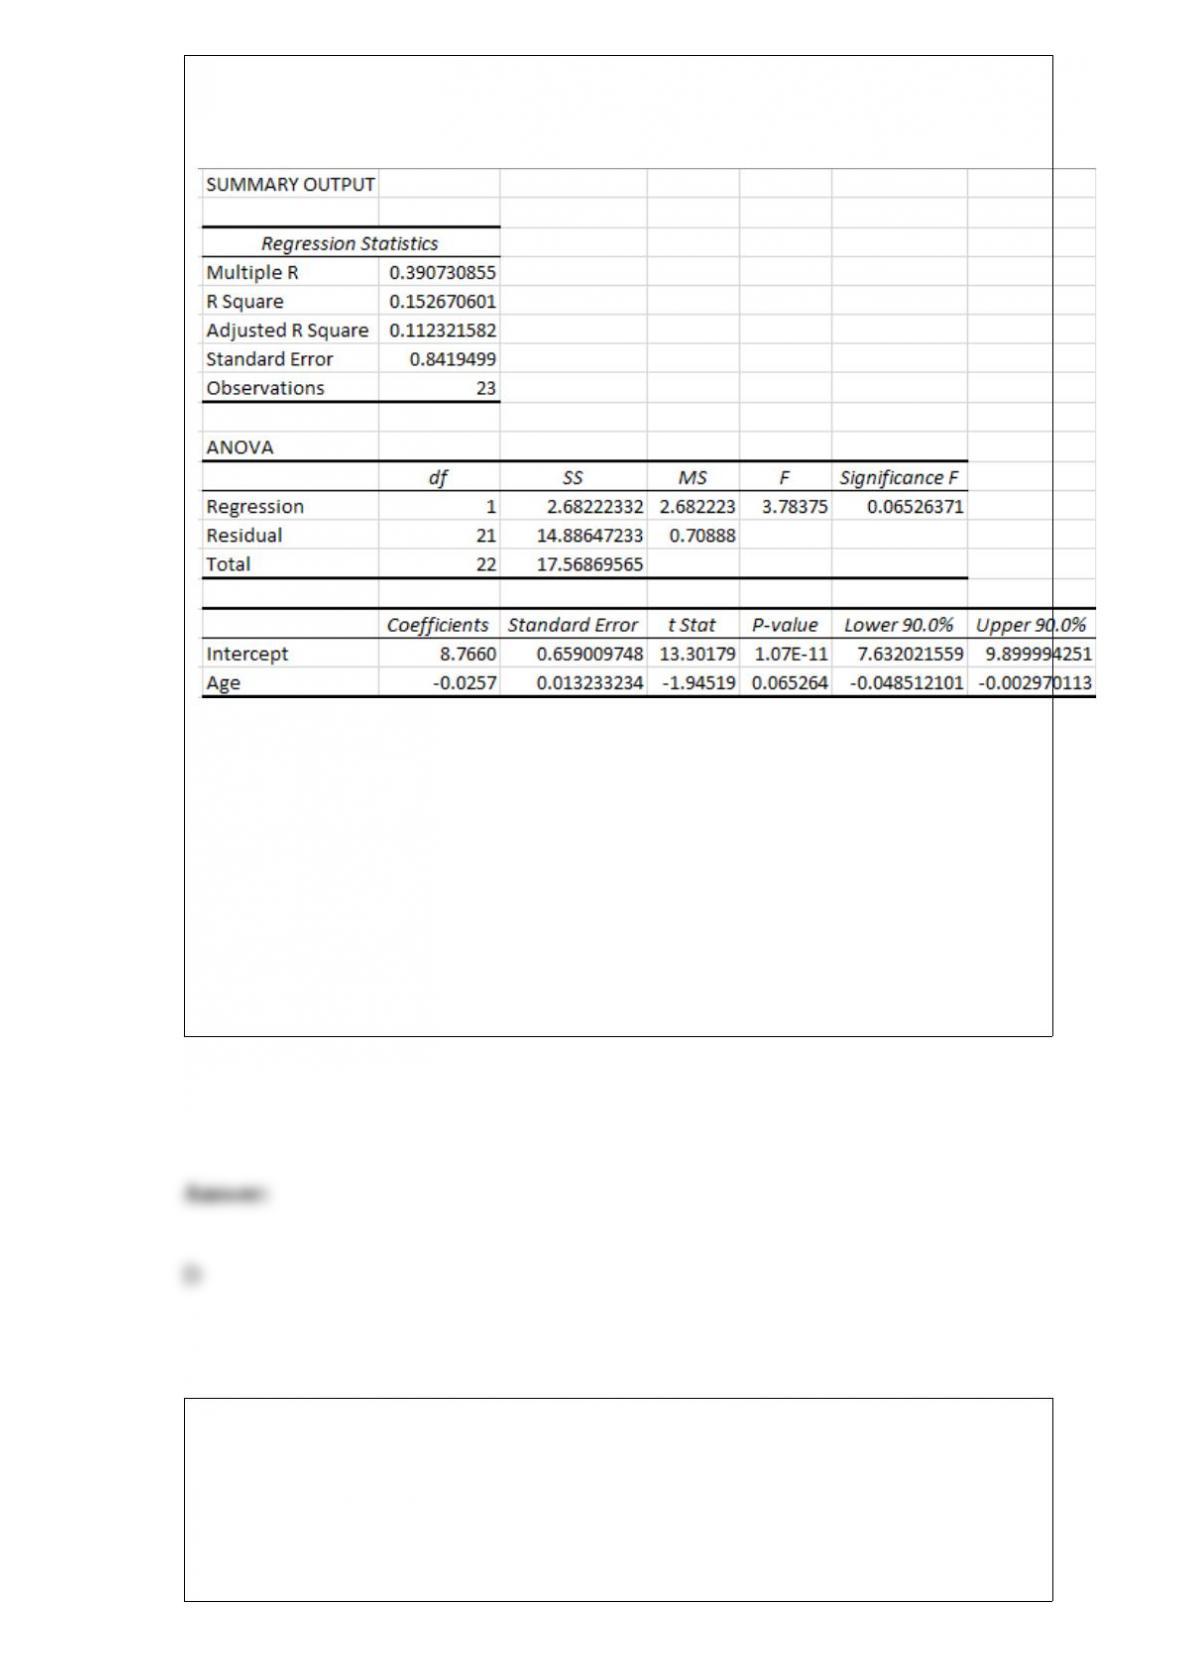
Simple regression analysis was performed on this sample and the results are shown
below.
The percentage of the variation in hours of sleep per night that is explained by the age
of the adult is ________.
A) 11.23
B) 15.27
C) 23.60
D) 39.07
The ________ can found by subtracting the lowest value from the highest value in the
data set.
A) standard deviation
B) variance
C) median
D) range
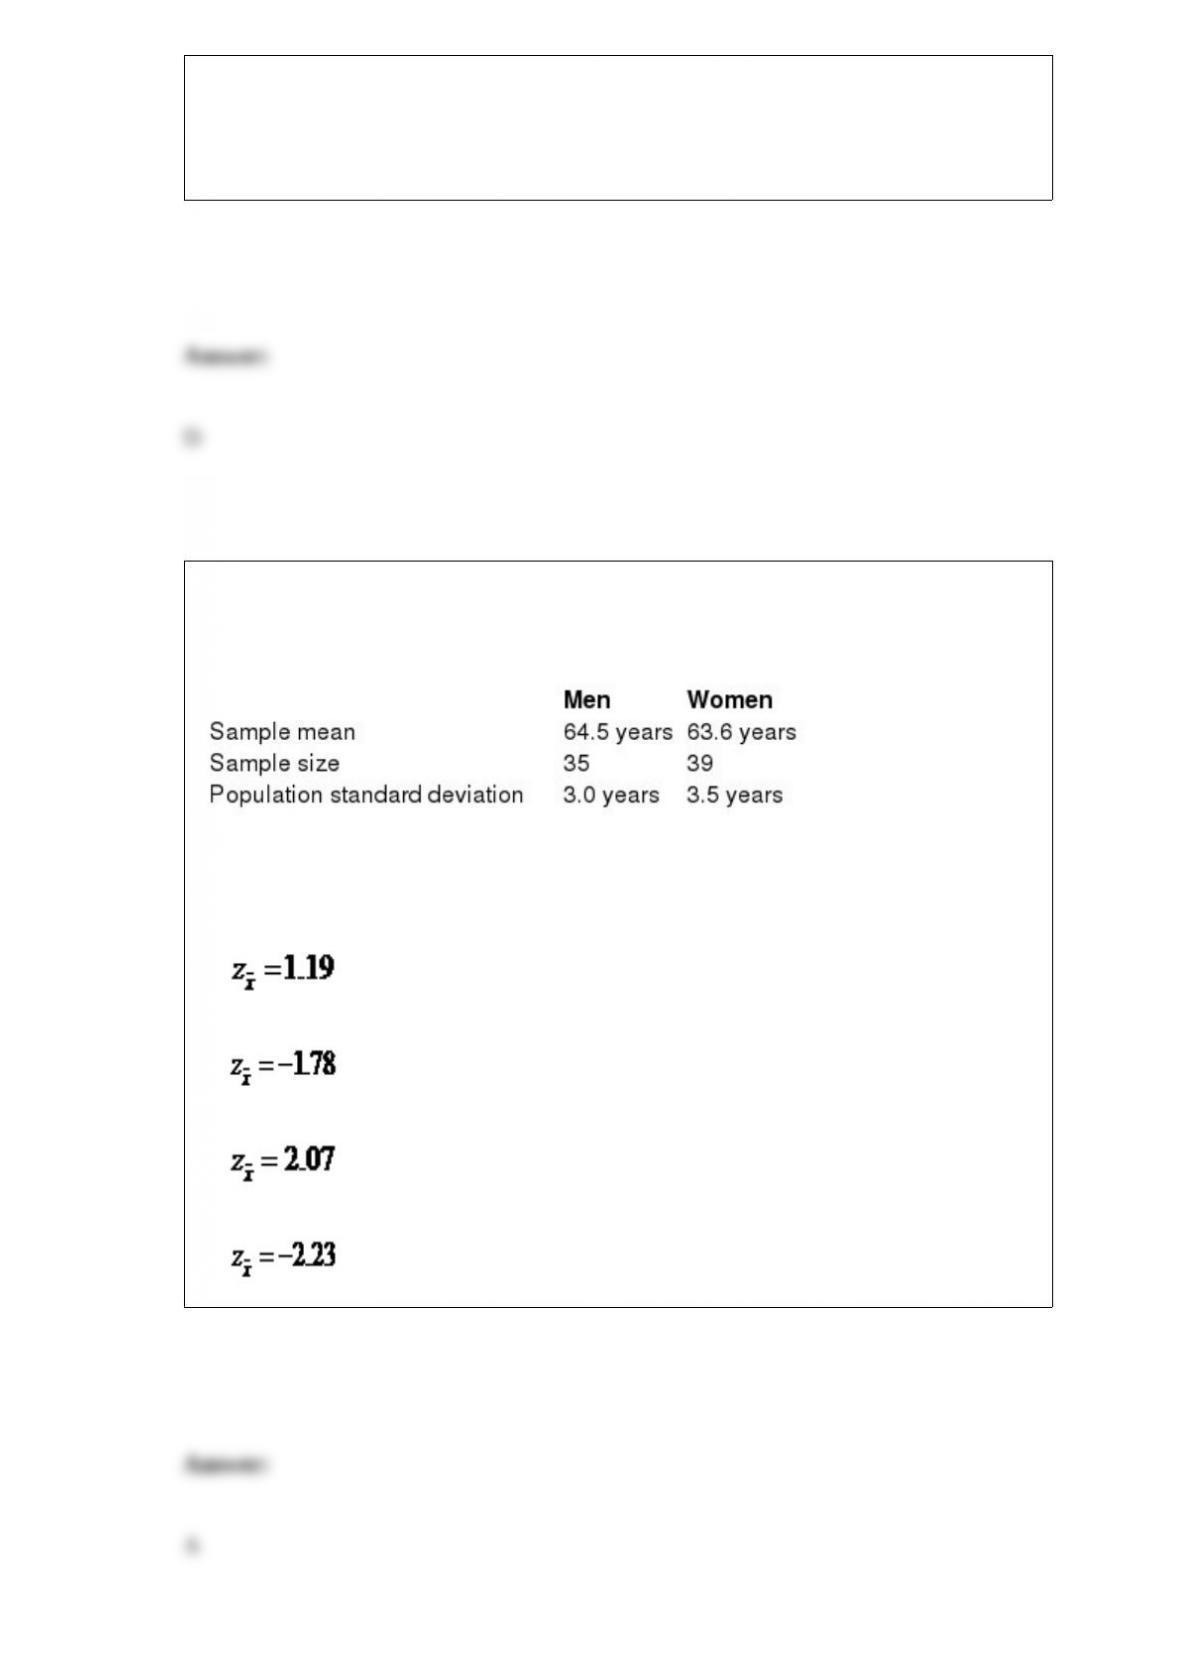
The federal government would like to test the hypothesis that the average age of men
filing for Social Security is higher than the average age of women set using α = 0.05
with the following data:
If Population 1 is defined as men and Population 2 is defined as women, the test
statistic for this hypothesis test would be ________.
A)
B)
C)
D)
A ________ for the mean is an interval estimate around a sample mean that provides us
with a range of where the true population mean lies.
A) margin of error
B) significance level
C) confidence level
D) confidence interval
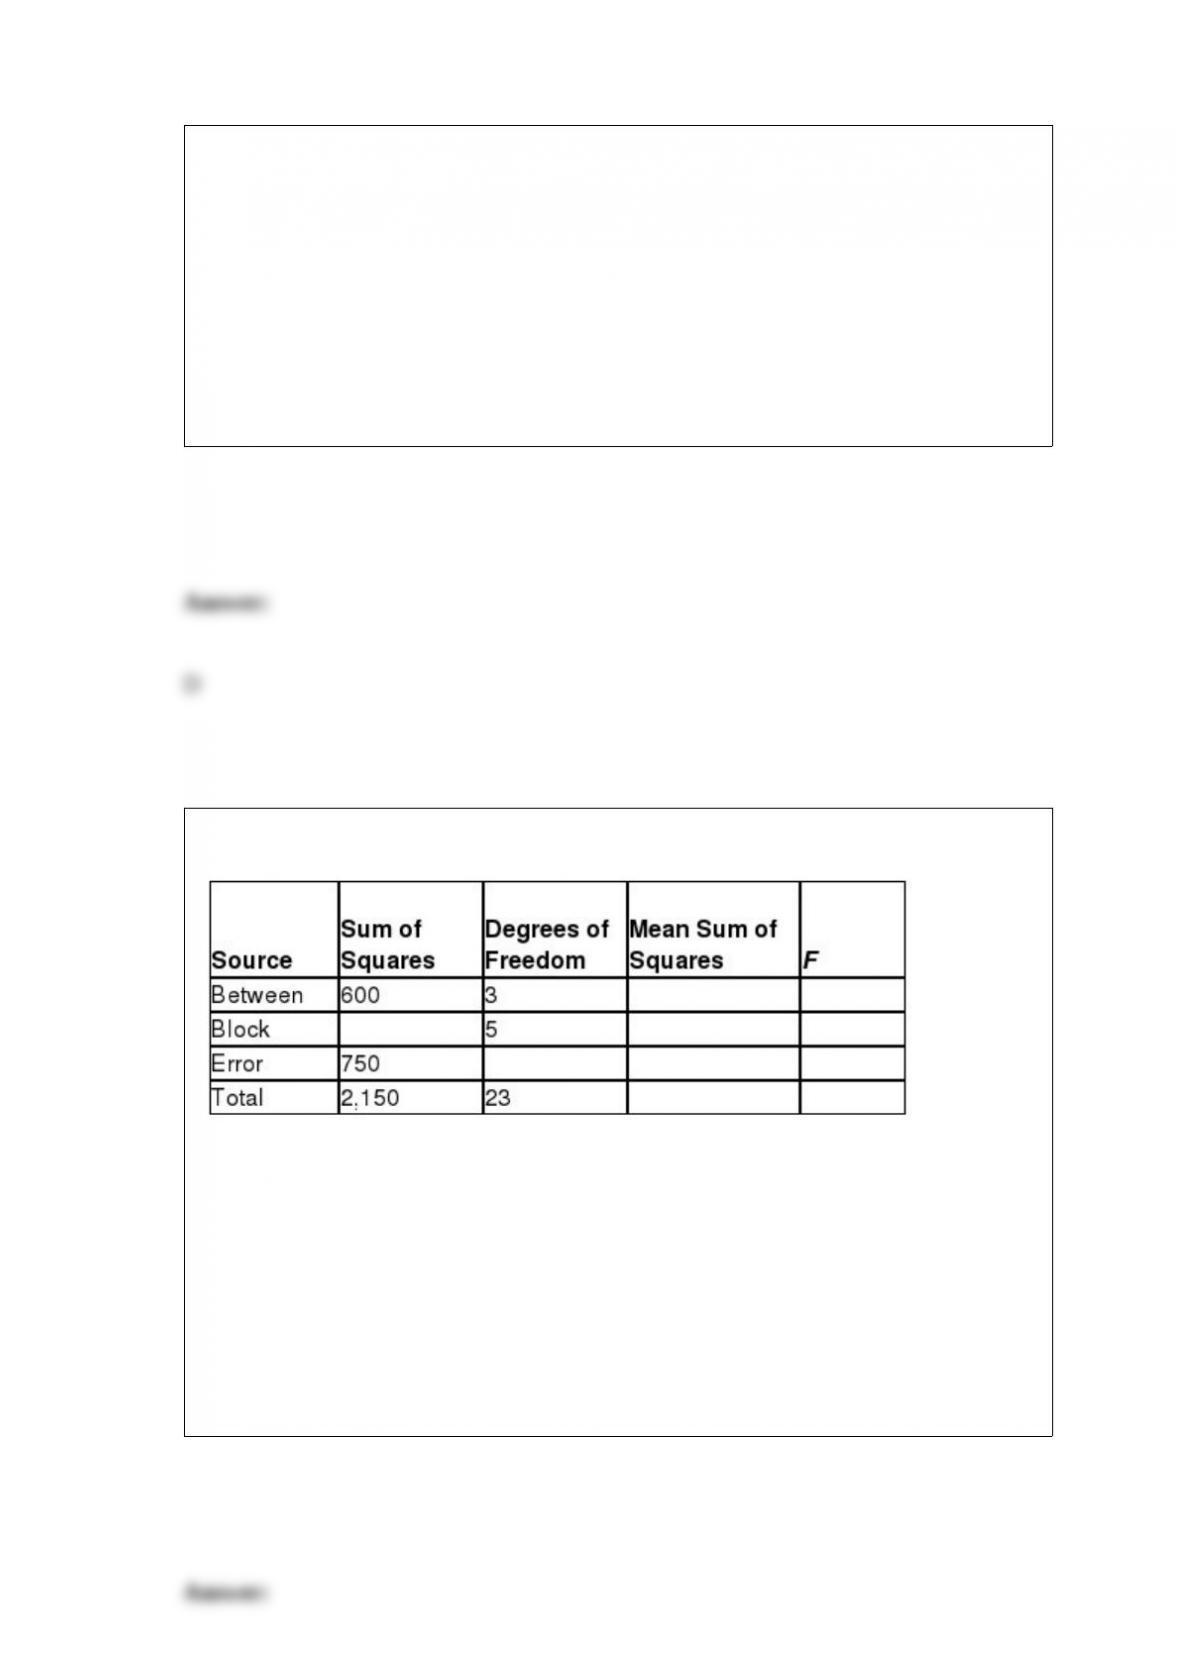
Consider the partially completed randomized block ANOVA summary table.
The mean square block for this ANOVA procedure is _______.
A) 50
B) 160
C) 200
D) 410
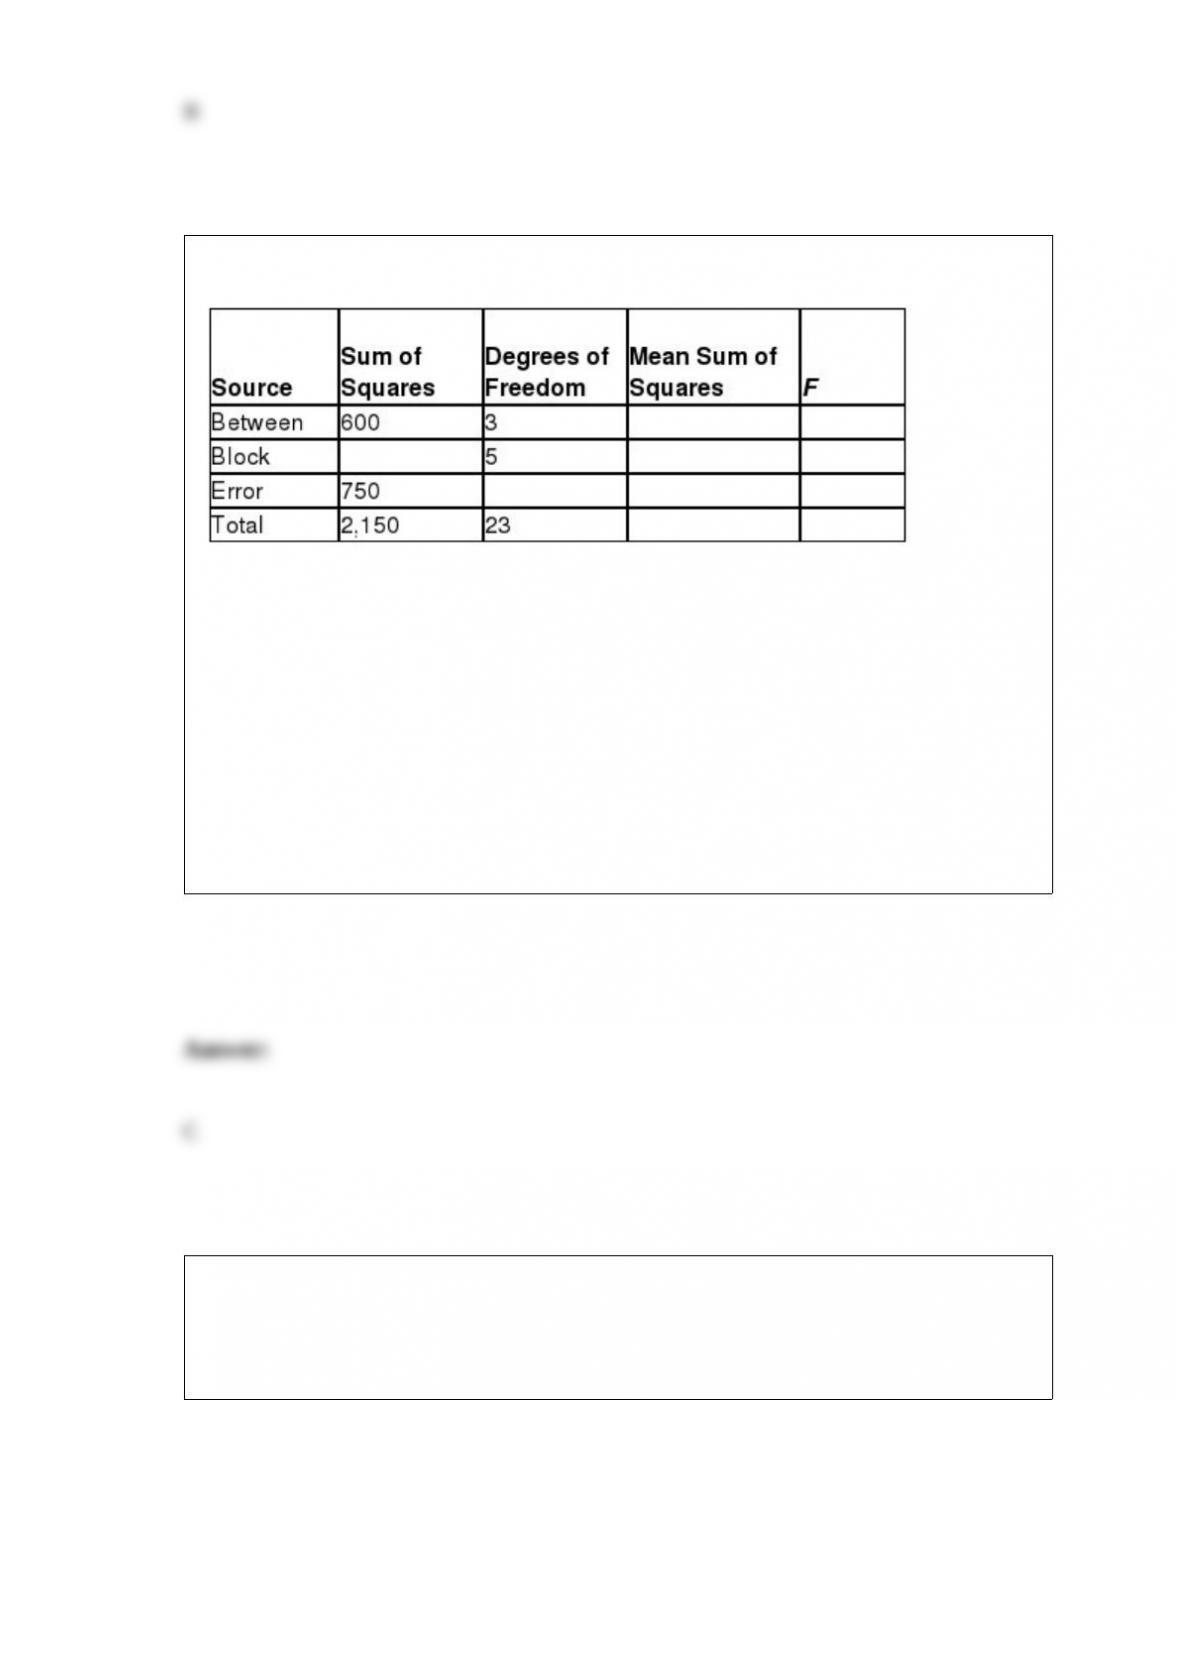
Consider the partially completed randomized block ANOVA summary table.
The number of main factor populations being compared for this ANOVA procedure is
_______.
A) 2
B) 3
C) 4
D) 5
Chris, Steve, and Josh routinely play golf together and would like to know if the median
number of golf balls lost during a round differs between them. The following table
shows the number of golf balls lost by each player during a random sample of golf
rounds.
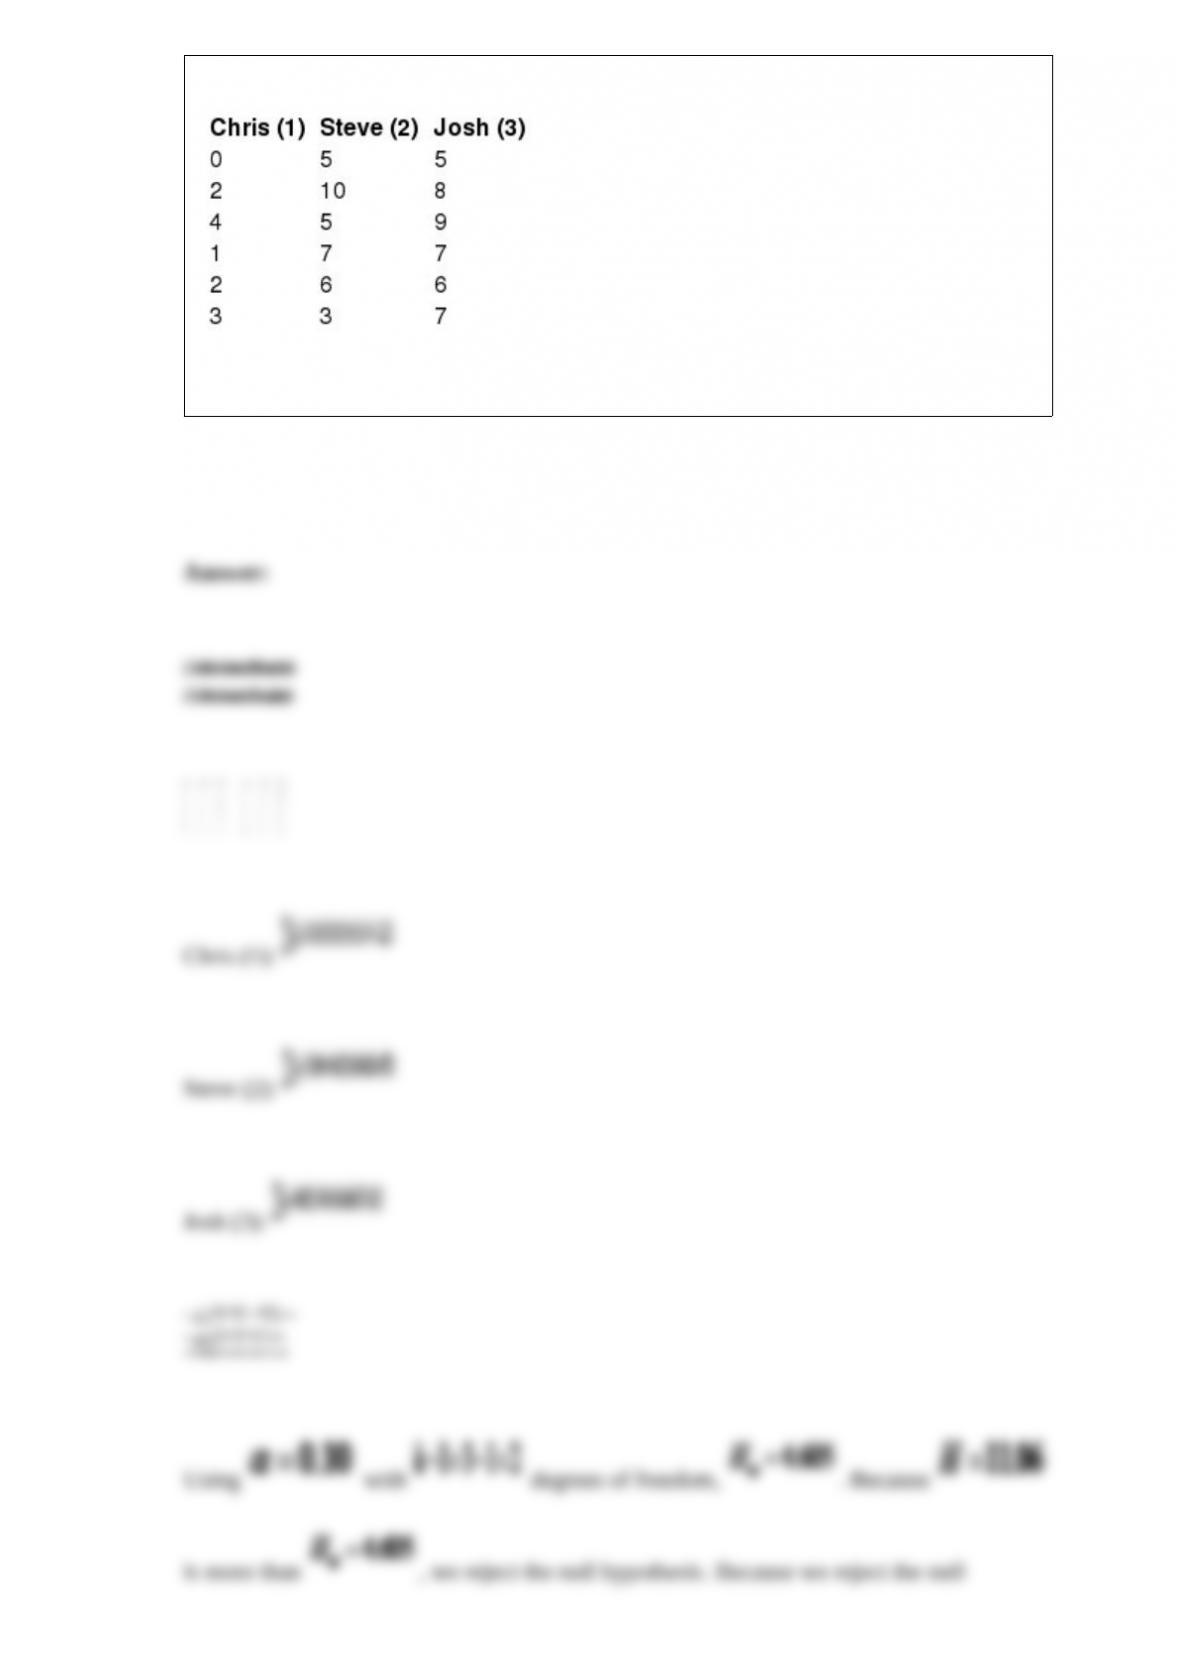
Perform this hypothesis test using α = 0.10.
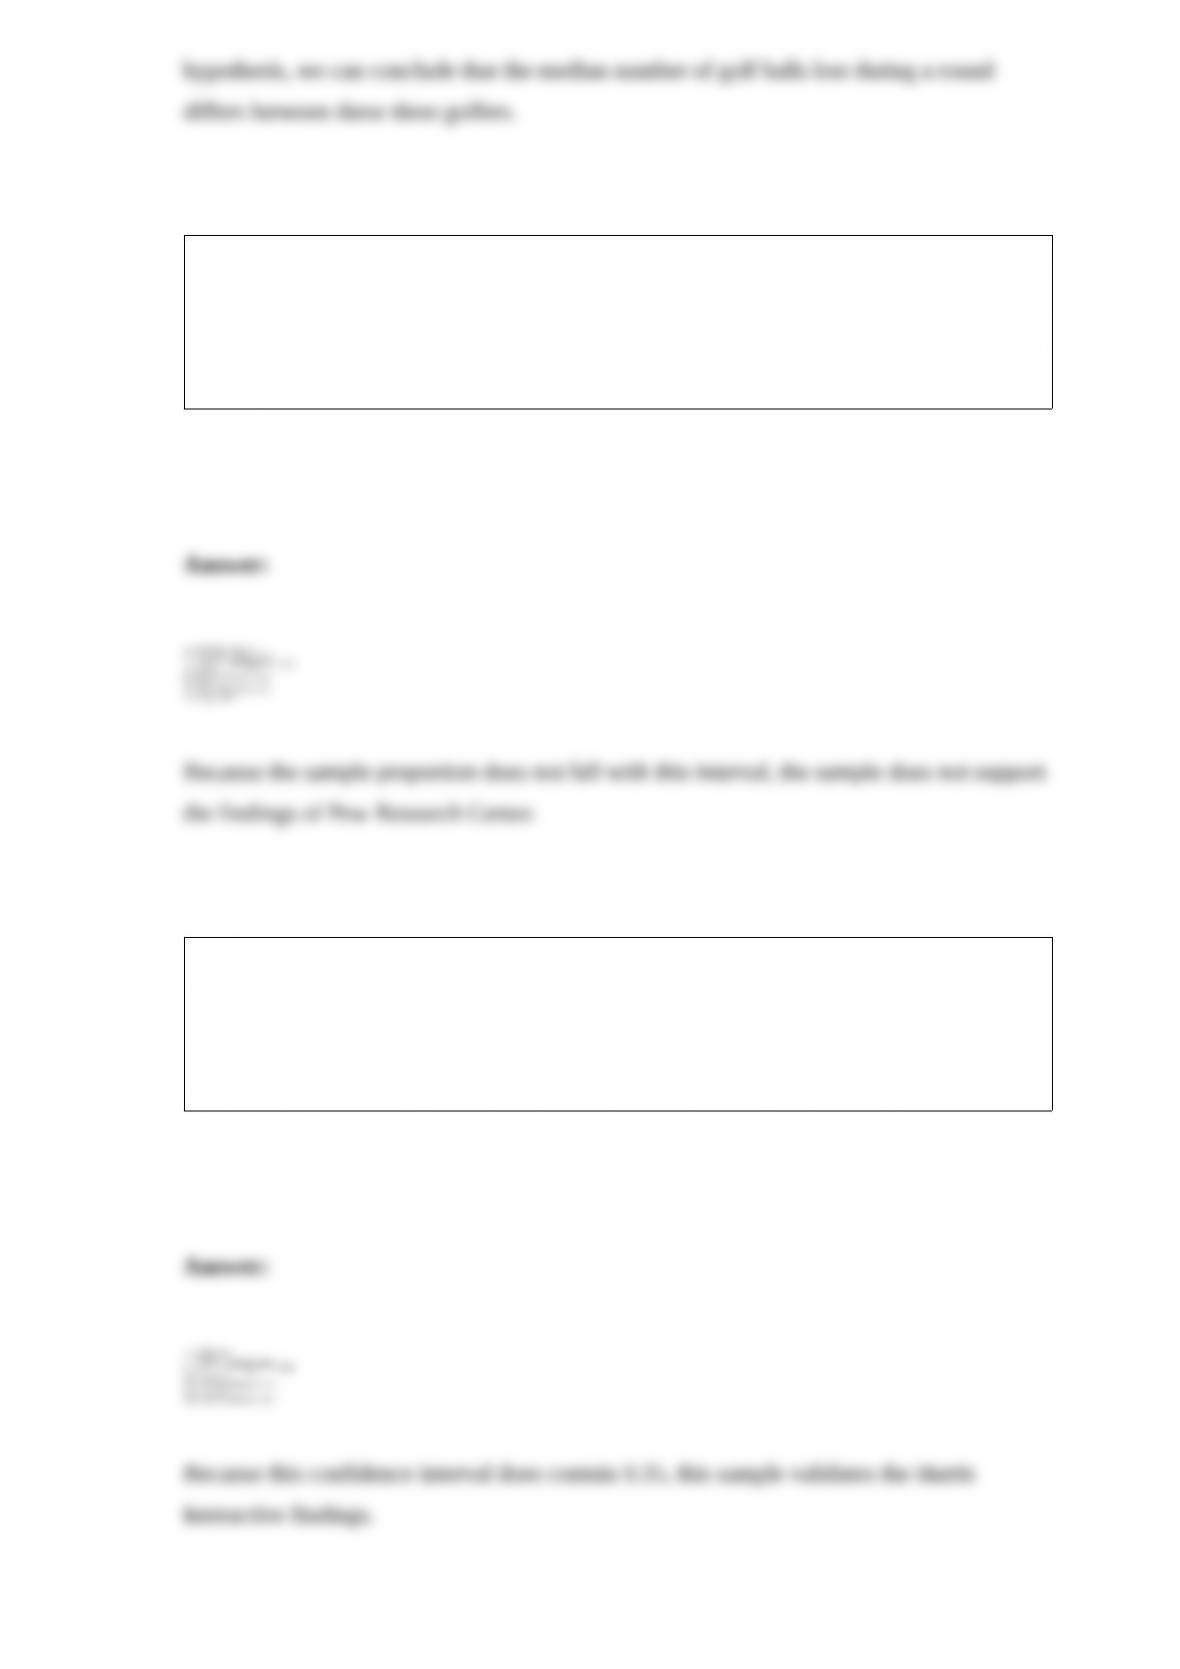
According to Pew Research Center, 83% of U.S. adults are routinely using the Internet.
To verify this percentage, a random sample of 150 adults was selected of which 137 use
the Internet. Determine the interval that contains 95% of the sample proportions from
this sampling distribution and conclude whether or not this sample supports the findings
of Pew Research Center.
A survey by Harris Interactive reported that 35% of college students prefer digital
textbooks over traditional print textbooks. State University would like to confirm these
results. A random sample of 125 students was asked their textbook preference and a
total of 37 preferred the digital format. Use a 95% confidence interval to validate the
Harris Interactive findings.
A business class consists of seven groups of students who each make a presentation
during the semester. The instructor grades the presentations and rank orders the
performance of these groups from best to worst. Determine the number of ways these
seven groups can finish in this rank order.
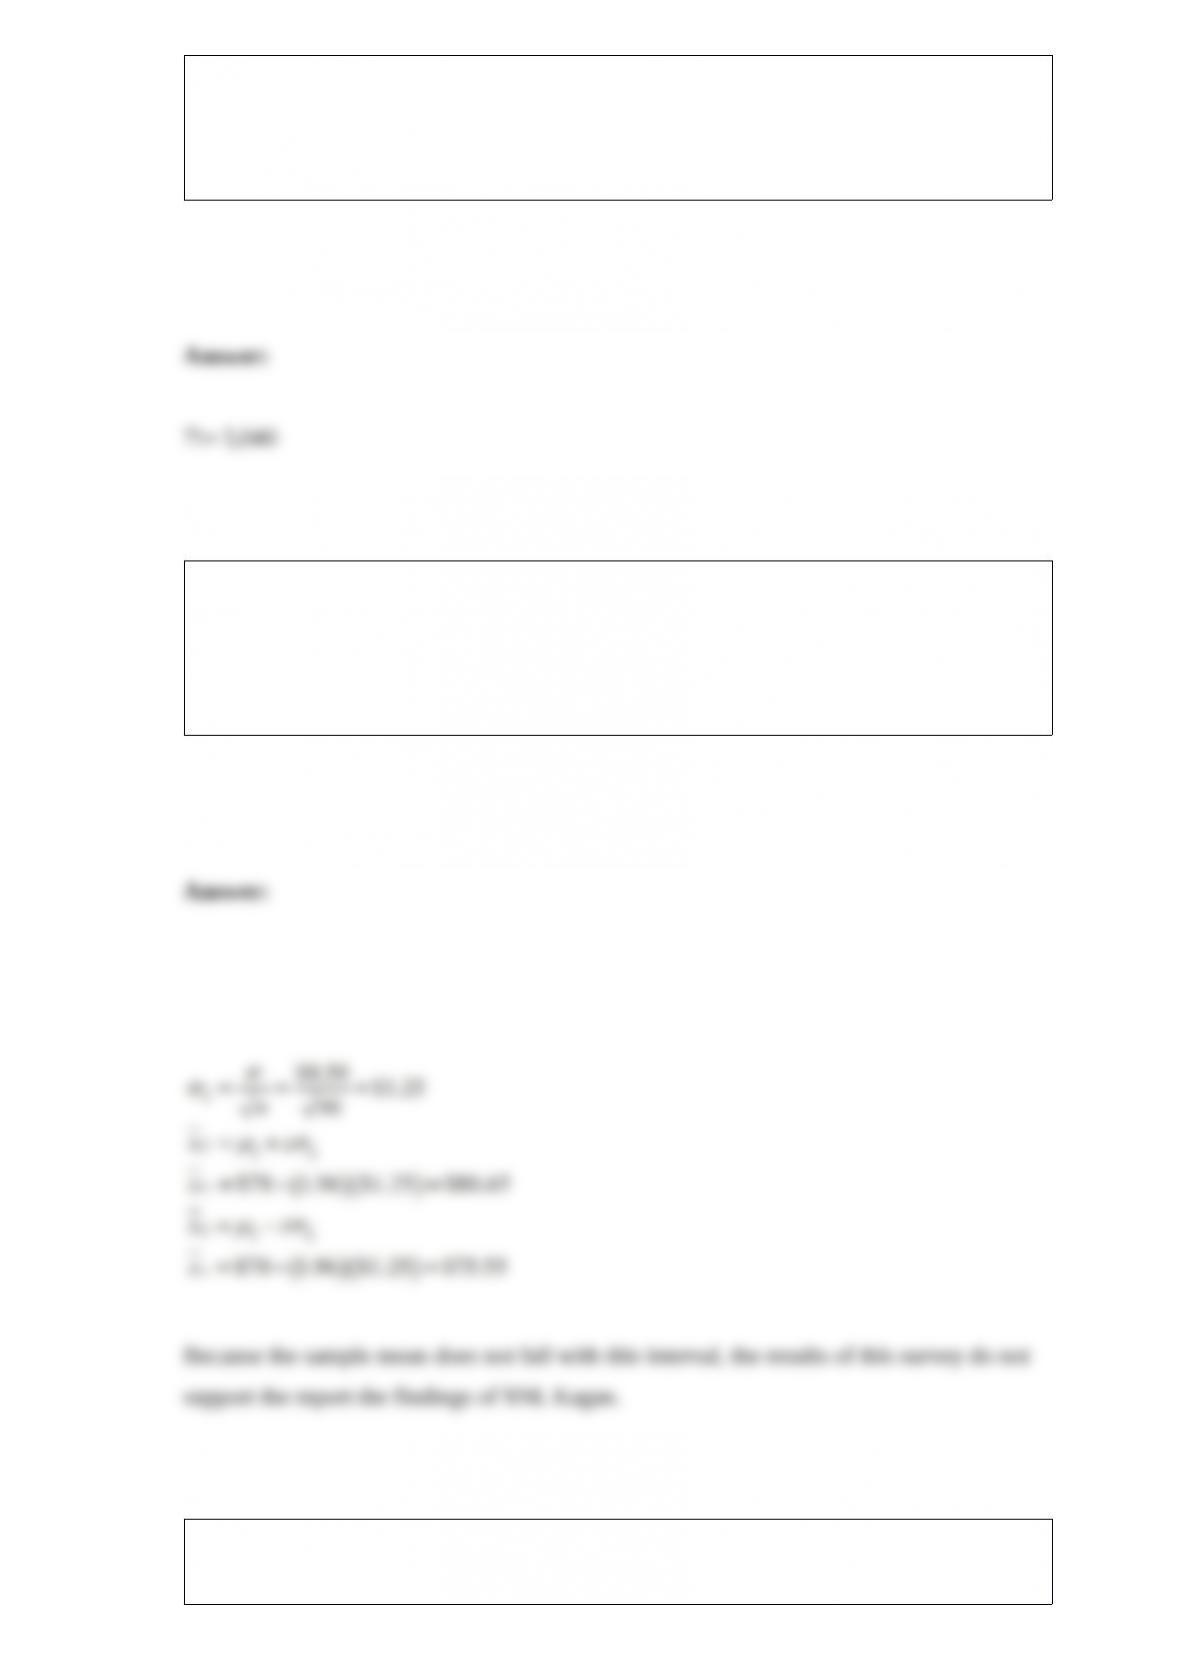
According to SNL Kagan, the average monthly cable bill for homes in the U.S. was $78
in a recent year. Assume that the standard deviation for monthly cable bills is $8.50. To
confirm these results, a random sample of 46 cable subscribers was selected and found
to have an average monthly cable bill of $74.70. Do the results of this survey support
the report by Capital Economics?
According to the Kaiser Family Foundation, the average annual premium paid by
workers with employee-provided health insurance for family coverage was $4,129 in a
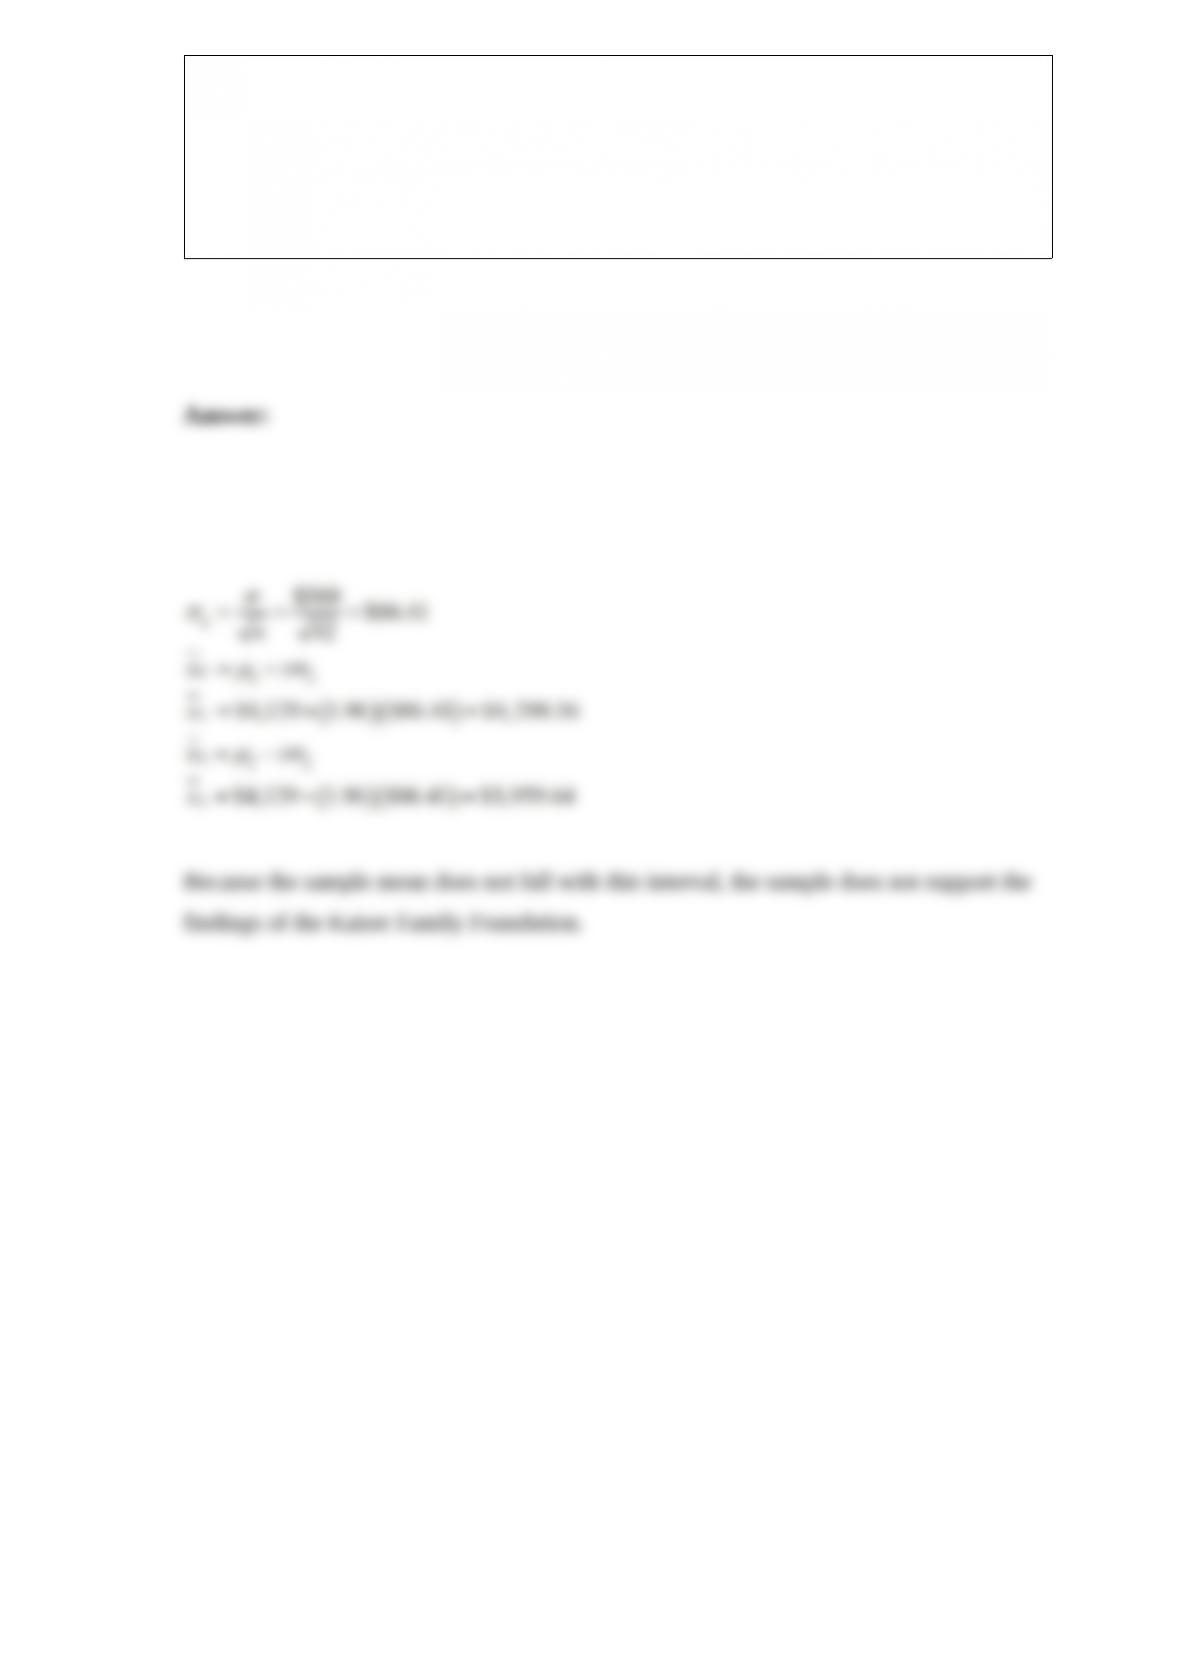
recent year. Assume that the standard deviation for this annual premium is $560. To
confirm these results, a random sample of 42 households with employee-provided
health insurance was collected and found to have an average premium of $4,470 for
family coverage. Determine the interval that contains 95% of the sample means from
this sampling distribution and conclude whether or not this sample supports the findings
of the Kaiser Family Foundation.