The standard deviation for the checking account balances is assumed known to be
$357.50. Recently, a bank manager was interested in estimating the mean balance. To
do this, she selected a random sample of 81 accounts and found a mean balance of
$1,347.20. At a 95 percent confidence level, the lower limit for the confidence interval
is $646.50.
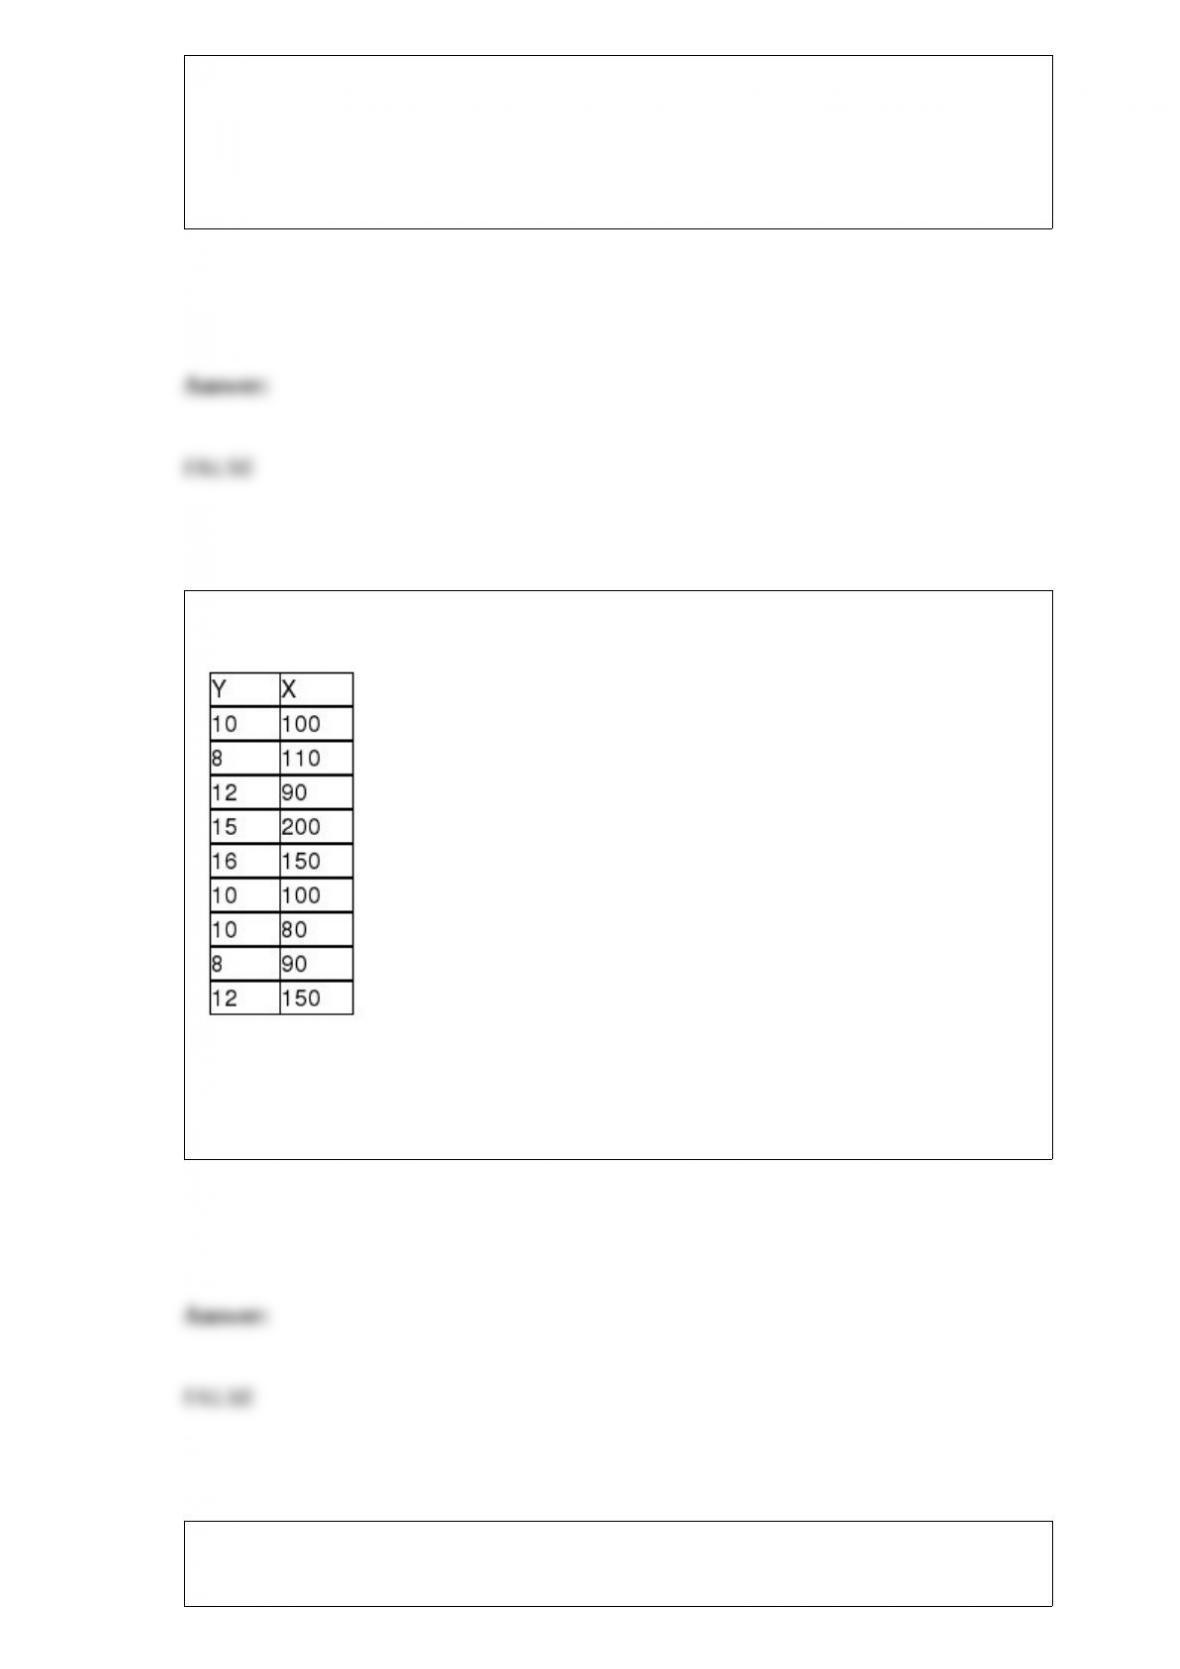
You are given the following sample data for two variables:
Based upon these sample data, and testing at the 0.05 level of significance, the critical
value for testing whether the population correlation coefficient is equal to zero is t =
2.2622.
The number of calls to an Internet service provider during the hour between 6:00 and
7:00 p.m. is described by a Poisson distribution with mean equal to 15. Given this
information, the expected number of calls in the first 30 minutes is 7.5 calls.
In the Wilcoxon signed rank test using either small or large sample sizes, any value that
equals the hypothesized median is discarded from the analysis.
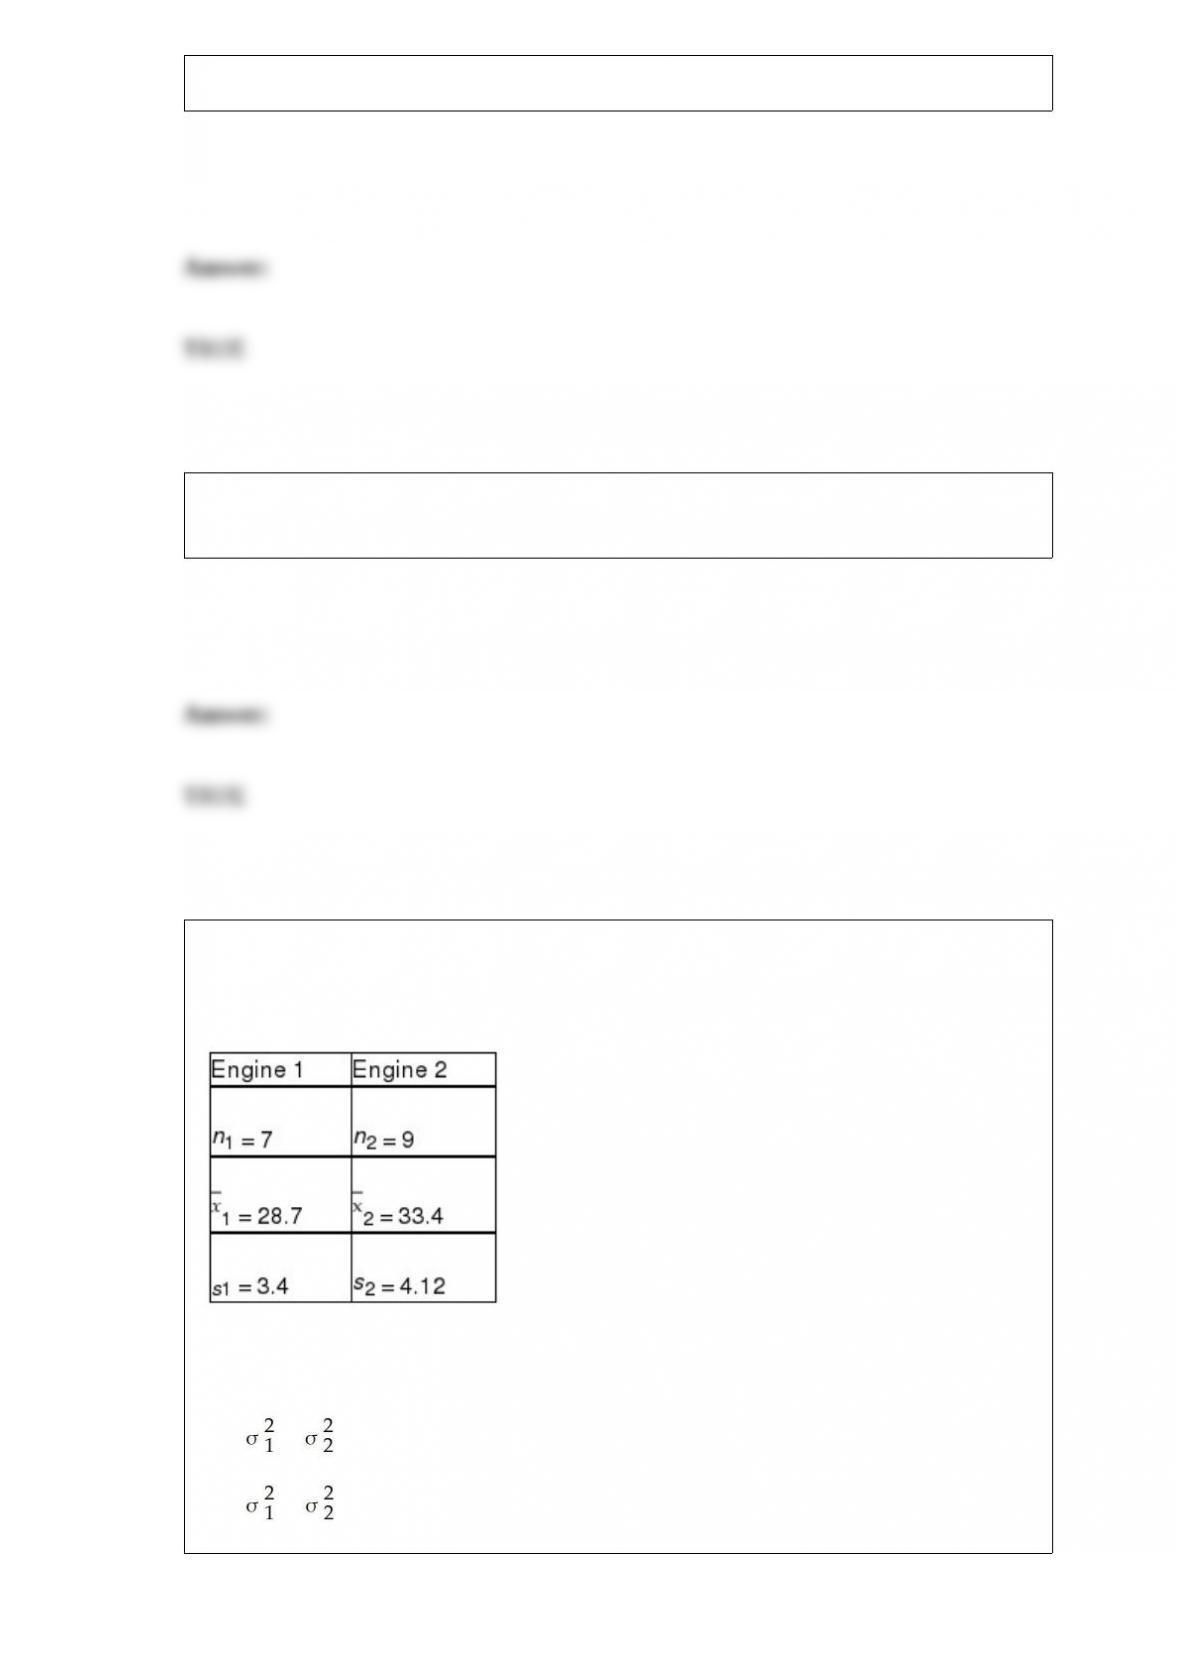
One of the major automobile makers has developed two new engines. At question is
whether the two engines have the same variability with respect to miles per gallon. To
test this, the following information is available:
Based on this situation and the information provided, the appropriate null and
alternative hypotheses are:
H0 : ≠
Ha : =

Recently, Major League Baseball officials stated that the median cost for a family of
four to attend a baseball game including, parking, tickets, food, and drinks did not
exceed $125.00. The following sample data were collected:
Assuming that the test of the owners’ claim is going to be conducted using an alpha = .
05 level, the critical value is t = 1.9432.
An advertising company is interested in determining if there is a difference in the mean
sales that will be generated for a soft drink company based on which shelf the soft
drinks are located. There are four possible shelf levels. The ad company wants to
control for store size. The following data reflect the sales for one week at each
combination of shelf level and store size.
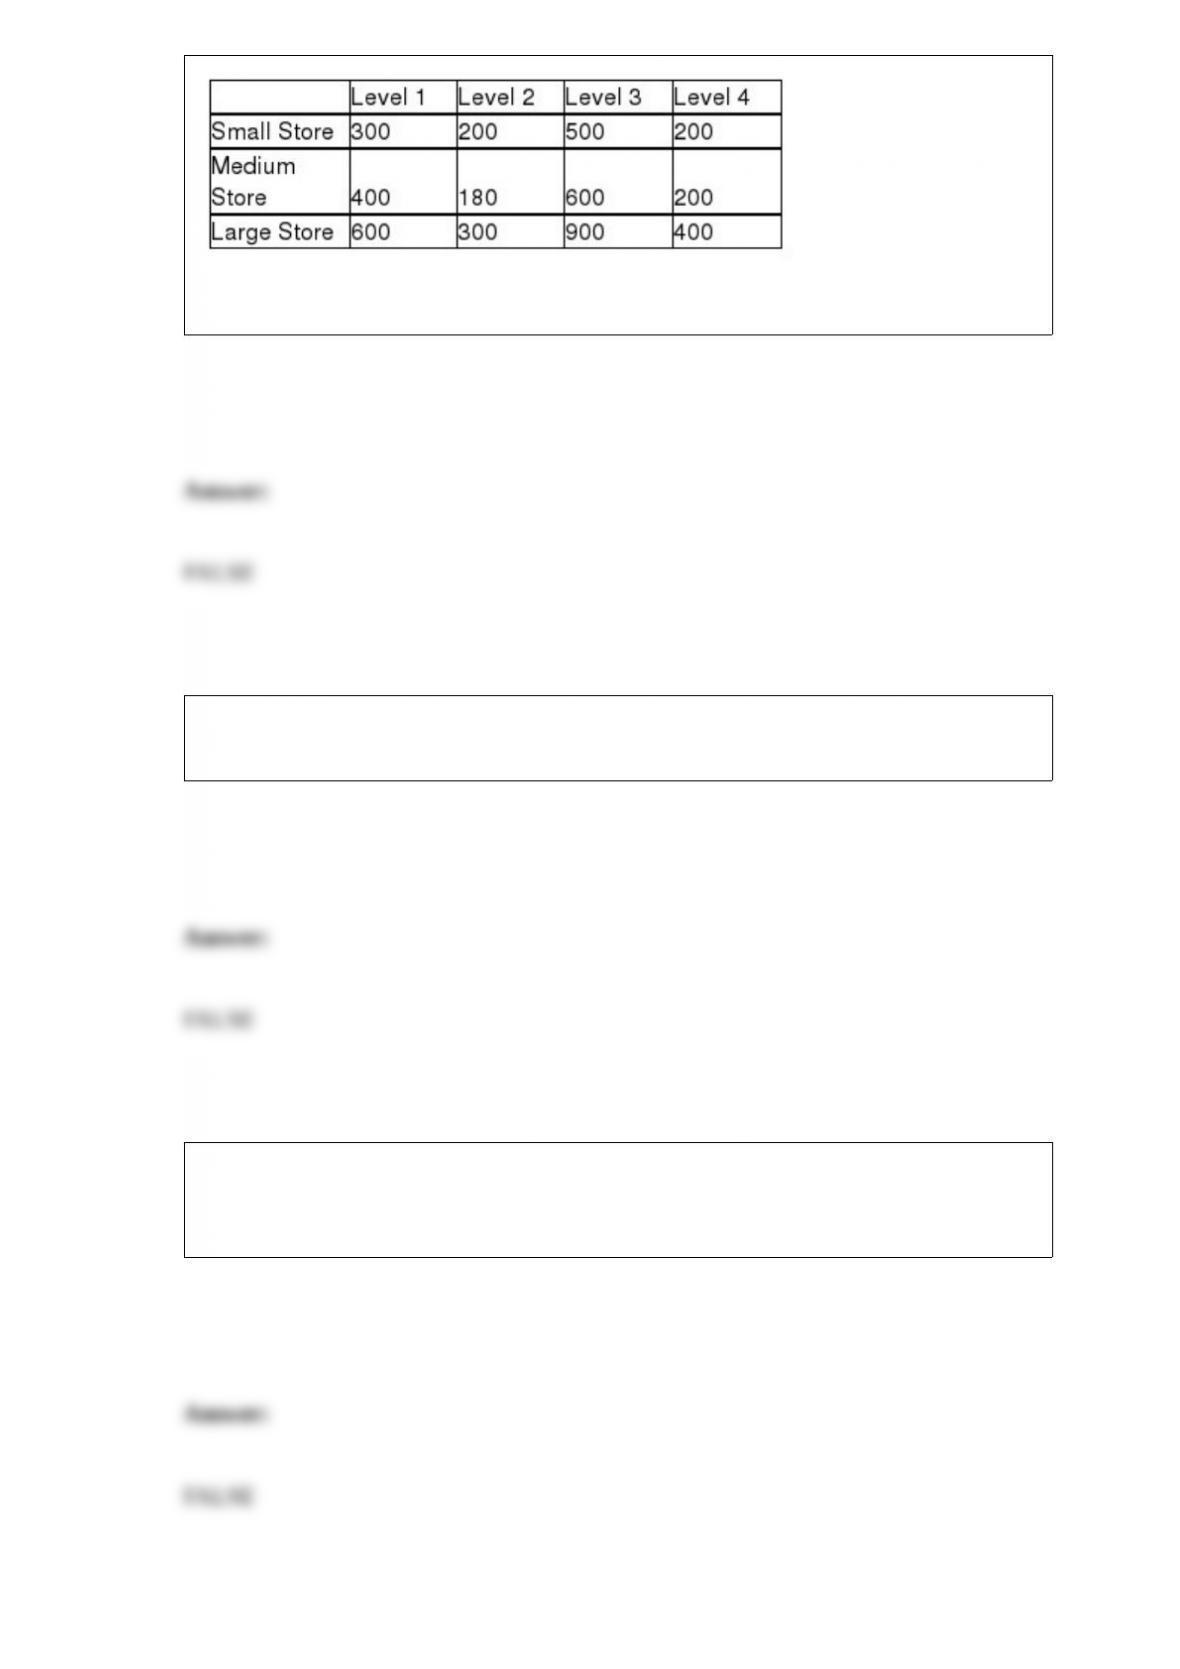
Based on the experimental design, the number of treatments is two.
One of the roles of managers who are overseeing the statistical process control analysis
is to set the control limits at the desired levels prior to collecting data from the process.
If a simple least squares regression model is developed based on a sample where the
two variables are known to be positively correlated, the sum of the residuals will be
positive.
One of the most common sources of common cause variation is the people who are
working in the process.
The correlation matrix is an effective means of determining whether any of the
independent variables has a curvilinear relationship with the dependent variable.
One way to reduce the margin of error in a confidence interval estimate is to lower the
level of confidence.
The probability of the outcome changes from trial to trial in a binomial experiment.

The Mann-Whitney U test is always a one-tailed test.
The six most common sources of variation are people, machines, materials, methods,
measurement, and environment.
In a chi-square contingency analysis application, the expected cell frequencies will be
equal in all cells if the null hypothesis is true.

When performing a hypothesis test for the difference between the means of two
independent populations where the standard deviations are known, it is necessary to use
the pooled standard deviation in calculating the test statistic.
For a given set of data, if the data are treated as a population, the calculated standard
deviation will be less than it would be had the data been treated as a sample.
The fact that a point estimate will likely be different from the corresponding population
value is due to the fact that point estimates are subject to sampling error.
Holmstead Company owns two small engine repair stores. The expected value of the
number of complaints received per month at store 1 is 4.5 complaints. Further, the
expected number of complaints per month for store 1 and store 2 combined is 13.6. This
means the expected number of complaints per month at store 2 must be 9.1 complaints.
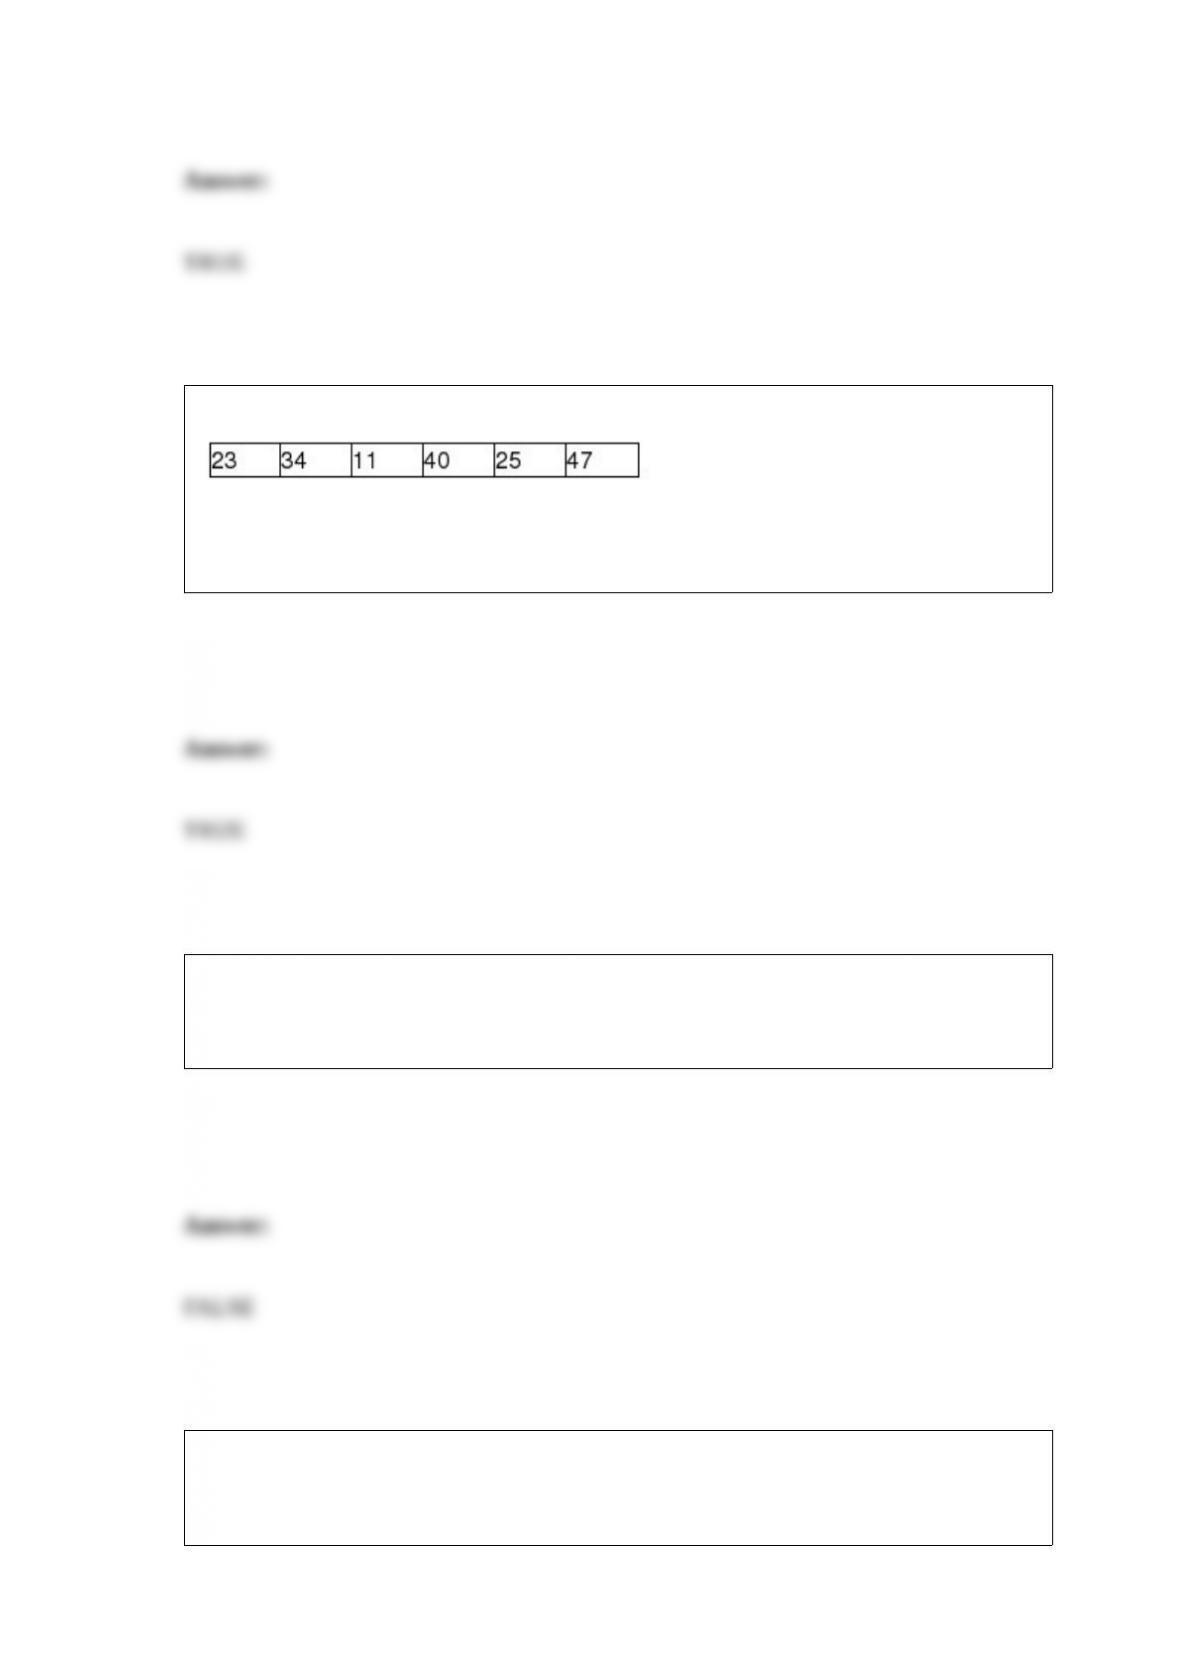
You are given the following data:
Assuming that the data reflect a sample from a larger population, the sample mean is
30.00.
The J.B. Hanson Company is interested in analyzing the relationship between
end-of-the-week inventory levels and sales for the same week. The graph that most
likely would be used to show this relationship is a histogram.
A sales manager has five salespeople. The following are the number of units sold by the
five salespeople during the past week: {5, 13, 6, 2, 4}. Based on the data, the mean
number of units sold was 6 units.
Recently a survey was conducted in which customers of a large insurance company
were asked to indicate the number of speeding tickets they had received in the past
three years. The minimum value in the data was zero and the largest was six tickets. If
you wished to illustrate the proportion of people who had three or fewer tickets, you
would most likely construct a cumulative relative frequency distribution.
The Wilcoxon signed rank test is used for testing hypotheses about a population median
if the data are at nominal level.
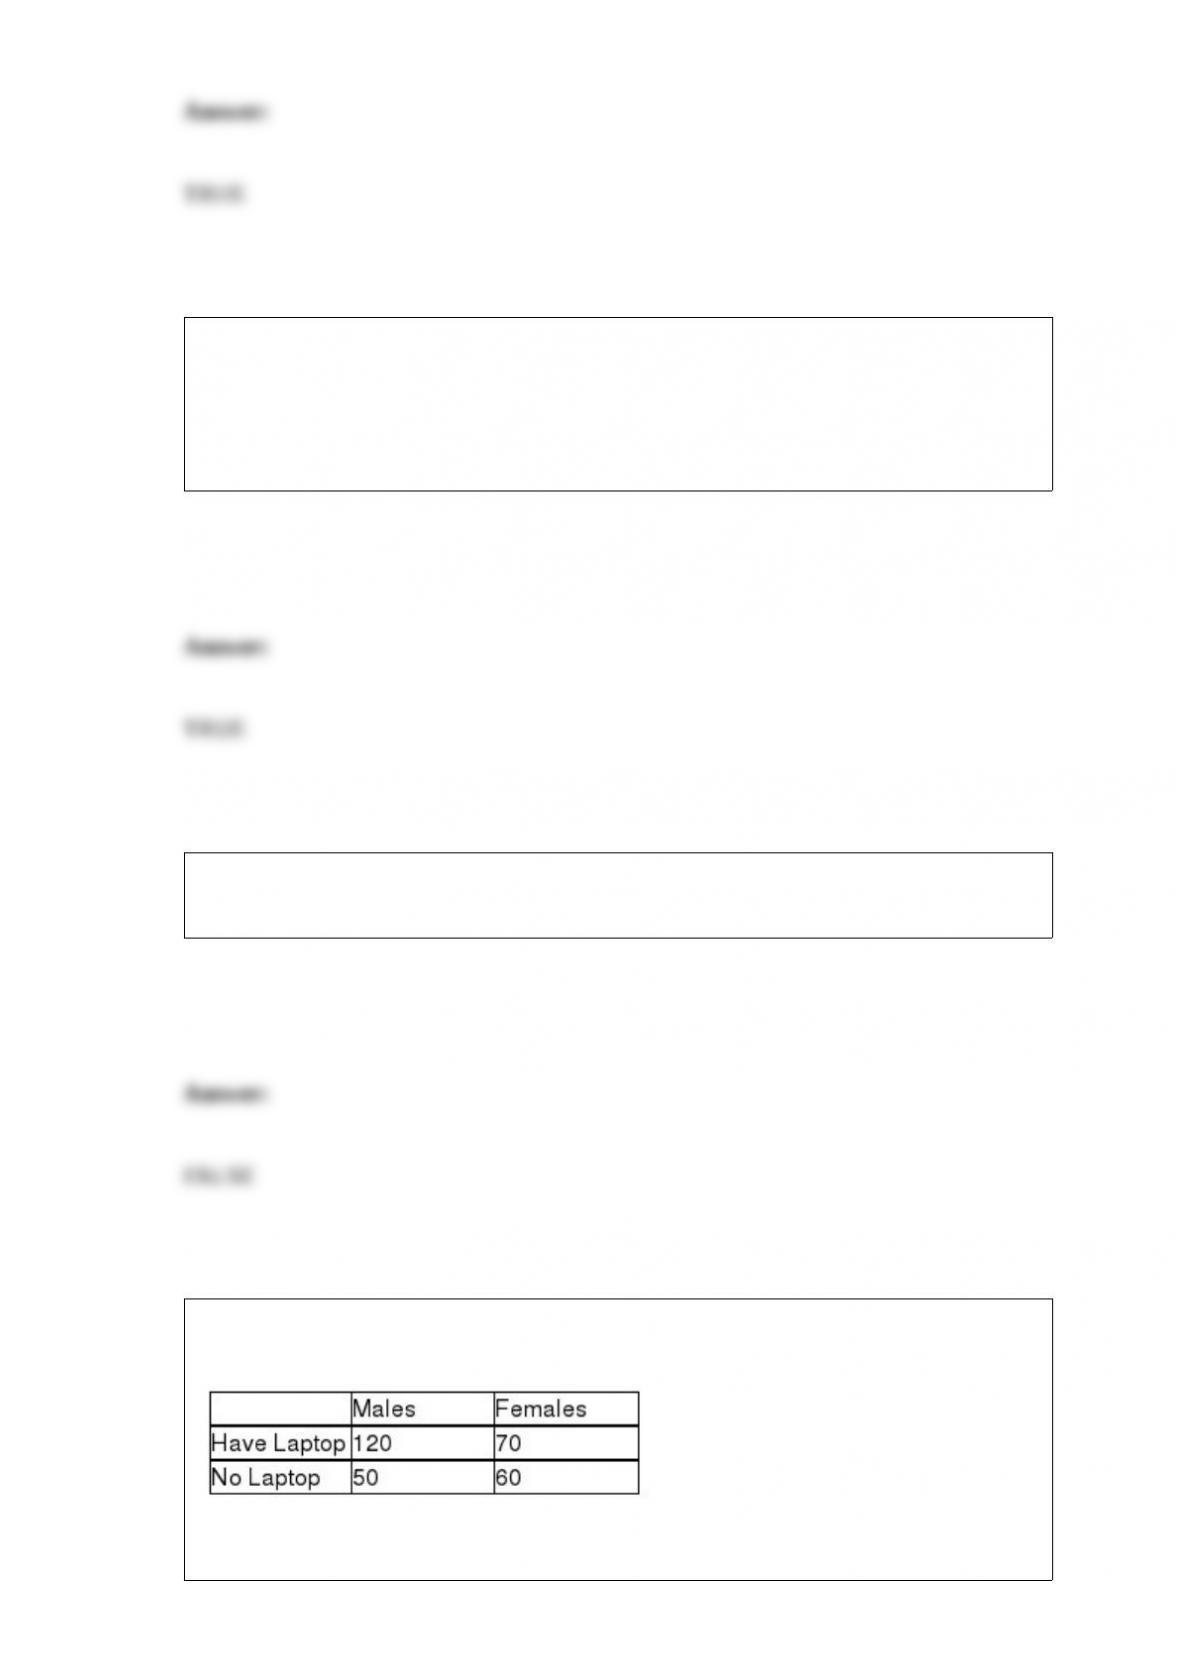
A survey was recently conducted in which males and females were asked whether they
owned a laptop personal computer. The following data were observed:
Given this information, the sample size in the survey was 300 people.
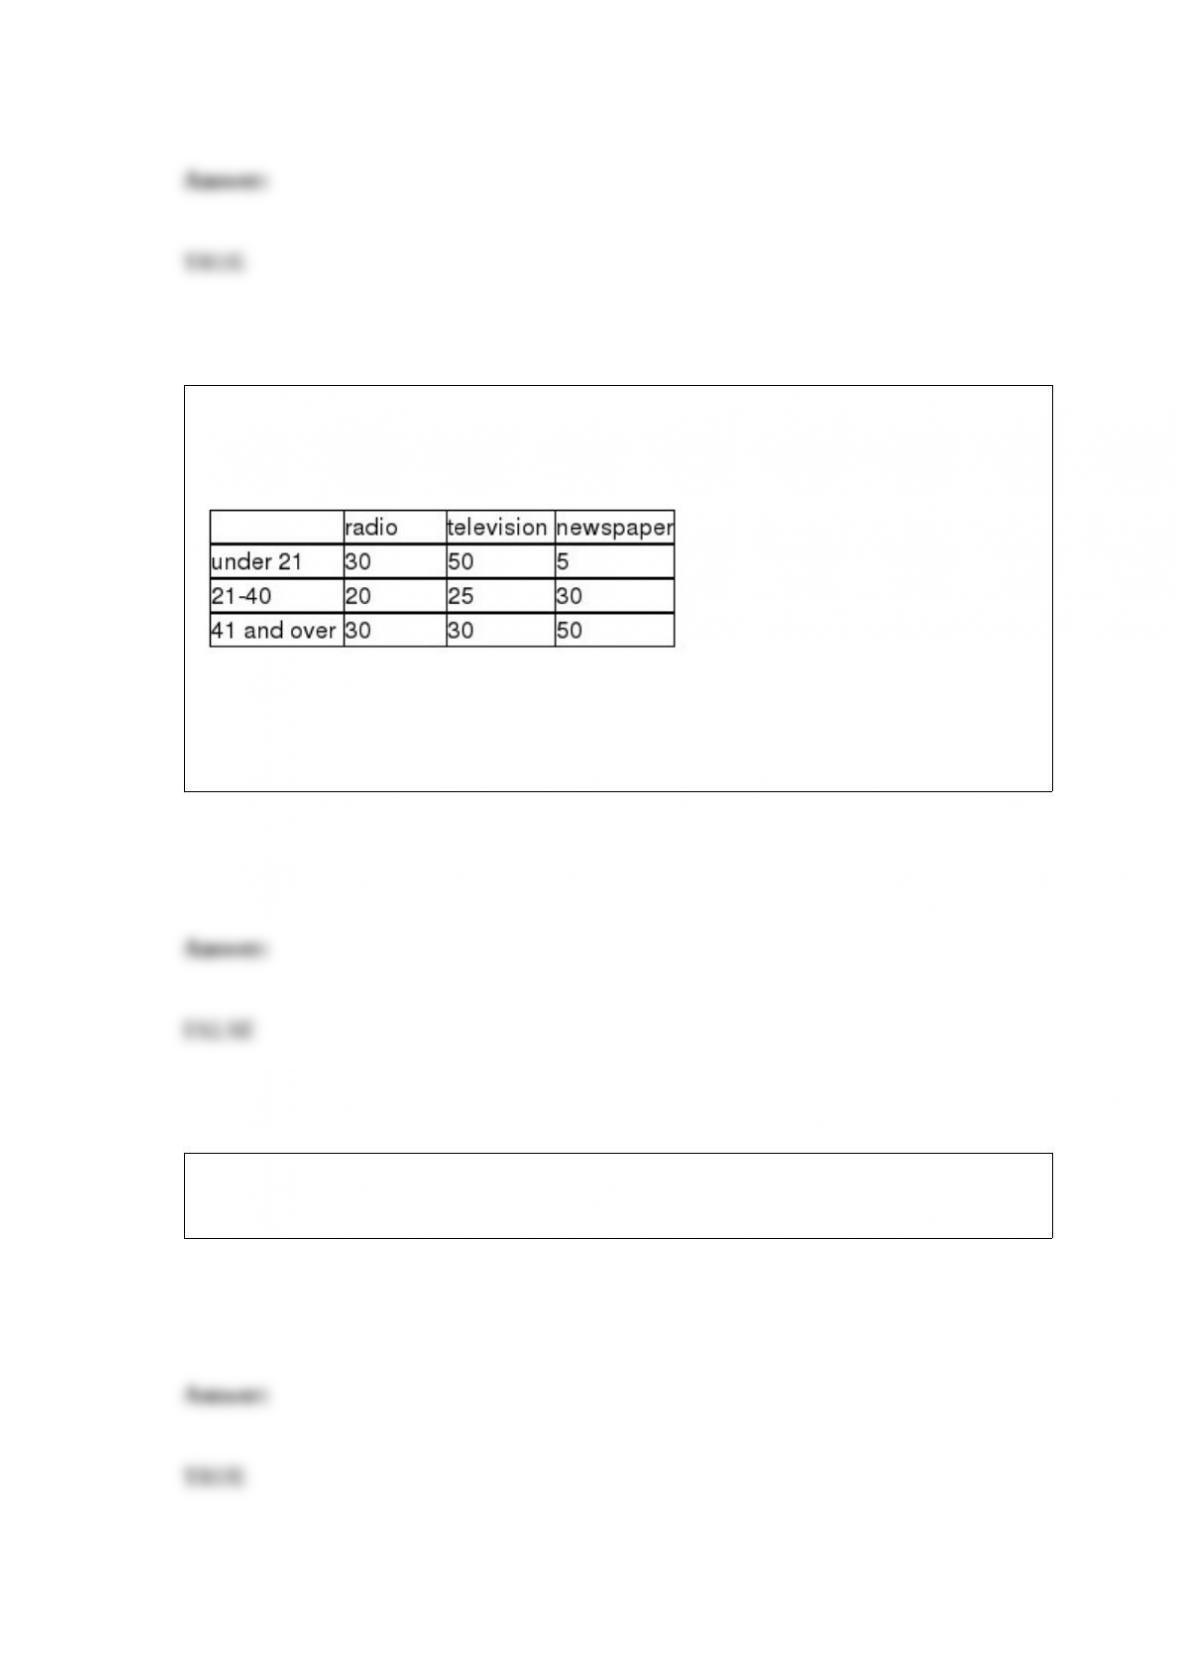
A study was recently conducted in which people were asked to indicate which news
medium was their preferred choice for national news. The following data were
observed:
Given this data, if we wish to test whether the preferred news source is independent of
age, the cell with the largest expected cell frequency is also the cell with the largest
observed frequency.
When using the binomial distribution, the maximum possible number of success is the
number of trials.

If a pilot sample of n = 40 items has been used as a first step in determining a required
sample size of n = 360, the decision maker can go ahead and use these 40 and take a
sample of only 320 more items.
The goodness-of-fit test is essentially determining if the test statistic is significantly
larger than zero.
The logic behind the F-test for testing whether two populations have equal variances is
to determine whether sample variances computed from random samples selected from
the two populations differ due to sampling error, or whether the difference is more than
can be attributed to sampling error alone, in which case, we conclude that the
populations have different variances.
The Ski Patrol at Criner Mountain Ski Resort has determined the following probability
distribution for the number of skiers that are injured each weekend:
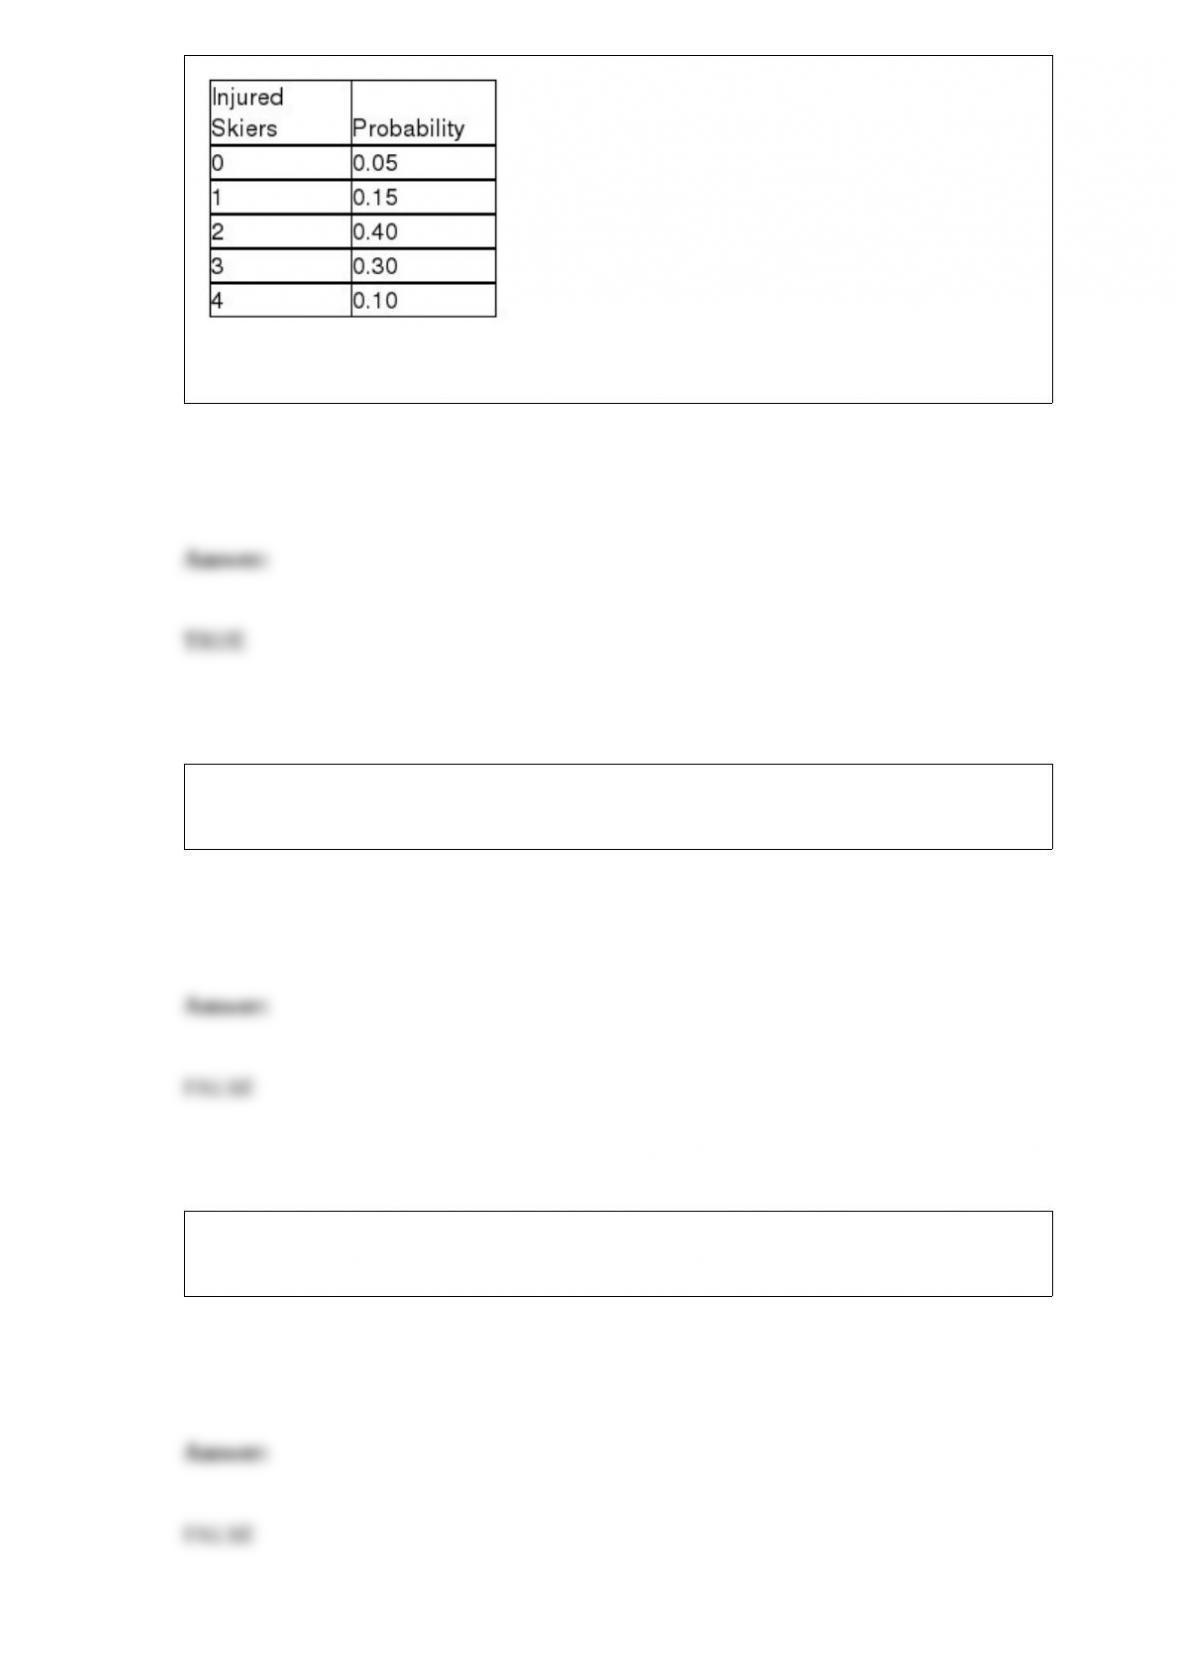
Based on this information, the expected number of injuries per weekend is 2.25.
Both a scatter plot and the correlation coefficient can distinguish between a curvilinear
and a linear relationship.
Hypothesis testing and confidence interval estimation are essentially two totally
different statistical procedures and share little in common with each other.

When calculating prediction intervals for predicted values of y based on a given x, all
95 percent prediction intervals will be of equal width.
To describe variable credit status that has three levels: Excellent, Good, and Poor, we
need to use two different dummy variables.
A dam on a river that holds back a water reservoir begins to leak. Engineers say that
there is a 10 percent chance of the dam breaking if repairs are not made. This is an
example of classical probability.
When a pair of variables has a positive correlation, the slope in the regression equation
will always be positive.

Watersports Rental at Flathead Lake rents jet skis and power boats for day use. Each
piece of equipment has a clock that records the time that it was actually in use while
rented. The company has observed over time that the distribution of time used is
normally distributed with a mean of 3.6 hours and a standard deviation equal to 1.2
hours. Watersports management has decided to give a rebate to customers who use the
equipment for less than 2.0 hours. Based on this information, the probability that a
customer will get the rebate is 0.4082.
To show how the price of a stock has changed over the last 3 months, the best type of
chart to use is:
A) a pie chart.
B) a histogram.
C) a line chart.
D) a bar chart.

Consider a random variable, z, that has a standardized normal distribution. Determine
P(z > -1).
A) 0.8413
B) 0.1251
C) 0.1512
D) 0.2124
The manager of a movie theater has determined that the distribution of customers
arriving at the concession stand is Poisson distributed with a standard deviation equal to
2 people per 10 minutes. What is the probability that more than 3 customers arrive
during a 10-minute period?
A) 0.1804
B) 0.5665
C) 0.4335
D) 0.1954
For the following hypothesis test
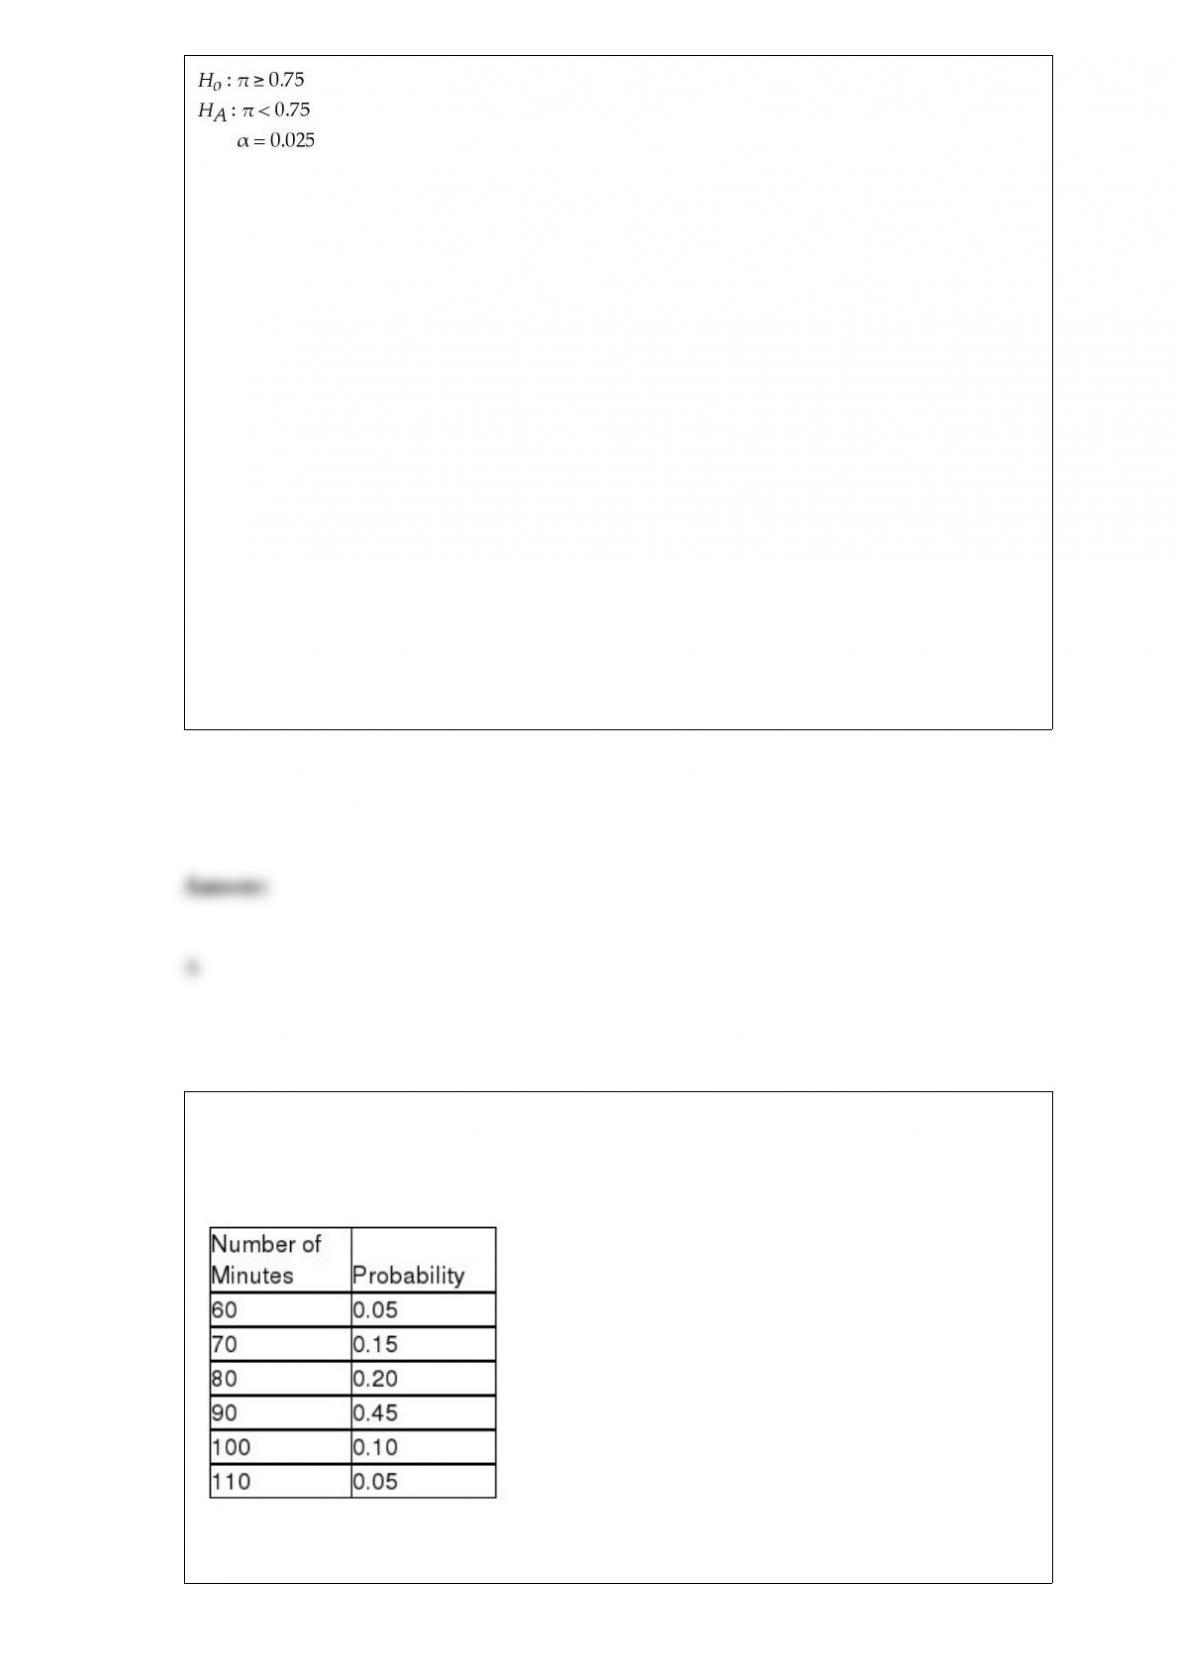
With n = 100 and p = 0.66, state the decision rule in terms of the critical value of the
test statistic
A) The decision rule is: reject the null hypothesis if the calculated value of the test
statistic, z, is less than the critical value of the test statistic z = -1.96. Otherwise, do not
reject.
B) The decision rule is: reject the null hypothesis if the calculated value of the test
statistic, z, is less than the critical value of the test statistic z = -1.645. Otherwise, do not
reject.
C) The decision rule is: reject the null hypothesis if the calculated value of the test
statistic, z, is greater than the critical value of the test statistic z = 1.96. Otherwise, do
not reject.
D) The decision rule is: reject the null hypothesis if the calculated value of the test
statistic, z, is greater than the critical value of the test statistic z = 1.645. Otherwise, do
not reject.
Cramer’s Bar and Grille in Dallas can seat 130 people at a time. The manager has been
gathering data on the number of minutes a party of four spends in the restaurant from
the moment they are seated to when they pay the check.
What is the variance and standard deviation?

A) Variance = 164.99, standard deviation = 12.84
B) Variance = 233.75, standard deviation = 15.89
C) Variance = 128.75, standard deviation = 11.35
D) Variance = 134.75, standard deviation = 11.61
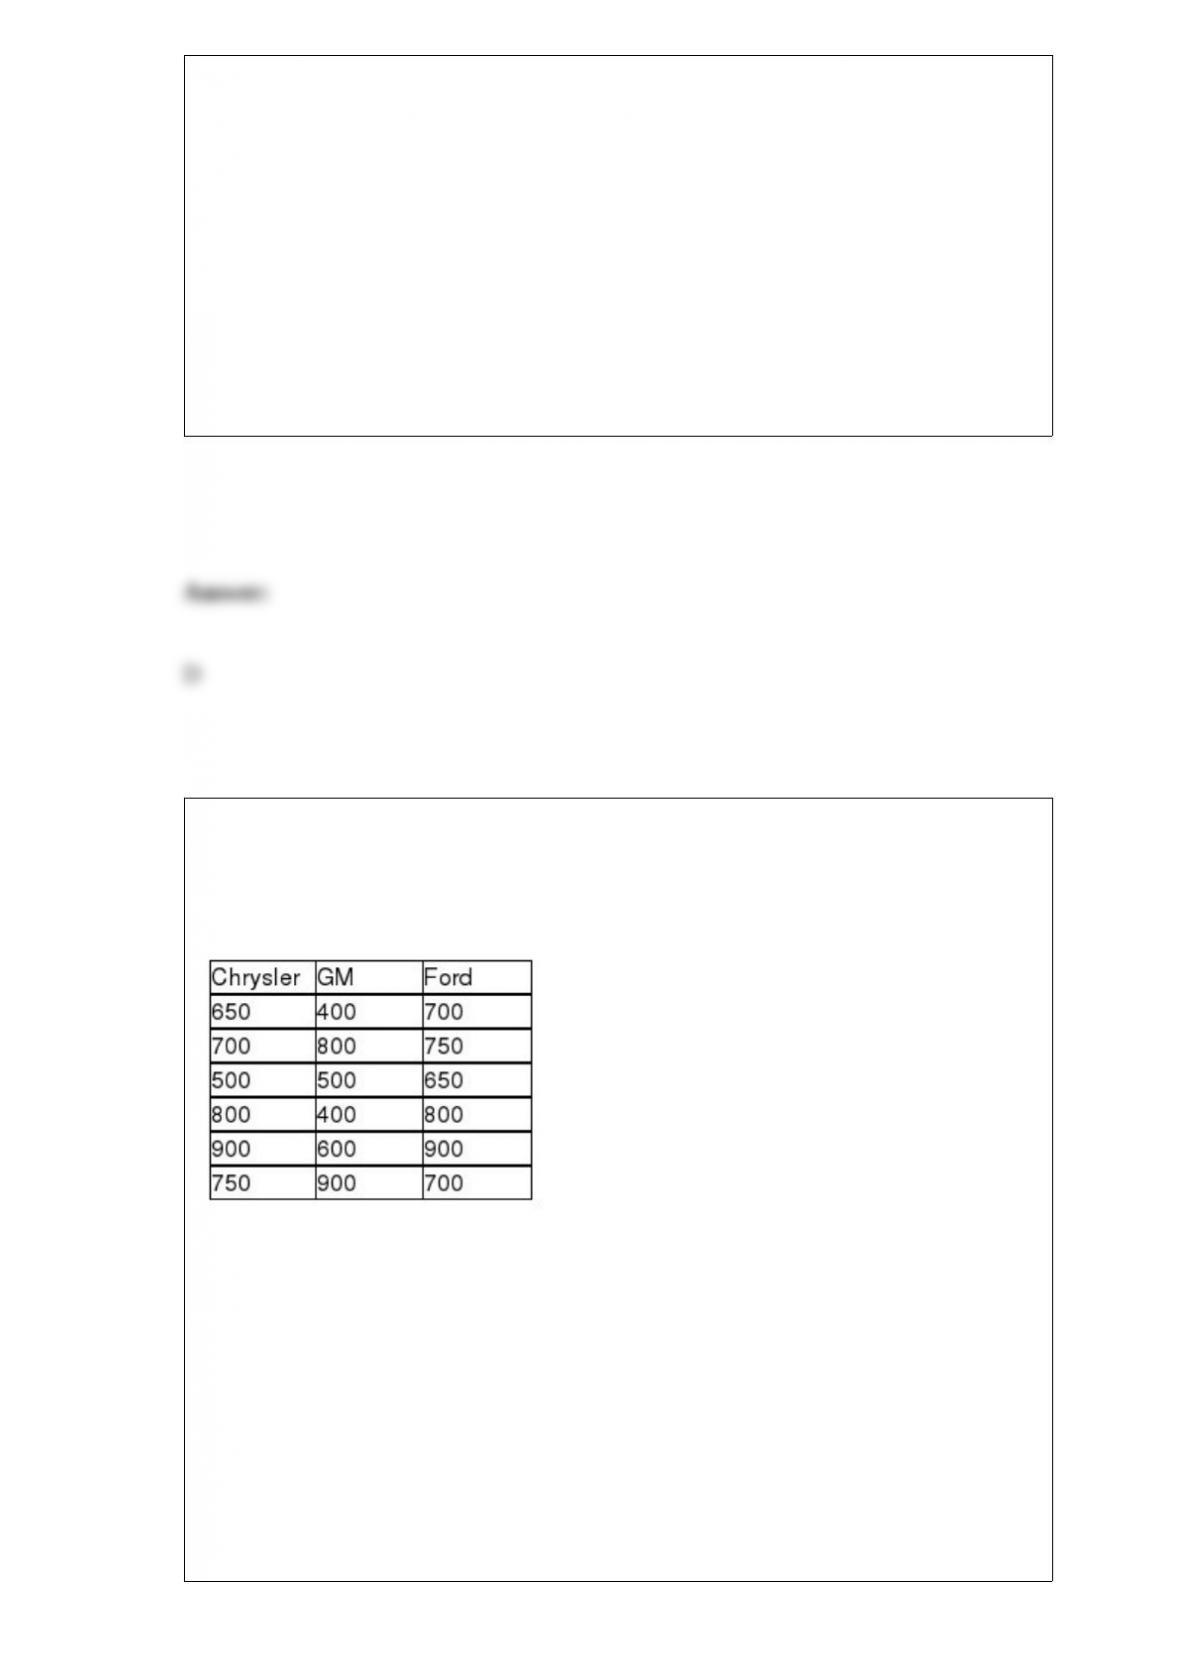
The management of the Seaside Golf Club regularly monitors the golfers on its course
for speed of play. Suppose a random sample of golfers was taken in 2011 and another
random sample of golfers was selected in 2006. The results of the two samples are as
follows:
Based on the sample results, can the management of the Seaside Golf Club conclude
that average speed of play was different in 2012 than in 2011? Conduct the appropriate
hypothesis test at the 0.10 level of significance. Assume that the management of the
club is willing to accept the assumption that the populations of playing times for each
year are approximately normally distributed with equal variances.
A) Because the calculated value of t = -2.03 is less than the lower tail critical value of t
= – 1.6686, reject the null hypothesis. Based on these sample data, at the α = 0.10 level
of significance there is sufficient evidence to conclude that the average speed of play is
different in 2012 than in 2011.
B) Because the calculated value of t = 1.84 is greater than the upper tail critical value of
t = 1.6686, reject the null hypothesis. Based on these sample data, at the α = 0.10 level
of significance there is sufficient evidence to conclude that the average speed of play is
different in 2012 than in 2011.
C) Because the calculated value of t = 0.89 is neither less than the lower tail critical
value of t = – 1.6686, nor greater than the upper tail critical value of t = 1.6686, do not
reject the null hypothesis. Based on these sample data, at the α = 0.10 level of
significance there is not sufficient evidence to conclude that the average speed of play is
different in 2012 than in 2011.
D) Because the calculated value of t = 1.17 is neither less than the lower tail critical
value of t = – 1.6686, nor greater than the upper tail critical value of t = 1.6686, do not
reject the null hypothesis. Based on these sample data, at the α = 0.10 level of
significance there is not sufficient evidence to conclude that the average speed of play is
different in 2012 than in 2011.
A survey was recently conducted in which random samples of car owners of Chrysler,
GM, and Ford cars were surveyed to determine their satisfaction. Each owner was
asked to rate overall satisfaction on a scale of 1 (poor) to 1000 (excellent). The
following data were recorded:
If the analysts are not willing to assume that the population ratings are normally
distributed and will use the Kruskal-Wallis test to determine if the three companies have
different median ratings, which company has the smallest sum of ranks?
A) Chrysler
B) GM
C) Ford
D) All three are equal.

The makers of Sweet-Things candy sell their candy by the box. Based on company
policy, the mean target weight of all boxes is 2.0 pounds. To make sure that they are not
putting too much in the boxes, the manager wants no more than 3 percent of all boxes
to contain more than 2.10 pounds of candy. In order to do this, what should the mean
fill weight be set to if the fill standard deviation is 0.13 pounds? Assume that the box
weights are normally distributed.
A) Just over 2 pounds
B) Approximately 2.33 pounds
C) Nearly 1.27 pounds
D) Approximately 1.86 pounds
The Anderson Lumber Company has three sawmills that produce boards of different
lengths. The following table is a joint frequency distribution based on a random sample
of 1,000 boards selected from the lumber inventory.
Based on these data, if a board is selected that is 12 feet long, the probability that it was
made at sawmill A is:
A) 0.08

B) 0.41
C) 0.24
D) 0.20
For a standardized normal distribution, determine a value, say z0, so that P(z ≤ z0) =
0.01.
A) -2.33
B) -1.96
C) 2.33
D) 1.96
Which of the following statements is true with respect to the confidence level
associated with an estimation application?
A) The confidence level is a percentage value between 50 and 100 that corresponds to
the percentage of all possible confidence intervals, based on a given sample size, that
will contain the true population value.
B) The probability that the confidence interval estimate will contain the true population
value.
C) The degree of accuracy associated with the confidence interval estimate.
D) None of the above
A multiple regression is shown below for a data set of yachts where the dependent
variable is the price of the boat in thousands of dollars.
Given this information, what percentage of variation in the dependent variable is
explained by the regression model?
A) Approximately 68 percent
B) About 83 percent
C) About 37 percent
D) About 60 percent

The number of visible defects on a product container is thought to be Poisson
distributed with a mean equal to 3.5. Based on this, how many defects should be
expected if 3 containers are inspected?
A) 10.5
B) Approximately 3.24
C) Between 4 and 7
D) 3.5
A local FedEx/Kinkos has three black-and-white copy machines and two color copiers.
Based on historical data, the chances that each black-and-white copier will be down for
repairs is 0.10. The color copiers are more of a problem and are down 20% of the time
each.
If a customer wants both a color copy and a black-and-white copy, what is the
probability that the necessary machines will be available? (Assume that the color copier
can also be used to make a black-and-white copy if needed.)
A) 0.04
B) 0.96
C) 0.47
D) 0.42

A consumer group plans to test whether a new passenger car that is advertised to have a
mean highway miles per gallon of at least 33 actually meets this level. They plan to test
the hypothesis using a significance level of 0.05 and a sample size of n = 100 cars. It is
believed that the population standard deviation is 3 mpg. Based upon this information,
what is the critical value in terms of miles per gallon that would be needed prior to
finding beta?
A) 32.5065
B) 33.4935
C) 33.588
D) 32.412
An advertising company has developed a new ad for one of the national car
manufacturing companies. The ad agency is interested in testing whether the proportion
of favorable response to the ad is the same between male adults versus female adults. It
plans on conducting the test using an alpha level equal to 0.05. A sample of 100 adults
of each gender will be used in the study. Each person will be asked to view the ad and
indicate whether they find the ad to be “pleasing” or not. Given this information, what
is the critical value?
A) z = 1.645
B) t = 1.96
C) z = 1.96
D) Can’t be determined without knowing the results of the sample.

Frequency distributions are specifically for analyzing discrete data.
At issue is the proportion of people in a particular county who do not have health care
insurance coverage. A simple random sample of 240 people was asked if they have
insurance coverage, and 66 replied that they did not have coverage. Based on these
sample data, determine the 95% confidence interval estimate for the population
proportion.
A) (0.239, 0.321)
B) (0.259, 0.301)
C) (0.224, 0.336)
D) (0.268, 0.292)
A major retail clothing store is interested in estimating the difference in mean monthly
purchases by customers who use the store’s in-house credit card versus using a Visa,

Mastercard, or one of the other major credit cards. To do this, it has randomly selected a
sample of customers who have made one or more purchases with each of the types of
credit cards. The following represents the results of the sampling:
Based on these sample data, what is the lower limit for the 95 percent confidence
interval estimate for the difference between population means?
A) About $5.28
B) Approximately $4.85
C) Approximately $2.54
D) Approximately $3.41
In a survey, respondents were asked to indicate their favorite brand of cereal (Post or
Kellogg’s). They were allowed only one choice. What is the probability concept that
implies it is not possible for a single respondent to state both Post and Kellogg’s to be
the favorite cereal?
A) Concept of independent events
B) Concept of mutually exclusive events
C) Concept of dependent events
D) Concept of mutually inclusive events
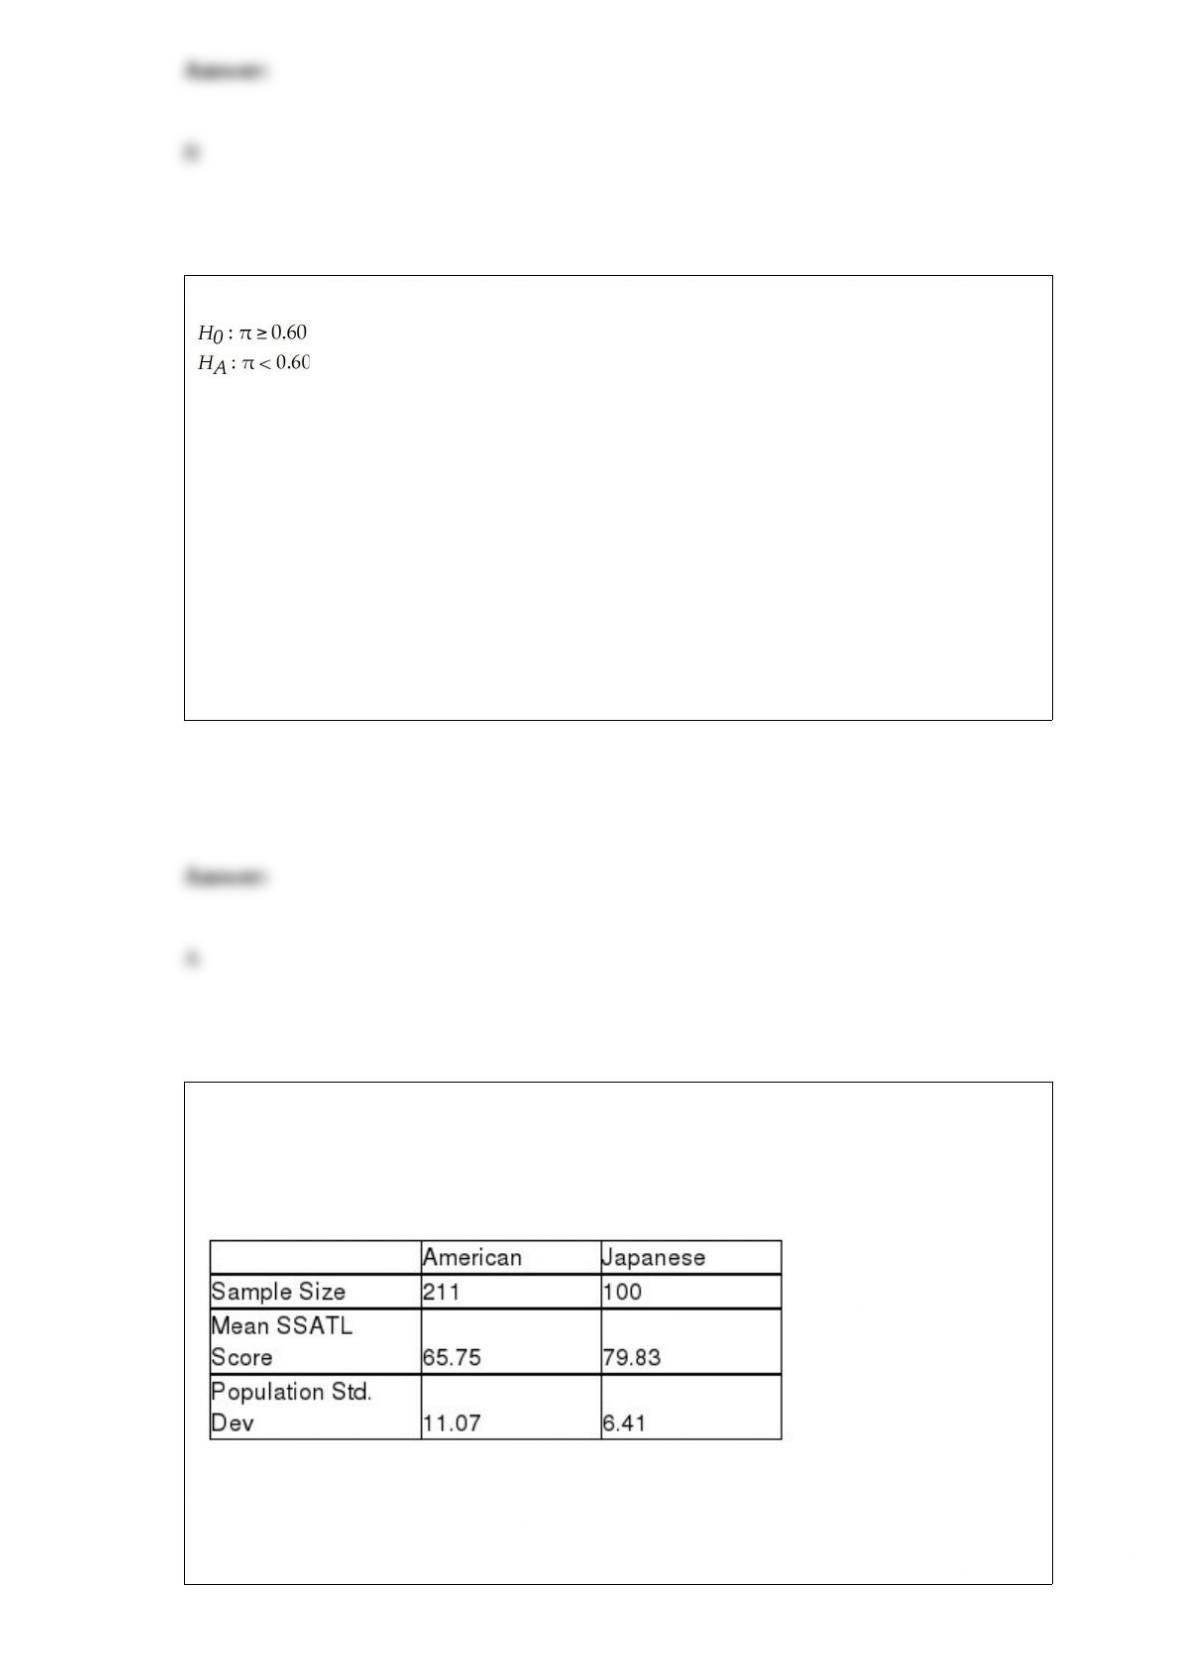
Given the following null and alternative
Test the hypothesis using α = 0.01 assuming that a sample of n = 200 yielded x = 105
items with the desired attribute.
A) Since -2.17 > -2.33, the null hypothesis is not rejected.
B) Since -1.86 > -1.02, the null hypothesis is not rejected.
C) Since -2.17 > -2.33, the null hypothesis is rejected.
D) Since -1.86 > -1.02, the null hypothesis is rejected.
A recent study posed the question about whether Japanese managers are more
motivated than American managers. A randomly selected sample of each was
administered the Sarnoff Survey of Attitudes Toward Life (SSATL), which measures
motivation for upward mobility. The SSATL scores are summarized below.
Which of the following is the correct the null and alternative hypotheses to determine if
the average SSATL score of Japanese managers differs from the average SSATL score
of American managers?

A) H0 : μA – μJ ≥ 0 versus H1 : μA – μJ < 0
B) H0 : μA – μJ ≤ 0 versus H1 : μA – μJ > 0
C) H0 : μA – μJ = 0 versus H1 : μA – μJ ≠ 0
D) H0 : A – J = 0 versus H1 : A – J ≠ 0
The transportation manager for the State of New Jersey has determined that the time
between arrivals at a toll booth on the state’s turnpike is exponentially distributed with λ
= 4 cars per minute. Based on this information, the standard deviation for the time
between arrivals is:
A) 25 seconds.
B) 3.87 seconds.
C) 15 seconds.
D) 2 minutes.
A large orchard owner in the state of Washington is interested in determining whether
the mean number of bushels of peaches per acre is the same or different depending on
the type of tree that is used. He also thinks that production may be affected by the type
of fertilizer that is used. To test, he has set up a test in which a one-acre plot of peach
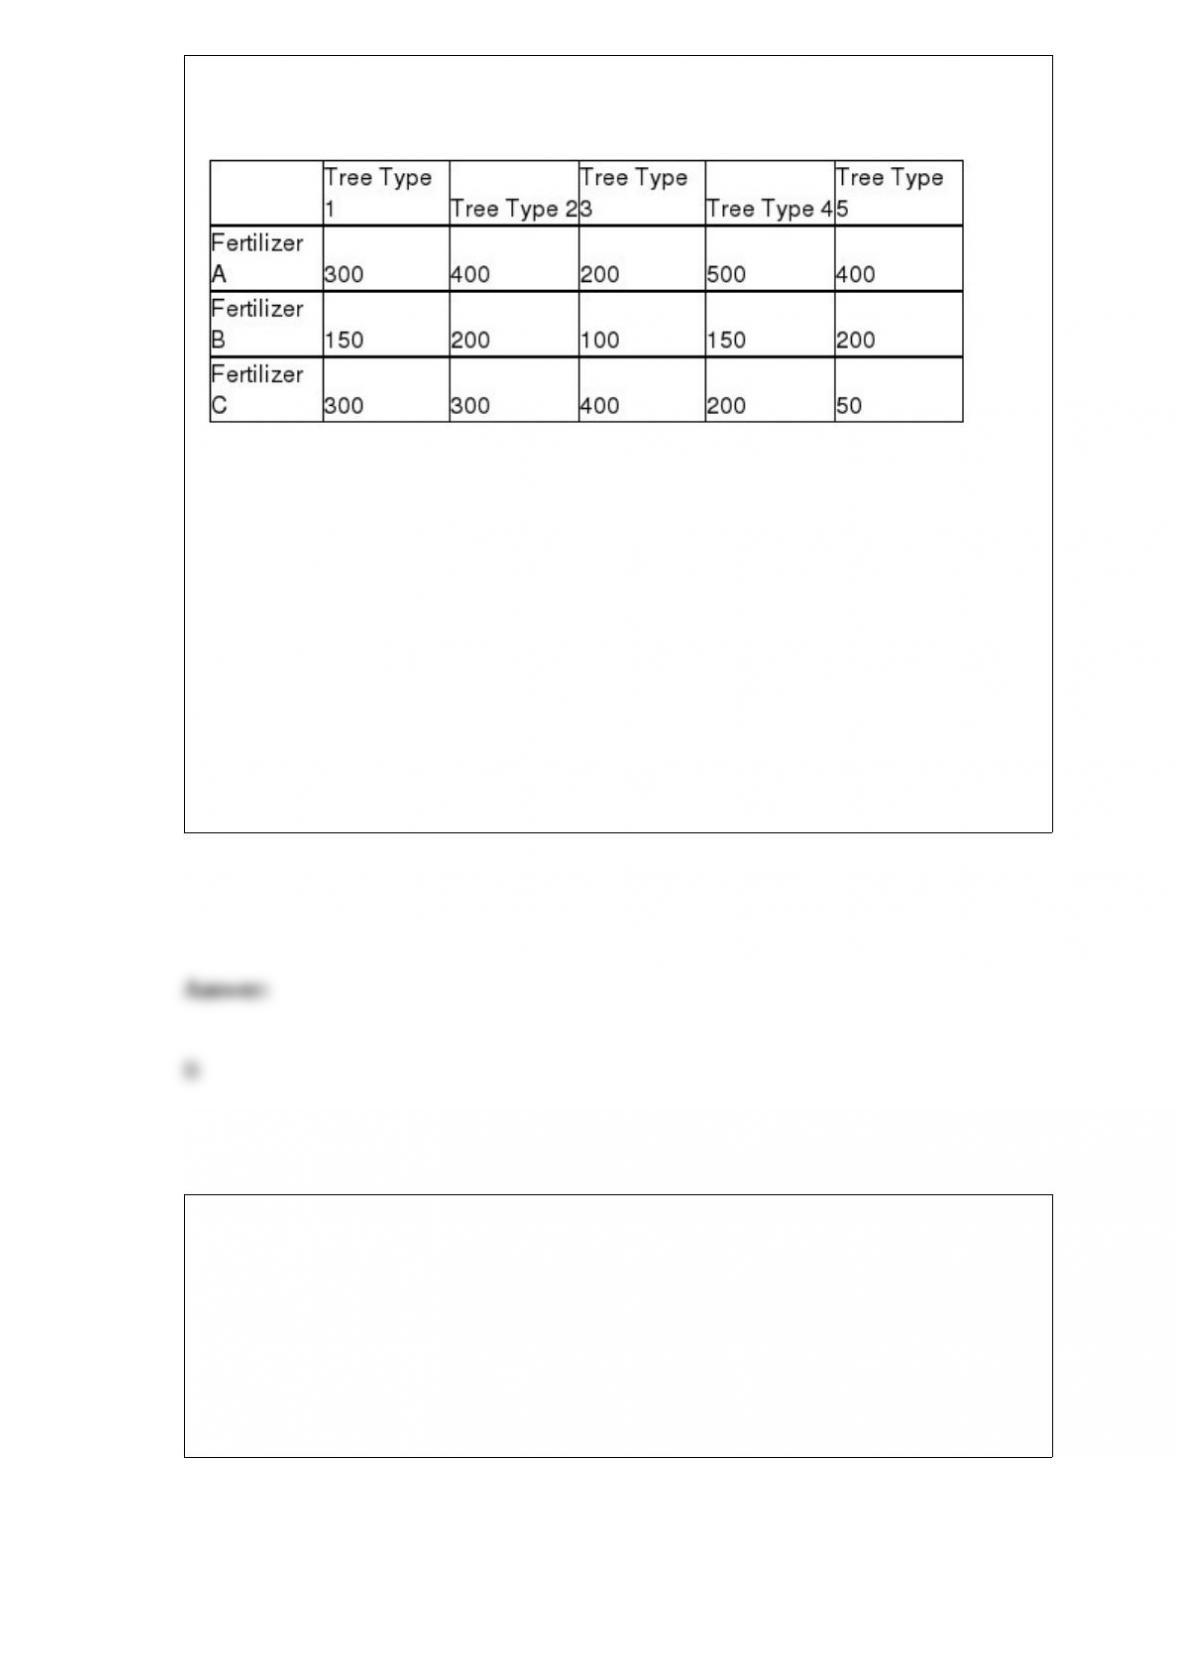
trees with a combination each of 5 varieties and 3 fertilizer types are studied. The
following data reflect the number of bushels of peaches on each acre plot.
Assuming that the hypothesis tests will be conducted using an alpha equal 0.05 level,
which of the following is true?
A) The total sum of squares is approximately 4,570,900.
B) The grower was justified in controlling for the fertilizer type since the test shows
that blocking was effective.
C) Based on the data, the grower can conclude that there is a difference in mean
production of peaches across the different types of tree.
D) A, B and C are all true.
A credit card company operates two customer service centers: one in Boise and one in
Richmond. Callers to the service centers dial a single number, and a computer program
routs callers to the center having the fewest calls waiting. As part of a customer service
review program, the credit card center would like to determine whether the average
length of a call (not including hold time) is different between the two centers. The
managers of the customer service centers are willing to assume that the populations of
interest are normally distributed with equal variances. Suppose a random sample of
phone calls to the two centers is selected and the following results are reported:

Using the sample results, develop a 90% confidence interval estimate for the difference
between the two population means.
A) -29.3124 ≤ (1 – 2) ≤ -18.6876
B) -24.2412 ≤ (1 – 2) ≤ -17.7588
C) -26.2941 ≤ (1 – 2) ≤ -11.8059
D) -28.5709 ≤ (1 – 2) ≤ -13.4291
A mail-order business prides itself in its ability to fill customers’ orders in six calendar
days or less on the average. Periodically, the operations manager selects a random
sample of customer orders and determines the number of days required to fill the
orders. Based on this sample information, he decides if the desired standard is not being
met. He will assume that the average number of days to fill customers’ orders is six or
less unless the data suggest strongly otherwise. Establish the appropriate null and
alternative hypotheses.
A) H0: μ ≥ 6 days Ha: μ < 6 days
B) H0: μ ≤ 6 days Ha : μ > 6 days
C) H0: μ > 6 days Ha: μ ≤ 6 days
D) H0 : μ < 6 days Ha: μ ≥ 6 days

Which of the following is not among the most common sources of variation?
A) People
B) Materials
C) Methods
D) Quotas
The following regression output is the result of a multiple regression application in
which we are interested in explaining the variation in retail price of personal computers
based on three independent variables, CPU speed, RAM, hard drive capacity,
and-monitor included (1=Yes, 0=No).
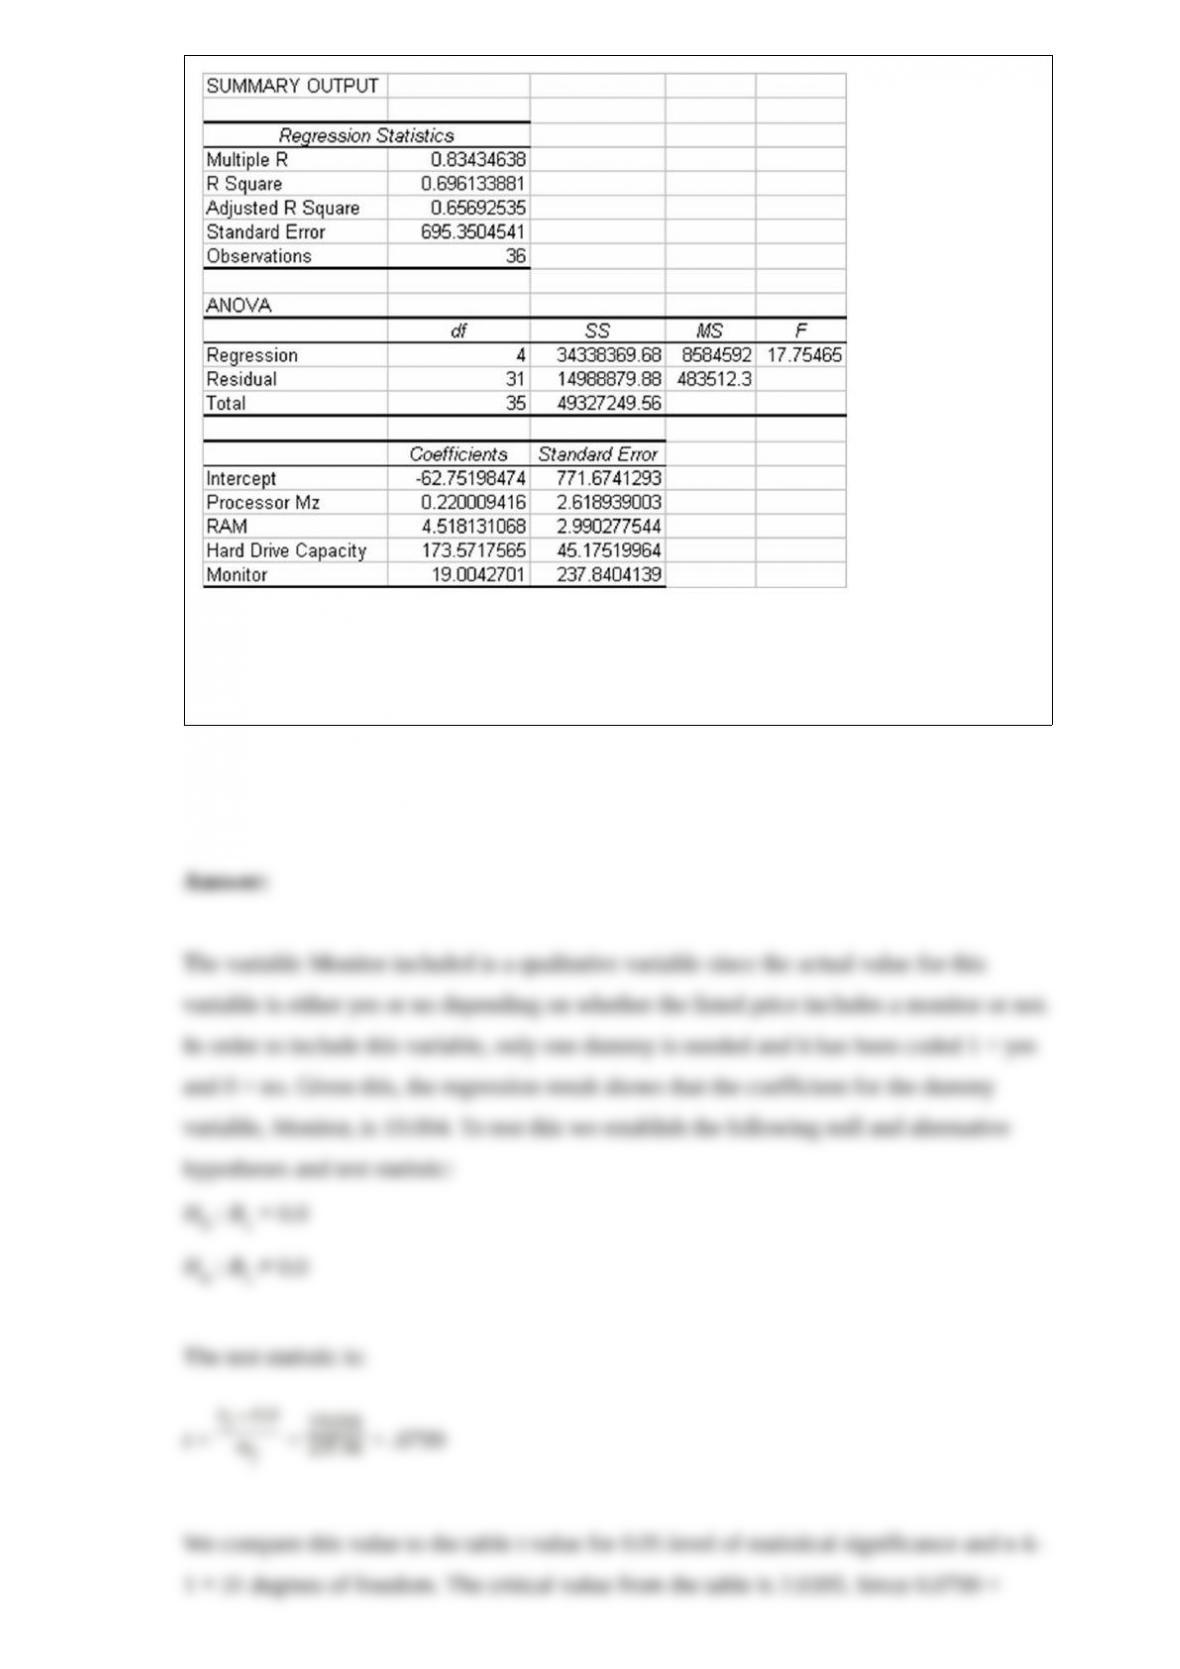
Given this output, what is the variable, Monitor, called? Also, given the other variables
in the model, is Monitor significant in explaining the variation in the dependent
variable? Test using a .05 level of alpha.

The Fitness Center manager has collected data on the number of visits to the club each
week for the past 8 weeks. These data are shown as follows. Which of the following
statements is most correct?
A) A histogram will illustrate whether a linear relationship exists between the number
of visits and the week number.
B) A scatter diagram would be useful for displaying these data.
C) A line chart for these data will show that an upward trend in the number of visits to
the club has occurred over two weeks.
D) None of the above
The Dalton Company has recently made a decision to build a new plant in Denver. In
making this decision it used data supplied by the U.S. Census Bureau. For the Dalton
Company, these data are examples of:
A) primary data.
B) secondary data.
C) reliable data.
D) experimental data.
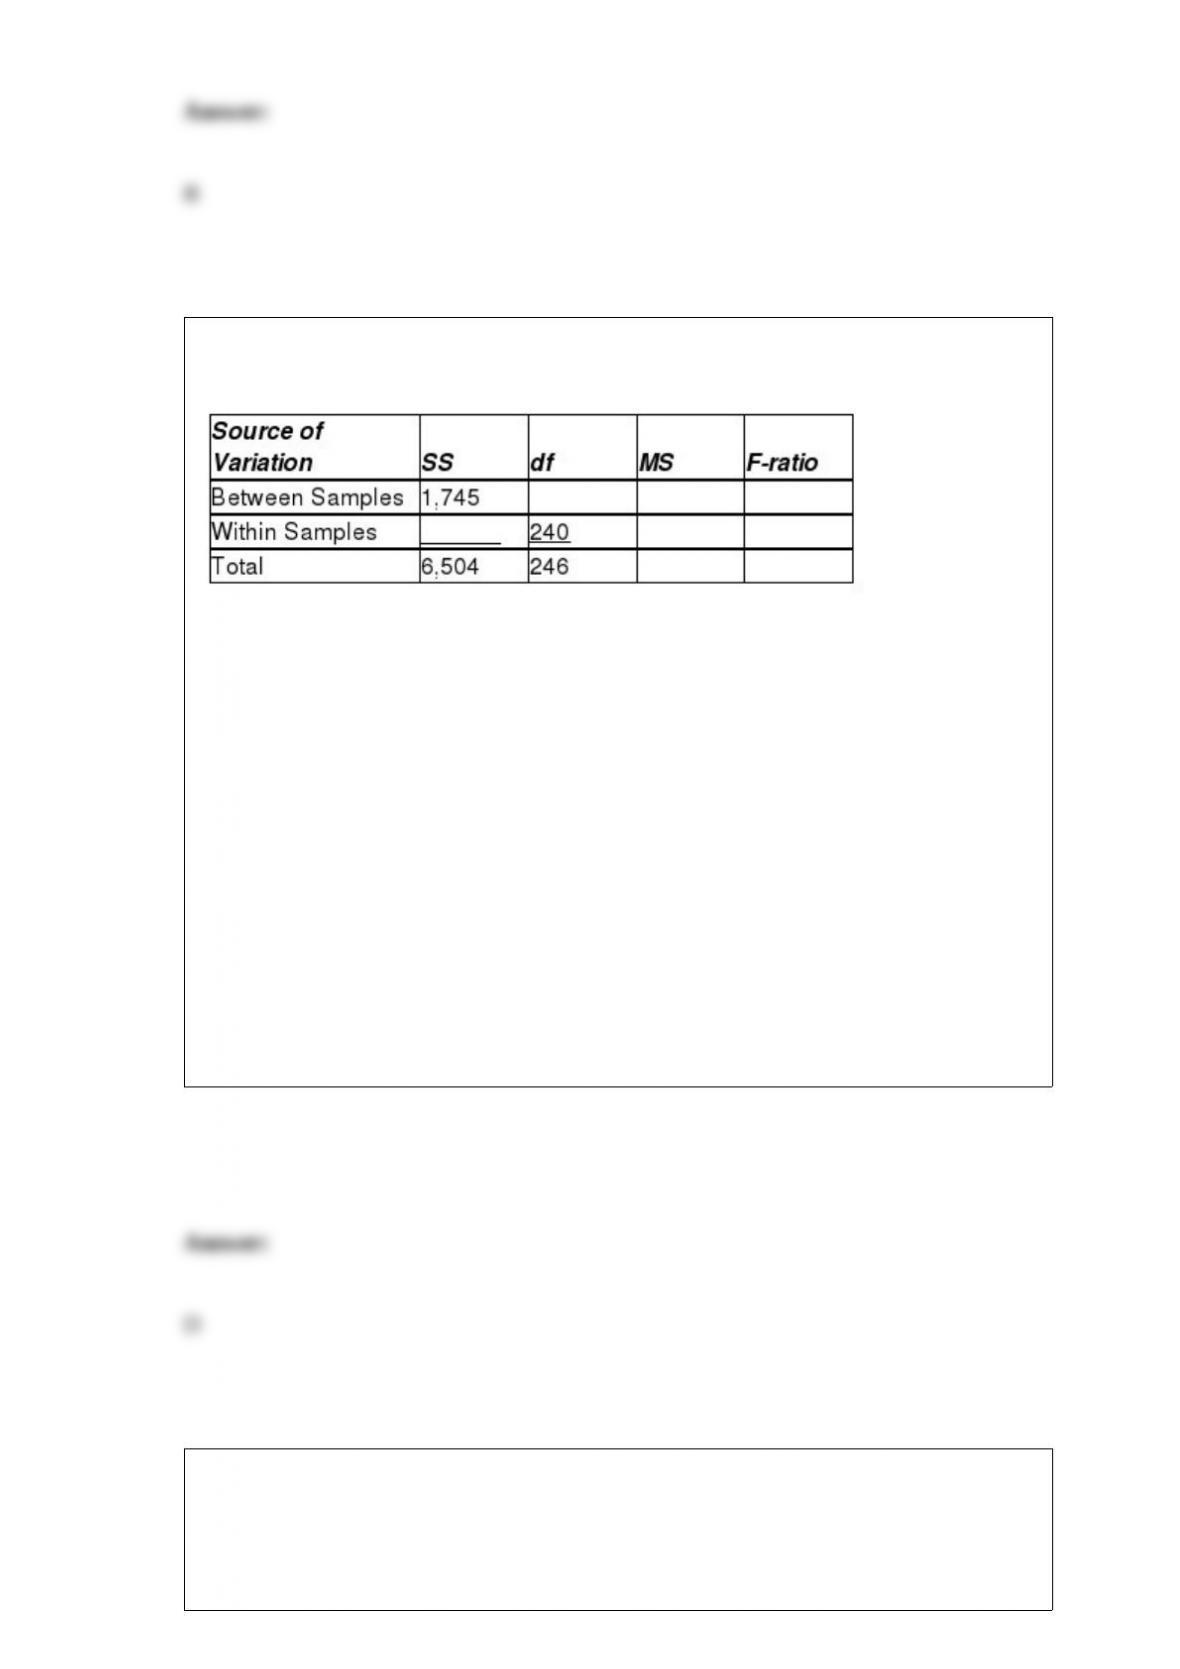
Respond to the following questions using this partially completed one-way ANOVA
table:
Based on the analysis of variance F-test, what conclusion should be reached regarding
the null hypothesis? Test using a significance level of 0.01.
A) Since 7.948 > 2.8778 accept H0 and conclude that all population means are the
same.
B) Since 14.667 > 2.8778 accept H0 and conclude that all population means are the
same.
C) Since 7.948 > 2.8778 reject H0 and conclude that at least two populations means are
different.
D) Since 14.667 > 2.8778 reject H0 and conclude that at least two populations means
are different.
A decision maker wishes to test the following null and alternative hypotheses using an
alpha level equal to 0.05:
H0 : μ1 – μ2 = 0
HA : μ1 – μ2 ≠ 0

The population standard deviations are assumed to be known. After collecting the
sample data, the test statistic is computed to be z = 1.78
Using the test statistic approach, what conclusion should be reached about the null
hypothesis?
A) Because z = 2.40 > 1.96, we reject the null hypothesis.
B) Because z = 2.03 > 1.96, we reject the null hypothesis.
C) Because z = 1.78 < 1.96, we do not reject the null hypothesis.
D) Because z = 1.45 < 1.645, we do not reject the null hypothesis.
A company has determined that the mean number of days it takes to collect on its
accounts receivable is 36 with a standard deviation of 11 days. The company plans to
select a random sample of n = 12 accounts and compute the sample mean. Which of the
following statements holds true in this situation?
A) There is no way to determine what the mean of the sampling distribution is without
knowing the specific shape of the population.
B) The sampling distribution will have the same distribution as the population, provided
that the population is not normally distributed.
C) The sampling error will be larger than if they had sampled n = 64 accounts.
D) The sampling distribution may actually be approximately normally distributed
depending on what the population distribution is.
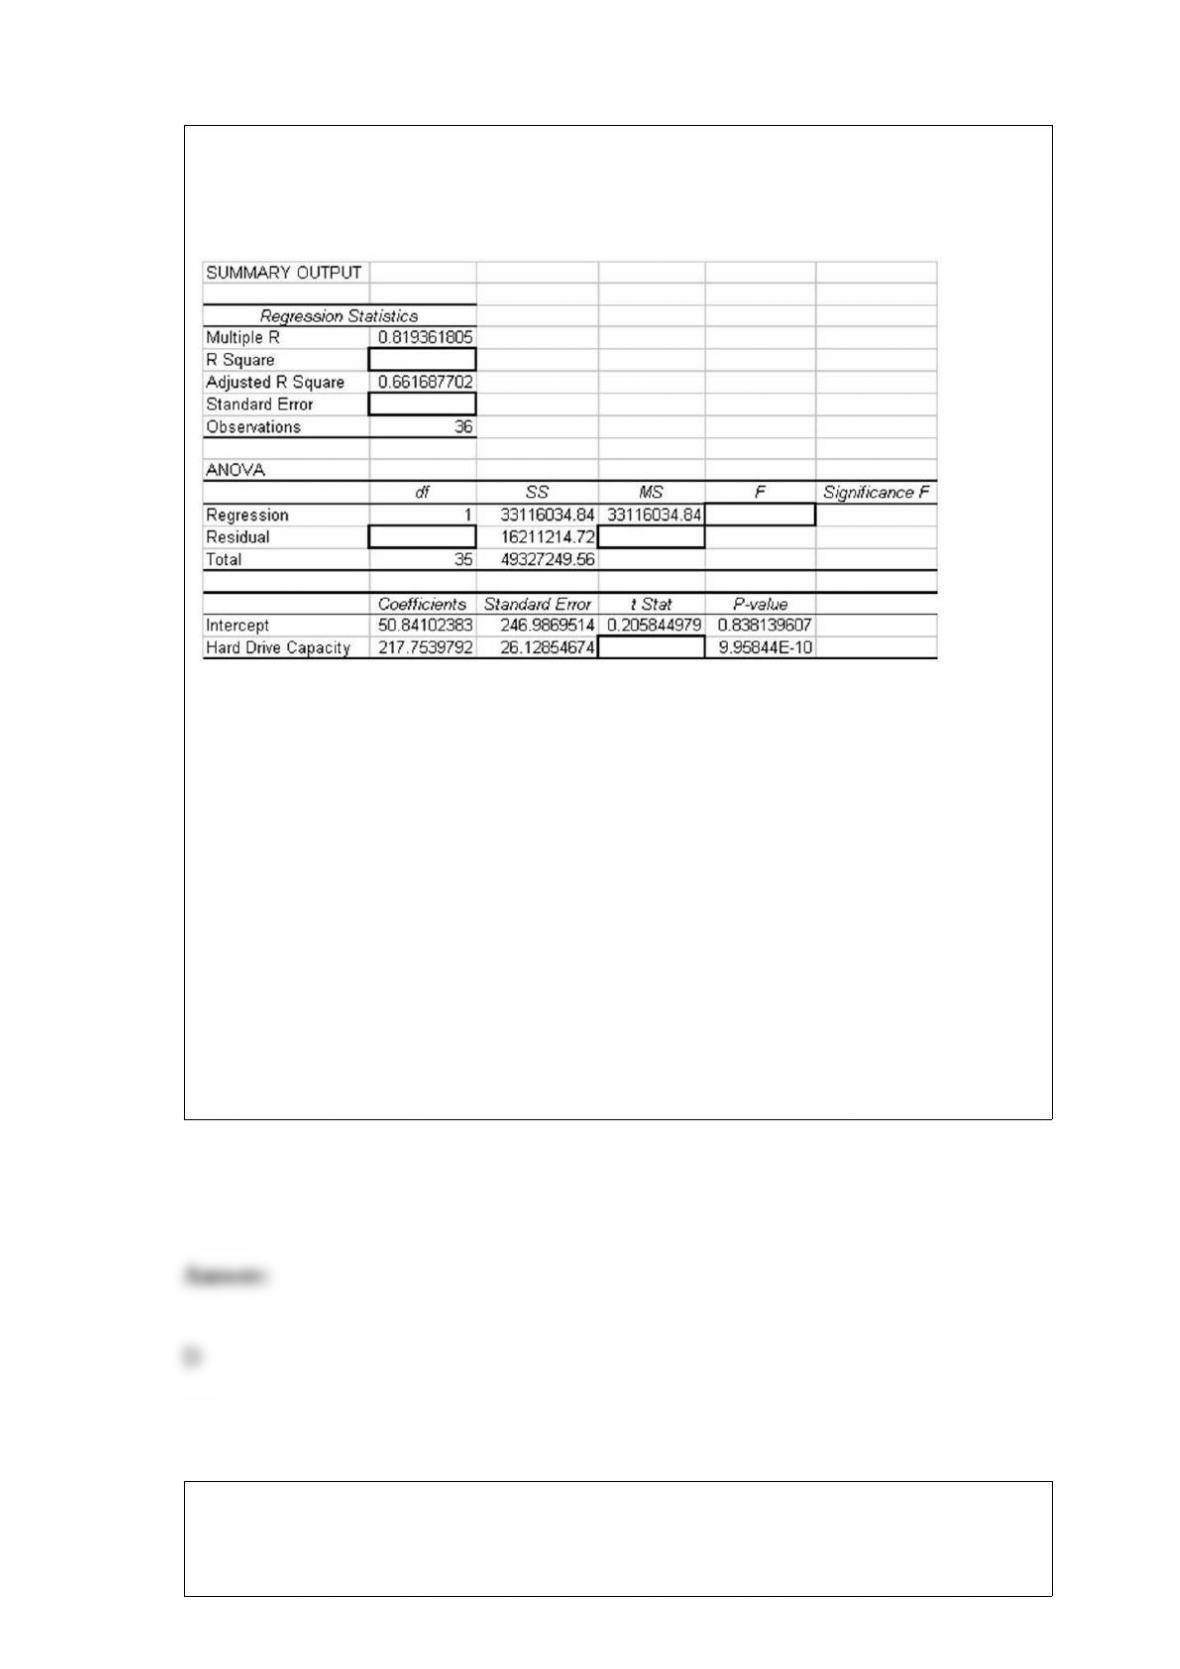
Consider the following partially completed computer printout for a regression analysis
where the dependent variable is the price of a personal computer and the independent
variable is the size of the hard drive.
Based on the information provided, which of the following statements is true if alpha
= .05?
A) The slope is not significantly different from 0 because p-value = 0.84 is greater than
0.05
B) The slope is significantly different from 0 because p-value = 9.95 is greater than
0.05
C) The slope is not significantly different from 0 because p-value = 9.95 is greater than
0.05
D) The slope is significantly different from 0 because p-value = 9.95En – 10 is less than
0.05
The makers of Mini-Oats Cereal have an automated packaging machine that can be set
at any targeted fill level between 12 and 32 ounces. Every box of cereal is not expected
to contain exactly the targeted weight, but the average of all boxes filled should. At the

end of every shift (eight hours), 16 boxes are selected at random and the mean and
standard deviation of the sample are computed. Based on these sample results, the
production control manager determines whether the filling machine needs to be
readjusted or whether it remains all right to operate. At the end of a particular shift
during which the machine was filling 24-ounce boxes of Mini-Oats, the sample mean of
16 boxes was 24.32 ounces, with a standard deviation of 0.70 ounce. Assist the
production control manager in determining if the machine is achieving its targeted
average using test statistic and critical value t. Conduct the test using a p-value.
A) p-value = 0.0872 > 0.025; therefore do not reject H0
B) p-value = 0.0422 > 0.005; therefore do not reject H0
C) p-value = 0.0314 < 0.105; therefore reject H0
D) p-value = 0.0121< 0. 0805; therefore reject H0