

In a two-tailed hypothesis test the area in each tail of the rejection region is equal to α.
If the observed value in a time series for period 3 is yt = 128, and the seasonal index
that applies to period 3 is 1.20, then the deseasonalized value for period 3 is 153.6
Based on the empirical rule we can expect about 95 percent of the values in bell-shaped
distributions to be within one standard deviation of the mean.
The logic behind the chi-square goodness-of-fit test is based on determining how far the
actual observed frequencies are from the expected frequencies.
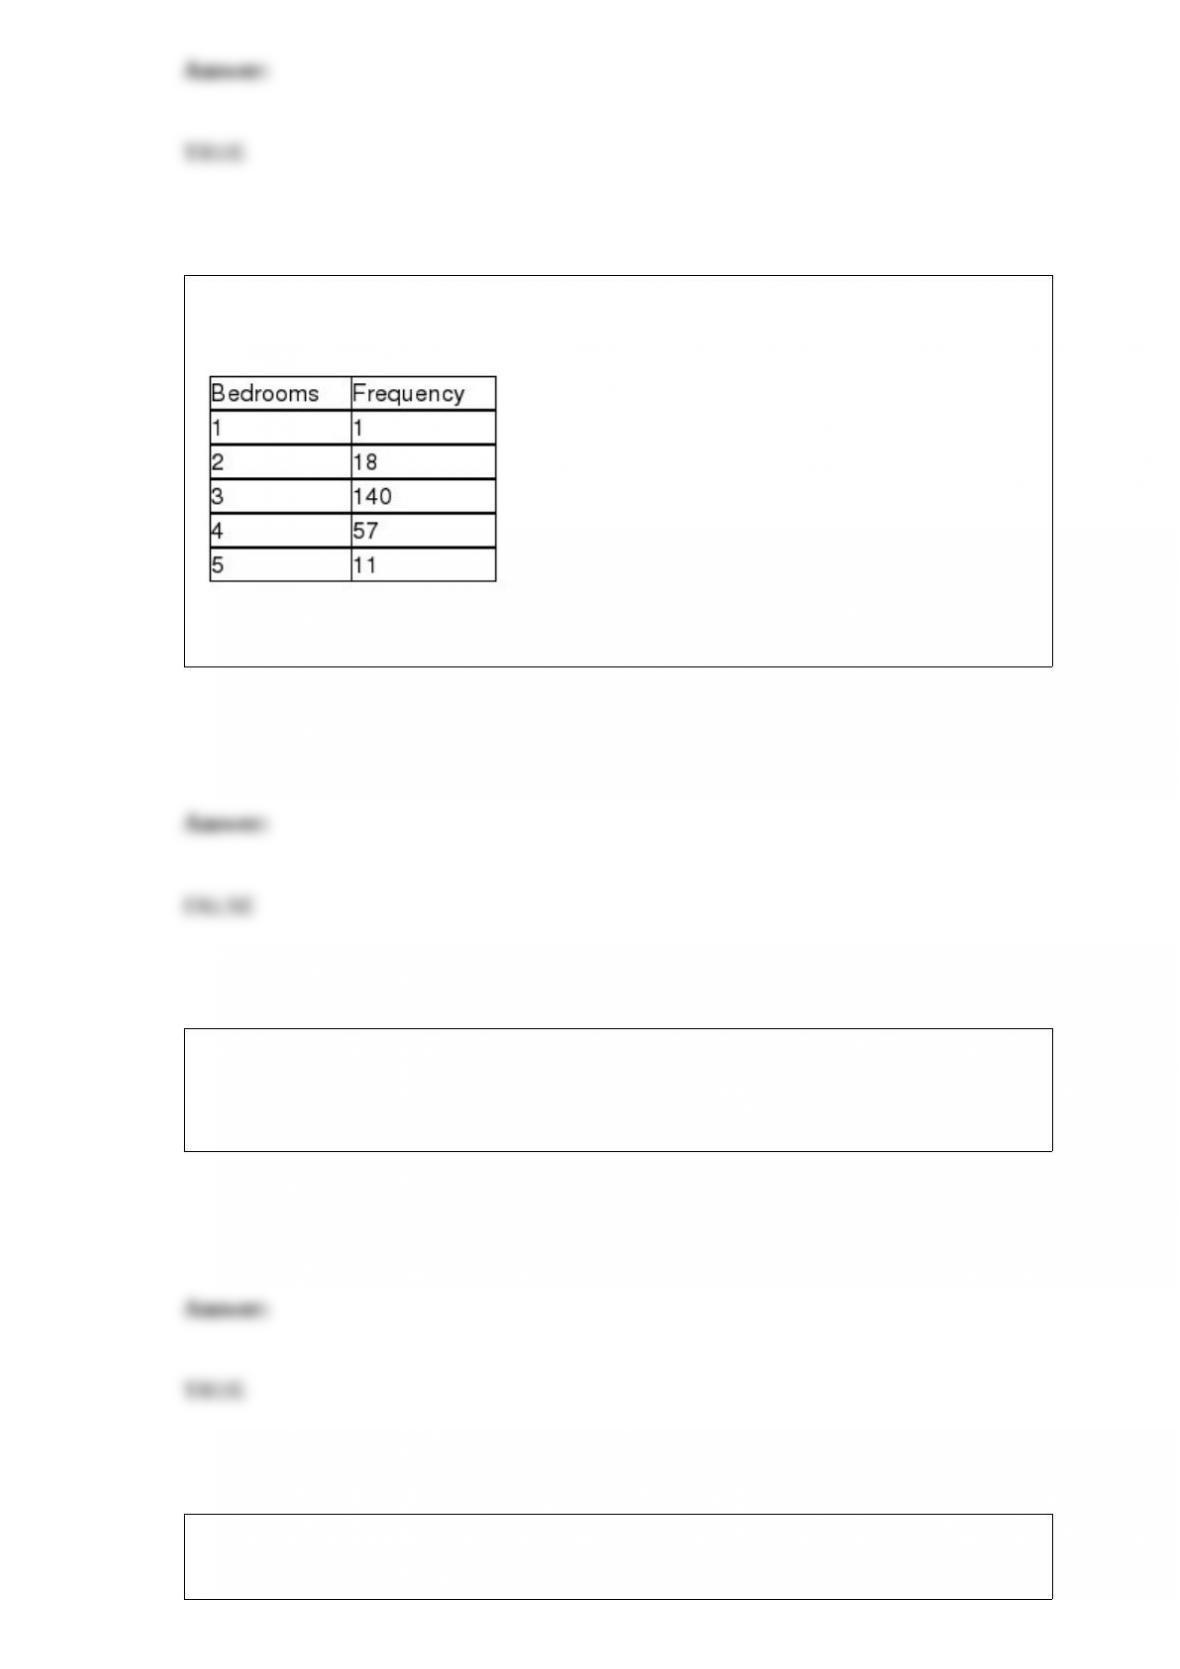
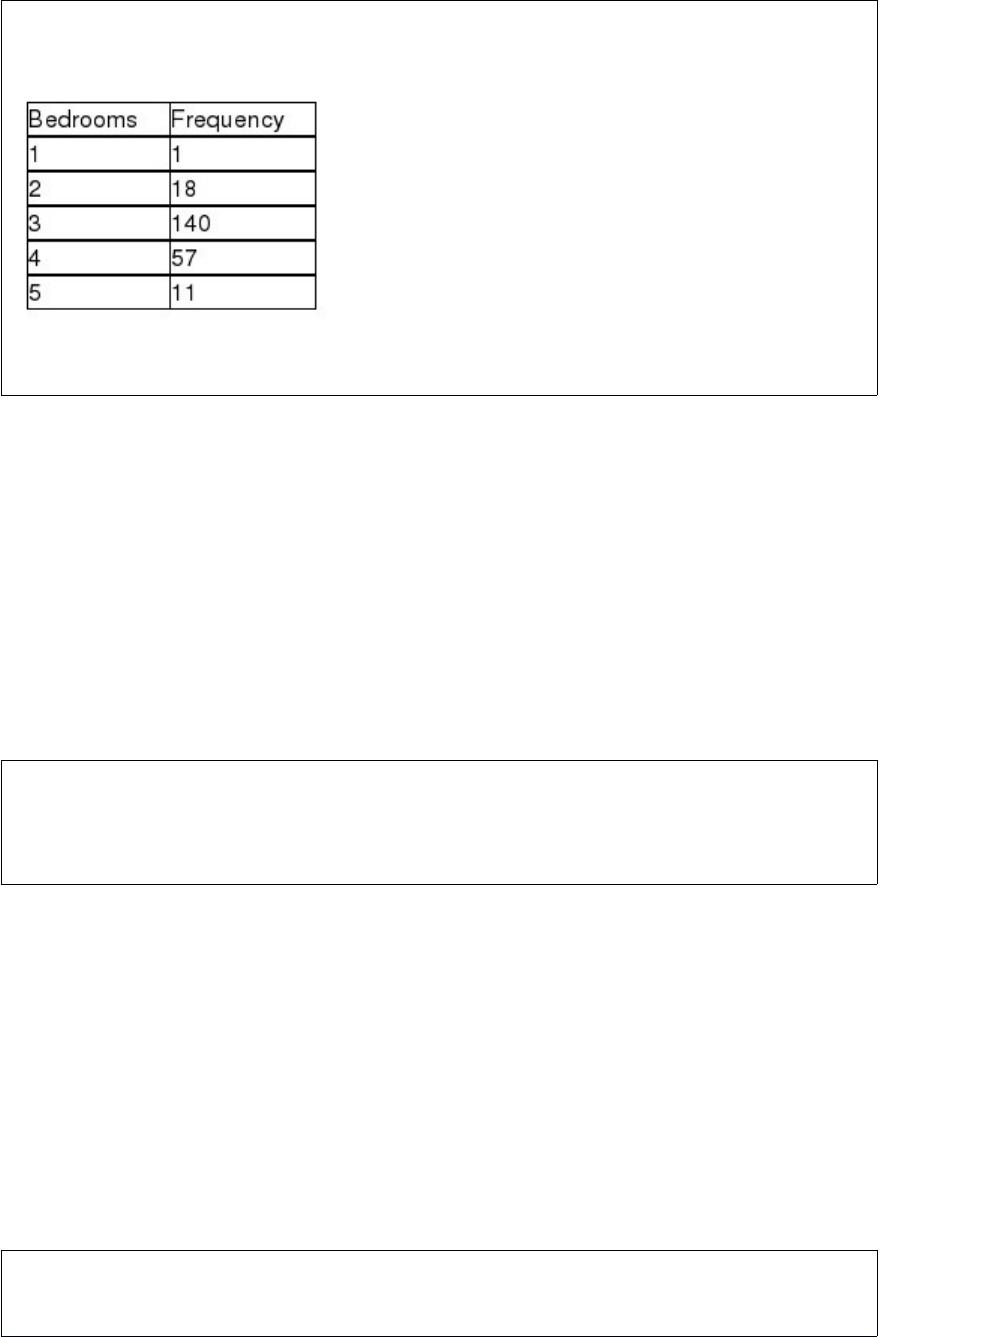
Suppose a study of houses that have sold recently in your community showed the
following frequency distribution for the number of bedrooms:
Based on this information, the median number of bedrooms in houses sold is 3.20.
A large tire manufacturing company has claimed that its top line tire will average more
than 80,000 miles. If a consumer group wished to test this claim, the research
hypothesis would be: Ha : μ > 80,000 miles.
Watersports Rental at Flathead Lake rents jet skis and power boats for day use. Each
piece of equipment has a clock that records the time that it was actually in use while


rented. The company has observed over time that the distribution of time used is
normally distributed with a mean of 3.6 hours and a standard deviation equal to 1.2
hours. Watersports management has decided to give a rebate to customers who use the
equipment for less than 2.0 hours. Based on this information, the probability that a
customer will get the rebate is 0.4082.
In a multiple regression model, each regression slope coefficient measures the average
change in the dependent variable for a one-unit change in the independent variable, all
other variables held constant.
A stable process is typically defined as one in which all output is operating within 3
standard deviations of the process center.
A study recently conducted by a marketing firm analyzed three different advertising
designs and four different income levels of potential customers. At each combination of


factor A and factor B, 5 customers are observed and the number of products produced
are recorded. The total number of degrees of freedom associated with this two-factor
ANOVA design is 59.
The method used in regression analysis for incorporating a categorical variable into the
model is by organizing the categorical variable into one or more dummy variables.
If after graphing the data for a quantitative variable of interest, you notice that the
distribution is highly skewed in the positive direction, the measure of central location
that would likely provide the best assessment of the center would be the median.
The significance level in a hypothesis test corresponds to the maximum probability that
a Type I error will be committed.


A survey conducted by a local real estate agency asked respondents to indicate whether
they preferred natural gas, electric, or oil furnaces for heating their home. The data
collected for this variable would be of ordinal level.
In order to identify a cyclical component in time-series data, one year of weekly data
should be sufficient.
Bill Price is a sales rep in northern California representing a line of athletic socks. Each
day, he makes 10 sales calls. The chance of making a sale on each call is thought to be
0.30. The probability that he will make exactly two sales is approximately 0.2335.


A one-tailed hypothesis for a population mean with a significance level equal to .05 will
have a critical value equal to z = .45.
In simple linear regression analysis, the regression model forms a straight line in
two-dimensional space through the x,y data points, while a multiple regression model
forms a plane through multidimensional space.
A high coefficient of determination (R2) implies that the regression model will be a
good predictor for future values of the dependent variable given the value of the
independent variable.
It is correct to say that subjective probability assessments are neither right nor wrong,


but are merely reflections of the state of mind of the individual making the probability
assessment.
An annual time series cannot exhibit a seasonal component.
In a forward stepwise regression process, it is actually possible for the R-square value
to decline if variables are added to the regression model that do not help to explain the
variation in the dependent variable.
If the mean age for all students that attend your university is 24.78 years, it would be
reasonable to expect that the mean of a sample of students selected from that population
would also equal 24.78 years as long at the sampling is done using sound statistical
methods.

Prior to conducting double exponential smoothing a simple linear regression is
conducted and the trend equation is = 42 + 38.3t, so the smoothed constant process
value should be C0 = 38.3 and the smoothed trend value should be T0 = 42.
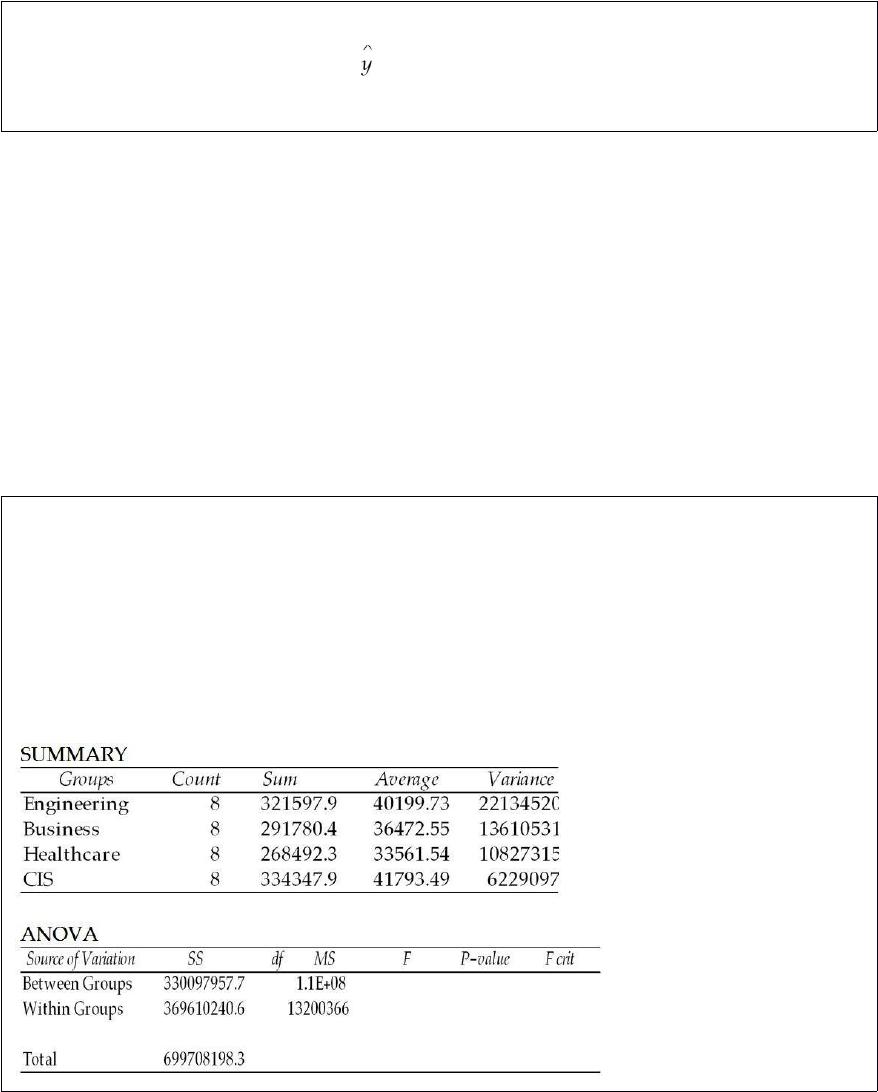
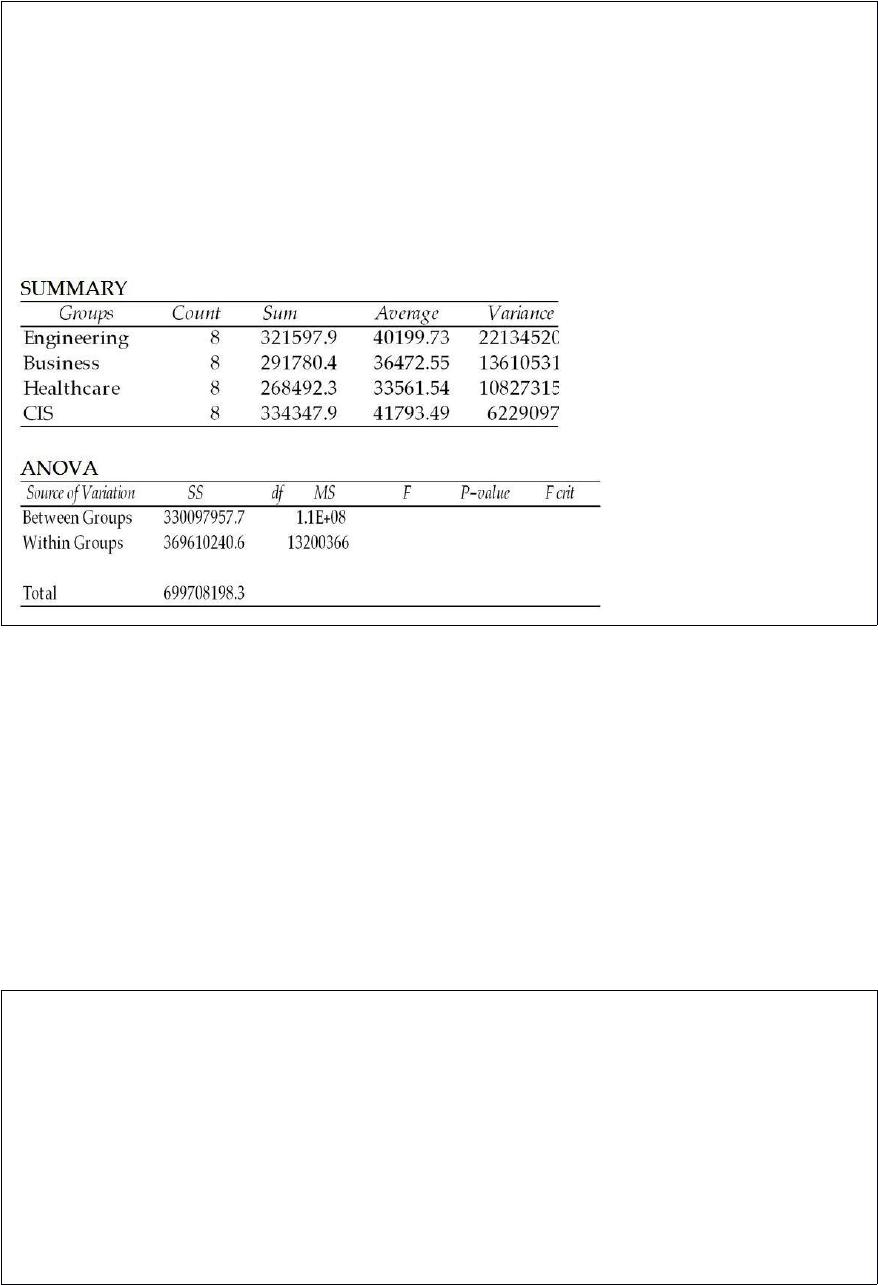
A study was recently conducted to see whether the mean starting salaries for graduates
of engineering, business, healthcare, and computer information systems majors differ. A
random sample of 8 graduates was selected from each major. The following shows the
results of the ANOVA computations. However, the degrees of freedom column has been
omitted. The correct number of degrees of freedom for the within variation is 28.
ANOVA: Single Factor

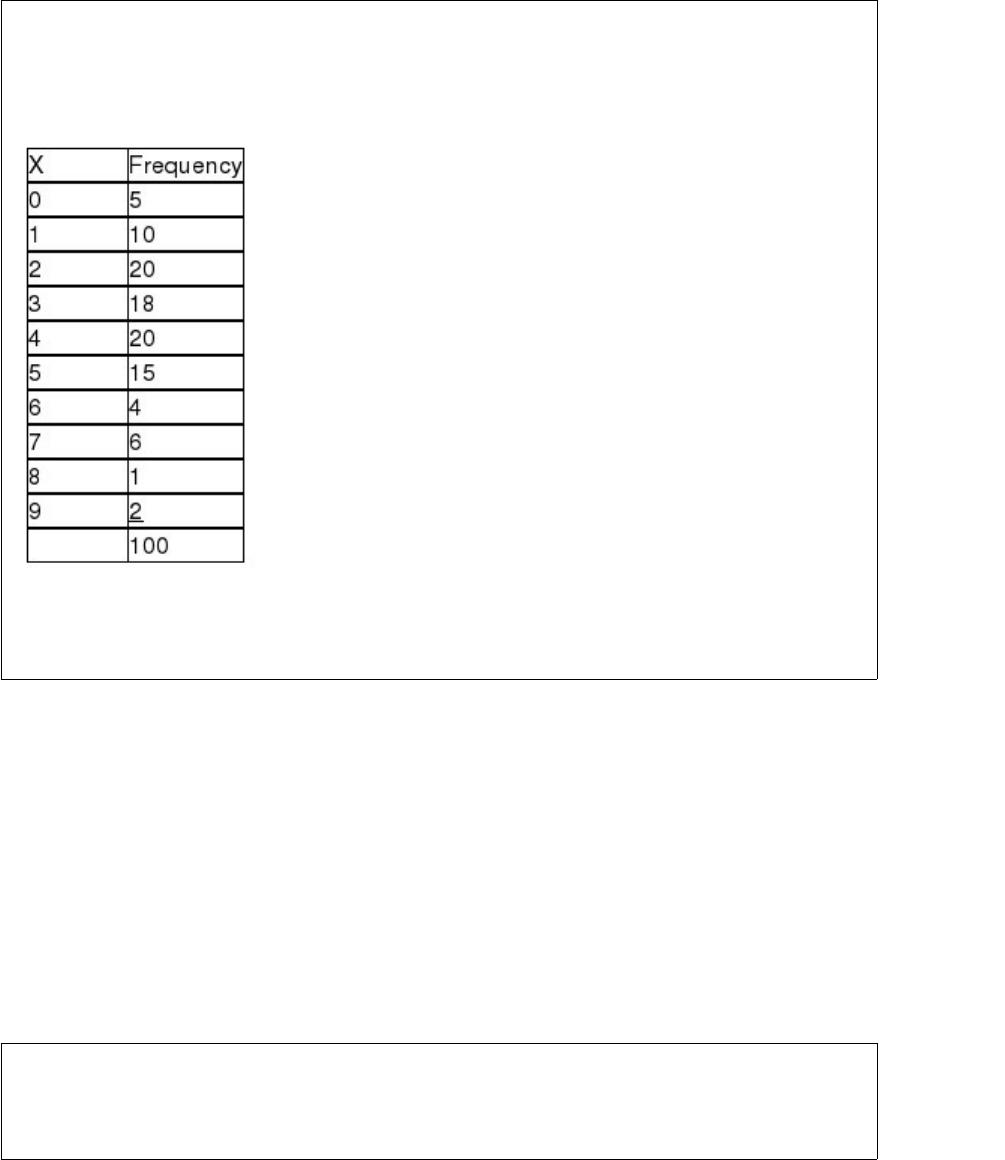
It is believed that the number of drivers who are ticketed for speeding on a particular
stretch of highway is a Poisson distribution with a mean of 3.5 per hour. A random
sample of 100 hours is selected with the following results:
Given this information, it can be seen that the cells will need to be combined since the
actual number of occurrences at some levels of x is less than 5.
If we are interested in estimating the population mean based on a sample from a
population for which we know neither the mean nor the standard deviation, the critical
value will be a t value from the t-distribution.


If you suspect that a nonlinear trend exists in your data, one way to deal with it in a
trend-based forecasting application is to transform the independent variable, for
example by squaring the time measure or maybe taking the square-root of the time
measure.
The Mann-Whitney U test is a nonparametric test that is used to test whether two
related populations have the same median.
The following output is for a second-order polynomial regression model where the
independent variables are x and x2 (x^2 in output). Some of the output has been
omitted.
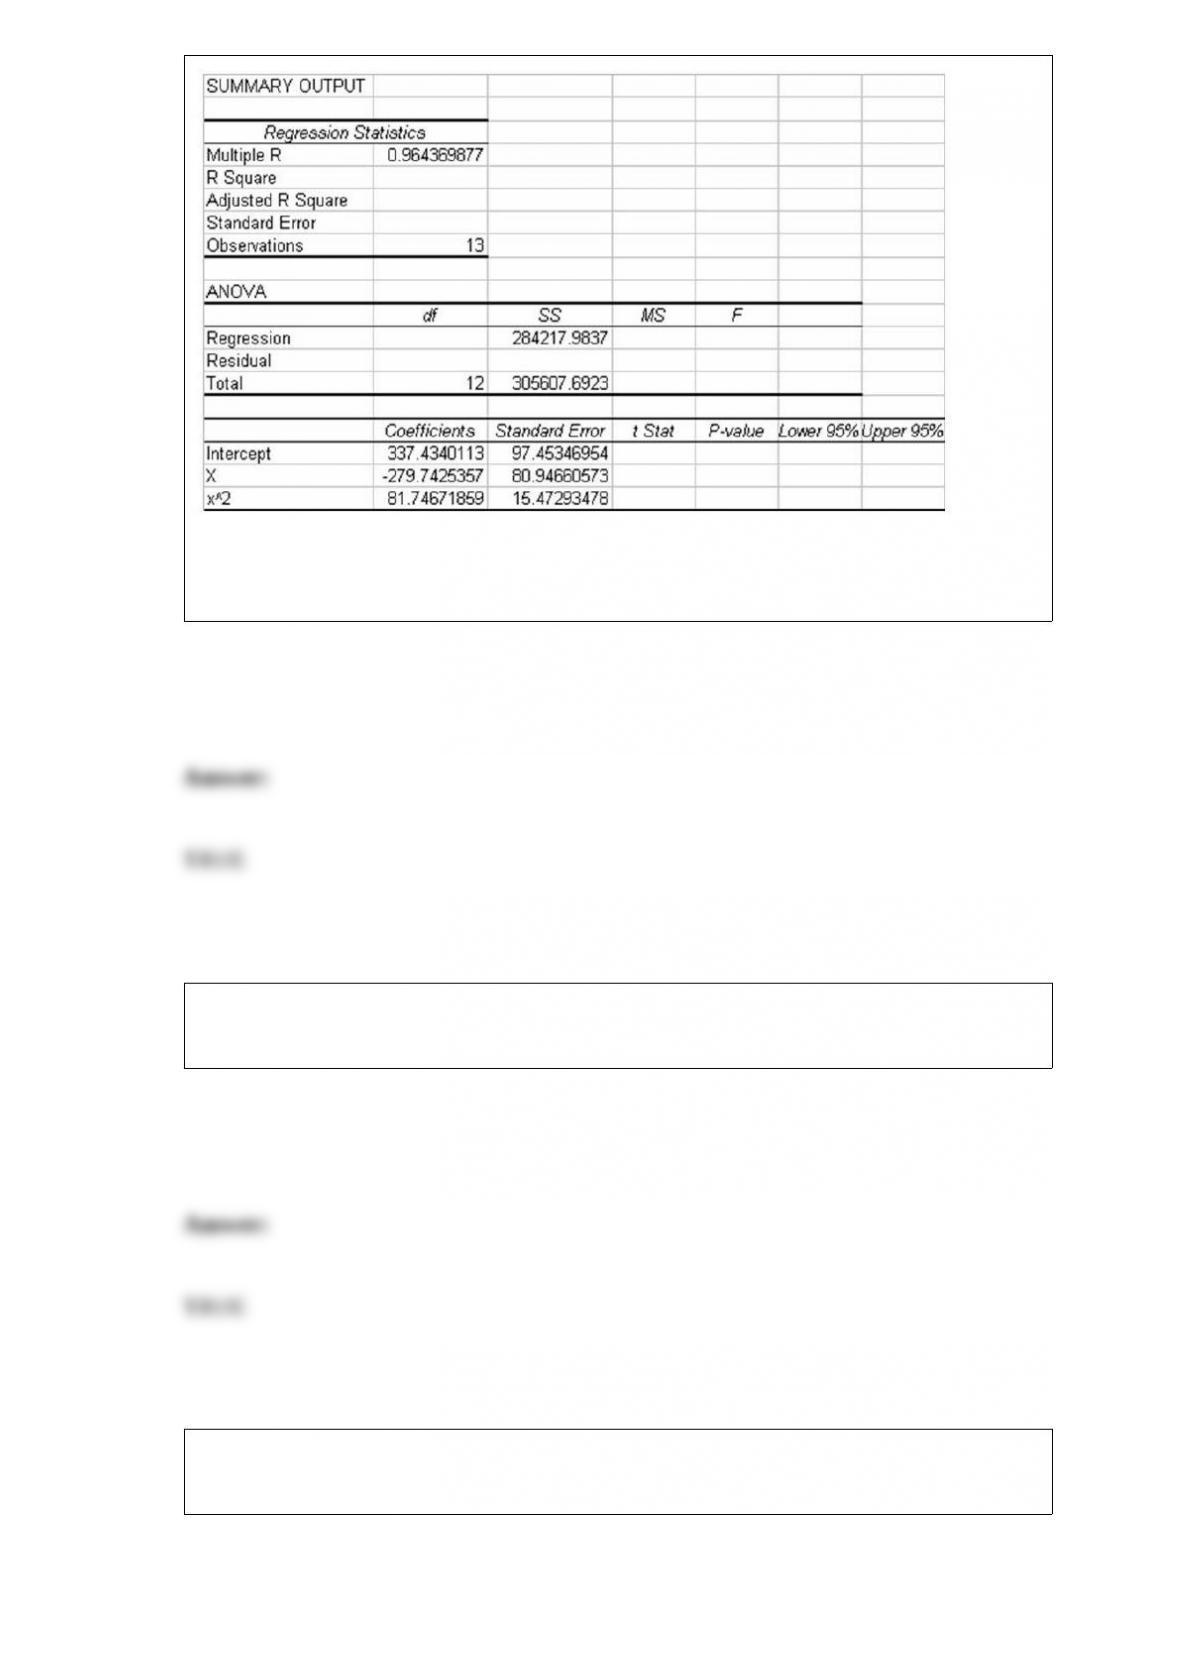

Considering the above information, both independent variables in the model are
considered statistically significant at the alpha = 0.05 level.
When using a chi-square test for the variance of one population, we are assuming that
the population is normally distributed.
An accountant has recently prepared a report for a client that contains a variety of
graphs and charts. In doing so, she has used descriptive statistical methods.
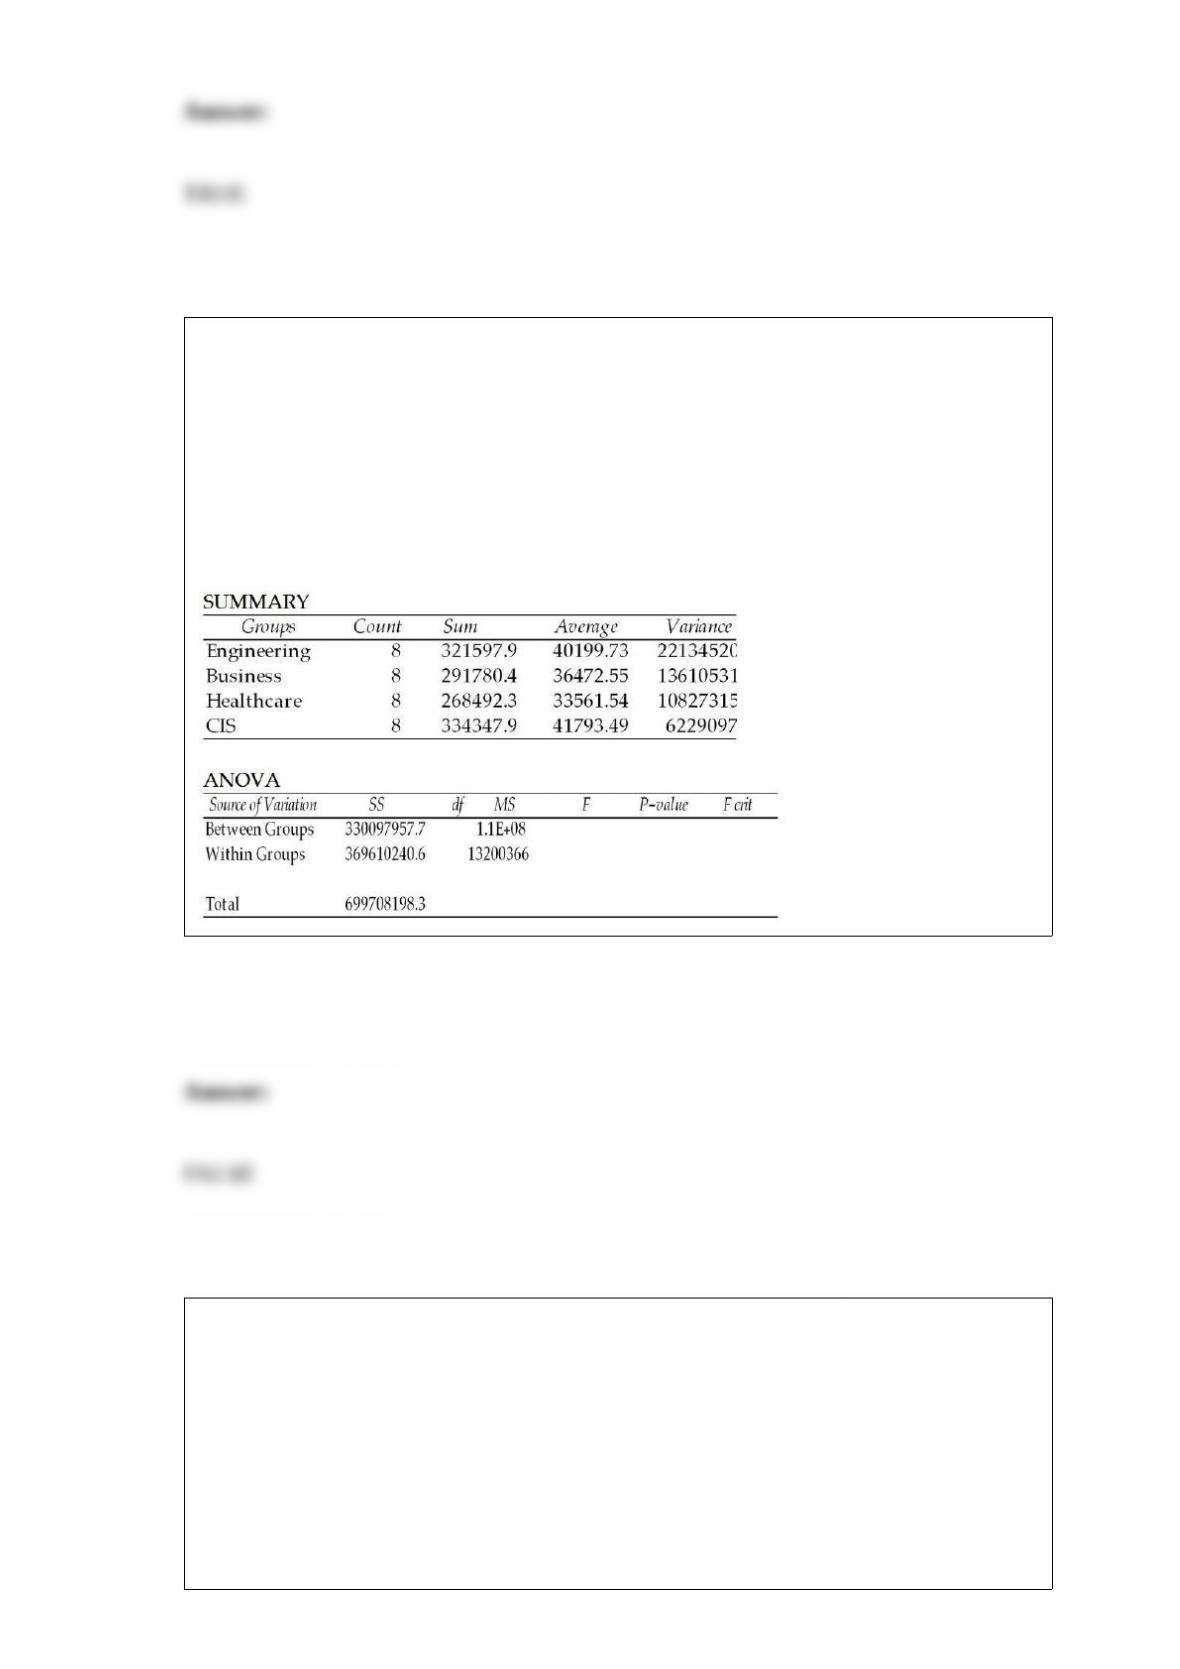
A study was recently conducted to see whether the mean starting salaries for graduates
of engineering, business, healthcare, and computer information systems majors differ. A
random sample of 8 graduates was selected from each major. The following chart shows
some of the results of the ANOVA computations; however, some of the output is
missing. Given what is available, the proper conclusion to reach based on the sample
data is that the population means could be equal using a 0.05 level of significance.
ANOVA: Single Factor
If you are interested in testing whether the median of a population is equal to a specific
value, an appropriate test to use is:
A) the Mann-Whitney U test.
B) the t-test.
C) the Wilcoxon signed rank test.


D) the Wilcoxon Matched-Pairs Signed Rank test.
At issue is the proportion of people in a particular county who do not have health care
insurance coverage. A simple random sample of 240 people was asked if they have
insurance coverage, and 66 replied that they did not have coverage. Based on these
sample data, determine the 95% confidence interval estimate for the population
proportion.
A) (0.239, 0.321)
B) (0.259, 0.301)
C) (0.224, 0.336)
D) (0.268, 0.292)
On a survey, amount of education is recorded as some high school, high school
graduate, some college, college graduate, etc. This is an example of ordinal data.


The method of probability assessment that is least likely to be used by business decision
makers is:
A) subjective assessment.
B) relative frequency of occurrence.
C) classical assessment.
D) None of the above is used by decision makers.
A company has determined that the mean number of days it takes to collect on its
accounts receivable is 36 with a standard deviation of 11 days. The company plans to
select a random sample of n = 12 accounts and compute the sample mean. Which of the
following statements holds true in this situation?
A) There is no way to determine what the mean of the sampling distribution is without
knowing the specific shape of the population.
B) The sampling distribution will have the same distribution as the population, provided
that the population is not normally distributed.
C) The sampling error will be larger than if they had sampled n = 64 accounts.
D) The sampling distribution may actually be approximately normally distributed
depending on what the population distribution is.


Assuming that a regression has been conducted for a group of small companies where x
= the number of employees at the company, y = annual revenue of the company
(recorded in thousands of dollars), and the largest company included in the study had 82
employees. The resulting regression equation is = 59.2 + 83.4x. Which of the
following is true?
A) For each additional employee, revenue on average will increase by $83.4
B) A company with 2100 employees could be predicted to have average revenue of
about $175 million.
C) For each additional employee, revenue on average will increase by $59.2 thousand.
D) This model should not be used to make predictions for companies with more than 82
employees.
Employees at a large computer company earn sick leave in one-minute increments
depending on how many hours per month they work. They can then use the sick leave
time any time throughout the year. Any unused time goes into a sick bank account that
they or other employees can use in the case of emergencies. The human resources
department has determined that the amount of unused sick time for individual
employees is uniformly distributed between 0 and 480 minutes. Based on this
information, what is the probability that three randomly chosen employees have over
400 unused sick minutes at the end of the year?
A) 0.1667
B) 0.0046
C) 0.5001
D) 0.0300
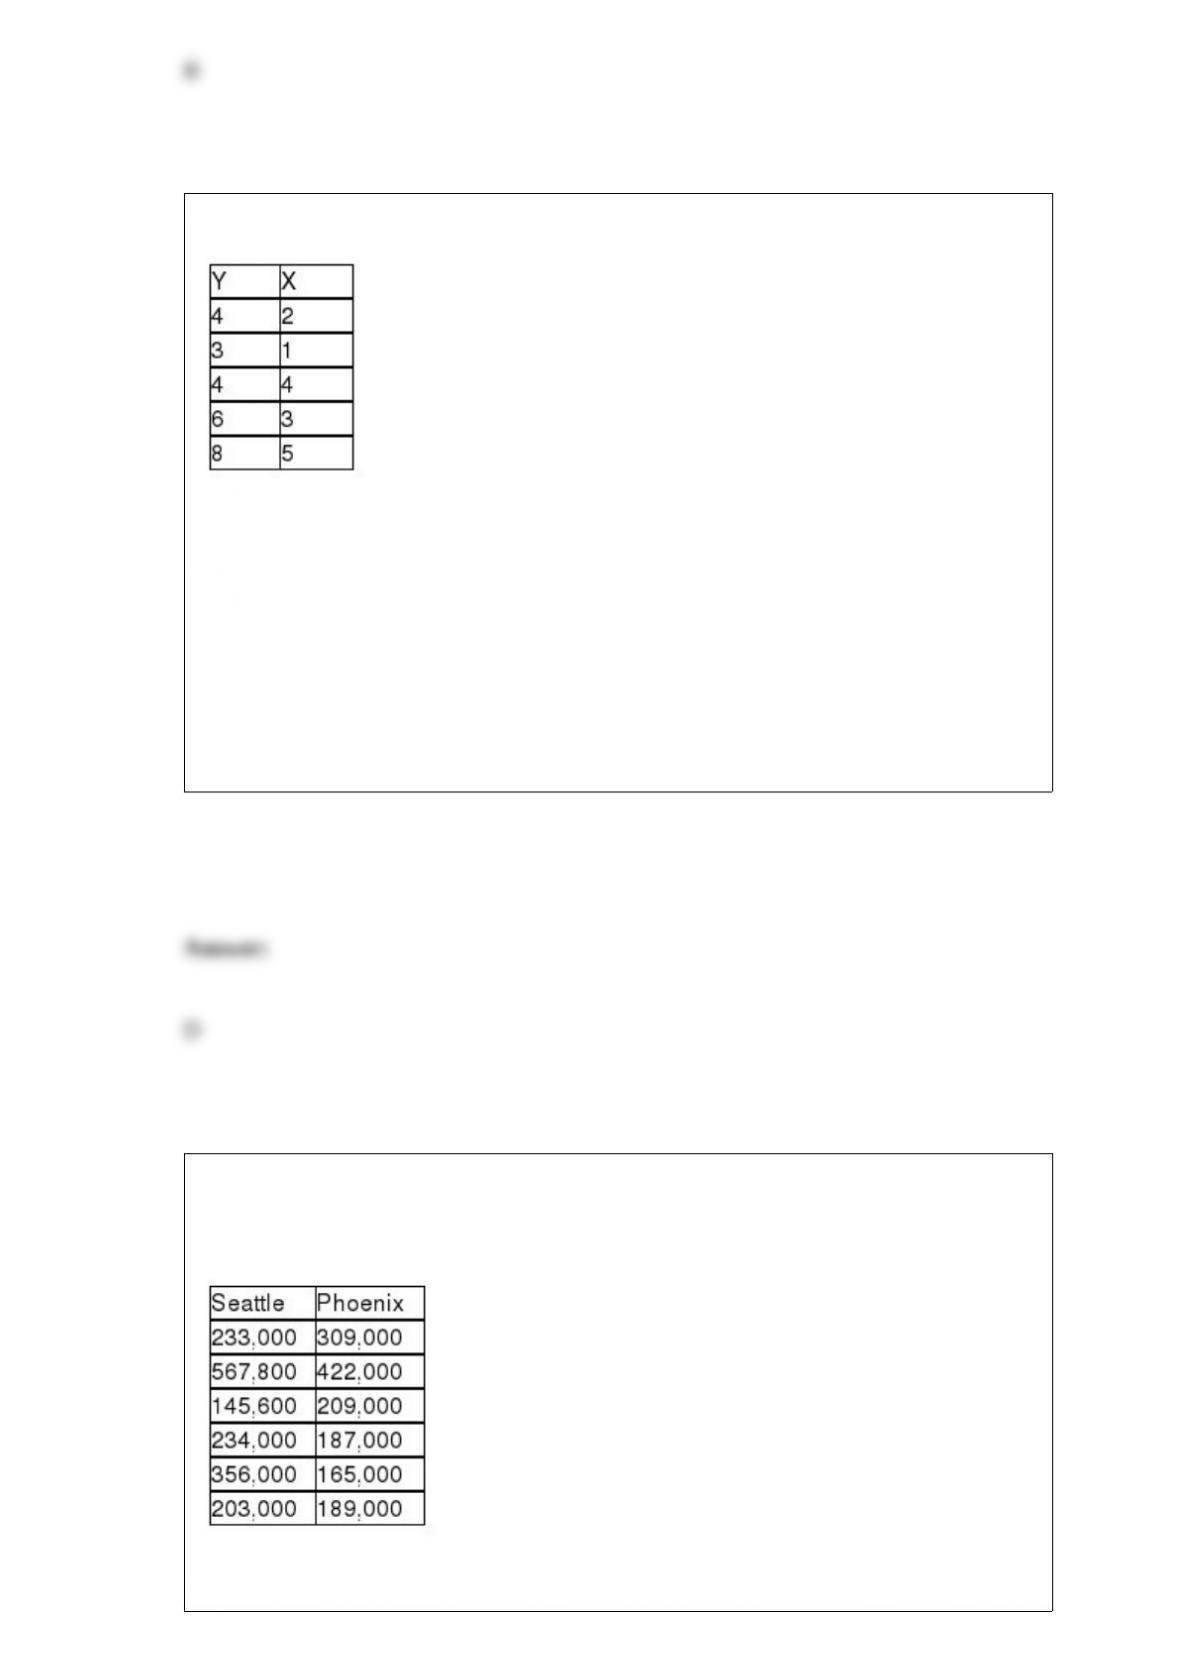
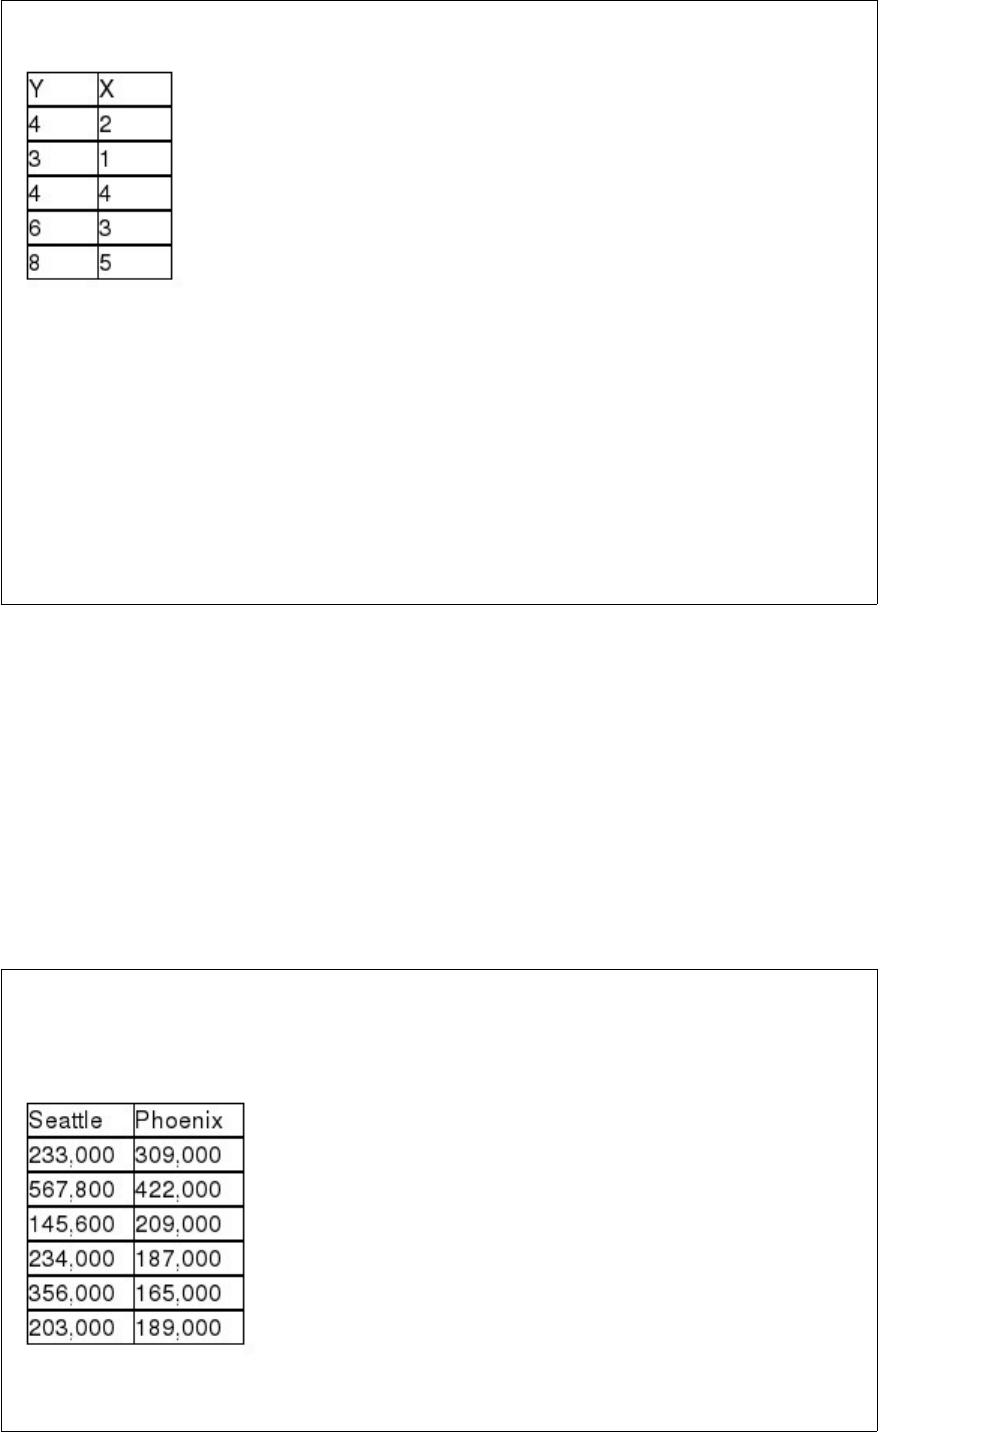
Given the data below, one ran the simple regression analysis of Y on X.
The relationship between Y and X is
A) significant at the alpha = 1 percent level.
B) significant at the alpha = 5 percent level.
C) significant at the alpha = 10 percent level.
D) not significant at the alpha = 10 percent level.
Consider the situation in which a study was recently conducted to determine whether
the median price of houses is the same in Seattle and Phoenix. The following data were
collected.
Given these data, if a Mann-Whitney U test is to be used, the U statistic for Phoenix is:


A) 14
B) 22
C) 35
D) 27
In an effort to estimate the mean dollars spent per visit by customers of a food store, the
manager has selected a random sample of 100 cash register receipts. The mean of these
was $45.67 with a sample standard deviation equal to $12.30. Assuming that he wants
to develop a 90 percent confidence interval estimate, which of the following is the
margin of error that will be reported?
A) About $2.02
B) Nearly $50.20
C) $1.645
D) About $1.43
A population measure, such as the population mean, is called a:
A) statistic.


B) parameter.
C) prime number.
D) sample value.
Which of the following statistical measures is used to help decision makers assess the
potential for their model to provide usable forecasts?
A) The mean absolute deviation
B) The mean square error
C) Both A and B
D) Neither A nor B
A two-factor analysis of variance is conducted to test the effect the price and advertising
have on sales of a particular brand of bottled water. Each week a combination of
particular levels of price and advertising are used and the sales level is recorded. The
computer results are shown below.
ANOVA


How many replications were used in this study?
A) 2
B) 3
C) 4
D) 5
Which of the following regression output values is used in computing the variance
inflation factors?
A) The standard error of the estimate
B) The regression intercept value
C) The F critical value from the F distribution for the appropriate number of degrees of
freedom and the appropriate level of significance
D) The R-squared value


A cell phone service provider has 14,000 customers. Recently, the sales department
selected a random sample of 400 customer accounts and recorded the number of
minutes of long distance time used during the previous billing period. The data for this
variable is considered to be nominal since the values are based on sample data.
If the number of defective items selected at random from a parts inventory is considered
to follow a binomial distribution with n = 50 and p = 0.10, the expected number of
defective parts is:
A) 5
B) approximately 2.24
C) more than 10
D) 0.5
A real estate broker claims that the median days that one of his listings stays on the
market is 45 or less days. To test this, he has collected the following random sample of
properties sold showing the days they were on the market prior to selling:


Days
50
30
70
20
30
40
60
80
The broker is unwilling to assume that the population data are normally distributed.
a. What is the correct null and alternative hypothesis to be tested?
b. What statistical test would you recommend be used to test this hypothesis?
c. Conduct the test and indicate what conclusion should be reached if we test at an alpha
= .05 level?


If a hypothesis test for a single population variance is to be conducted using a
significance level of 0.10, a sample size of n = 16, and the test is a one-tailed upper-tail
test, the critical value is:
A) z = 1.28
B) t = 1.345
C) x2 = 22.3071
D) x2 = 24.9958
Golf handicaps are used to allow players of differing abilities to play against one
another in a fair match. Recently a sample of golfers was selected in an effort to
develop a model for explaining the difference in handicaps. One independent variable
of interest is the number of rounds played per year. Another is whether or not the player
is using an “original” name brand club or a copy. In recent years, a number of smaller
golf club manufacturers have attempted to copy major golf club designs and sell
“copies” of original clubs such as the Big Bertha by Calloway. To incorporate the type
of club used, which of the following methods could be used?
A) Create a dummy variable called “Club Used” and code it “O” for original and “C”
for copy.
B) Create a dummy variable called “Club Used” and code it 1 for copy and 0 for
original.
C) Create a dummy variable called Club Used” and code it 1 for original and 0 for copy.


D) Either B or C would work.
Suppose we want to test H0 : μ ≥ 30 versus H1 : μ < 30. Which of the following
possible sample results based on a sample of size 36 gives the strongest evidence to
reject H0 in favor of H1?
A) = 28, s = 6
B) = 27, s = 4
C) = 32, s = 2
D) = 26, s = 9
A small city has two taxi companies (A and B). Each taxi company has 5 taxis. A motel
has told these companies that they will randomly select a taxi company when one of its
customers needs a cab. This morning 3 cabs were needed. Assuming that no one
individual taxi can be used more than once, what is the probability that 2 of the cabs
selected will be from Company A and the other will be from B?
A) 0.417
B) 0.25
C) 0.583


D) 0.5
There have been complaints recently from homeowners in the north end claiming that
their homes have been assessed at values that are too high compared with other parts of
town. They say that the mean increase from last year to this year has been higher in
their part of town than elsewhere. To test this, the assessor’s office staff plans to select a
random sample of north end properties (group 1) and a random sample of properties
from other areas within the city (group 2) and perform a hypothesis test. Based on the
information provided, the research (or alternate) hypothesis is:
A) μ1 = μ2
B) μ1 ≠ μ2
C) μ1 > μ2
D) μ1 < μ2
In developing and conducting a survey, what is the purpose of the pre-test phase?
A) To make sure that the cost of developing the survey instrument is not too great
B) To generate initial data for analysis
C) To catch any problems with the questionnaire before it is fully administered


D) To make sure that the respondents like the issues being addressed by the survey
College-Pro Painting does home interior and exterior painting. The company uses
inexperienced painters that do not always do a high-quality job. It believes that its
painting process can be described by a Poisson distribution with an average of 4.8
defects per 400 square feet of painting.
What is the probability that a 400-square-foot painted section will have fewer than 6
blemishes?
A) 0.2818
B) 0.3414
C) 0.4857
D) 0.6510
Arrivals to a bank automated teller machine (ATM) are distributed according to a
Poisson distribution with a mean equal to three per 15 minutes.Determine the
probability that in a given 15-minute segment no customers will arrive at the ATM.
A) 0.0124
B) 0.0281
C) 0.0314


D) 0.0498
Each evening, a nationwide retail chain randomly calls 100 of the customers who came
to their store that day to ask whether they were satisfied with the service they had
received. The customers respond yes or no. Suppose the company has found over time
that 8 percent of the customers are not satisfied (“no” answers). If they have established
a process control chart, what conclusion should be reached if the percentage of
customers surveyed tonight that say no is 14 percent?
A) This result indicates that a special cause situation exists.
B) Although this point is above the upper control limit, there is no cause for alarm if
this is the first time.
C) While this value is higher than “normal,” it is still within the range of common cause
variation and no action is needed.
D) This is outside the control limits and action should be taken
In this course, the term business statistics refers to the set of tools and techniques that
are used to convert information into meaningful data.


For the following hypothesis test:
With n = 15, s = 7.5, and = 62.2, state the conclusion.
A) Because the computed value of t = 0.878 is not less than -2.1448 and not greater
than 2.1448, do not reject the null hypothesis.
B) Because the computed value of t = 1.312 is not less than -2.1448 and not greater than
2.1448, do not reject the null hypothesis.
C) Because the computed value of t = 0.878 is not less than -2.1448 and not greater than
2.1448, reject the null hypothesis
D) Because the computed value of t = 1.312 is not less than -2.1448 and not greater
than 2.1448, reject the null hypothesis
Construct a 98% confidence interval estimate for the population mean given the
following values:
A) (113.41, 126.59)
B) (117.46, 122.54)
C) (113.67, 126.33)
D) (113.13, 126.87)
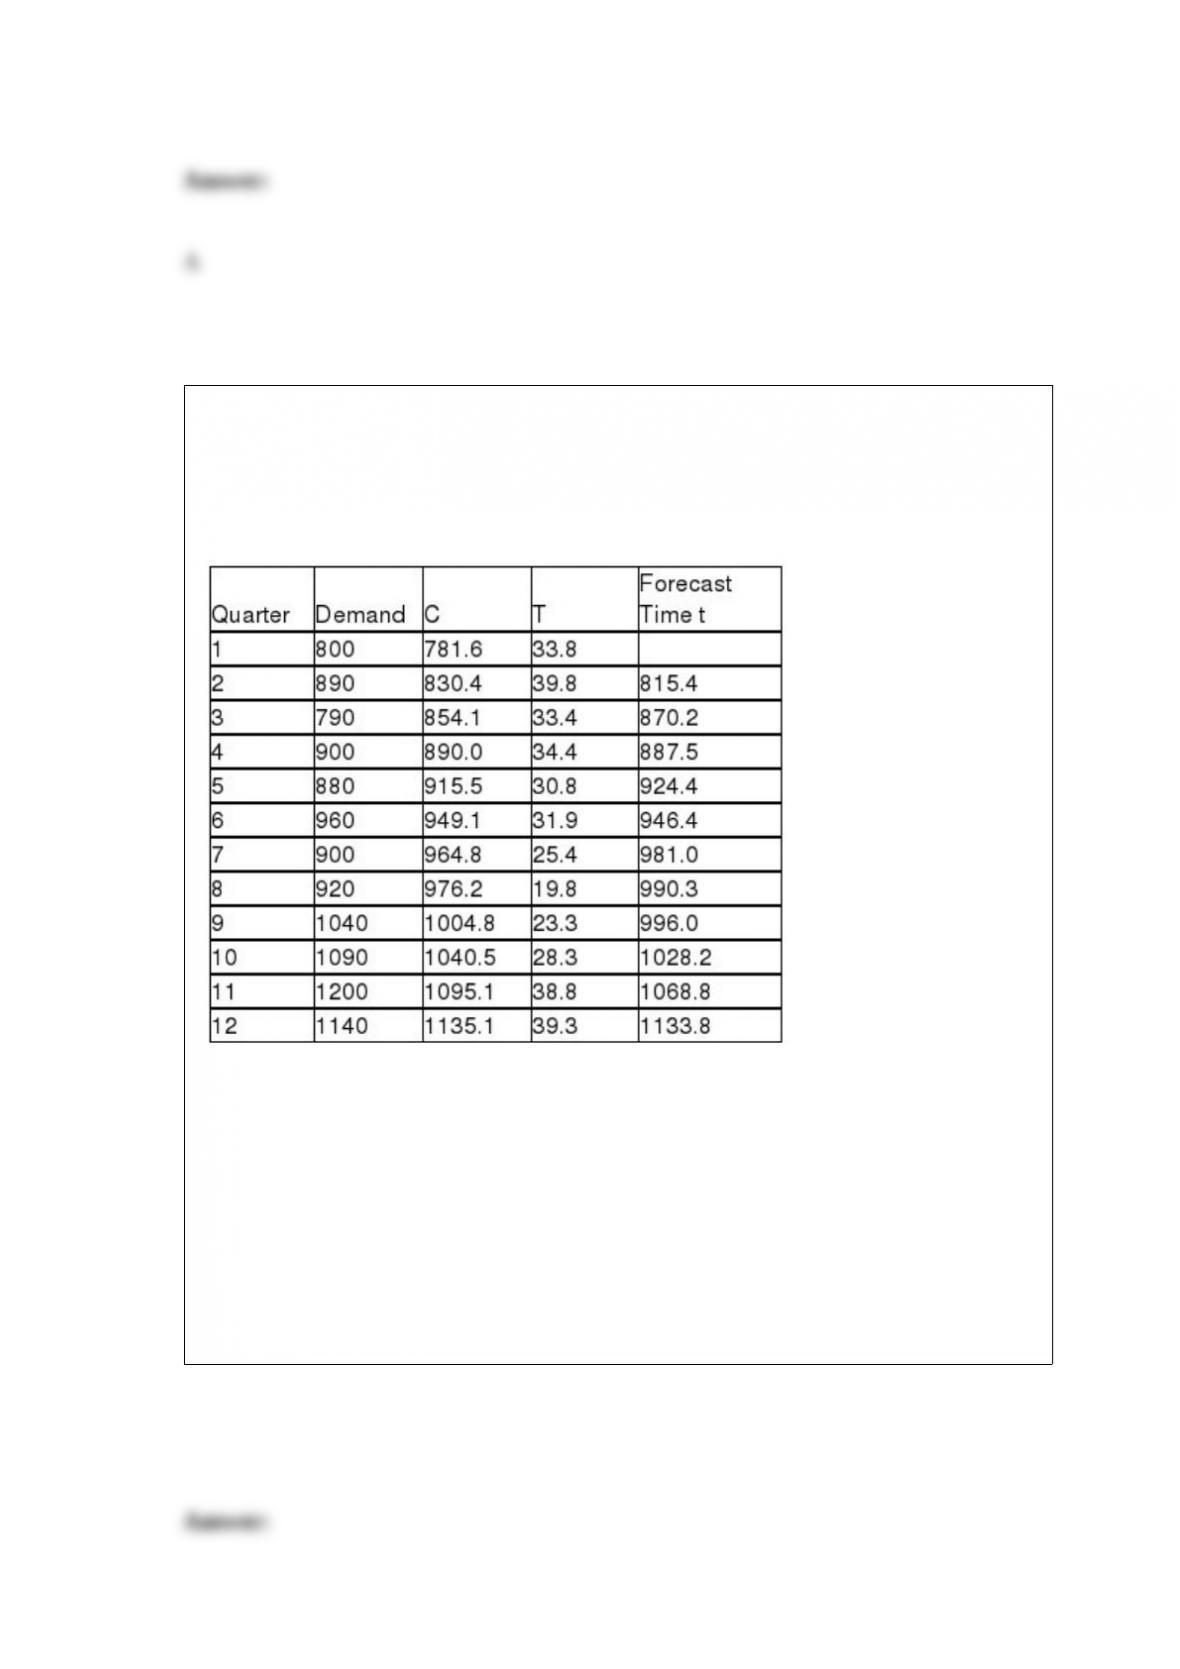
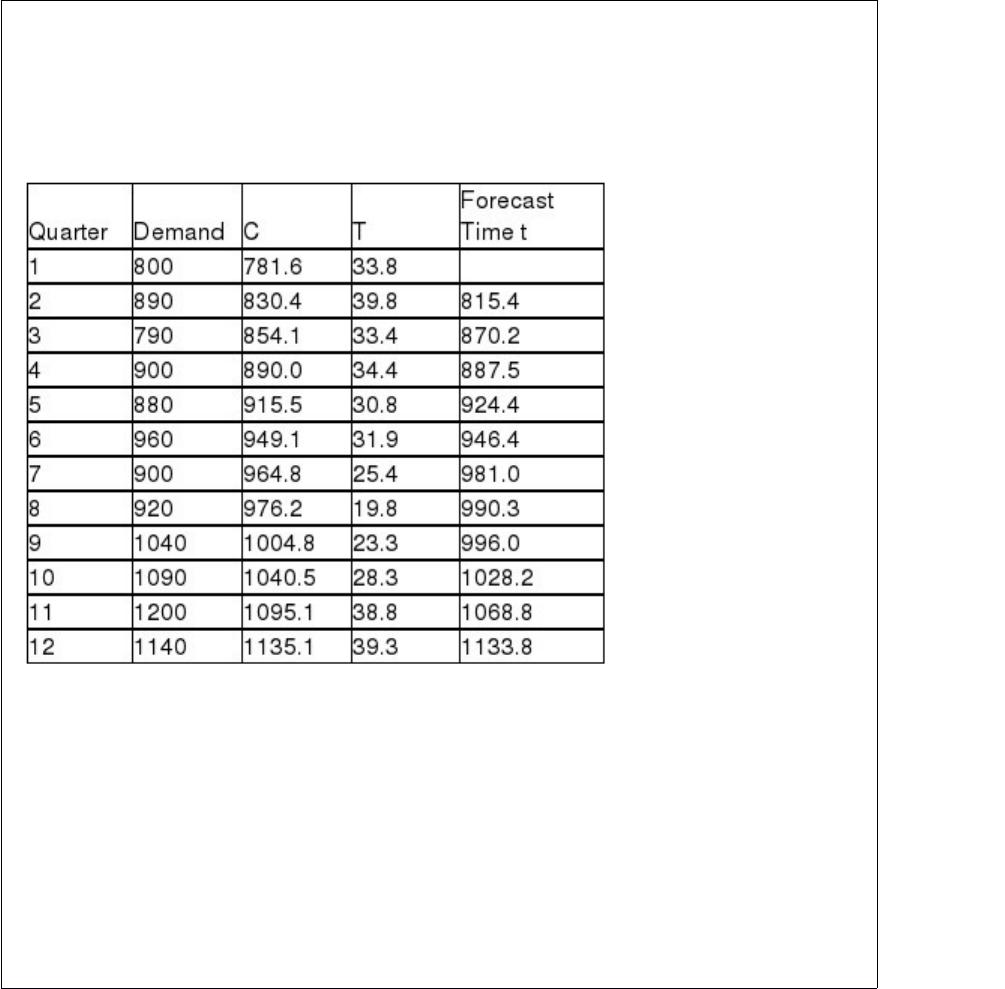
The Wilson Company is interested in forecasting demand for its XG-667 product for
quarter 13 based on 12 quarters of data. The following shows the data and the double
exponential smoothing model results for periods 1-12 using alpha = 0.20 and beta =
0.40.
Based on this information, what is the MAD value for quarters 2-12?
A) About 56.3
B) Approximately -16.7
C) Approximately 71.2
D) About 38.5


Which of the following is not a type of commonly used process control chart?
A) x-bar chart
B) R-chart
C) p-chart
D) n-chart
One of the advantages that a stem and leaf diagram has over a histogram is:
A) the detail of the data is preserved.
B) it shows the general distribution of a quantitative variable.
C) it can be used with nominal data.
D) There are no advantages.