

Based on the central limit theorem, the sample mean can be used as a good estimator of
the population mean, assuming that the size of the sample is sufficiently large.
The branch of mathematics used to facilitate the collection, organization, presentation,
analysis, and interpretation of numerical information is referred to as statistics.
If 40 samples of size 21 were selected from a population of 22,493, we would expect
the mean of the sample means and the population mean to be close but not exactly
equal.
The mean of all possible sample means is equal to the population mean.
For a uniformly distributed random variable, x, P(x) is constant.
For the hypothesis test, with n1 = 10 and n2 = 10, the F-test statistic is
2.56. At the 0.01 level of significance, we would reject the null hypothesis.


A cumulative frequency distribution is used when we want to determine how many
observations lie above or below certain values.
The principal difference between the interval and ratio scale is that the ratio scale has a
meaningful zero point.
The variance measures the skewness of a probability distribution.
A dot plot shows the symmetry of a distribution.


A frequency polygon is a very useful graphic technique when comparing two or more
distributions.
In a bar chart, the heights of the bars represent the frequencies in each class.
An F distribution is useful for testing the null hypothesis that a set of sample data is
normally distributed.


The central limit theorem states that for a sufficiently large sample the sampling
distribution of the means of all possible samples of size n generated from the population
will be approximately normally distributed with the mean of the sampling distribution
equal to σ2 and the variance equal to σ2/n.
A correlation matrix shows individual correlation coefficients for all pairs of variables.
If the computed value of F is 0.99 and the F critical value is 3.89, we would not reject
the null hypothesis.


The shape of the chi-square distribution depends on the size of the sample.
In a Poisson distribution, the probability of success may vary from trial to trial.
A confidence interval for a population proportion uses the uniform distribution to
approximate the binomial distribution.


There is not one, but a family of chi-square distributions. There is a chi-square
distribution for 1 degree of freedom, another for 2 degrees of freedom, another for 3
degrees of freedom, and so on.
The pooled estimate of the proportion is found by dividing the total number of samples
by the total number of successes.
The Union of Electrical Workers of America with 9,128 members polled 362 members
about a new wage package that will be submitted to management. The population is the
362 members.


The ordinal level of measurement is considered the “lowest” level of measurement.
Quartiles divide a distribution into four equal parts.
If the null hypothesis states that there is no difference between the mean income of
males and the mean income of females, then the test is one-tailed.


The variance of a probability distribution is based on the sum or squared differences
from the mean.
The 50th percentile of a distribution is the same as the distribution mean.
In the goodness-of-fit test, the chi-square distribution is used to determine how well an
observed distribution of observations “fits” an expected distribution of observations.


The variance is the mean of the sum of the squared deviations between each
observation and the median.
For a one-tailed test with a 0.05 level of significance, the critical z statistic is 1.645, but
the critical t statistic is 1.96.
A group of normal distributions can have equal arithmetic means but different standard
deviations.


For a goodness-of-fit test, the following are possible null and alternate hypotheses:
H0: Sales are uniformly distributed among the five locations.
H1: Sales are not uniformly distributed among the five locations.
A z statistic is used for a problem involving any sample size and an unknown
population standard deviation.
It is often not feasible to study the entire population because it is impossible to observe
all the items in the population.


A Type II error is the probability of rejecting the null hypothesis when it is actually true.
If a distribution is negatively skewed, the distribution is not symmetrical and the long
tail is to the left.
A correlation matrix can be used to assess multicollinearity between independent
variables.


Stepwise regression analysis is also called a “backward elimination” method.
The level of significance is the probability of rejecting the null hypothesis when it is
actually true.
The chi-square test statistic used in a goodness-of-fit test has k – 1 degrees of freedom.
A large oil company is studying the number of gallons of gasoline purchased per
customer at self-service pumps. The mean number of gallons is 10.0, with a standard
deviation of 3.0 gallons. The median is 10.75 gallons. What is Pearson’s coefficient of
skewness in this instance?


A. -1.00
B. -0.75
C. +0.75
D. +1.00
The performance of personal and business investments is measured as a percentage,
“return on investment.” What type of variable is “return on investment”?
A. Qualitative
B. Continuous
C. Attribute
D. Discrete
What is the only variable in the Poisson probability formula?


A. π
B. x
C. e
D. P
A hypothesis regarding the weight of newborn infants at a community hospital is that
the mean is 6.6 pounds. A sample of seven infants is randomly selected and their
weights at birth are recorded as 9.0, 7.3, 6.0, 8.8, 6.8, 8.4, and 6.6 pounds. If α = 0.05,
what is the critical t value?
A. -2.365
B. 1.96
C. 2.365
D. 2.447

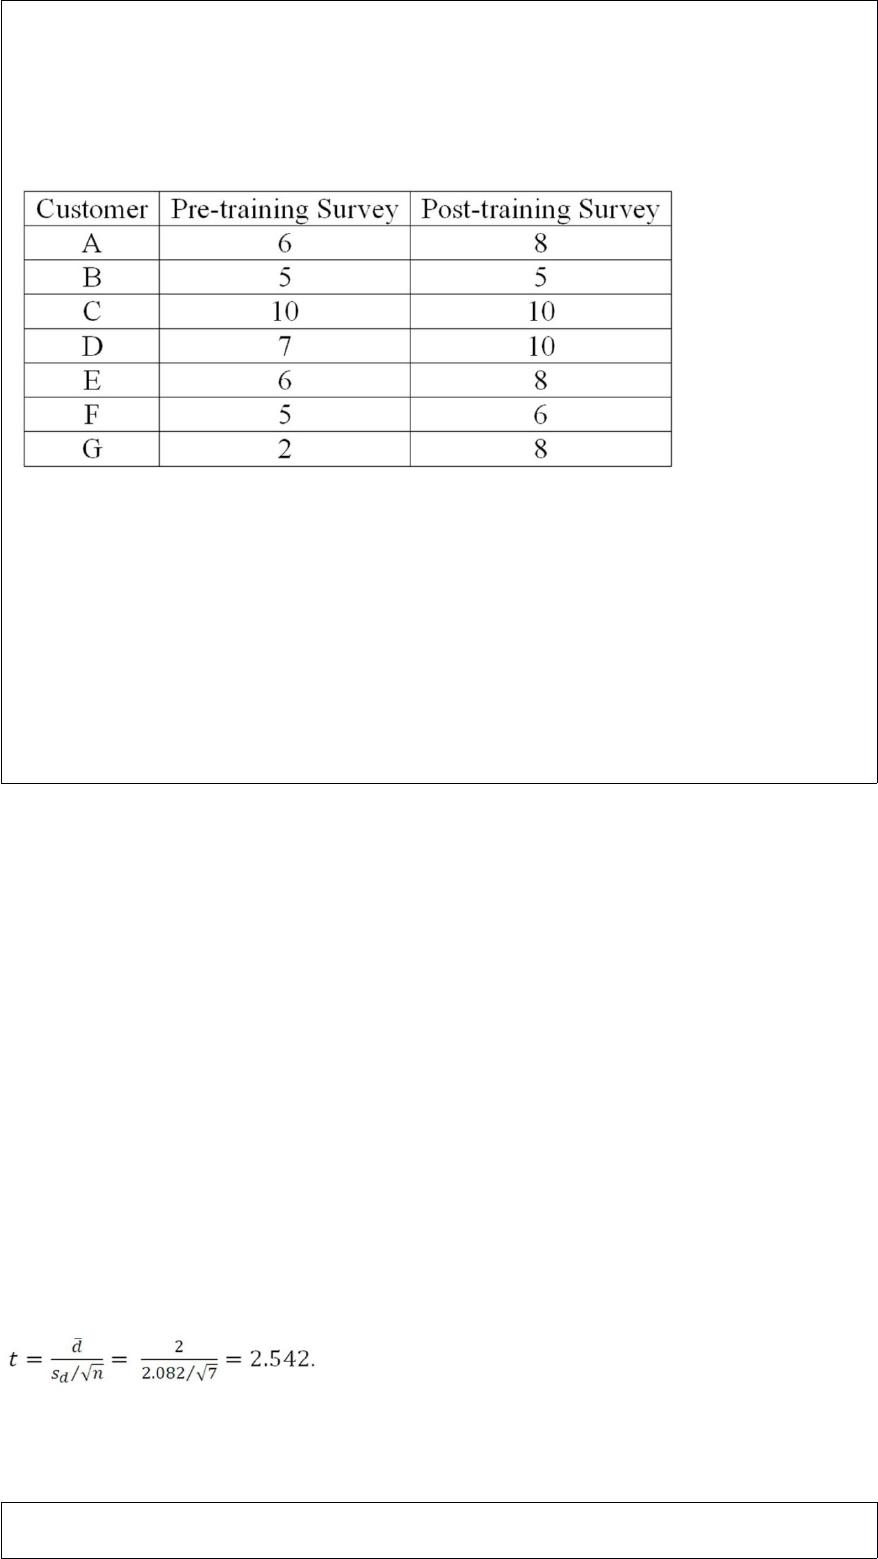
An investigation of the effectiveness of a training program to improve customer
relationships included a pre-training and post-training customer survey. To compare the
differences they computed (post-training survey score – pre-training survey score).
Seven customers were randomly selected and completed both surveys. The results
follow.
What is the value of the test statistic?
A. 1.943
B. 1.895
C. 2.542
D. 2.447
What is the decision regarding the differences between the observed and expected


frequencies if the critical value of chi-square is 9.488 and the computed chi-square
value is 6.079?
A. Fail to reject the null hypothesis; the difference is probably due to sampling error.
B. Reject the null hypothesis.
C. Fail to reject the alternate hypothesis.
D. Too close; reserve judgment.
When data is collected using a qualitative, nominal variable, what is true about a
frequency distribution that summarizes the data?
A. The upper and lower class limits must be calculated.
B. A pie chart can be used to summarize the data.
C. The number of classes is equal to the number of variable’s values plus 2.
D. The “5 to the k rule” can be applied.


Which of the following is NOT one of the five steps in the hypothesis testing
procedure?
A. Formulate a decision rule
B. State the null and alternate hypotheses
C. Select a level for β
D. Identify the test statistic
Refer to the following breakdown of responses to a survey of room service in a hotel.
What is the class with the greatest frequency?
A. Not satisfied
B. Satisfied
C. Highly satisfied
D. None Apply


What is the possible range of values for Pearson’s coefficient of skewness?
A. -1 and +1
B. -3 and +3
C. 0% and 100%
D. Unlimited values
When we use a confidence interval to reach a conclusion about the population mean, we
are applying a type of reasoning or logic called __________.
A. Descriptive statistics
B. The normal distribution
C. Statistical inference
D. Graphics


Carlson Jewelers permits the return of their diamond wedding rings, provided the return
occurs within two weeks of the purchase date. Their records reveal that 10% of the
diamond wedding rings are returned. Five different customers buy a wedding ring.
What is the probability that none of the customers return a ring?
A. 0.250
B. 0.073
C. 0.590
D. 0.500
The following is a Poisson probability distribution with = 0.1.
The mean of the distribution is _____.
A. 1.5
B. 0.1
C. 0.25


D. 1.0
A population consists of all the weights of all defensive tackles on a university’s
football team. They are Johnson, 204 pounds; Patrick, 215 pounds; Junior, 207 pounds;
Kendron, 212 pounds; Nicko, 214 pounds; and Cochran, 208 pounds. What is the
population standard deviation (in pounds)?
A. About 4
B. About 16
C. About 100
D. About 40
When using Student’s t to compute an interval estimate, ___________.
A. We assume that the samples are collected from populations that are uniformly
distributed
B. We estimate the population mean based on the sample mean
C. We use the z distribution


D. We assume that the samples are collected from normally distributed populations
Which chi-square distribution would be closest to a normal distribution?
A. The distribution with 3 degrees of freedom.
B. The distribution with 12 degrees of freedom.
C. The distribution with 15 degrees of freedom.
D. The distribution with 9 degrees of freedom.
For an alternative hypothesis: > 6,700, where is the rejection region for the hypothesis
test located?
A. In both tails
B. In the left or lower tail


C. In the right or upper tail
D. In the center
To test if an observed frequency distribution with five classes is normally distributed,
we need to find ___________________.
A. The t-statistic
B. The expected, normally distributed class frequencies
C. The class marks
D. The class relative frequencies
Of the following characteristics, the t distribution and z distribution are the same in all

BUT one. Which one is it?
A. Continuous
B. Symmetrical
C. Bell-shaped
D. Mean = 0, and standard deviation = 1
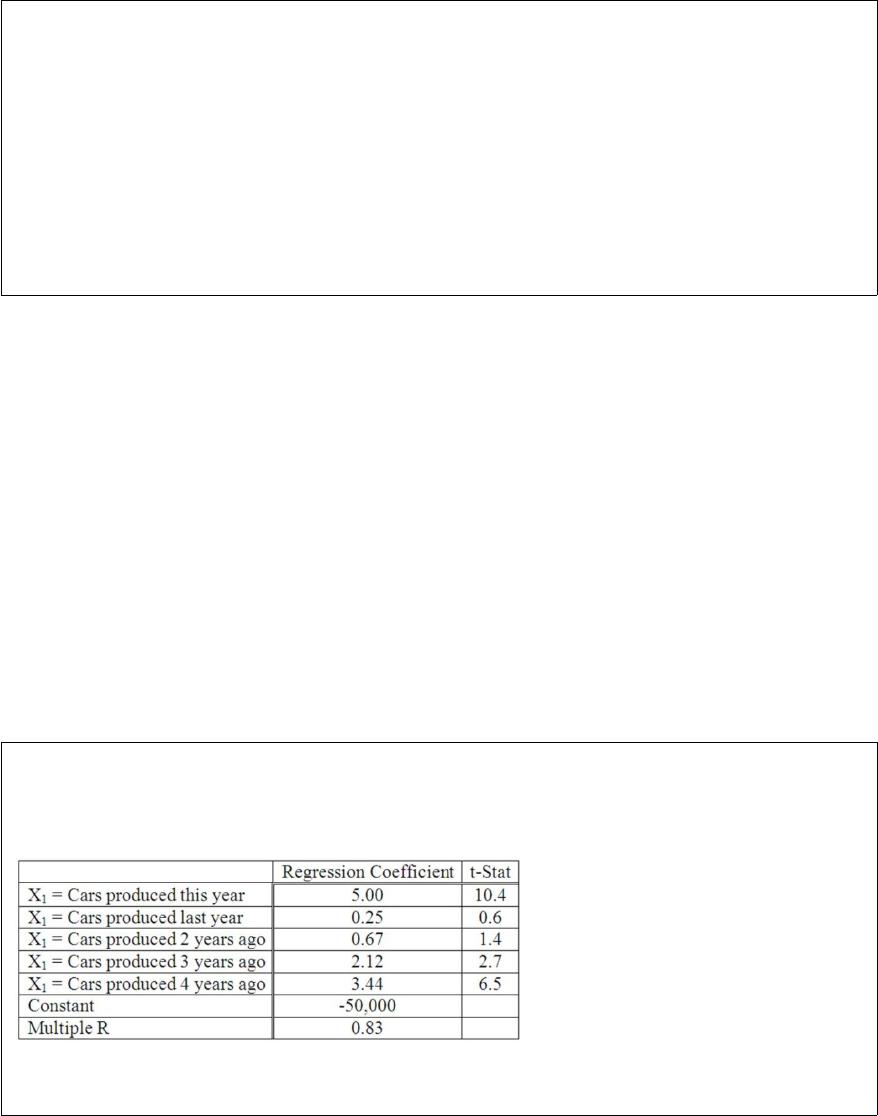
The production of car tires in any given year is related to the number of cars produced
that year and in prior years. Suppose our econometric model resulted in the following
data.
What is the equation for our model?

Assume a student received the following grades for the semester: History, B; Statistics,
A; Spanish, C; and English, C. History and English are 5 credit-hour courses, Statistics
a 4 credit-hour course, and Spanish a 3 credit-hour course. If 4 grade points are
assigned for an A, 3 for a B, and 2 for a C, what is the weighted mean grade for the
semester?
A. 4.00
B. 1.96
C. 2.76
D. 3.01
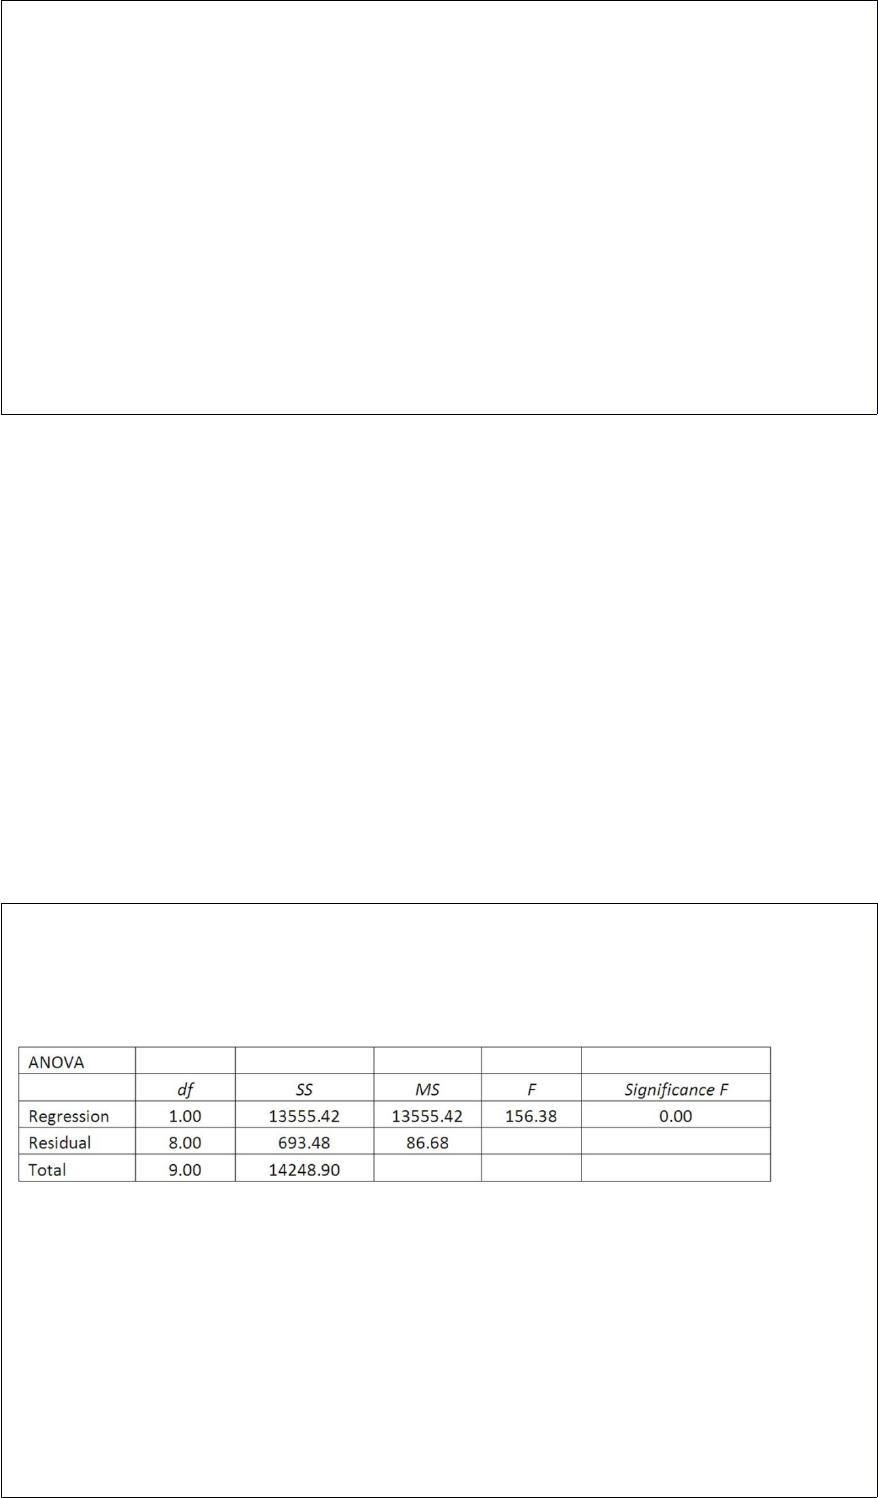
A sales manager for an advertising agency believes that there is a relationship between
the number of contacts that a salesperson makes and the amount of sales dollars earned.
A regression ANOVA shows the following results:
What is the value of the coefficient of determination?
A. -0.9513
B. 0.9754
C. 0.6319
D. 0.9513

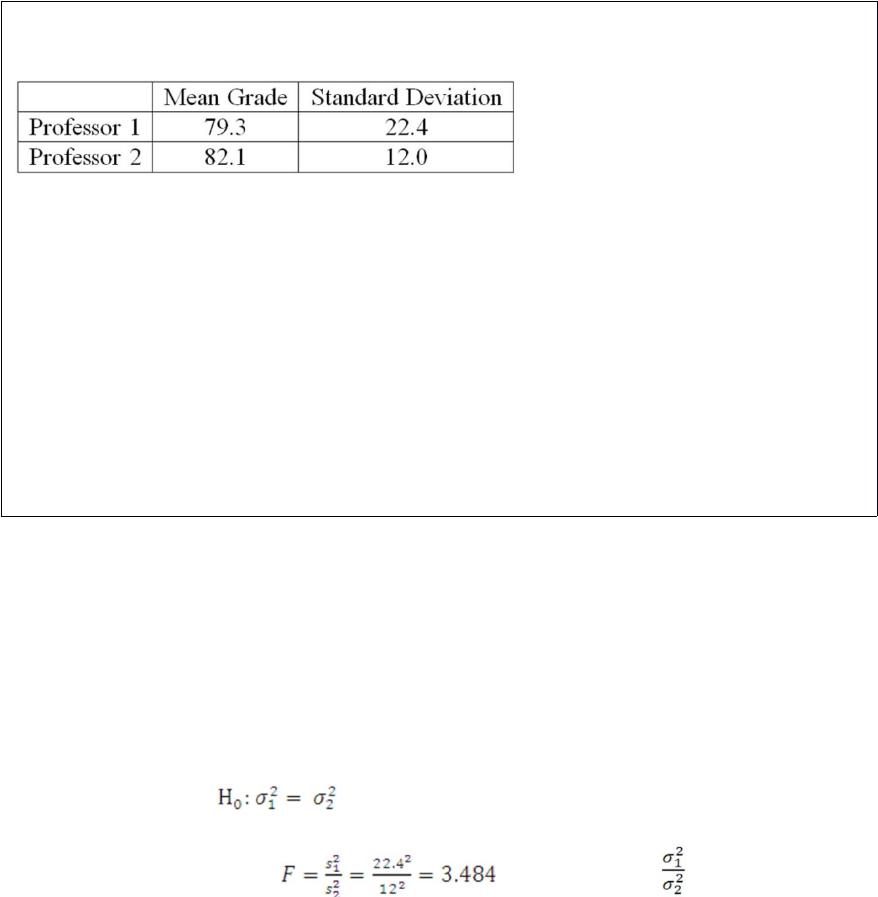
Two accounting professors decided to compare the variance of their grading procedures.
To accomplish this, they each graded the same 10 exams, with the following results:
At the 5% level of significance, what is the decision regarding the null hypothesis?
A. Reject the null hypothesis and conclude the variances are different.
B. Fail to reject the null hypothesis and conclude no significant difference in the
variances.
C. Reject the null hypothesis and conclude the variances are the same.
D. Fail to reject the null hypothesis and conclude the variances are the same.
An electronics company wants to compare the quality of their cell phones to the cell
phones from three competitors. They sample 10 phones from each company and count
the number of defects for each phone. If ANOVA was used to compare the average
number of defects, then the treatments would be defined as:
A. The number of cell phones sampled.
B. The average number of defects.
C. The total number of phones.
D. The four companies.
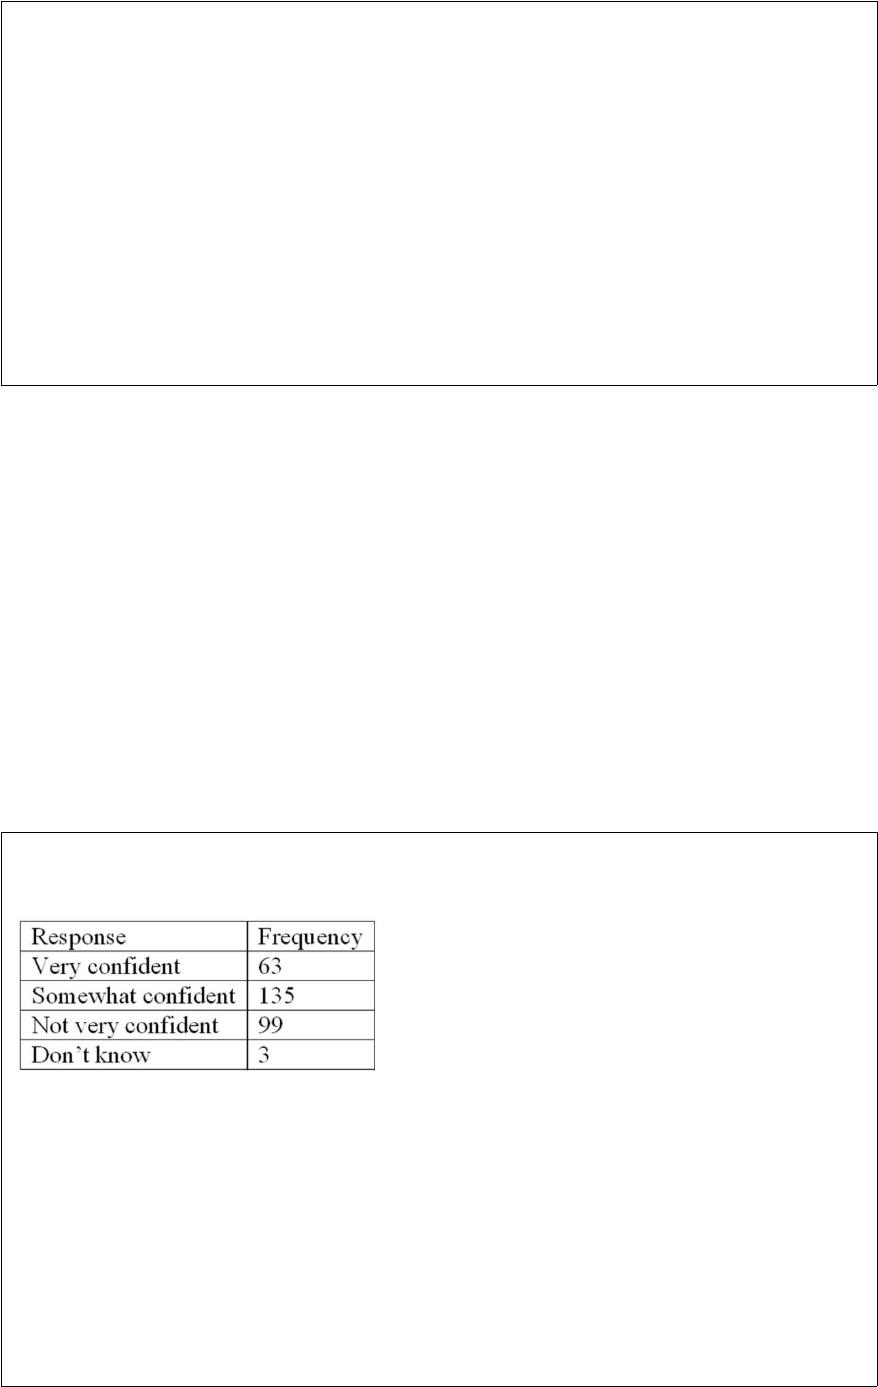
Refer to the following breakdown of responses to a survey of “How confident are you
that you saved enough to retire?”
What is the class with the greatest frequency?
A. Very confident
B. Somewhat confident
C. Not very confident
D. Don’t know

When the null hypothesis for an ANOVA analysis comparing four treatment means is
rejected, _________________
A. Two comparisons of treatment means can be made
B. Four comparisons of treatment means can be made
C. Six comparisons of treatment means can be made
D. Eight comparisons of treatment means can be made
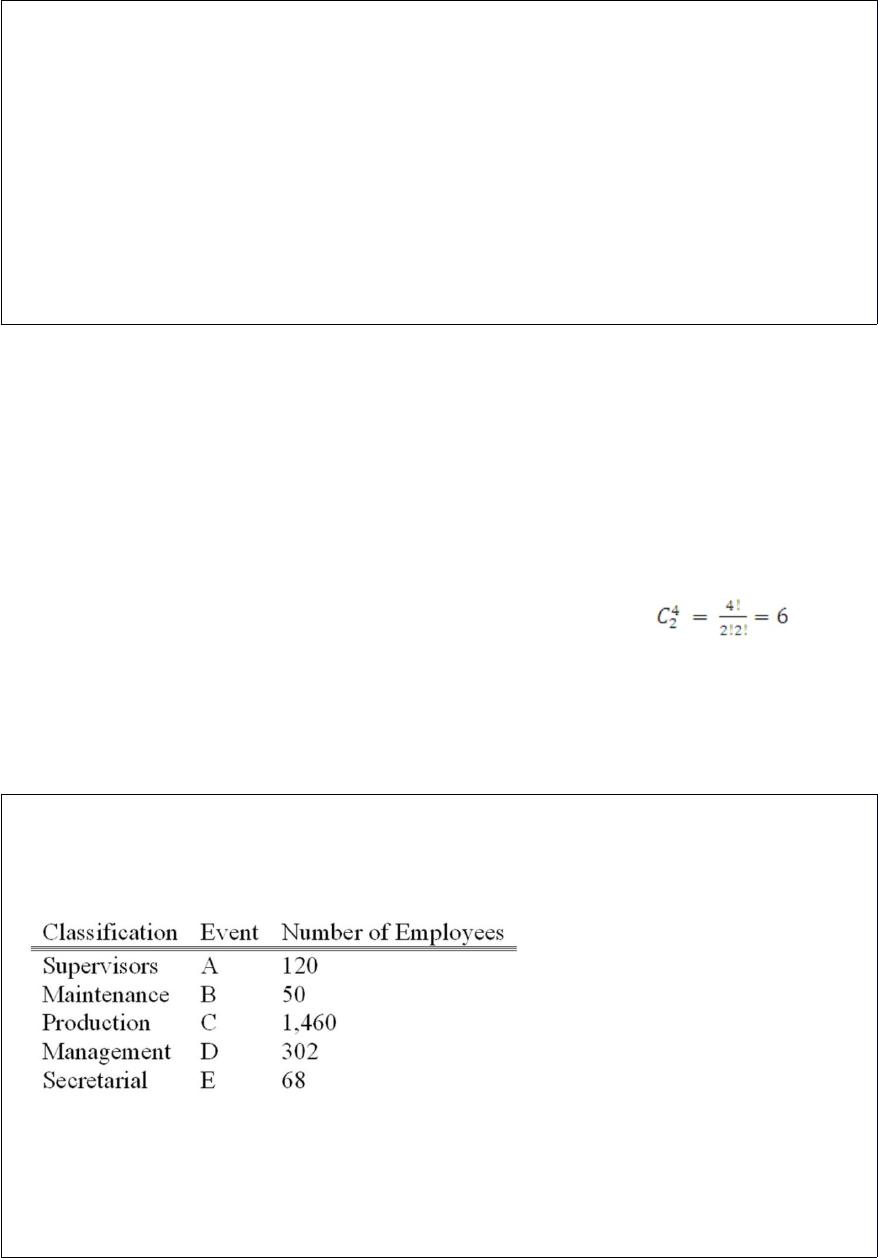
A group of employees of Unique Services will be surveyed about a new pension plan.
In-depth interviews with each employee selected in the sample will be conducted. The
employees are classified as follows.
What is the probability that the first person selected is classified as a maintenance
employee?
A. 0.20


B. 0.50
C. 0.025
D. 1.00
A student was studying the political party preferences of a university’s student
population. The survey instrument asked students to identify themselves as a Democrat
or a Republican. This question is flawed because:
A. Students generally don’t know their political preferences.
B. The categories are generally mutually exclusive.
C. The categories are not exhaustive.
D. Political preference is a continuous variable.
In regression, the difference between the confidence interval and prediction interval
formulas is ________________.
A. The prediction interval is the square root of the confidence interval
B. The addition of “1” to the quantity under the radical sign
C. The prediction interval uses r2 and the confidence interval uses r
D. No difference
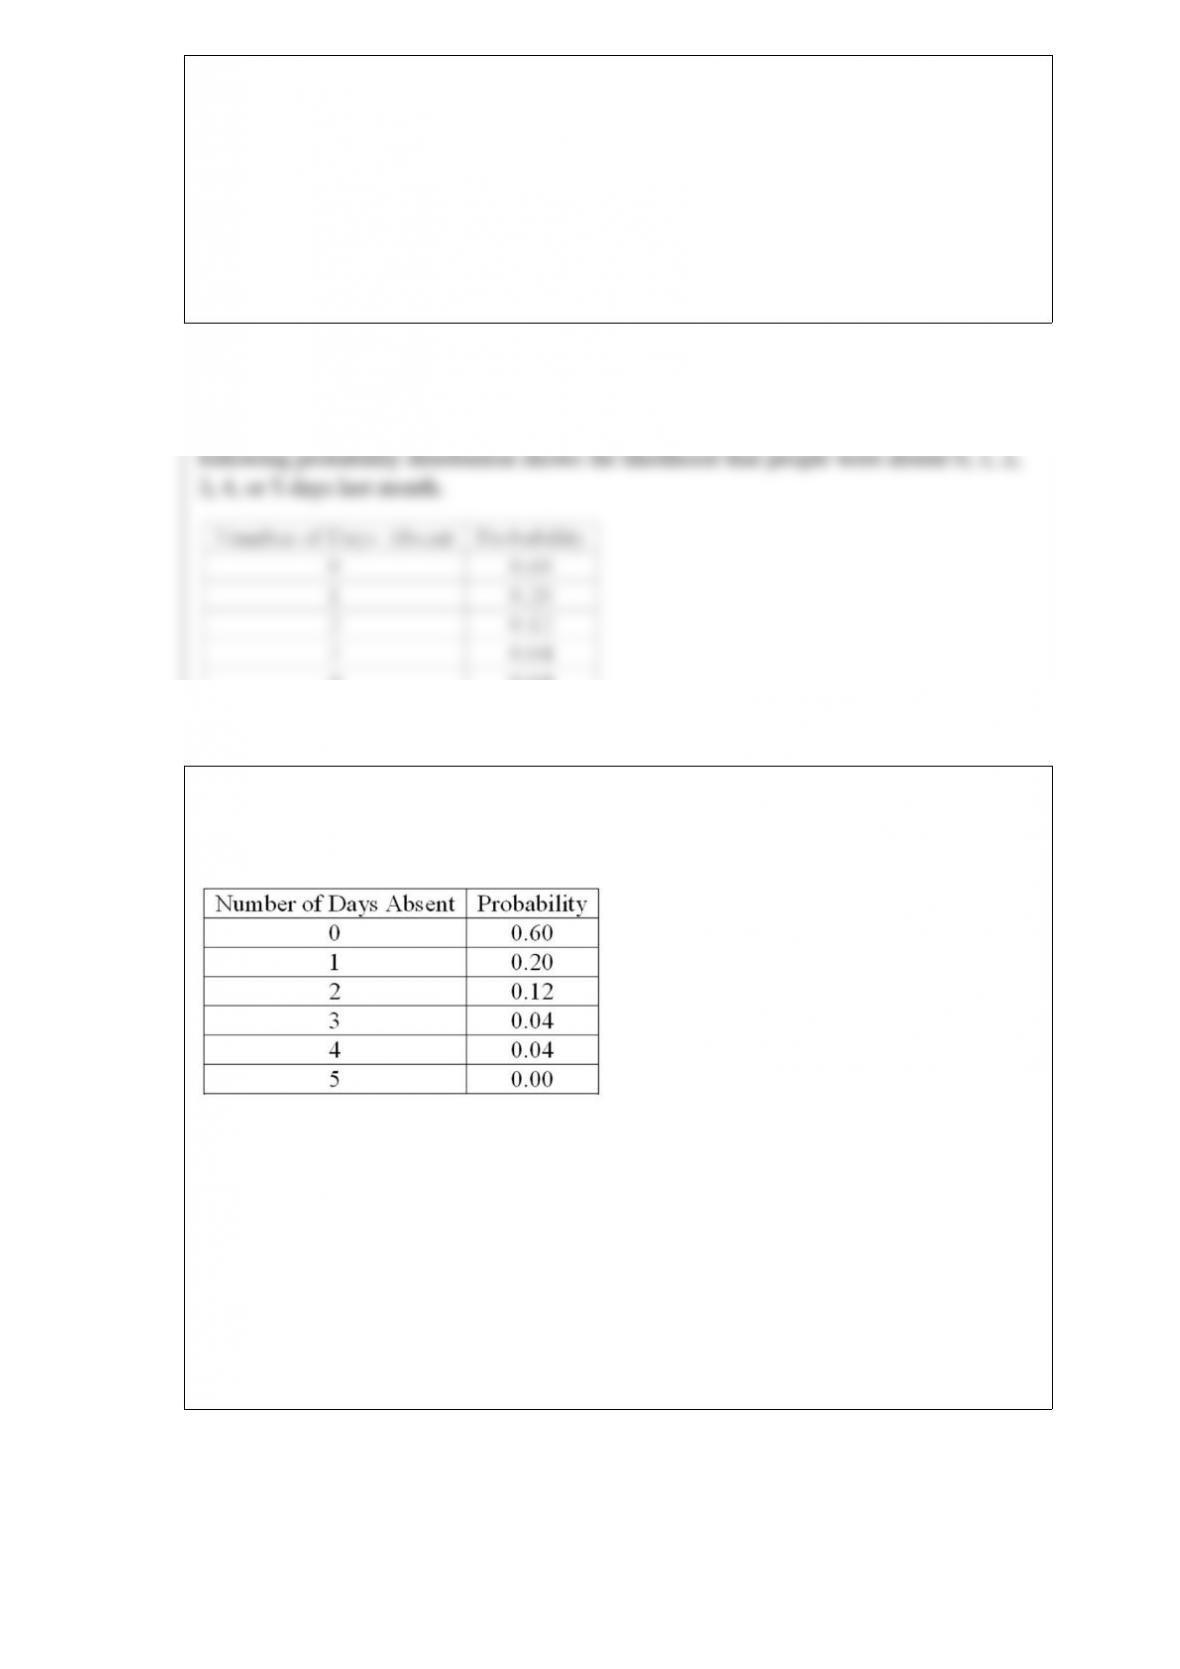
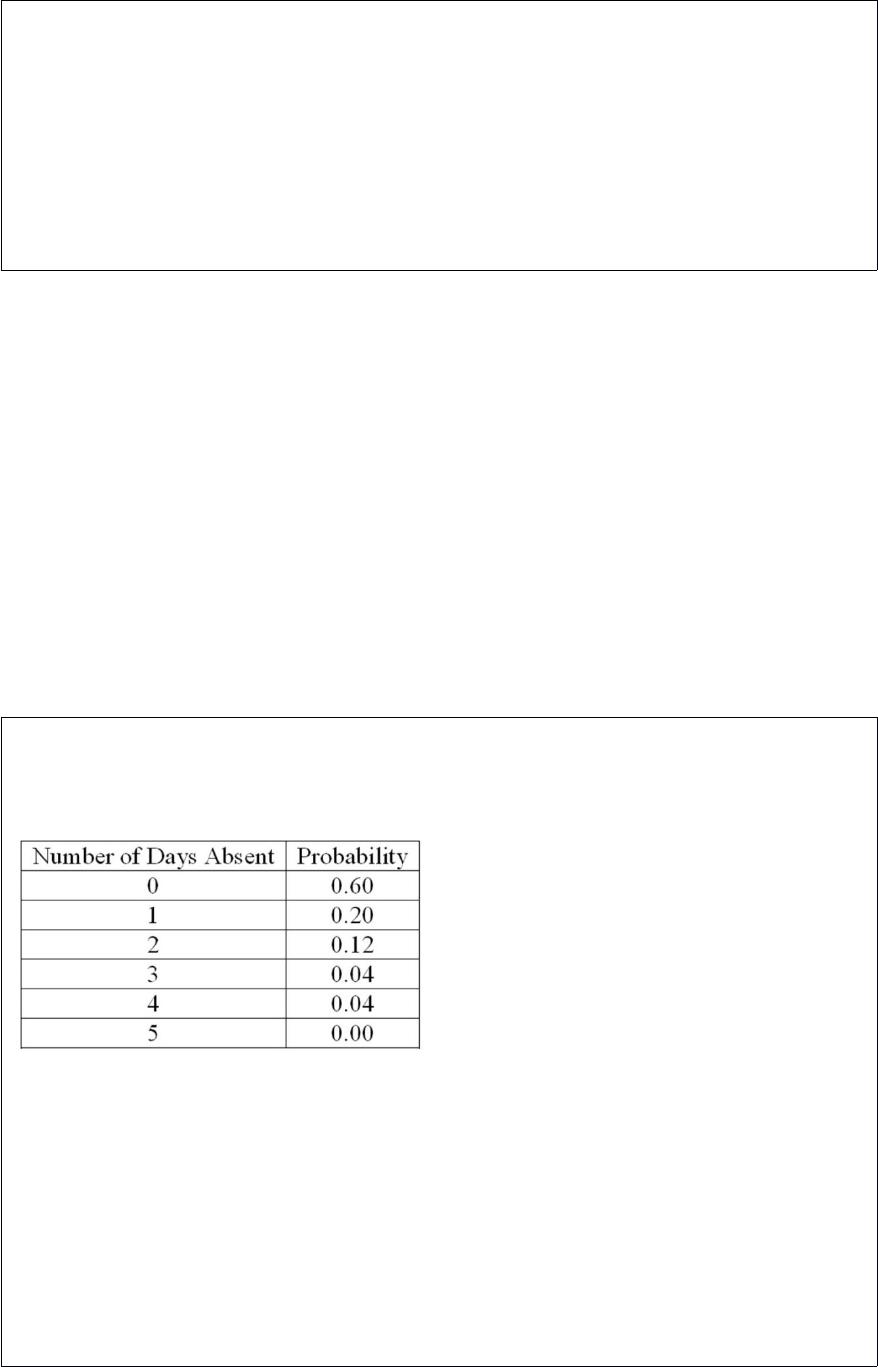
A company is studying the number of monthly absences among its 125 employees. The
following probability distribution shows the likelihood that people were absent 0, 1, 2,
3, 4, or 5 days last month.
What is the standard deviation of the number of days absent?
A. 1.1616
B. 0
C. 1.6595
D. 1.0778
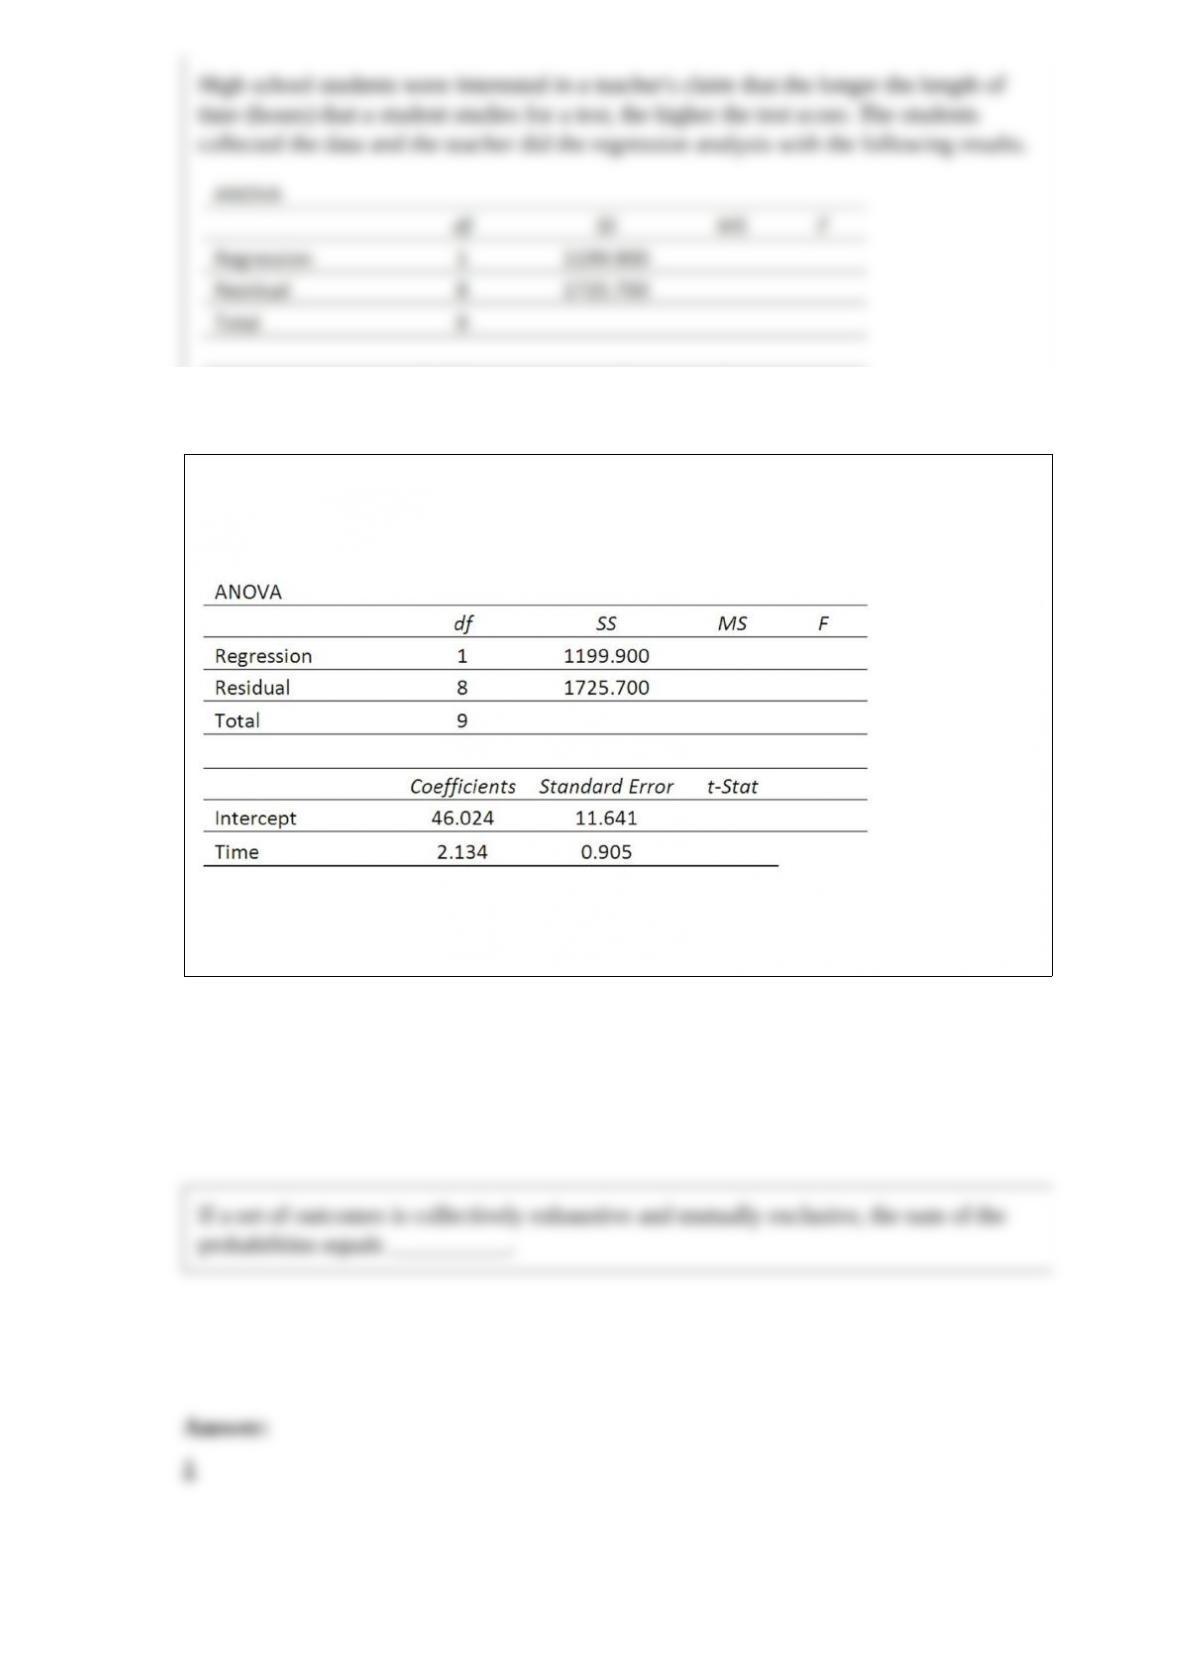
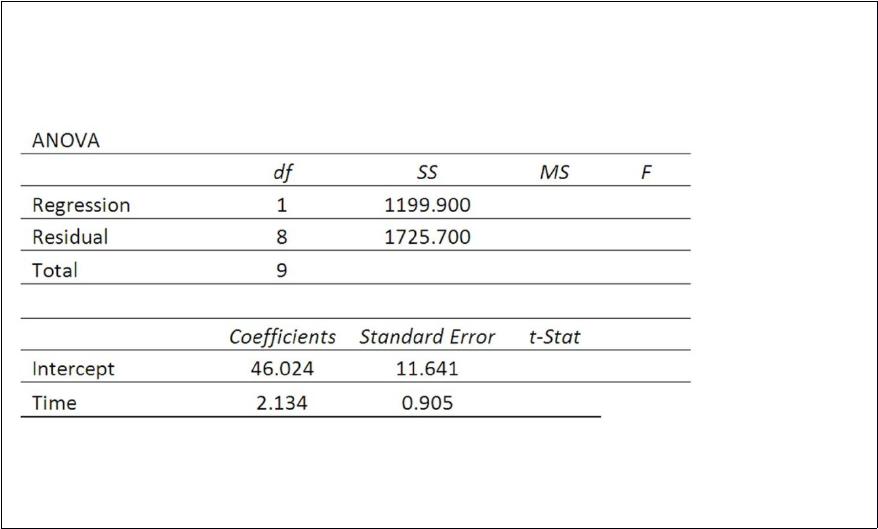
High school students were interested in a teacher’s claim that the longer the length of
time (hours) that a student studies for a test, the higher the test score. The students
collected the data and the teacher did the regression analysis with the following results.
To test the null hypothesis that no relationship exists between study time and score,
what are the F test statistic and the F-critical value using the 0.05 significance level?

If a set of outcomes is collectively exhaustive and mutually exclusive, the sum of the
probabilities equals __________.
The purpose of pooling the sample proportions when testing the difference between two
population proportions is to ___________.
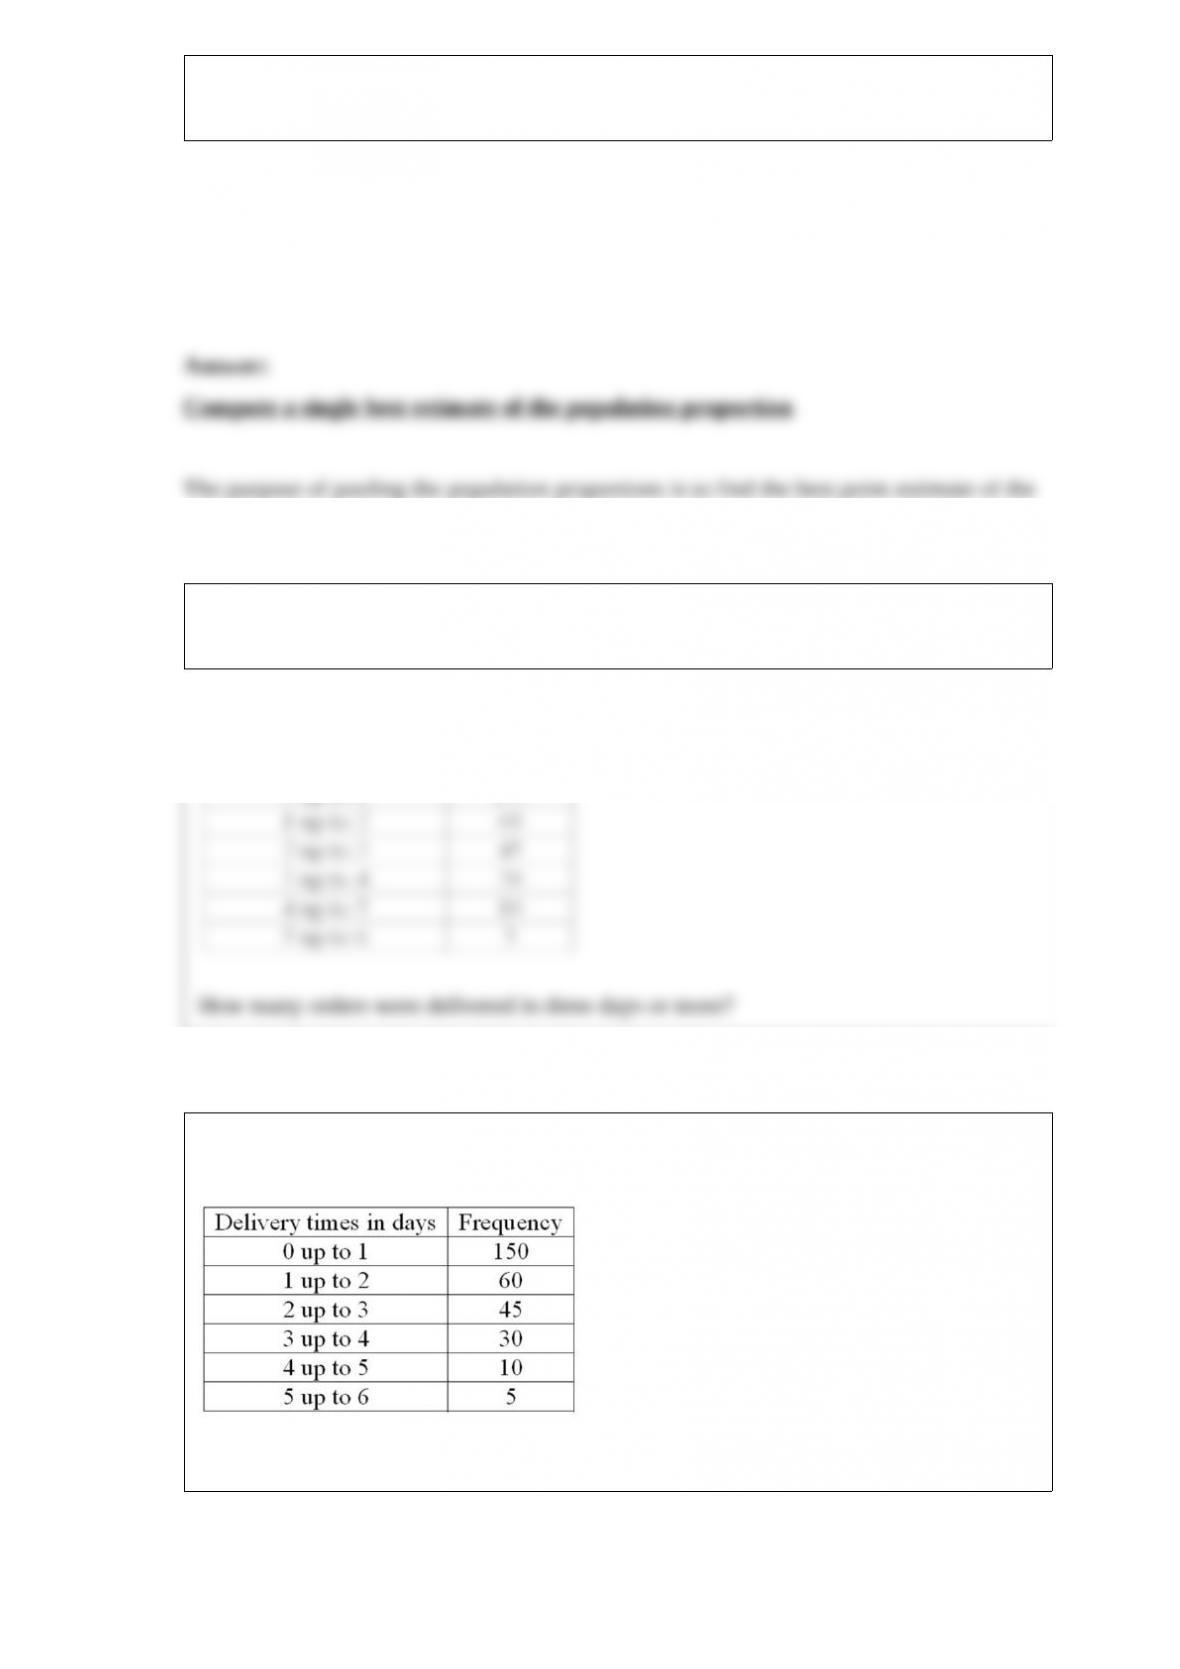
The following frequency distribution shows the distribution of delivery times (in days)
for swimstuff.com customer orders during the last month.
How many orders were delivered in three days or more?


A _______________ random variable can assume only a certain number of separated
values.
A tire manufacturing company is reviewing its warranty for their rainmaker tire. The
warranty is for 40,000 miles. The distribution of tire wear is normally distributed with a
population standard deviation of 15,000 miles. The tire company believes that the tire
actually lasts more than 40,000 miles. A sample of 49 tires revealed that the mean
number of miles is 45,000 miles. What is H0:?


The F distribution is useful when testing a requirement of two-sample tests of
hypothesis. The requirement is _______________.
What is the critical value of t for the claim that the difference of two means is less than
zero with α = 0.025 and sample sizes of nine and seven?


The mean of a normal probability distribution is 60 and the standard deviation is 5. The
percent of observations that are between 50 and 70 is ______.
A data set has 200 observations. In the data, a quantitative variable’s highest value is
1080 and its lowest value is 960. What is the minimum class interval that you would
recommend?
A test statistic is computed using ________________ information.


There are eight flights from Minneapolis to St. Cloud each day. The probability that any
one flight is late is 0.10. Using the binomial probability formula, what is the probability
that 1 or more are late?