For hypotheses that compare two population means, what test statistic is used when the
population standard deviations are unknown?
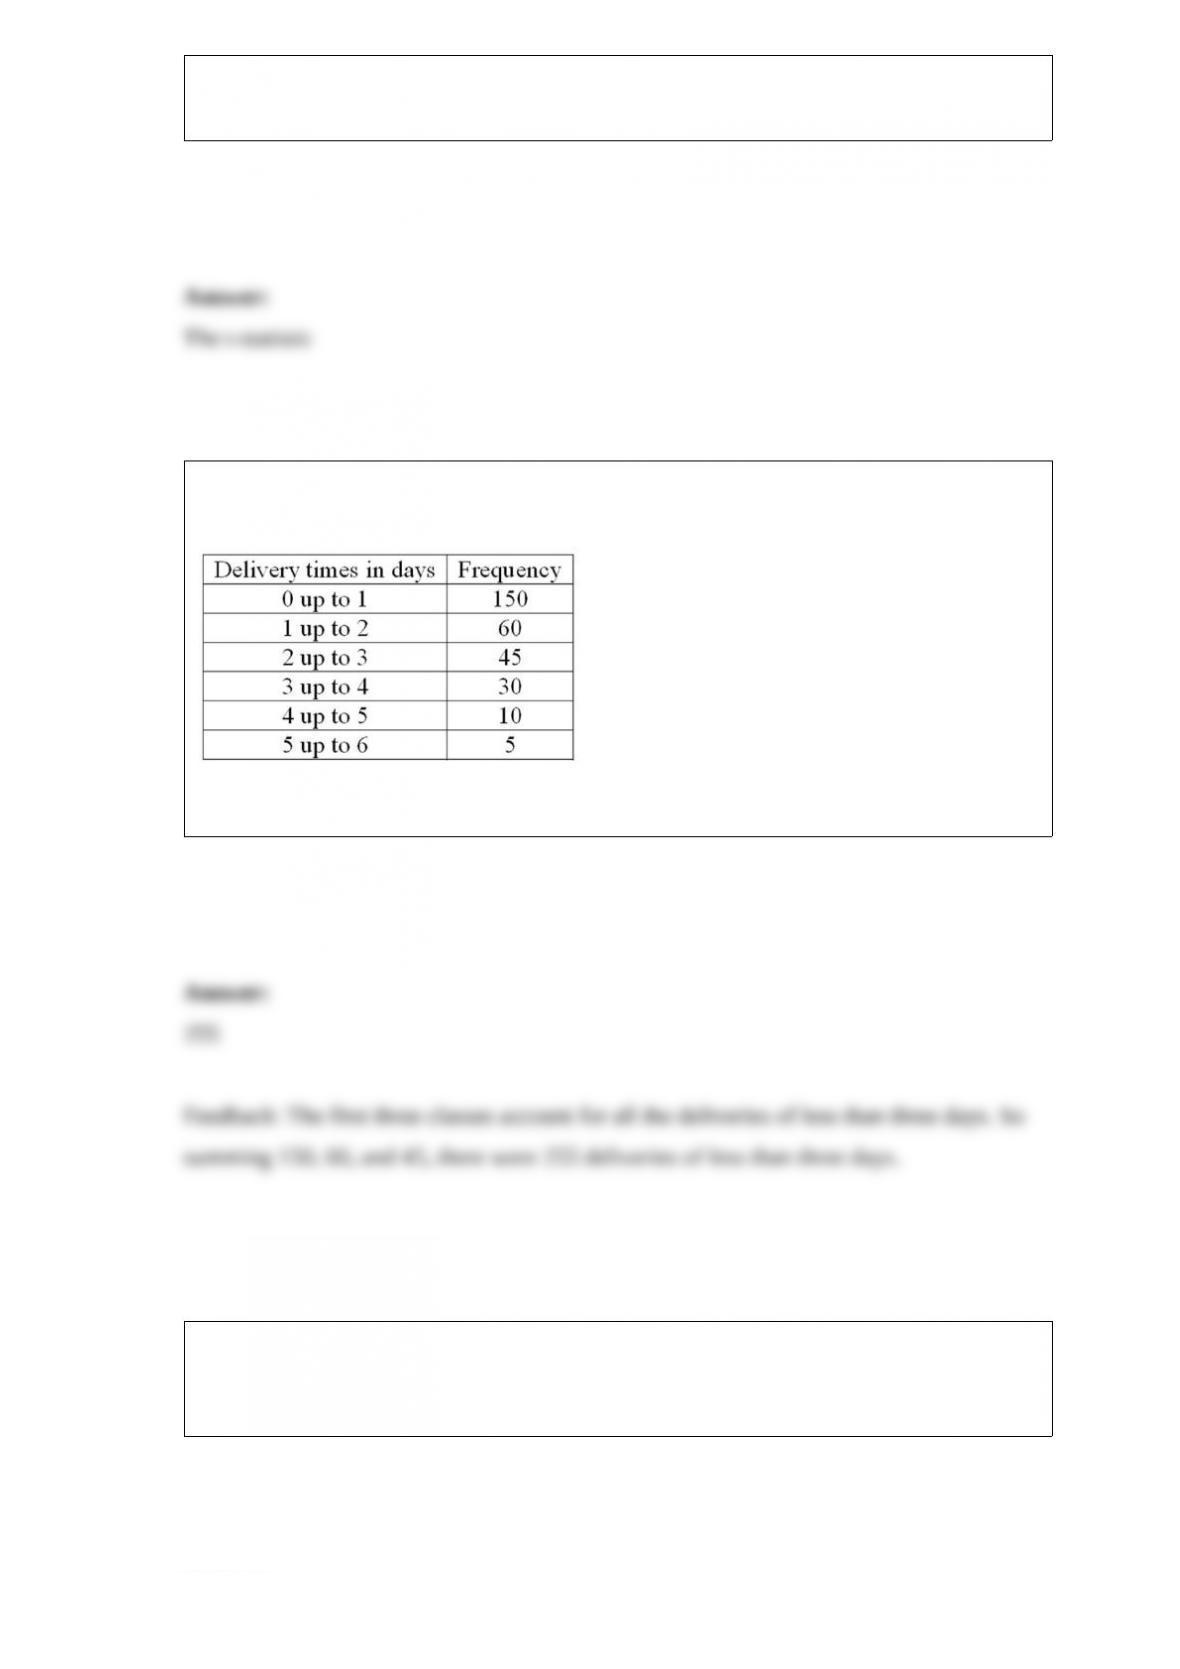
The following frequency distribution shows the distribution of delivery times (in days)
for swimstuff.com customer orders during the last month.
How many orders were delivered in less than three days?
When observing a checkout line at a food store, the average number of people served is
30 per hour. Using the Poisson distribution, what is the probability that 20 people check
out in any given hour?
For the following data, are any of the observations an outlier?
If a dependent variable and one of the independent variables are inversely related, the
sign for the regression coefficient of the independent variable is ____________.
When observing a checkout line at a food store, the average number of people served is
15 per hour. Using the Poisson distribution, what is the probability that 10 people check
out in any given hour?
A manufacturer wants to increase the shelf life of a line of cake mixes. Past records
indicate that the average shelf life of the mix is 216 days. After a revised mix has been
developed, a sample of nine boxes of cake mix had a mean of 217.222 and a standard
deviation of 1.2019. At the 0.025 significance level, decide if the sample data support
the claim that shelf life has increased. State your decision in terms of the null
hypothesis.
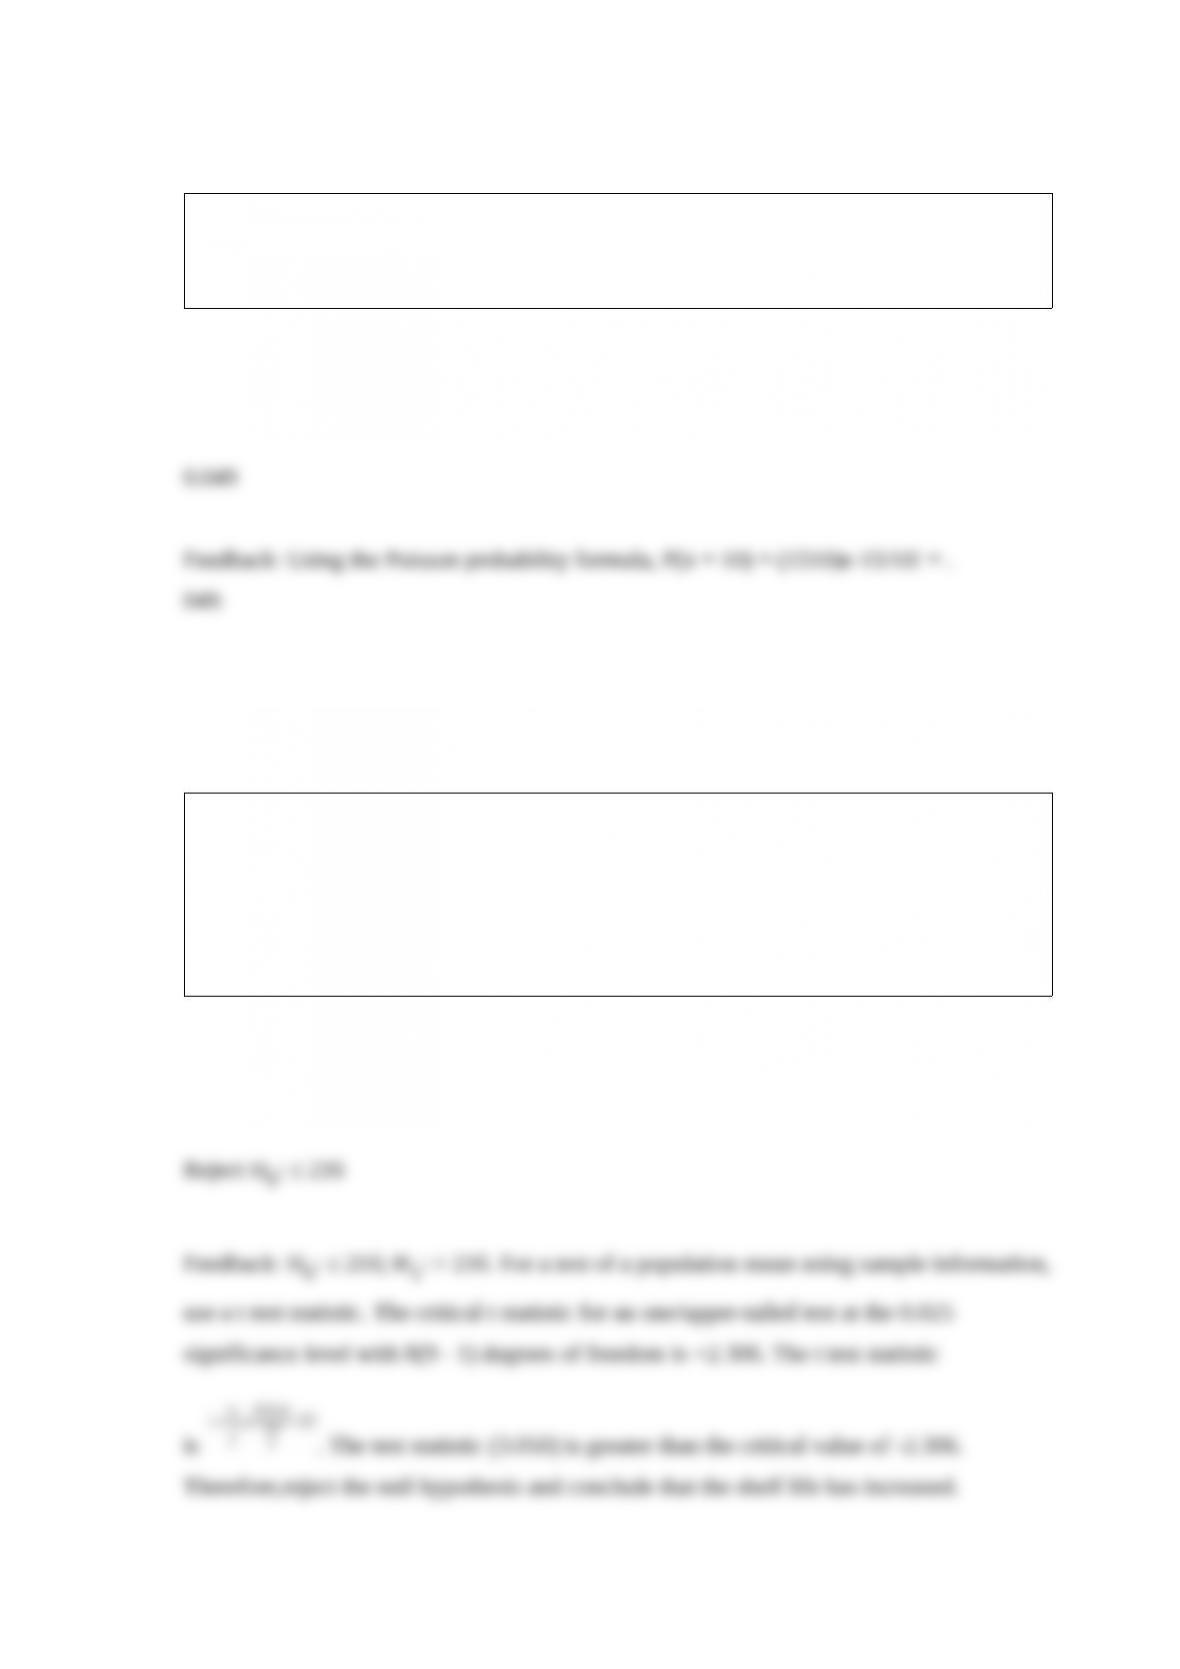
We are interested in knowing if the following frequency distribution is normally
distributed. The population mean and standard deviation of the data are 600 and 160,
respectively.
What are the standard normal z-statistic class limits for the “800 up to 1000” class?
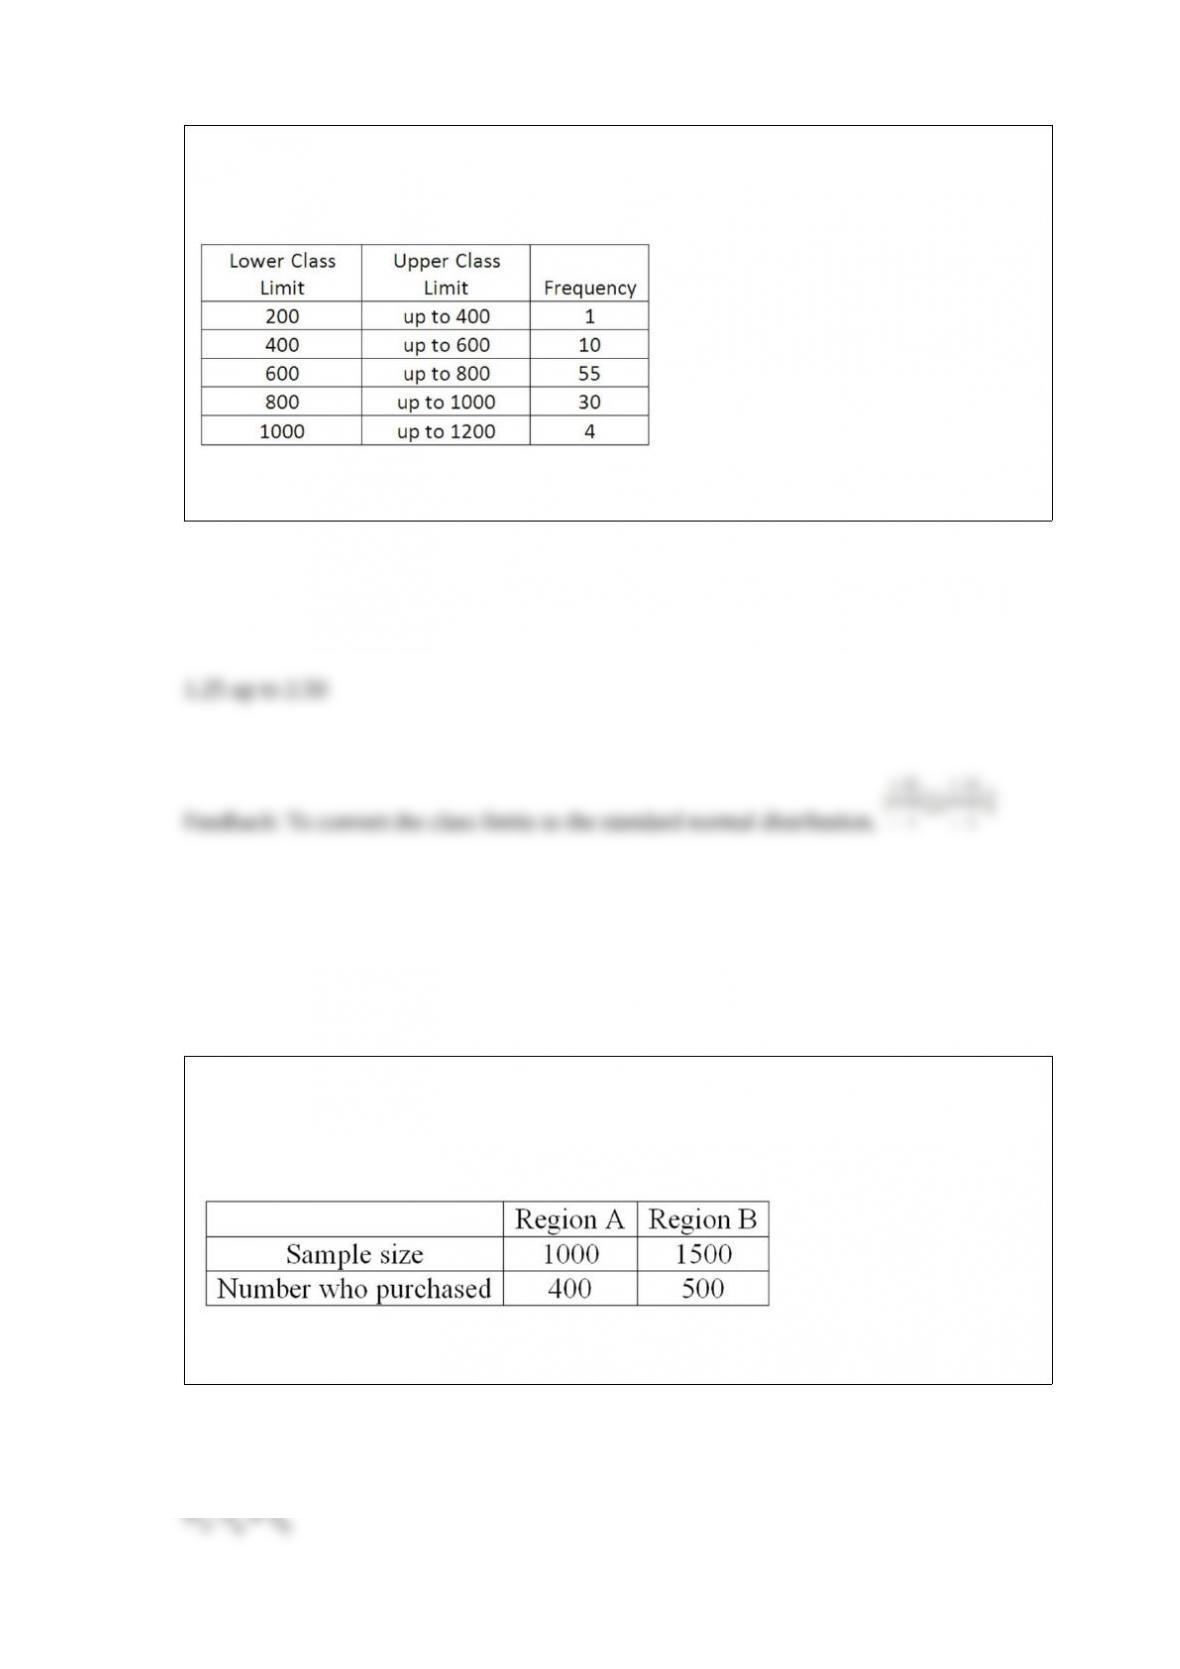
To compare the effect of weather on sales of soft drinks, a distributor surveyed people
in two regions of the country and asked if they purchased soft drinks in the last month.
The following are the results. The distributor would like to know if there is a difference
in sales between the two regions.
What is the alternate hypothesis?
The relationship between interest rates as a percent (X) and housing starts (Y) is given
by the linear equation Ŷ = 4094 – 269X. What happens to housing starts as interest rates
fall?
A probability distribution is a listing of the expected outcomes of an experiment and the
probability of each outcome occurring. The sum of the probabilities is ______.
The probability that an interval estimate includes the population parameter is called the
_____________.
In a deck of cards, a class of all cards that are hearts and a class of all cards that are
kings are NOT _____________.
A tire manufacturing company is reviewing its warranty for their rainmaker tire. The
warranty is for 40,000 miles. The distribution of tire wear is normally distributed with a
population standard deviation of 15,000 miles. The tire company believes that the tire
actually lasts more than 40,000 miles. A sample of 49 tires revealed that the mean
number of miles is 45,000 miles. To test the hypothesis at a 0.05 significance level,
what is the decision rule?
A probability is calculated by dividing the number of desired outcomes by the total
number of occurrences. This approach to probability is called __________.
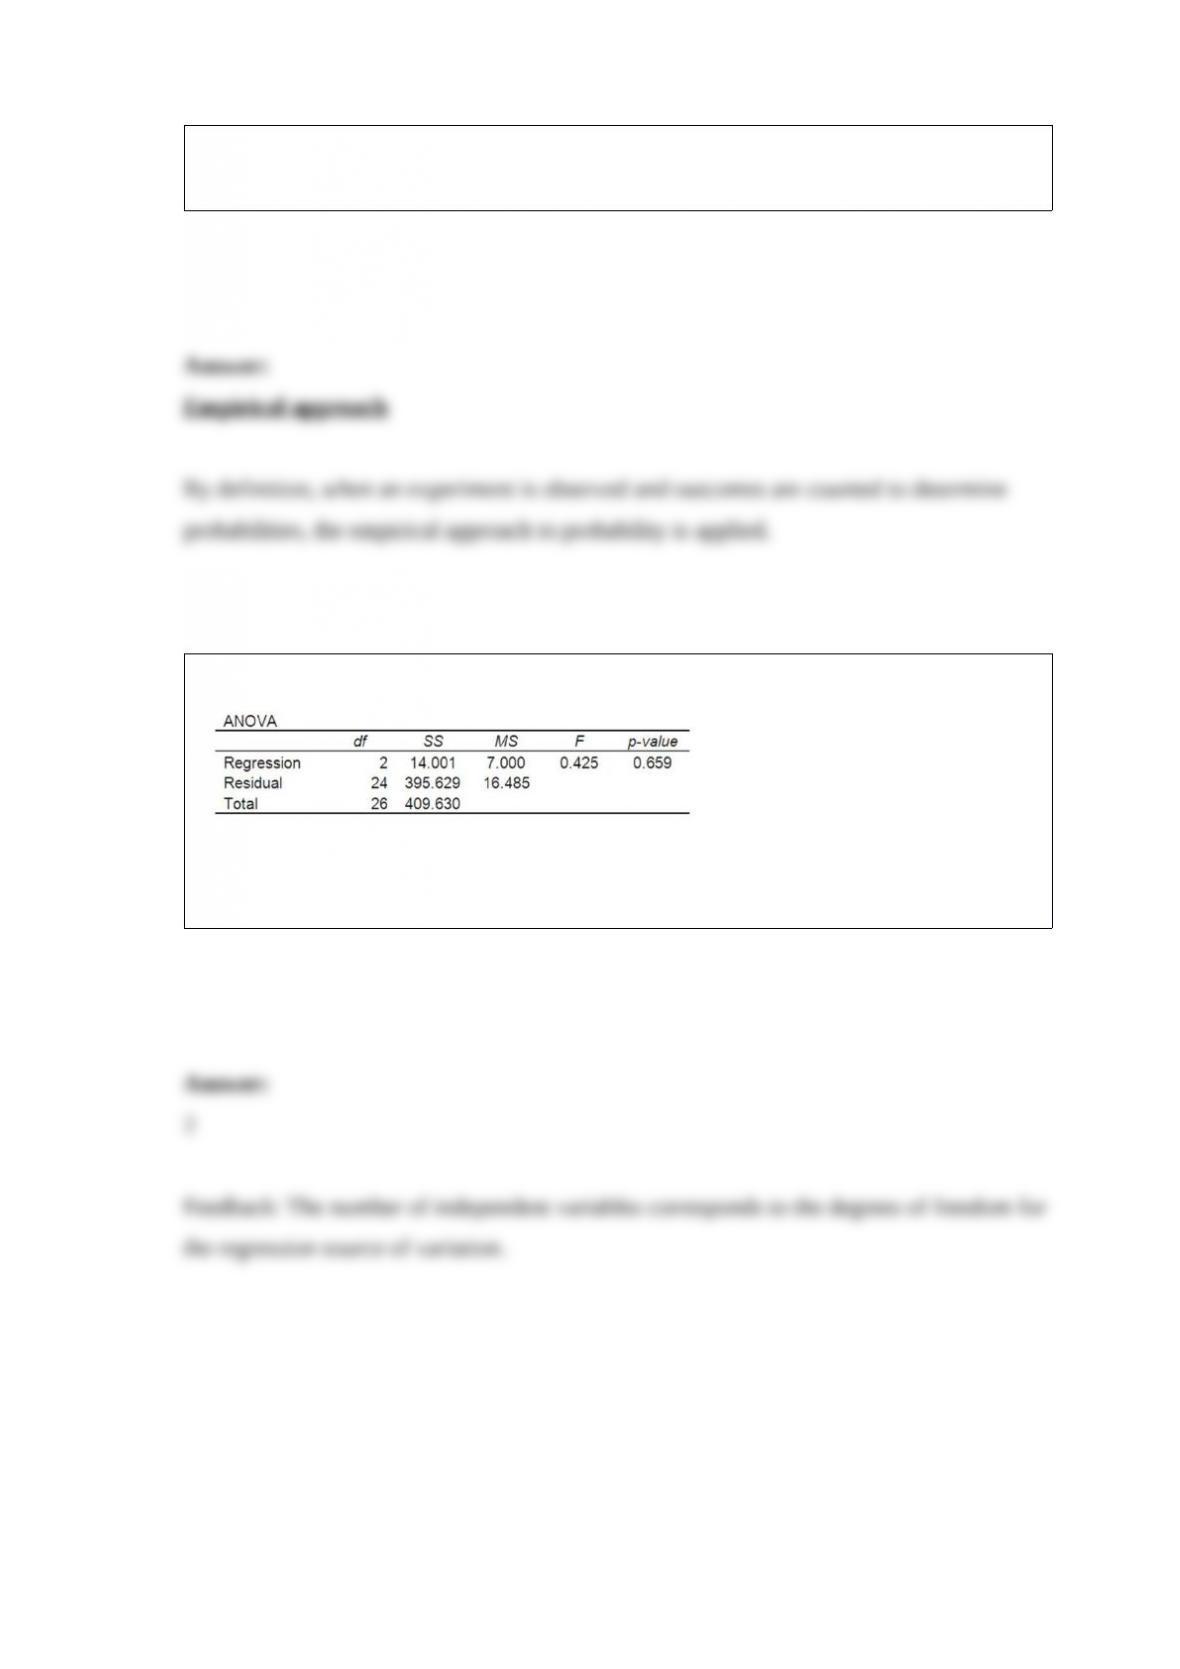
A multiple regression analysis showed the following ANOVA table result.
Based on the information in the ANOVA, how many independent variables were
included in the multiple regression analysis?