Travelocity would like to test if the standard deviation for roundtrip airfares between
New York and London is less than $200. A random sample of 22 roundtrip airfares
between New York and London had a standard deviation of $142. The test statistic for
this hypothesis test would be ________.
A) 7.03
B) 8.67
C) 10.59
D) 13.36
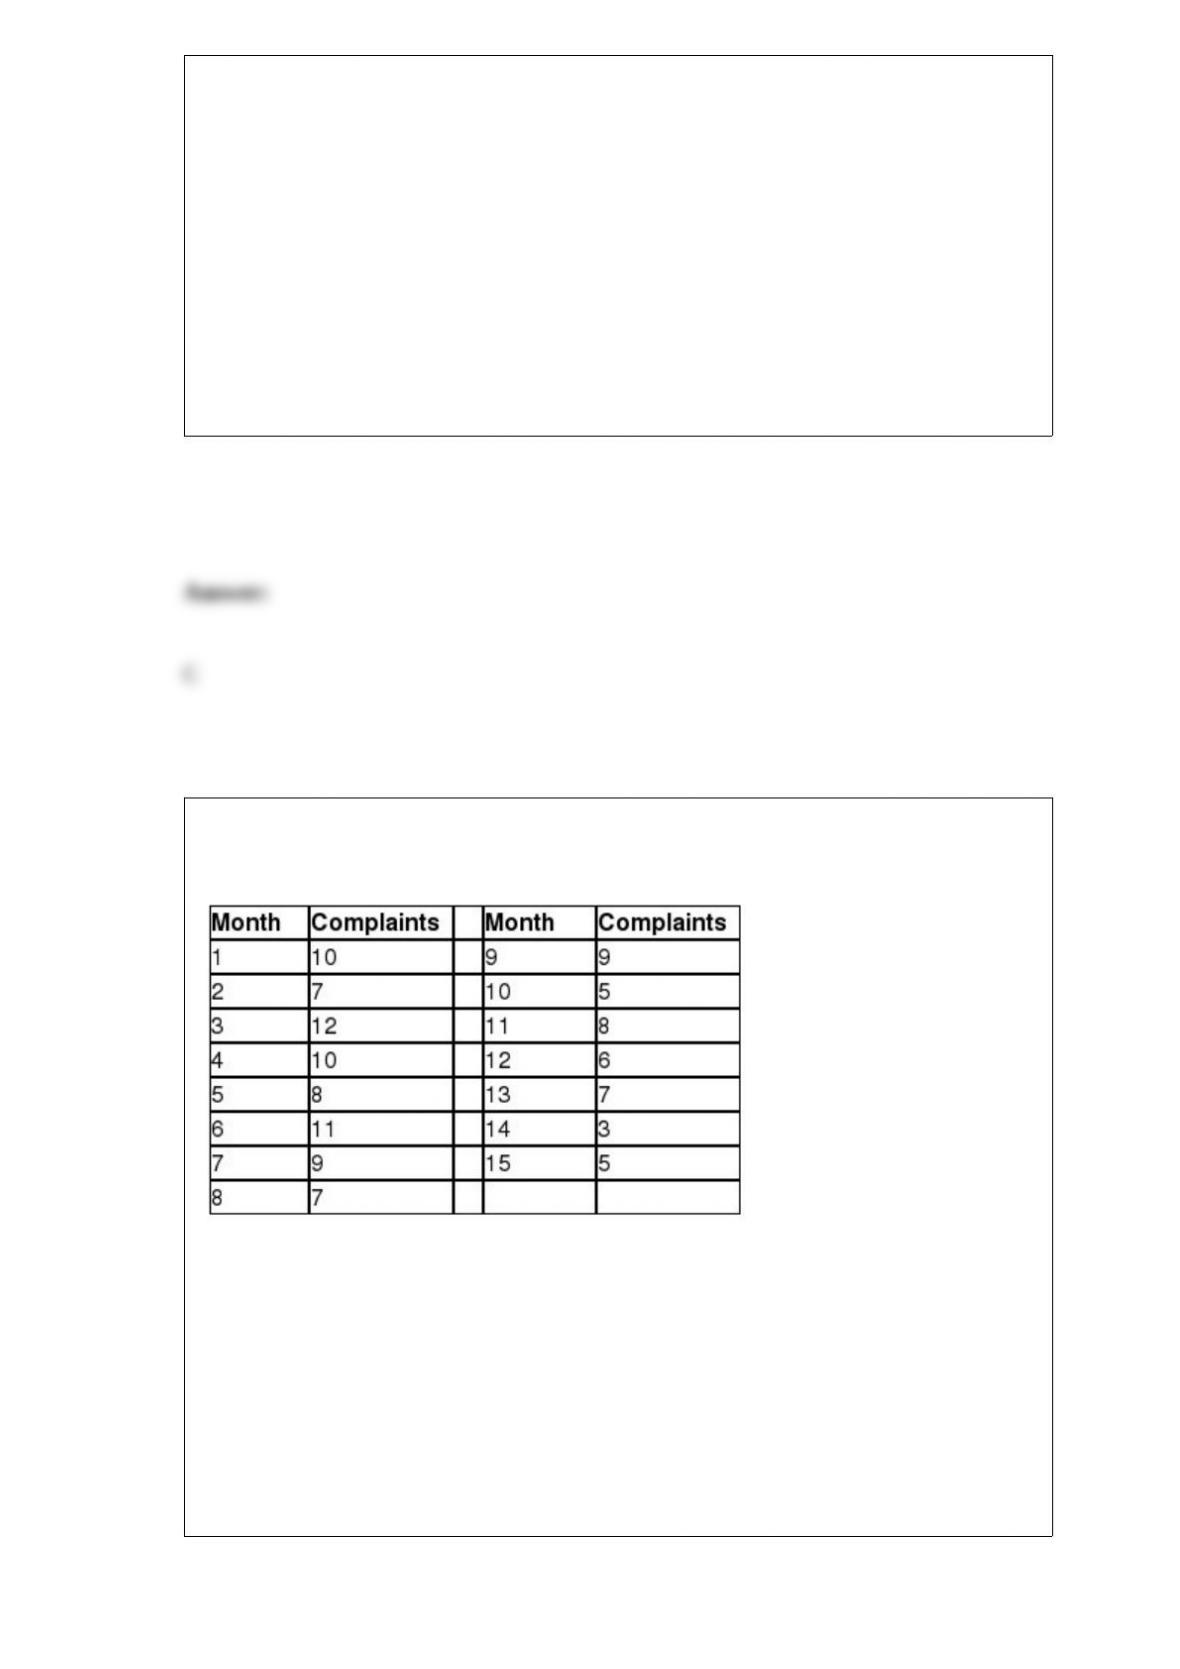
The following data represent the number of complaints per month that customer service
received at a large retailer over the last 15 months.
The mean absolute deviation using trend projection is ________.
A) 1.05
B) 1.36
C) 3.42
D) 4.19
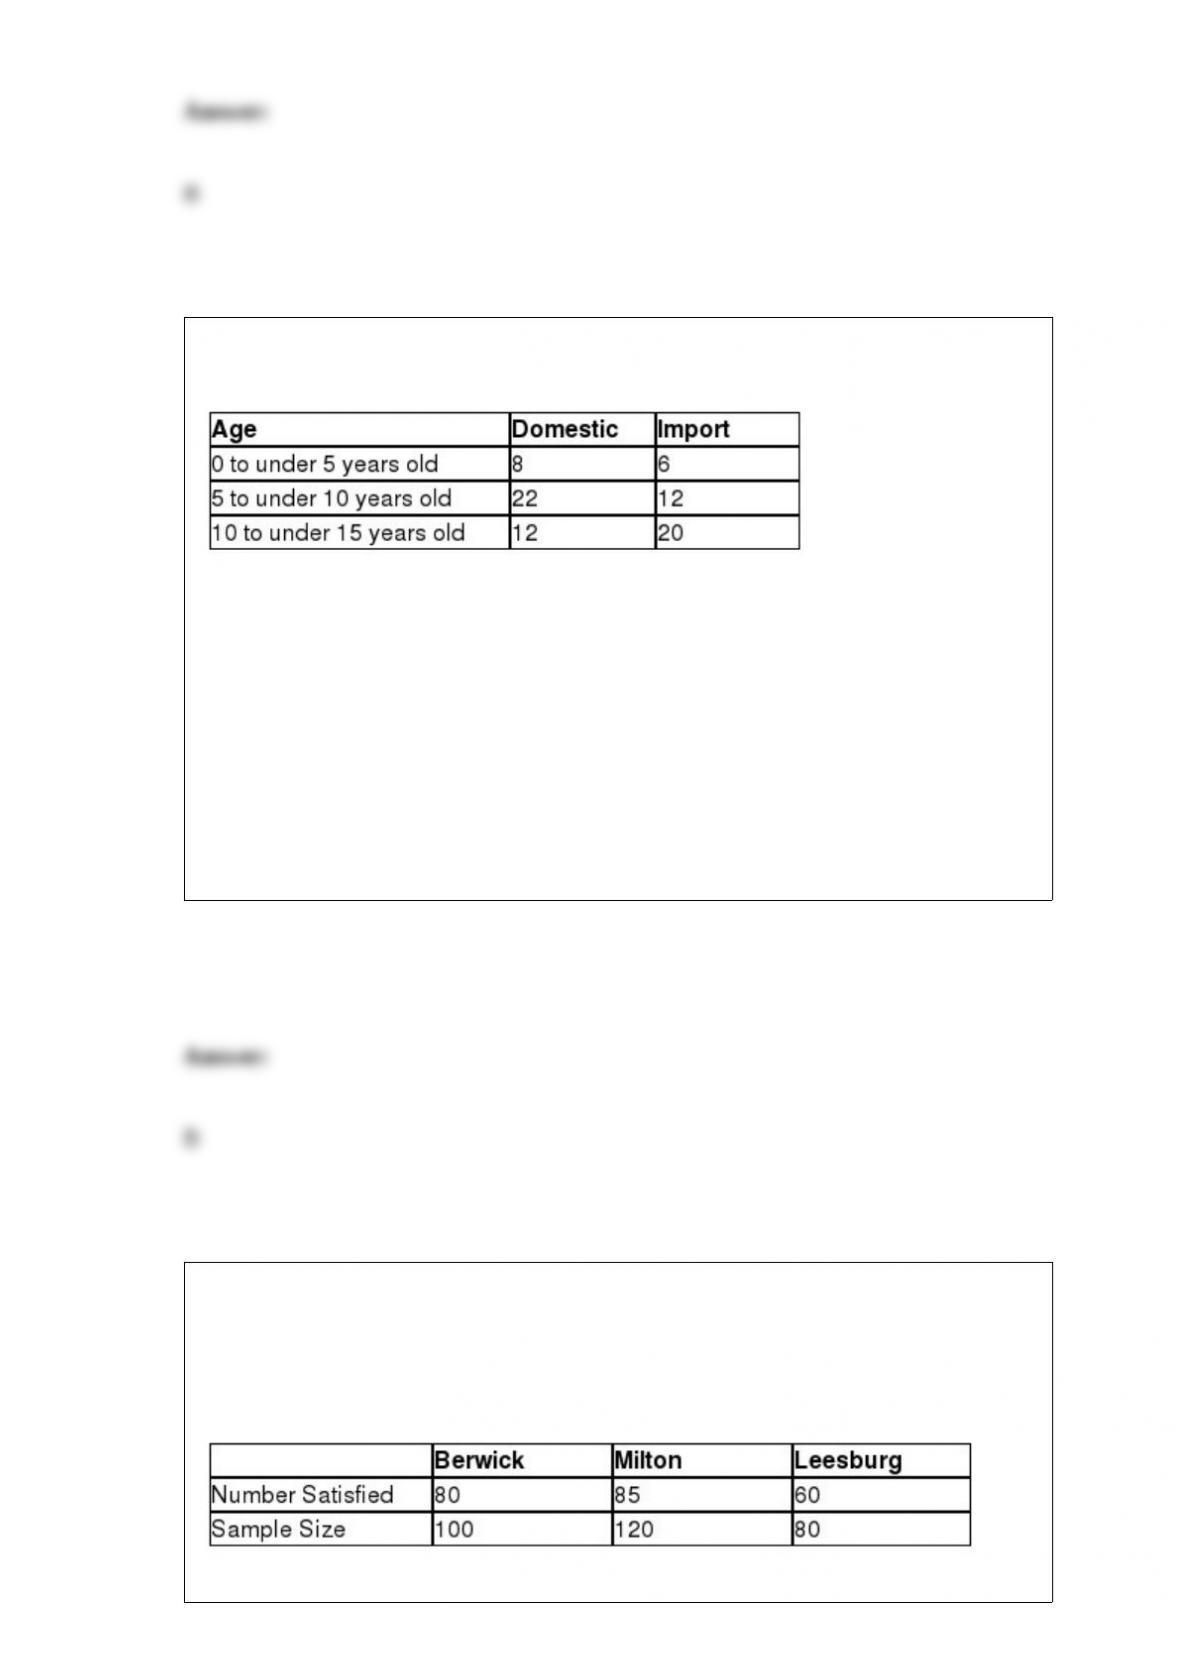
Dempsey’s Garage repairs domestic and import cars. The following table shows the
number of cars that have been serviced by age and type during the last month.
Given that a randomly selected car from this sample was an import, the probability that
the car was from 5 to under 10 years old is ________.
A) 0.158
B) 0.316
C) 0.487
D) 0.600
Lisa is a regional manager for a restaurant chain that has locations in the towns of
Berwick, Milton, and Leesburg. She would like to investigate if a difference exists in
the proportion of customers who rate their experience as satisfactory or better between
the three locations. The following data represent the number of customers who
indicated they were satisfied from random samples taken at each location.
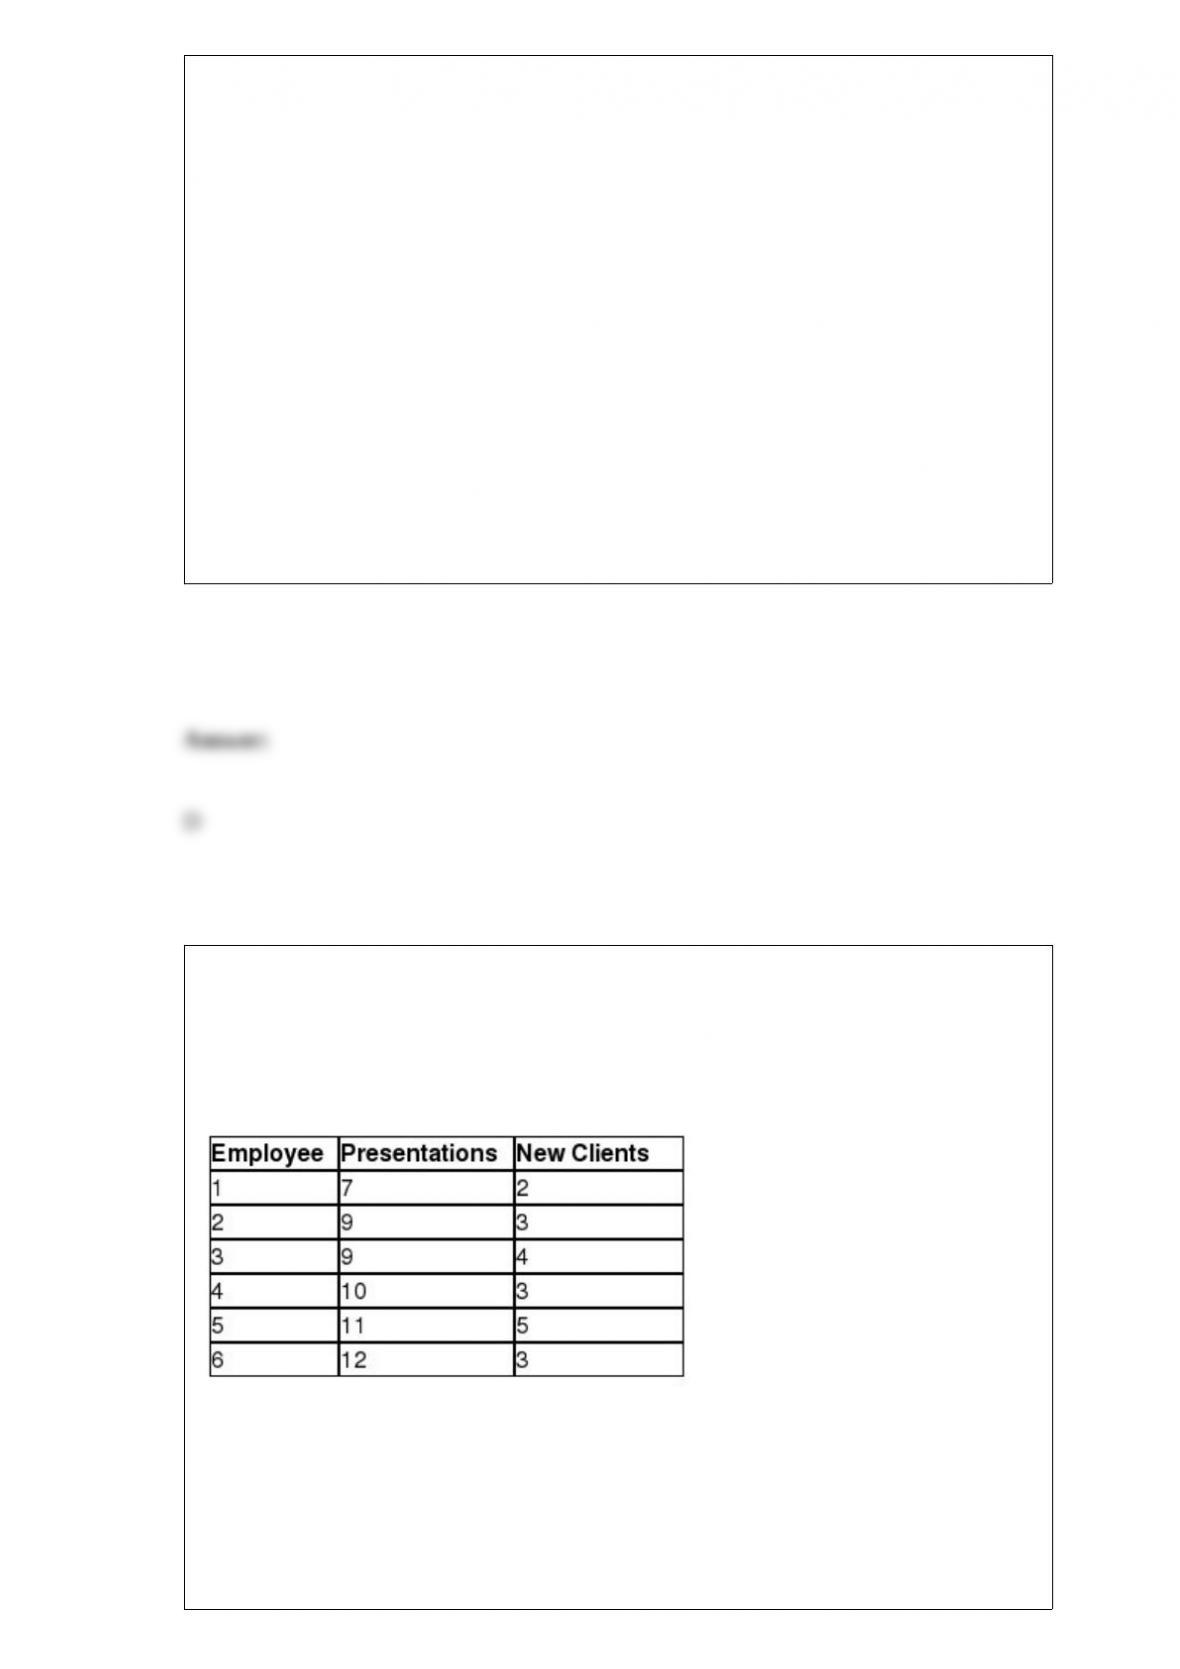
Using α = 0.05, the conclusion for this chi-square test would be that because the test
statistic is
___________________________________________________________________.
A) more than the critical value, we can reject the null hypothesis and conclude that
there is a difference in proportion of satisfied customers between these three locations
B) less than the critical value, we can reject the null hypothesis and conclude that there
is a difference in proportion of satisfied customers between these three locations
C) more than the critical value, we cannot reject the null hypothesis and conclude that
there is no difference in proportion of satisfied customers between these three locations
D) less than the critical value, we cannot reject the null hypothesis and cannot conclude
that there is a difference in proportion of satisfied customers between these three
locations
Sarah is the office manager for a group of financial advisors who provide financial
services for individual clients. She would like to investigate whether a relationship
exists between the number of presentations made to prospective clients in a month and
the number of new clients per month. The following table shows the number of
presentations and corresponding new clients for a random sample of six employees.
Sarah would like to use simple regression analysis to estimate the number of new
clients per month based on the number of presentations made by the employee per
month. The sum of squares error for this sample is ________.
A) 2.26

B) 3.06
C) 3.91
D) 11.25
Costco installs automobile tires on a first-come first-serve basis. The total time a
customer needs to wait for the installation to be completed follows the normal
distribution with a mean time of 106.3 minutes and a standard deviation of 18.5
minutes. The interval around the mean that contains 68% of the wait time for customers
is ________.
A) 87.8, 124.8
B) 69.3, 143.3
C) 50.8, 161.8
D) 32.3, 180.3
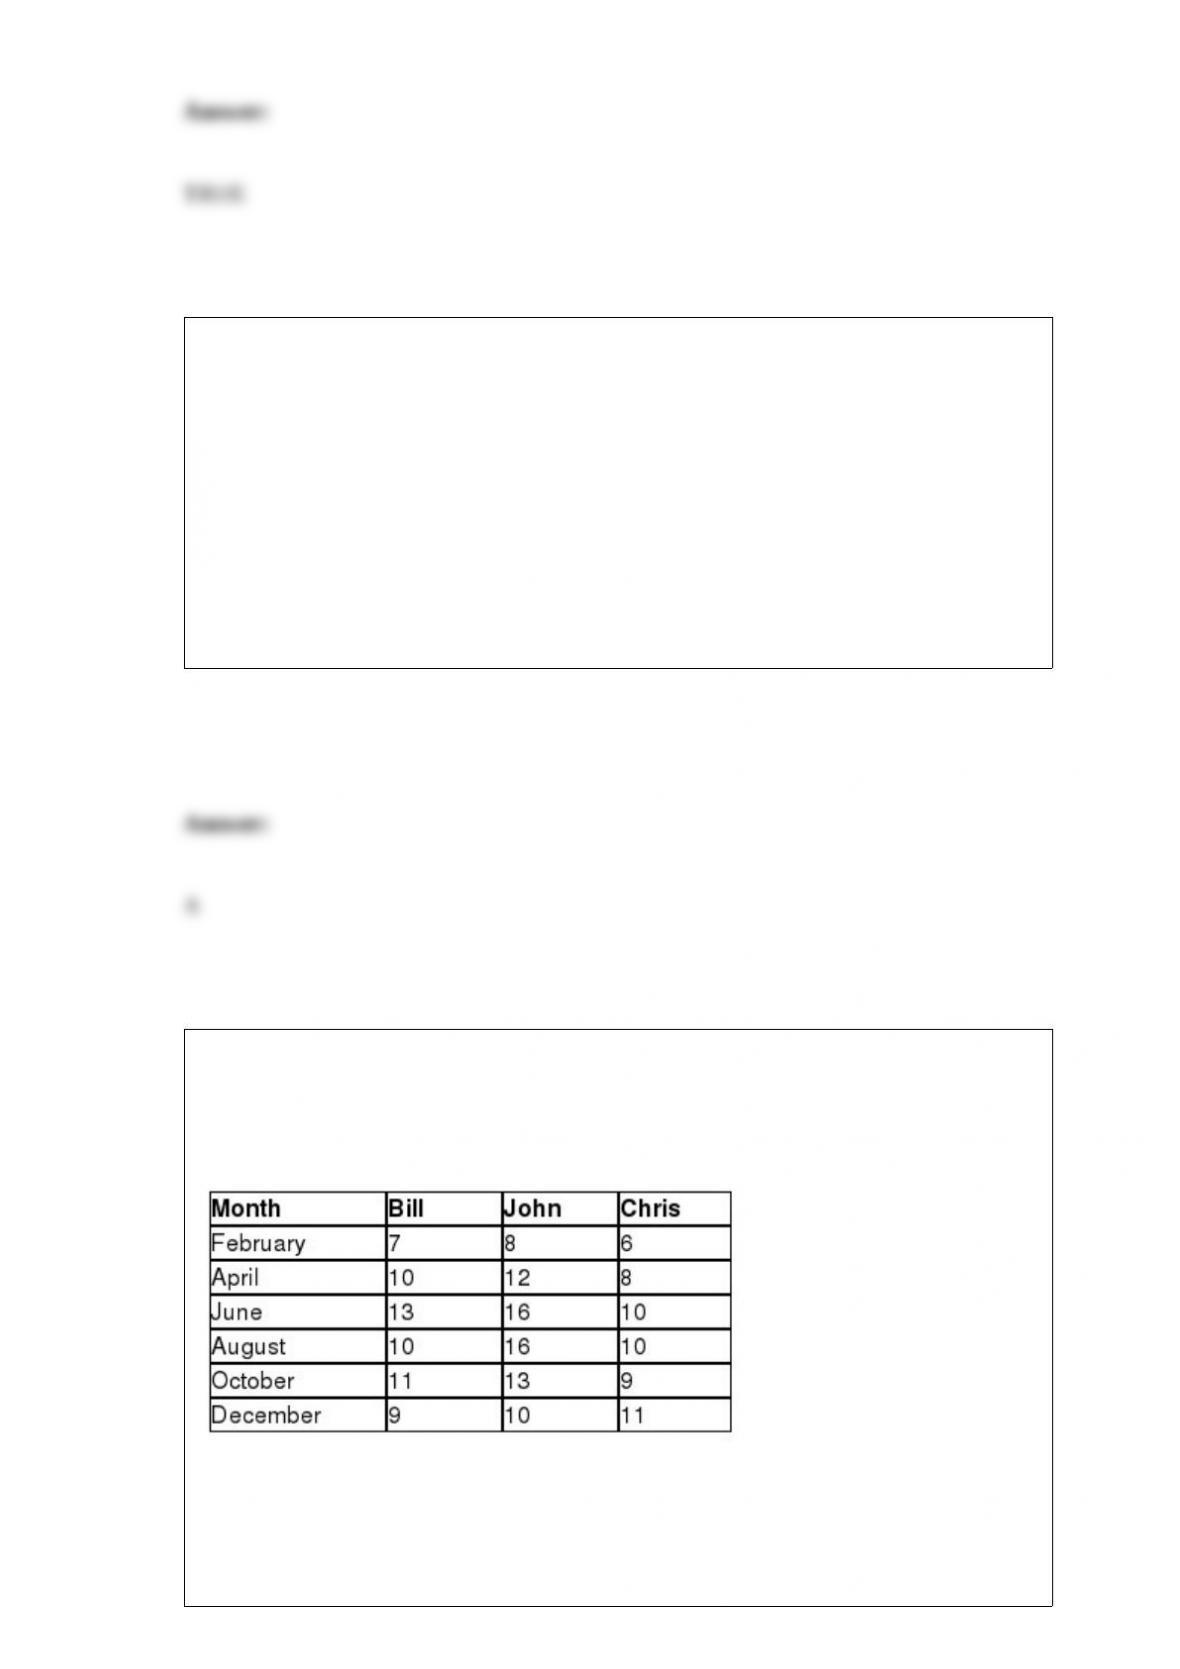
Sheridan Motors is a car dealership that would like to investigate if there is a difference
in the average number of car sales per month between three sales employees using a
randomized block ANOVA. The following data represent the number of car sales last
year for these employees for six different months.
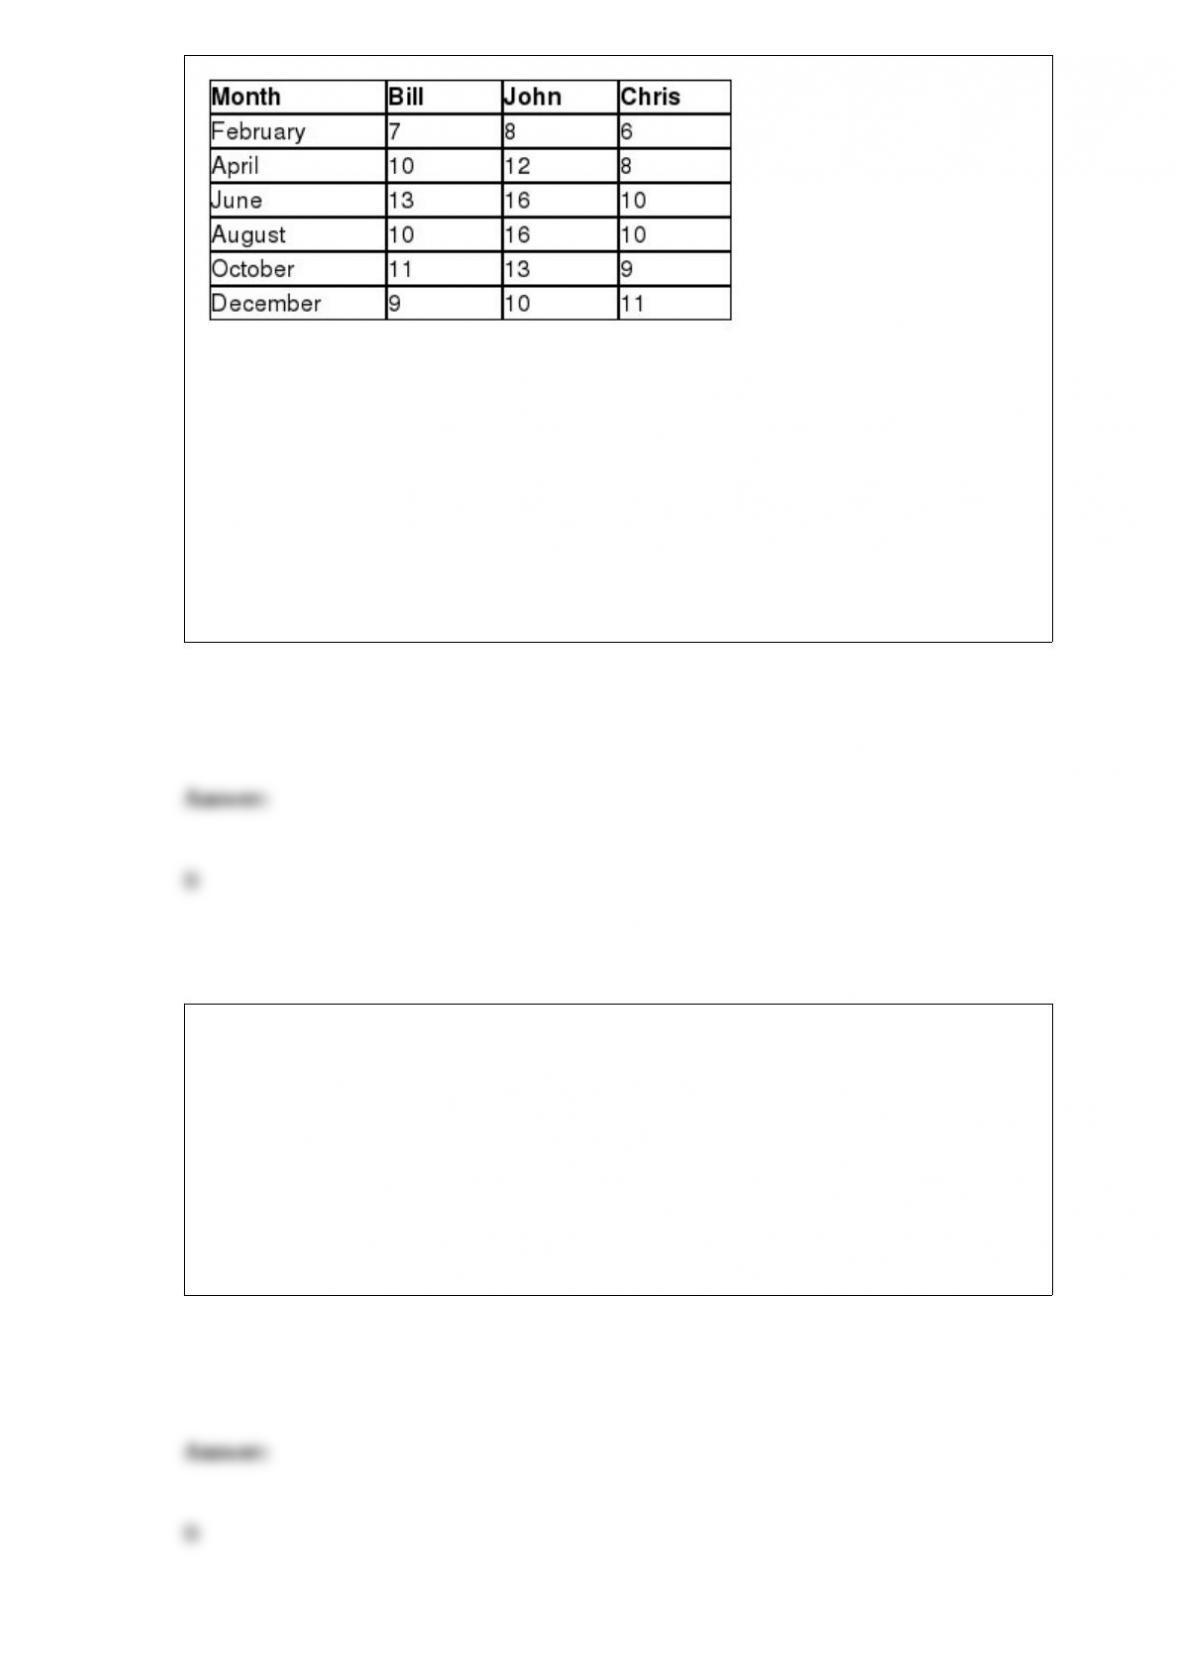
The mean square error for these observations is ________.
A) 1.5
B) 2.3
C) 4.0
D) 4.9
A ________ is a single value that best describes the population of interest.
A) confidence interval
B) point estimate
C) confidence level
D) margin of error

As a concession manager for a local Little League Baseball organization, you are
responsible for ordering hot dogs for the upcoming weekend games. You can purchase
hot dogs for $0.75 each and sell them during the games for $2.50. Any unsold hot dogs
can be returned to the supplier for a $0.25 credit. If you purchase 400 hot dogs and
demand is 600 hot dogs over the weekend, the profit will be _______.
A) “$125
B) $150
C) $350
D) $700
Use the information below to answer the following question(s).
Some research has indicated that as people age they need less sleep. A random sample
of adults was selected and the number of hours that they slept last night was recorded.
Simple regression analysis was performed on this sample and the results are shown
below.
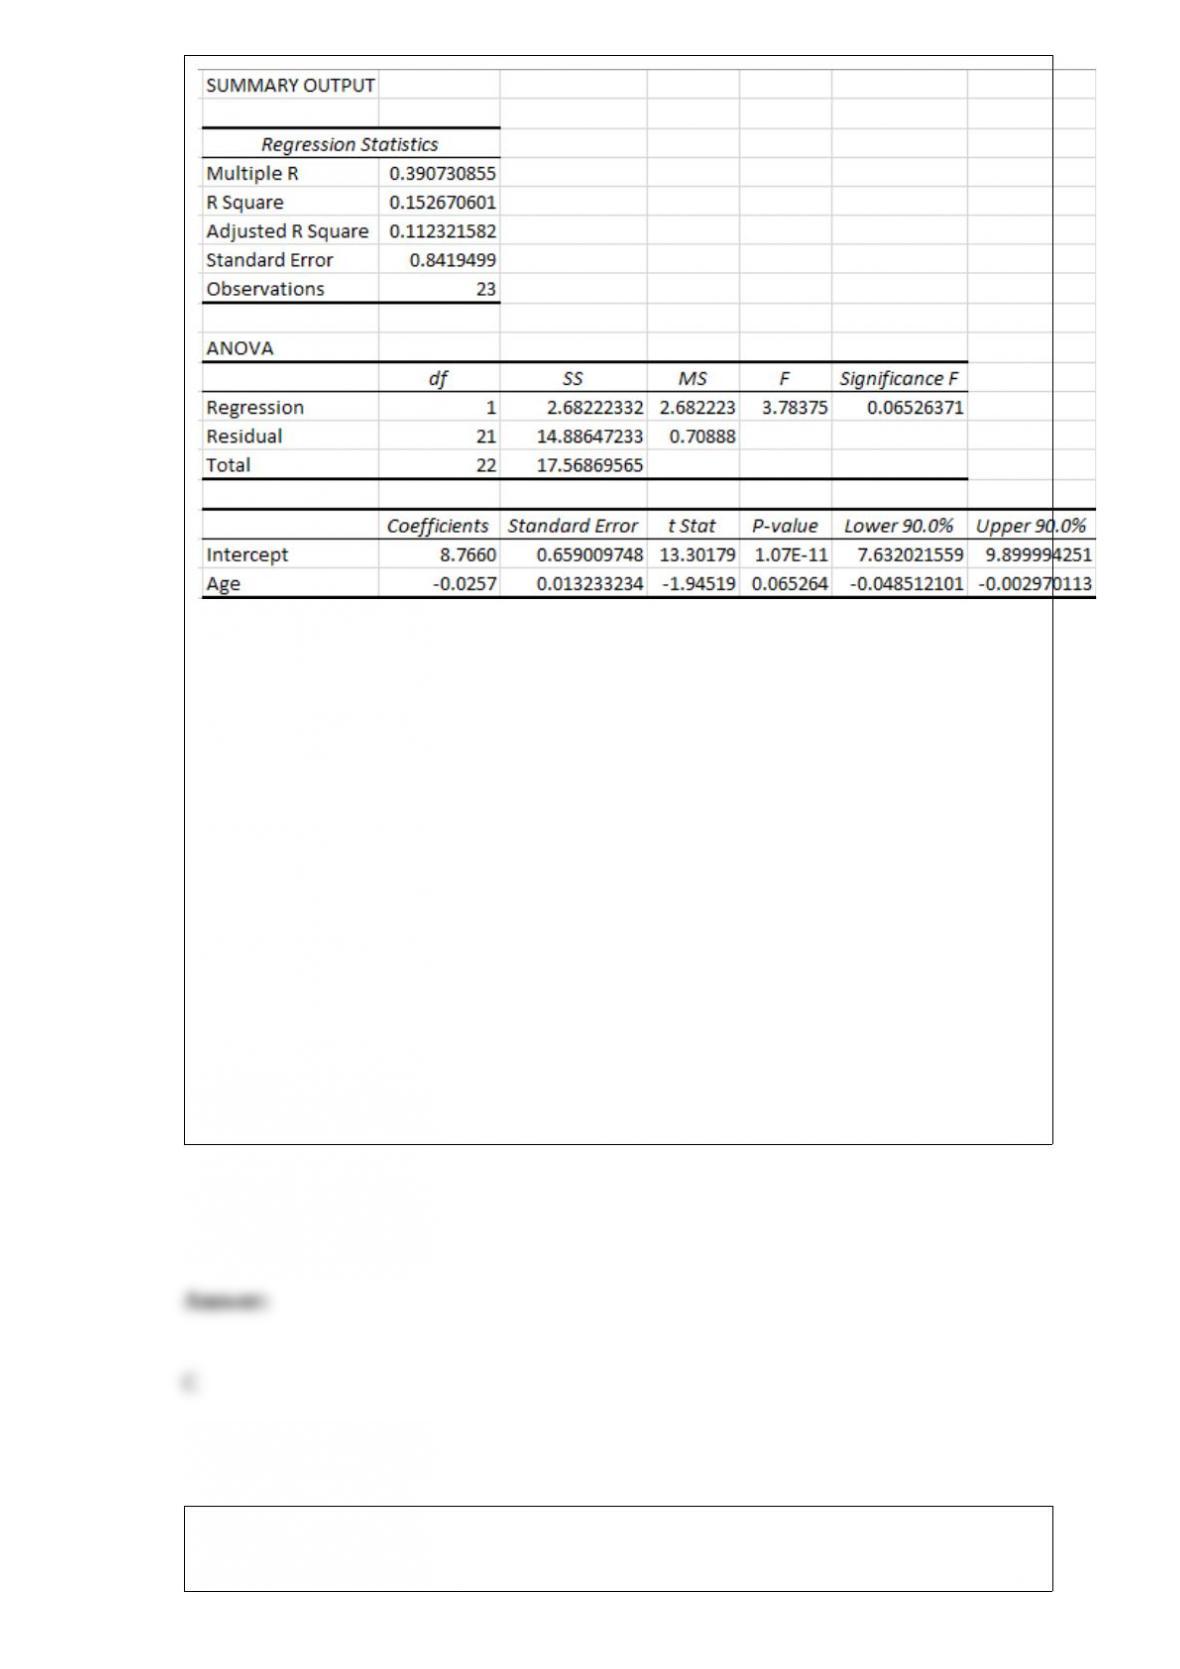
Which one of the following statements is true using α = 0.10?
A) Because the 90% confidence interval for the population slope includes zero, we can
reject the null hypothesis and conclude that there is a relationship between the hours of
sleep and the age of the adult.
B) Because the 90% confidence interval for the population slope includes zero, we fail
to reject the null hypothesis and conclude that there is no relationship between the hours
of sleep and the age of the adult.
C) Because the 90% confidence interval for the population slope does not include zero,
we can reject the null hypothesis and conclude that there is a relationship between the
hours of sleep and the age of the adult.
D) Because the 90% confidence interval for the population slope does not include zero,
we fail to reject the null hypothesis and conclude that there is no relationship between
the hours of sleep and the age of the adult.
CoStar would like to test if the vacancy rate for “warehouse” stores is more than 8%. A
Type I error would occur if CoStar concludes that the vacancy rate was

________________________.
A) more than 8% when, in reality, the proportion was 8% or less
B) 8% or less when, in reality, the proportion was more than 8%
C) equal to 8% when, in reality, the proportion was 8% or less
D) not equal to 8% when, in reality, the proportion was equal to 8%
Increasing the sample size when calculating a confidence interval while keeping the
confidence level constant will
A) reduce the margin of error resulting in a wider (less precise) confidence interval.
B) increase the margin of error resulting in a narrower (more precise) confidence
interval.
C) reduce the margin of error resulting in a narrower (more precise) confidence interval.
D) increase the margin of error resulting in a wider (more precise) confidence interval.
Suppose Burger King has run a major advertising campaign in the hopes of increasing
monthly sales. To investigate the effectiveness of this campaign, Burger King randomly
selected seven restaurants and recorded the monthly sales before and after the
advertising. The following data represents these sales figures in thousands of dollars.
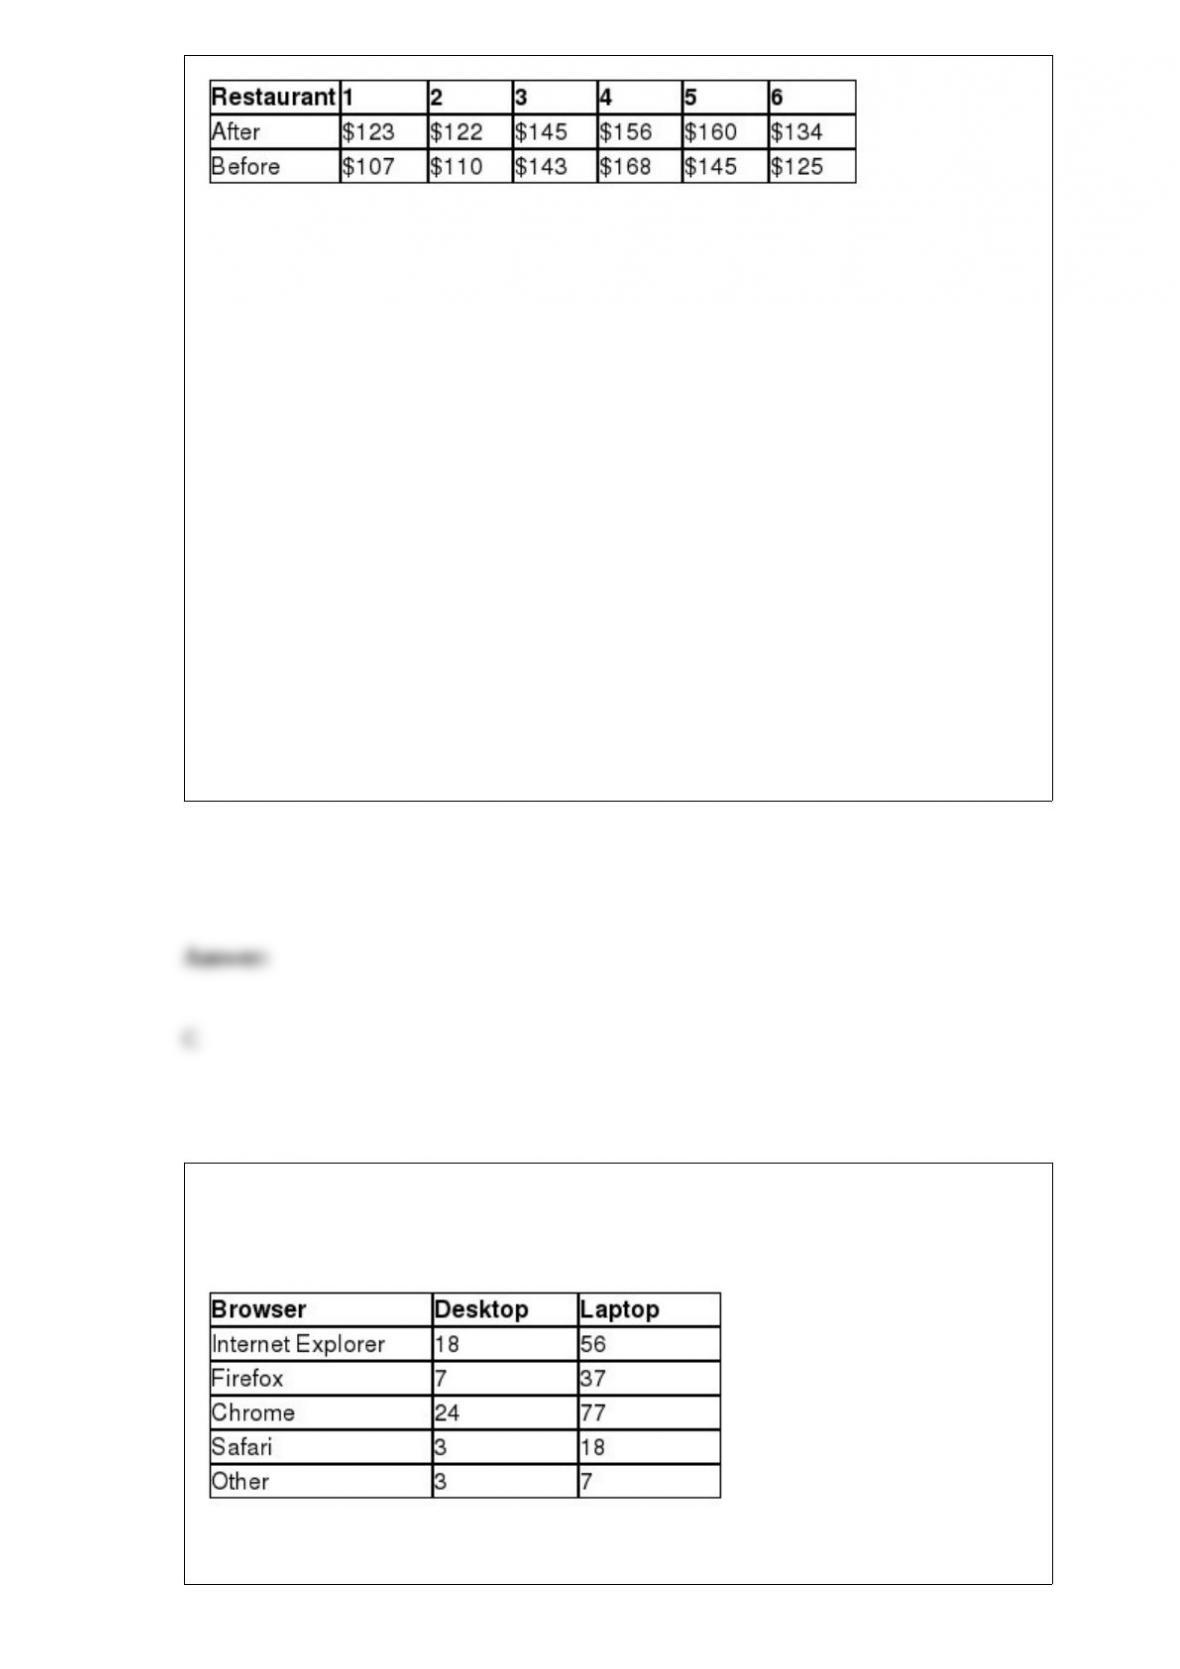
If Population 1 is defined as sales after the advertising campaign and Population 2 is
defined as sales before the advertising campaign, which one of the following statements
is true?
A) Because the 90% confidence interval does not include zero, we cannot conclude that
the average restaurant sales per month after the advertising campaign are higher than
the average restaurant sales per month before the advertising campaign.
B) Because the 90% confidence interval does not include zero, we can conclude that the
average restaurant sales per month after the advertising campaign are higher than the
average restaurant sales per month before the advertising campaign.
C) Because the 90% confidence interval includes zero, we cannot conclude that the
average restaurant sales per month after the advertising campaign are higher than the
average restaurant sales per month before the advertising campaign.
D) Because the 90% confidence interval includes zero, we can conclude that the
average restaurant sales per month after the advertising campaign are lower than the
average restaurant sales per month before the advertising campaign.
A random sample of computer users were asked which browser they primarily relied on
for surfing the Internet and whether this browser was installed on a desktop or laptop
computer. The following contingency table shows these results.
The probability that a randomly selected person from this sample used the Safari
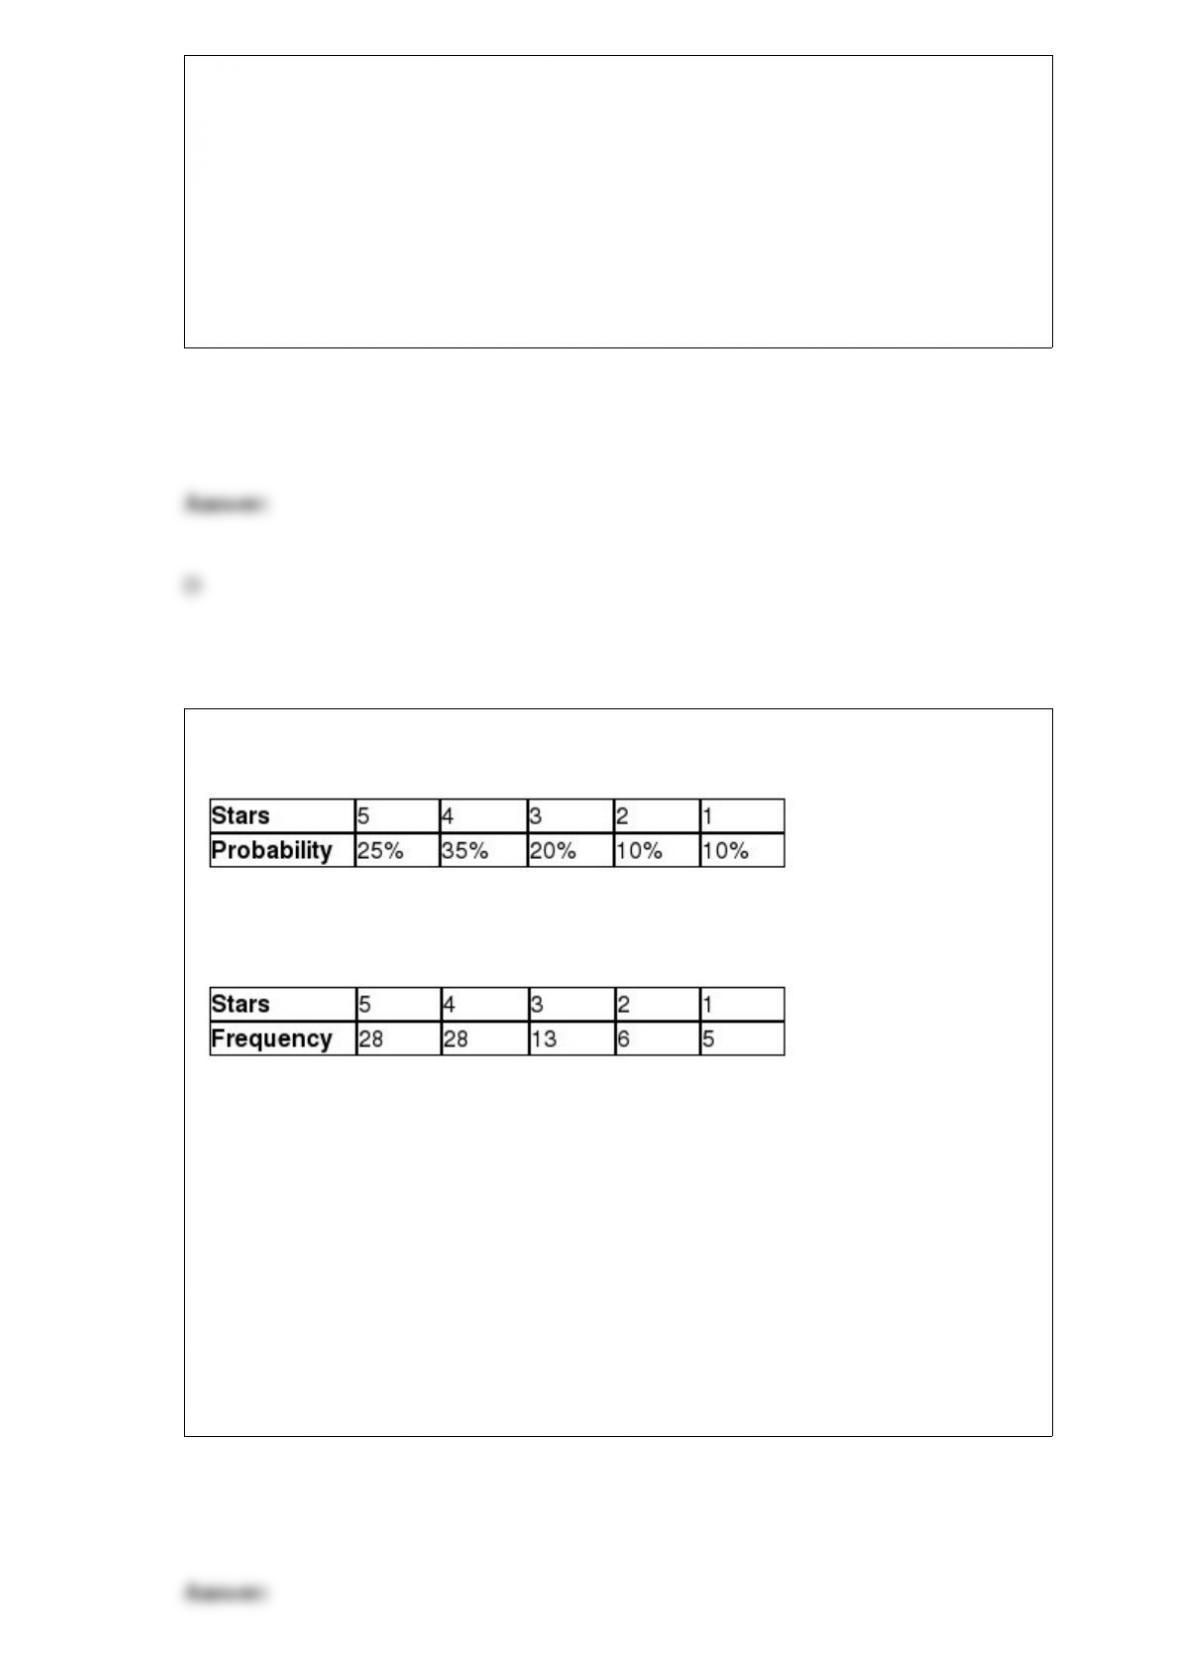
browser or used a laptop computer is ________.
A) 0.509
B) 0.622
C) 0.780
D) 0.792
The following data represent the discrete probability distribution for the number of stars
that reviewers gave a first edition statistics reference book.
The second edition of this reference book has been released and a random sample of
people that have purchased the book has been collected with the following results.
The publisher would like to know if the probability distribution for reviews has changed
from the first edition to the second edition using α = 0.025. The degrees of freedom for
the critical value is ________.
A) 3
B) 4
C) 5
D) 6

Recently, FHA mortgages, which are insured by the federal government, accounted for
28% of all home-purchase mortgages that were approved. A random sample of 150
mortgage applications was selected. What is the probability that 48 or more from this
sample were insured by the FHA?
A) 0.1379
B) 0.1915
C) 0.2291
D) 0.3974
Analyzing unemployment data from the Bureau of Labor Statistics is an example of
using secondary data.
Deseasonalizing the time series removes the effect that the seasonal component has on
the data.
Assume that the flight time for a United Airlines flight from Philadelphia to Dallas
follows the uniform probability distribution between 210 and 250 minutes. What is the
mean of this distribution?
A) 230
B) 235
C) 240
D) 245
Sheridan Motors is a car dealership that would like to investigate if there is a difference
in the average number of car sales per month between three sales employees using a
randomized block ANOVA. The following data represent the number of car sales last
year for these employees for six different months.
The mean square block for these observations is ________.
A) 12.9

B) 14.0
C) 16.7
D) 18.5
Use the information below to answer the following question(s).
The following decision tree is partially completed for a company that is deciding to
build a large or small facility for a new product that will face demand that is strong or
weak. The company has an option to perform a market survey that will cost $4,000 that
will predict a strong or weak market. The payoffs for each combination of facility size
and demand are also shown.
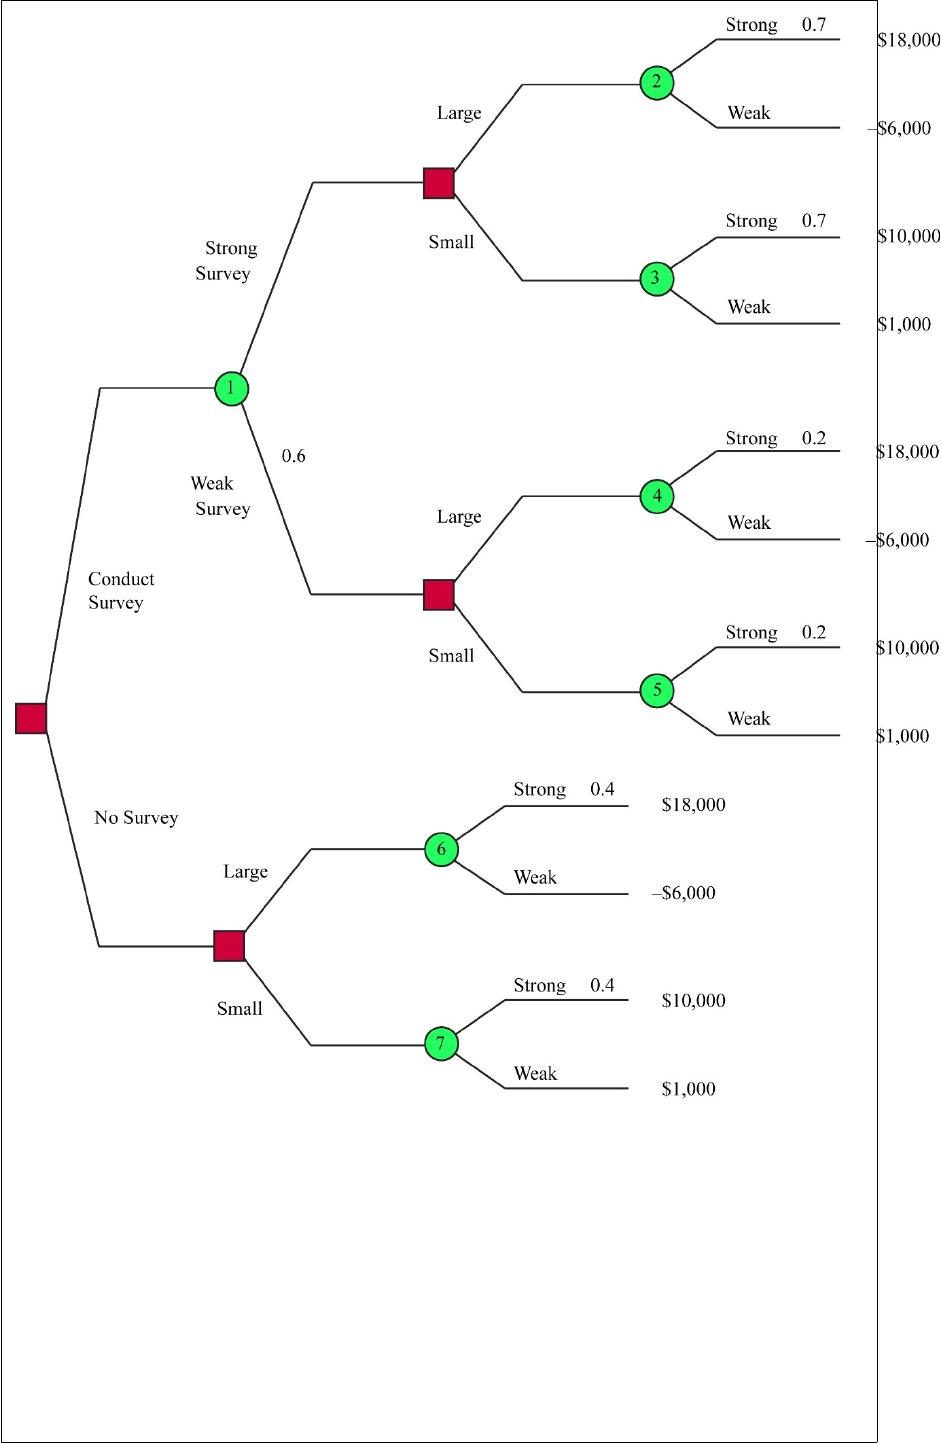
If the company decides not to conduct the survey, the probability that demand for the
new product will be weak is ________.
A) 0.20
B) 0.40
C) 0.60
D) 0.80
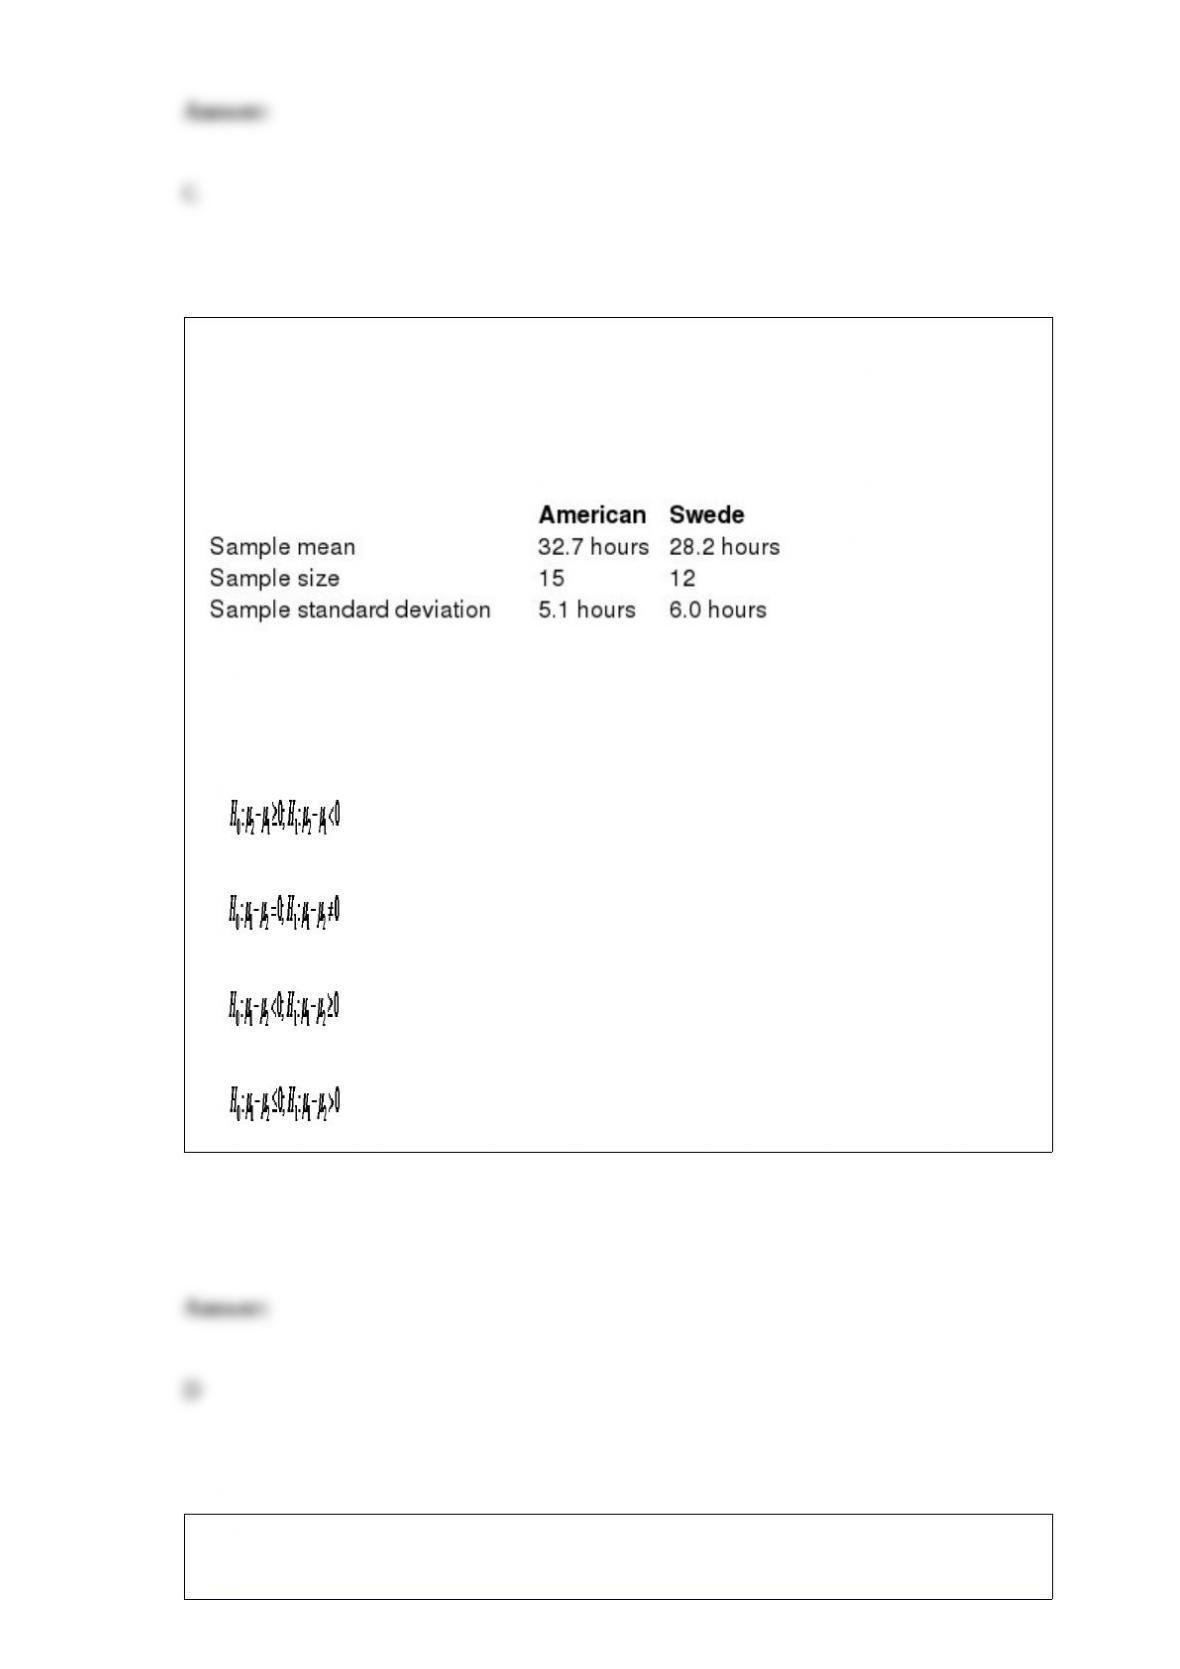
You have been assigned to test the hypothesis that the average number of hours per
week that an American works is higher than the average number of hours per week that
a Swede works. The following data summarizes the sample statistics for the number of
hours worked per week for workers in each country. Assume that the population
variances are unequal.
If Population 1 is defined as American workers and Population 2 is defined as Swedish
workers, the correct hypothesis statement for this hypothesis test would be
________________________.
A)
B)
C)
D)
The following contingency table shows the number of customers who bought various
brands of digital cameras at Walmart and Best Buy.
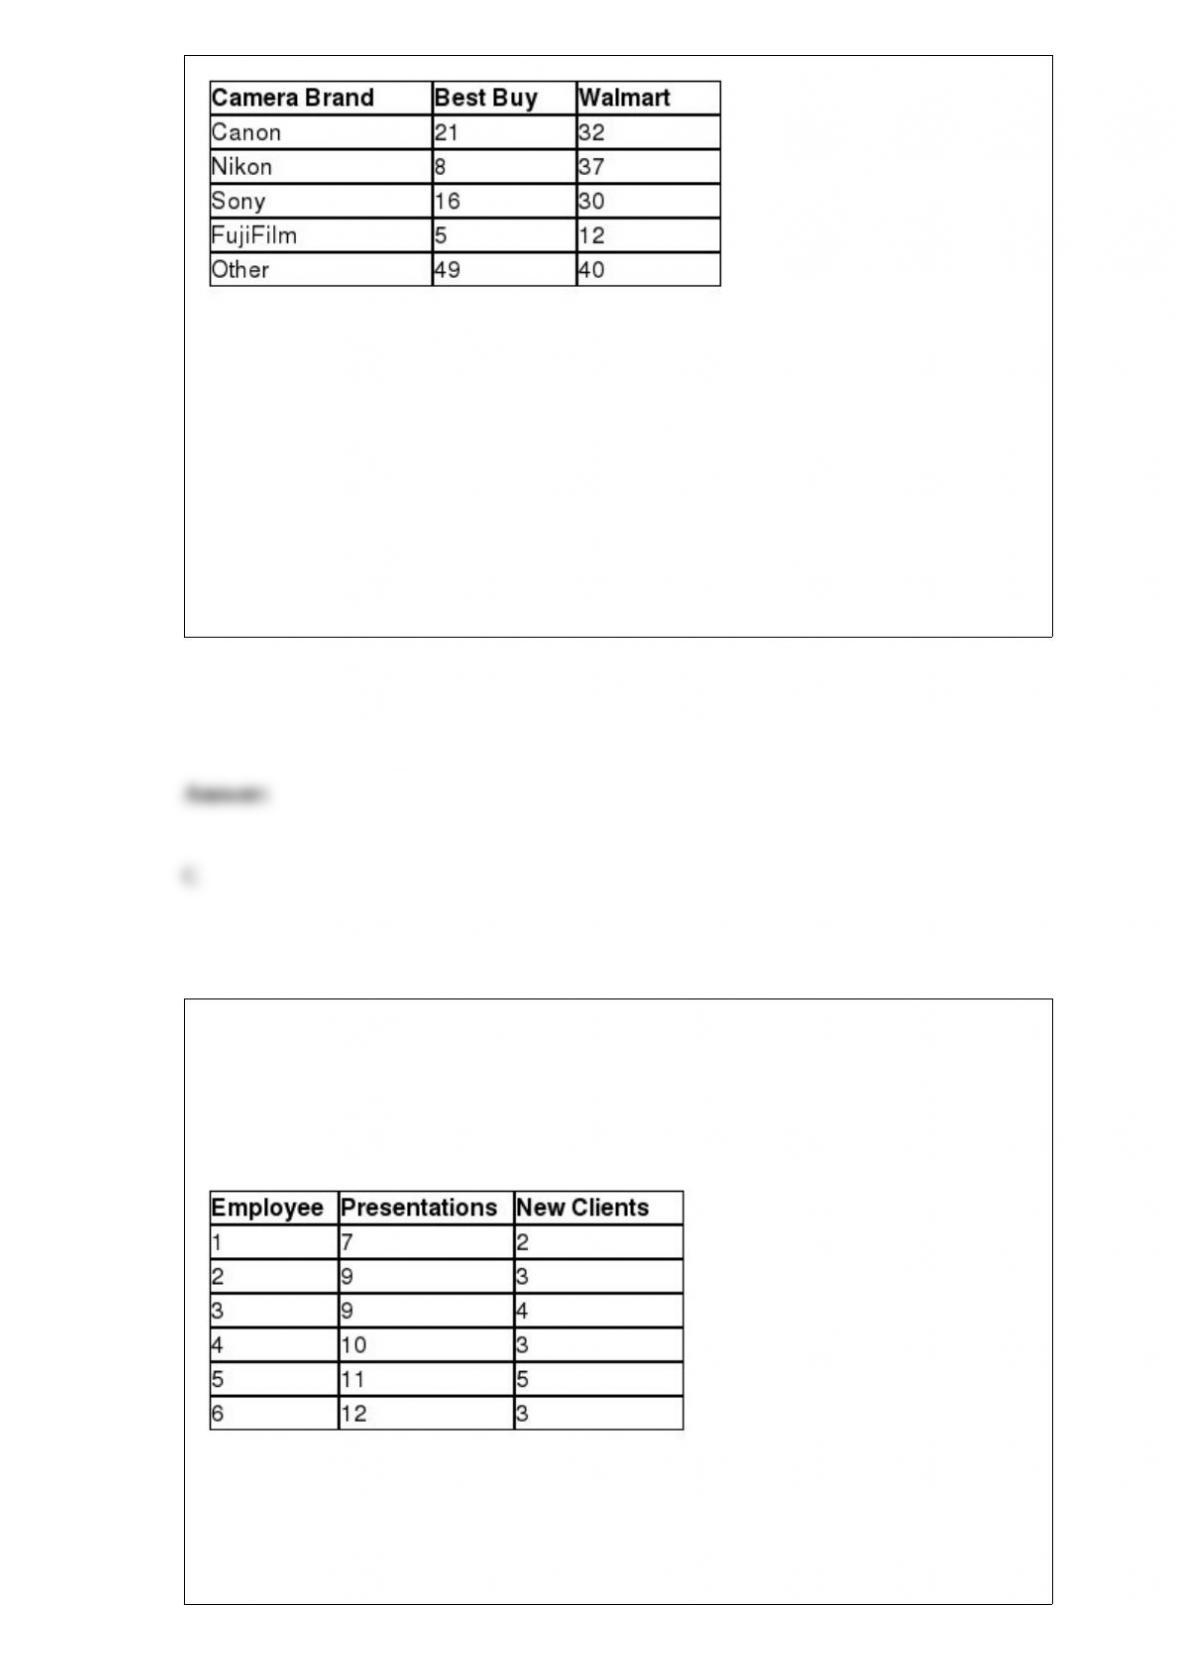
Given that the camera was FujiFilm, the probability that is was purchased at Walmart is
________.
A) 0.256
B) 0.403
C) 0.706
D) 0.829
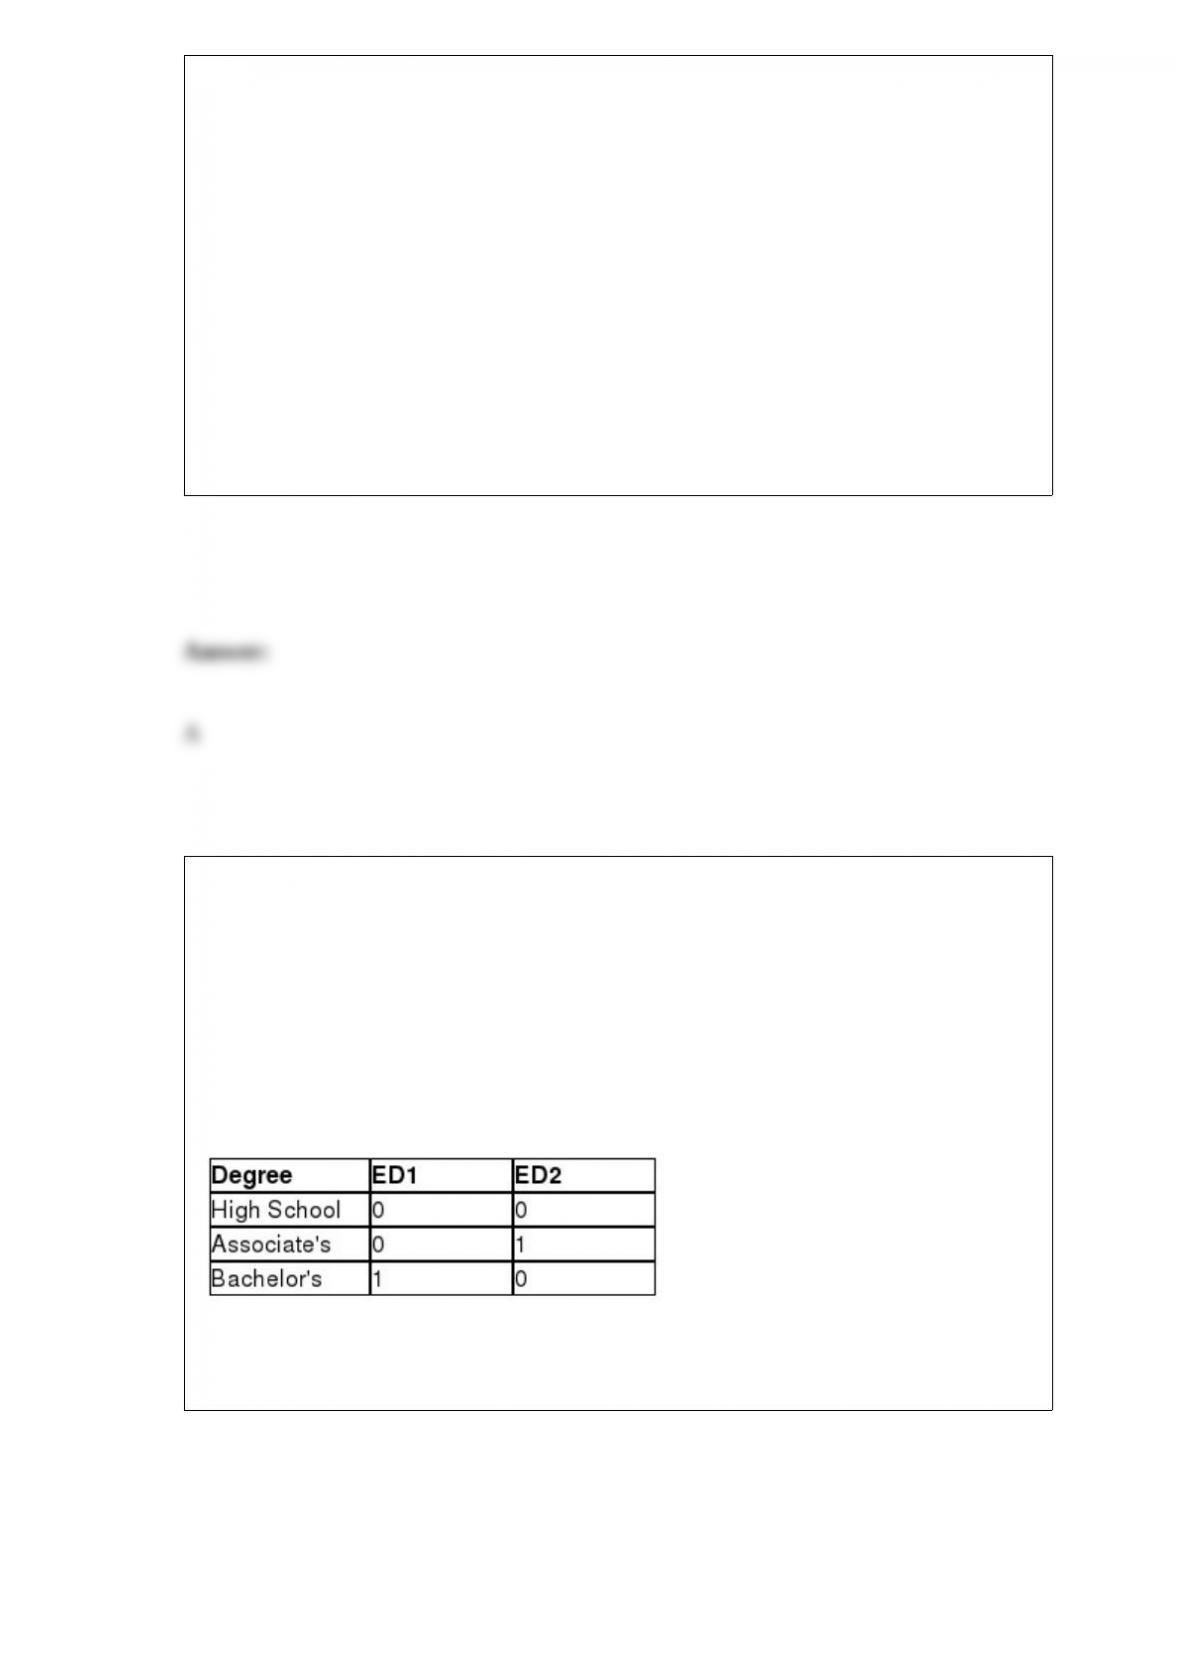
Sarah is the office manager for a group of financial advisors who provide financial
services for individual clients. She would like to investigate whether a relationship
exists between the number of presentations made to prospective clients in a month and
the number of new clients per month. The following table shows the number of
presentations and corresponding new clients for a random sample of six employees.
Which one of the following statements describes the results of the hypothesis test that
the population correlation coefficient is not equal to zero using α = 0.10?
A) Because the absolute value of the test statistic is less than the absolute value of the
critical value, we fail to reject the null hypothesis and cannot conclude that the
population correlation coefficient is equal to zero.
B) Because the absolute value of the test statistic is less than the absolute value of the
critical value, we can reject the null hypothesis and conclude that the population
correlation coefficient is equal to zero.
C) Because the absolute value of the test statistic is greater than the absolute value of
the critical value, we reject the null hypothesis and cannot conclude that the population
correlation coefficient is equal to zero.
D) Because the absolute value of the test statistic is greater than the absolute value of
the critical value, we fail to reject the null hypothesis and conclude that the population
correlation coefficient is equal to zero.
Use the following information to answer the question(s) below.
Ford would like to develop a regression model that would predict the number of cars
sold per month by a dealership employee based on the employee’s number of years of
sales experience (Exp), the employee’s weekly base salary before commissions (Salary),
and the education level of the employee. There are three levels of education in the sales
forcehigh school degree, associate’s degree, and bachelor’s degree. The following
dummy variables have been defined.
The following Excel output shows the partially completed regression output from a
random sample of employees from the previous month.
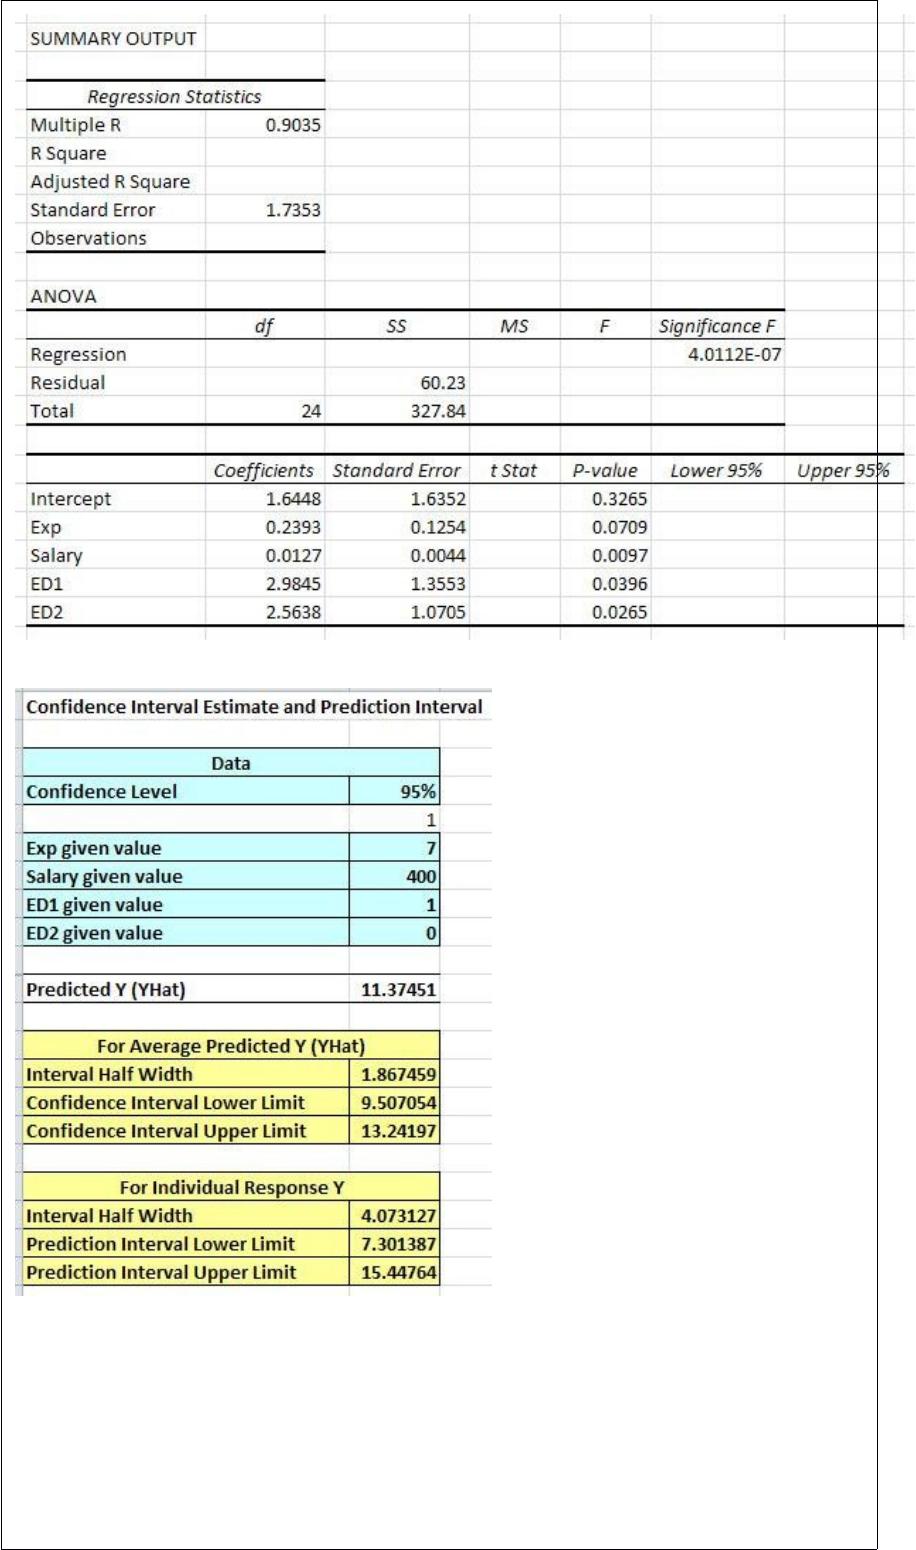
The F-test statistic for the overall regression model is ________.
A) 2.73
B) 3.47
C) 22.22
D) 25.60
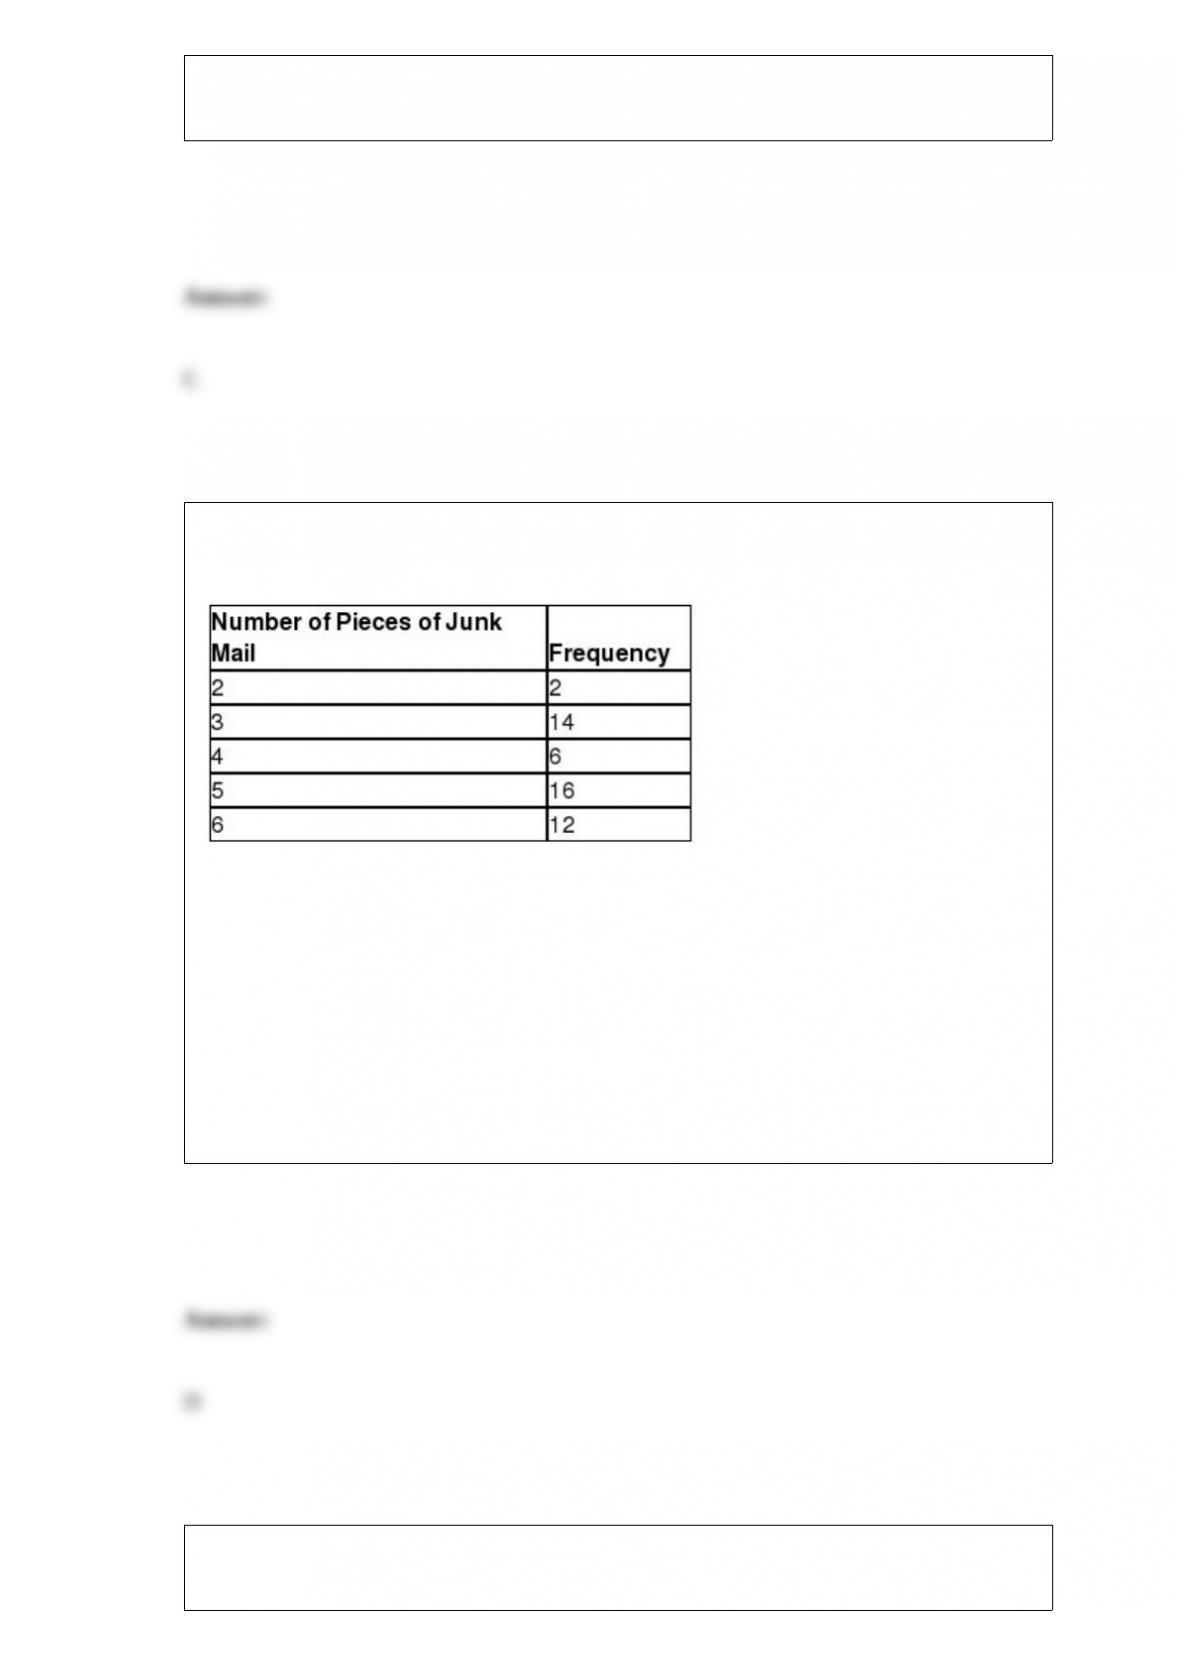
The following table shows the number of pieces of junk mail that arrives in my mailbox
each day.
What is the mean number of pieces of junk mail received per day?
A) 2.11
B) 2.64
C) 3.70
D) 4.44
The following table shows the weekly demand for a particular digital camera and the
corresponding price of that camera during the week.
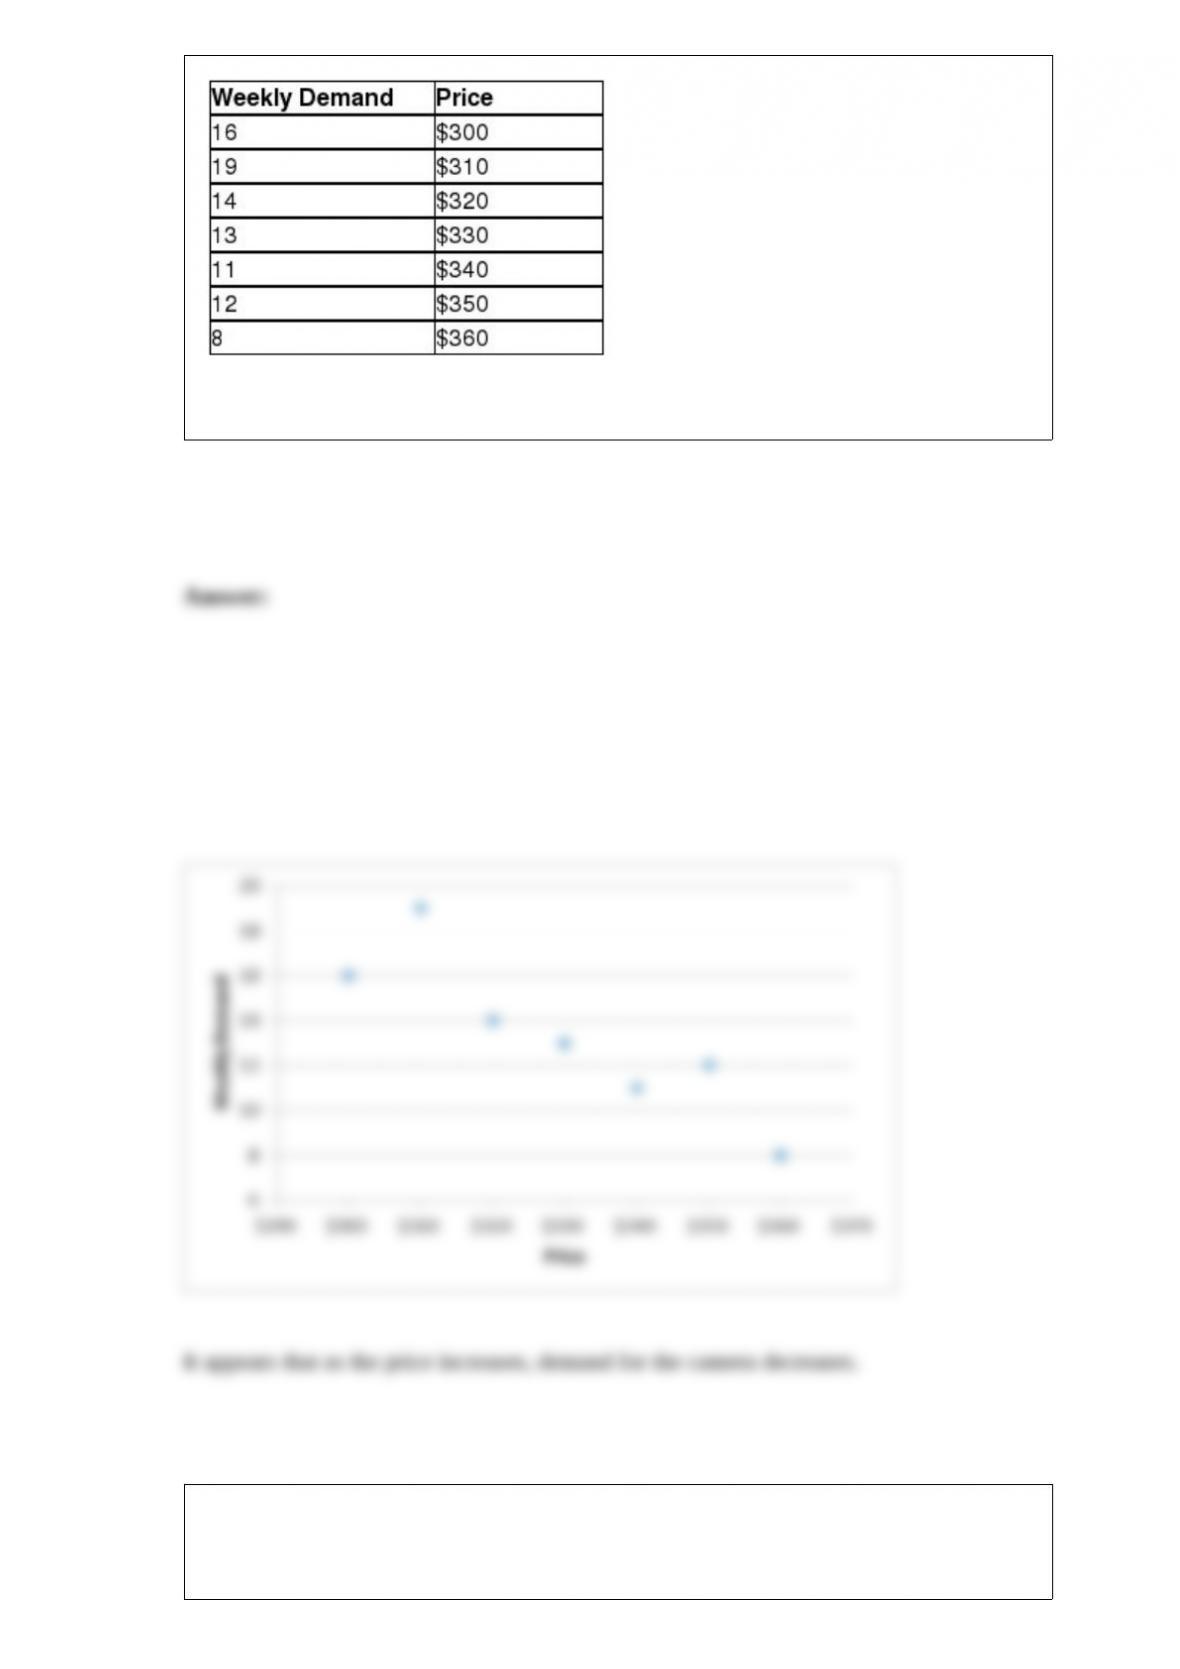
Construct a scatter plot to display this data. What conclusions can be drawn?
Susan would like to conduct a survey of homeowners in the Meadowbrook
neighborhood to get their opinions on proposed road modifications in the area. Which
of the following is an example of a convenience sample?
A) Susan randomly chooses two streets in the neighborhood and selects every home on
these streets.
B) Susan selects the first 20 homes that she passes as she walks into the entrance of the
neighborhood.
C) Susan selects every third house on each street in the neighborhood.
D) None of these choices describes a convenience sample.
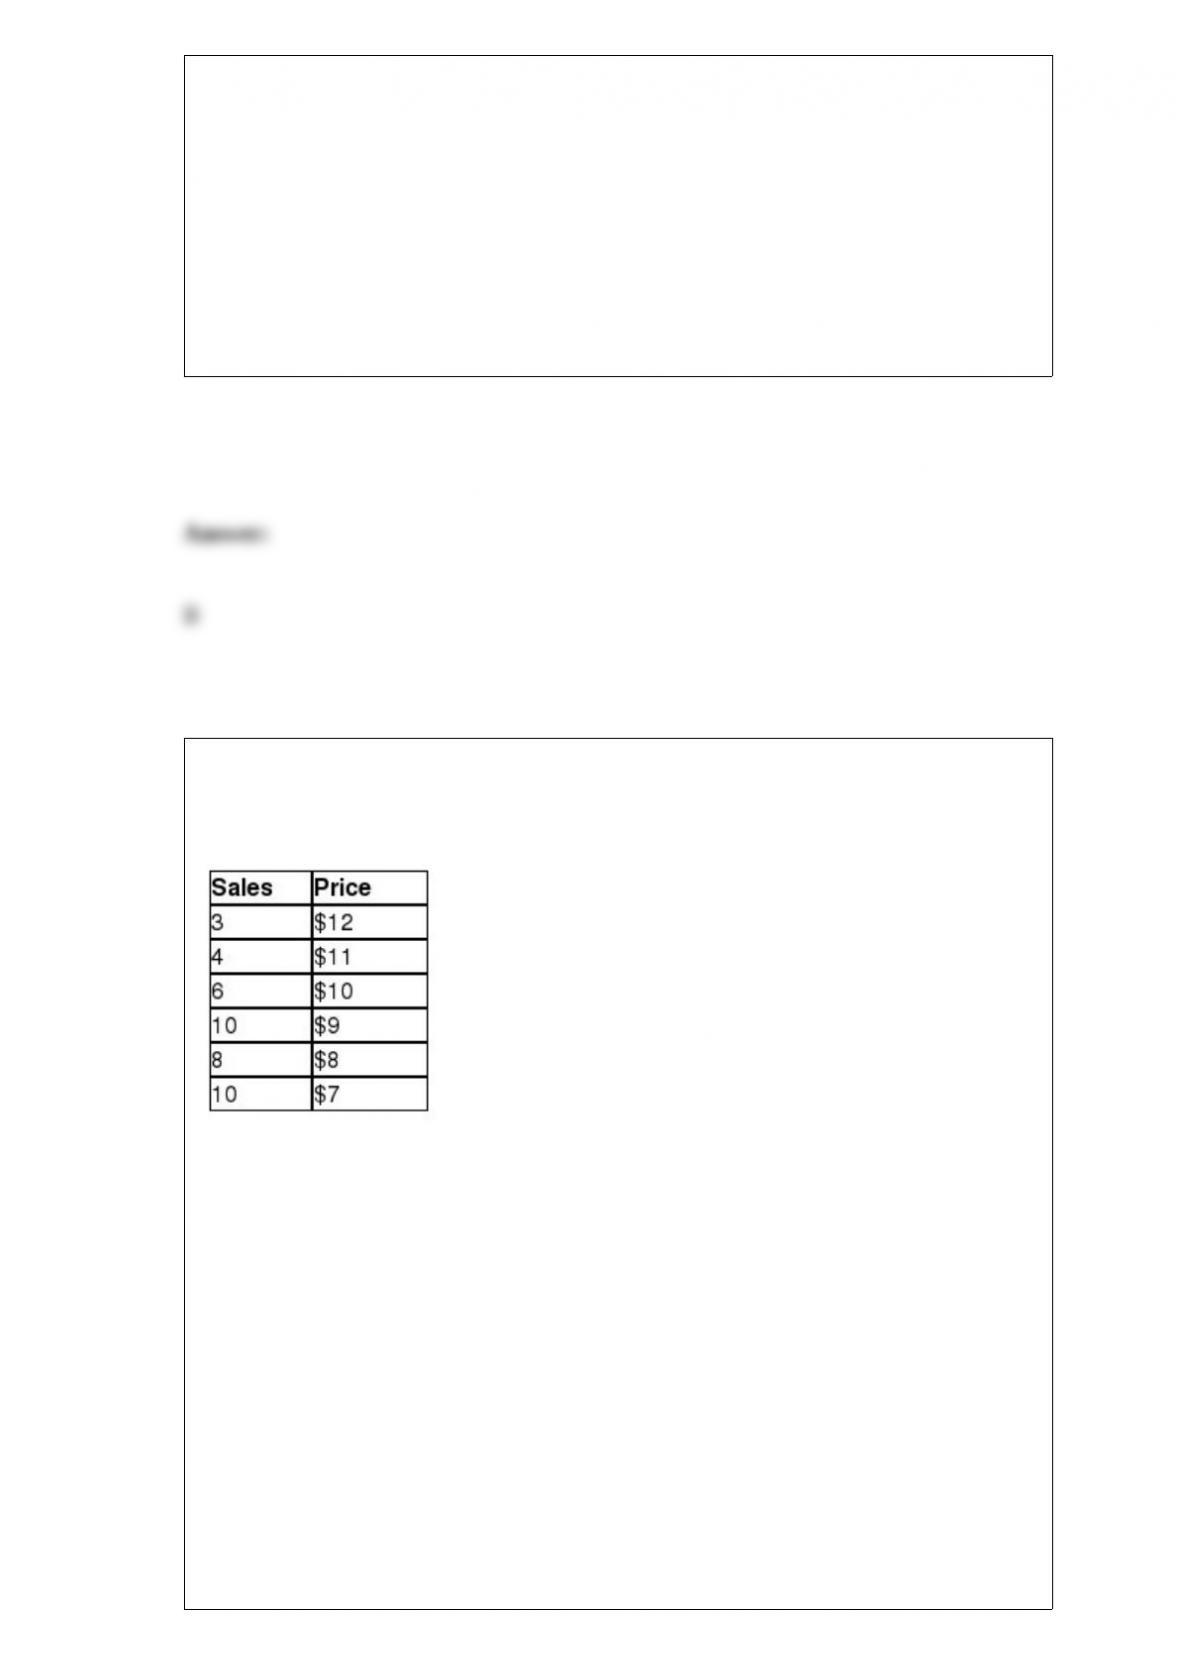
Costco sells paperback books in their retail stores and wanted to examine the
relationship between price and demand. The price of a particular novel was adjusted
each week and the weekly sales were recorded in the table below.
Management would like to use simple regression analysis to estimate weekly demand
for this novel using the price of the novel. Which one of the following statements
describes the results of the hypothesis test that the population correlation coefficient is
greater than zero using α = 0.05?
A) Because the test statistic is greater than the critical value, we can reject the null
hypothesis and conclude that the population correlation coefficient is greater than zero.
B) Because the test statistic is greater than the critical value, we fail to reject the null
hypothesis and conclude that the population correlation coefficient is greater than zero.
C) Because the test statistic is less than the critical value, we fail to reject the null
hypothesis and conclude that the population correlation coefficient is greater than zero.
D) Because the test statistic is less than the critical value, we fail to reject the null

hypothesis and conclude that the population correlation coefficient is not greater than
zero.
Assume that the amount of time that it takes an employee to service a car at an oil
change facility follows the uniform probability distribution between 21 and 38 minutes.
What is the mean of this distribution?
A) 26.5
B) 28.0
C) 29.5
D) 31.0
Edmunds.com would like to test the hypothesis that the standard deviation for the age
of an imported car on the road is greater than the standard deviation for the age of a
domestic car. The following data shows the ages of a random sample of import and
domestic cars.
The degrees of freedom for the critical value for import cars would be ________.
A) 4
B) 5
C) 6
D) 7
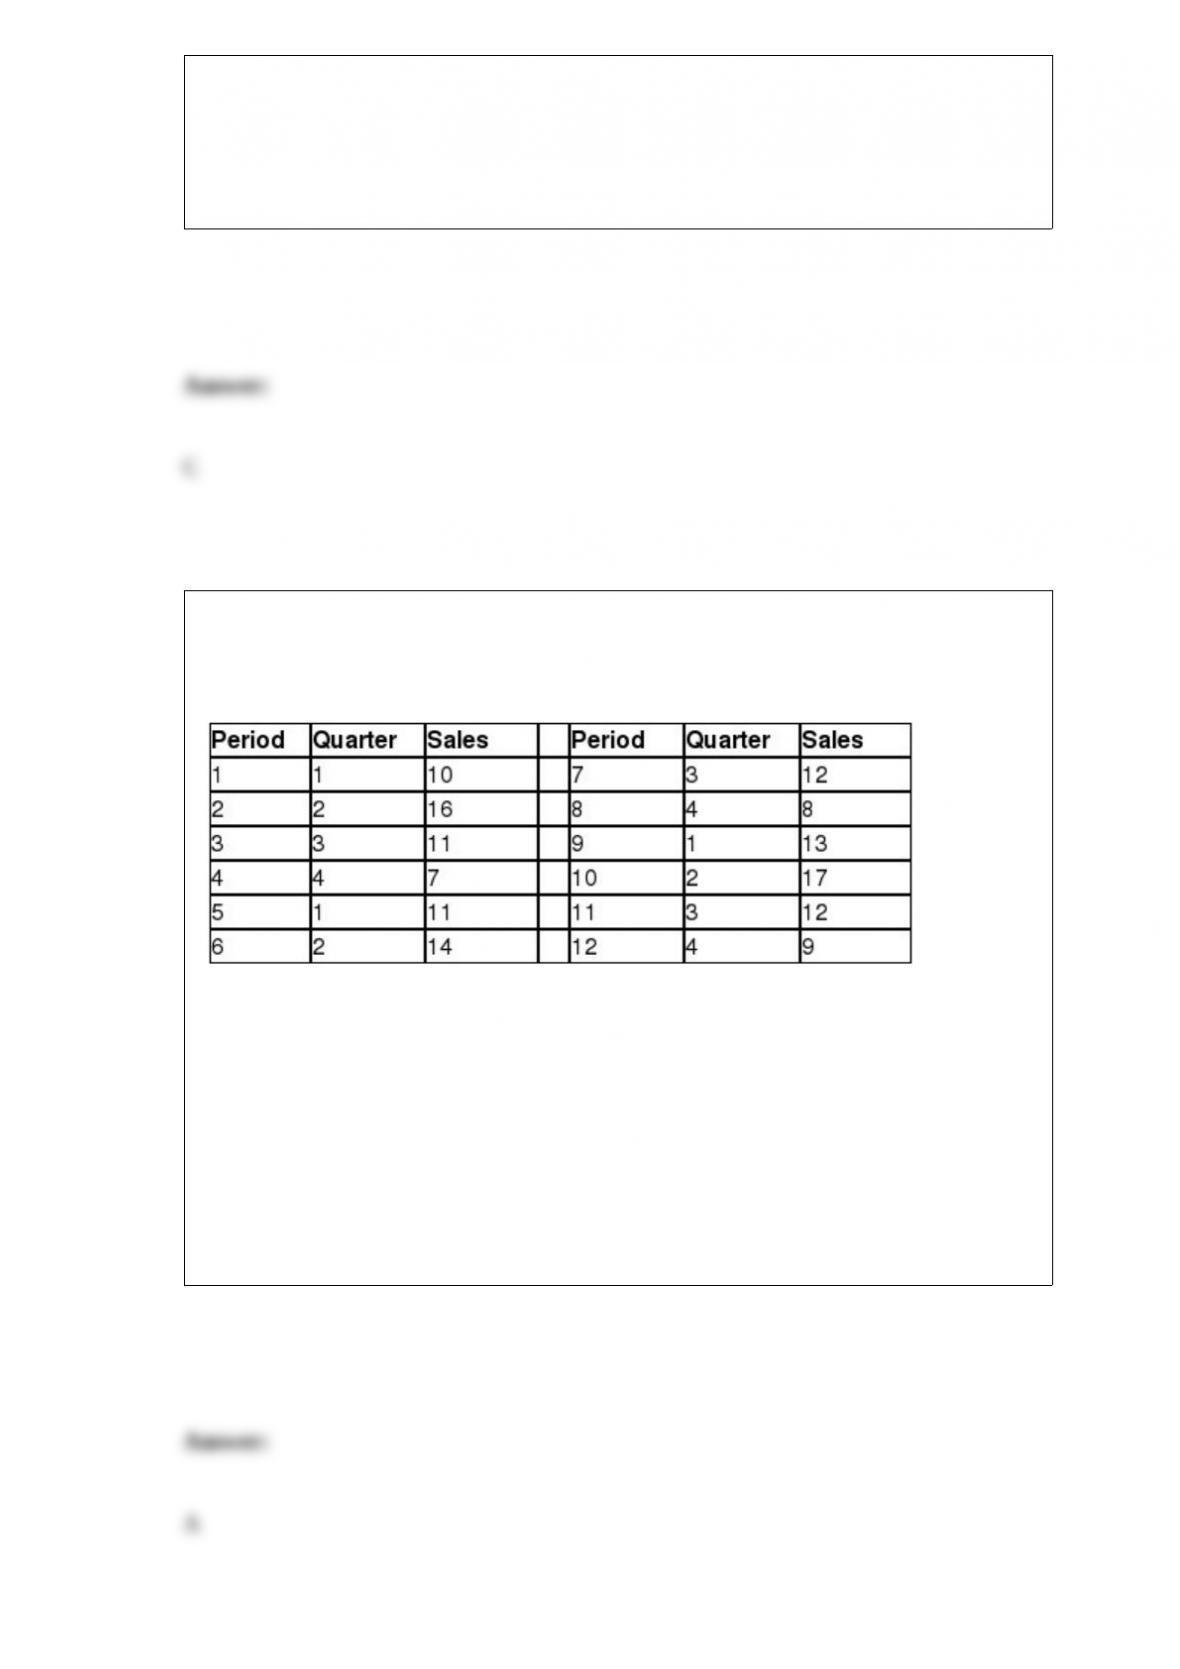
Chris is employed by Silver Lake Resort in Orlando, Florida, and sells timeshares. The
following table shows the number of timeshare sales for Chris for each quarter over the
past three years.
The ratio-to-moving-average for Period 4 is ________.
A) 0.6364
B) 0.9450
C) 1.2257
D) 1.5699

Bins in Excel represent the ______________.
A) lower boundary of each class in a frequency distribution
B) upper boundary of each class in a frequency distribution
C) width of each class in a frequency distribution
D) number of classes in a frequency distribution