After taking a speed-reading course, students are supposed to be able to read faster than
they could before taking the course. A pilot sample of n = 25 students showed a mean
increase of 300 words per minute with a standard deviation equal to 60 words per
minute. To estimate the population mean with 95 percent confidence and a margin of
error of 10 minutes, the required sample size is approximately 139 students.
The following class limits would be acceptable for developing a frequency distribution
on income:
$0 < $5,000
$5001 < $10,000
$10,001 < $20,000
Over $20,000
When performing a hypothesis test for the difference between the means of two
independent populations, where the standard deviations are known, the variances must
be assumed equal.

Regardless of population distribution, the sampling distribution for a random variable X
will be approximately normally distributed.
When testing whether two paired populations have equal medians and the sample sizes
are large, it is appropriate to convert the Wilcoxon Matched-Pairs Signed Rank test to a
paired sample t-test.
It is correct to say that subjective probability assessments are neither right nor wrong,
but are merely reflections of the state of mind of the individual making the probability
assessment.
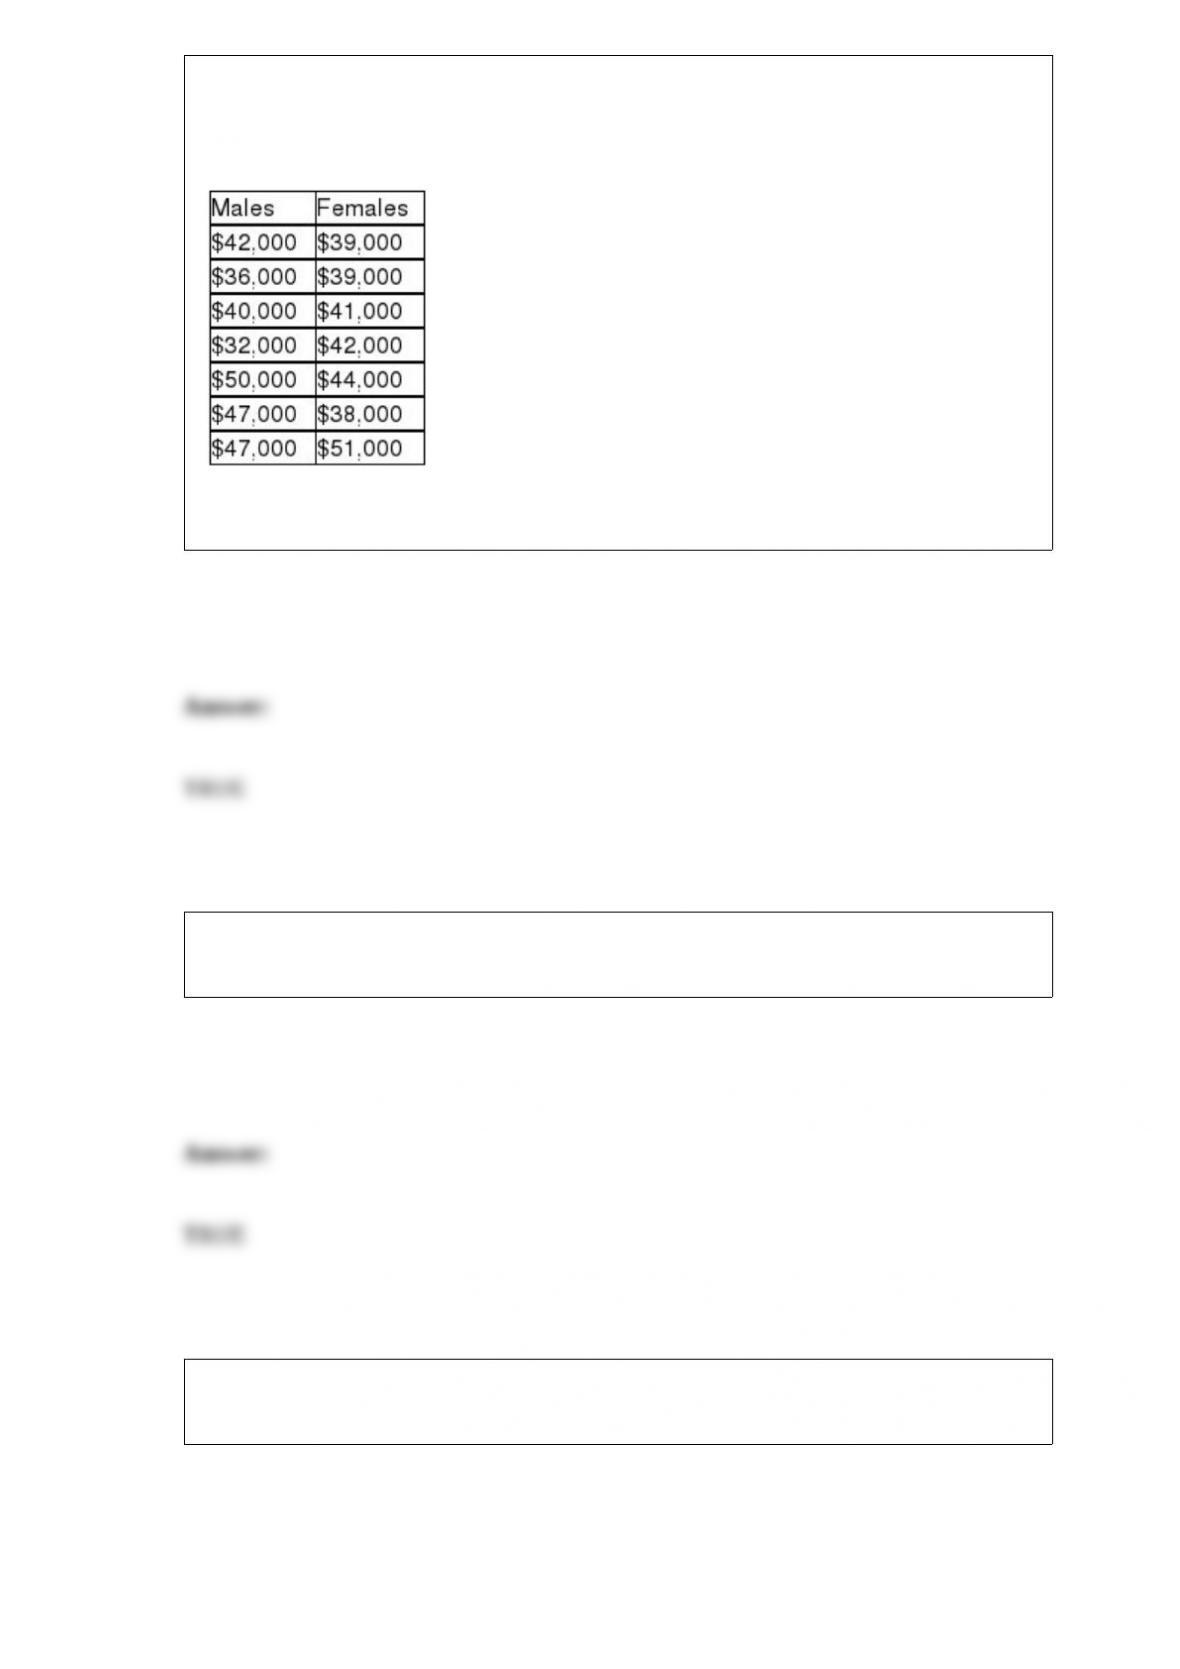
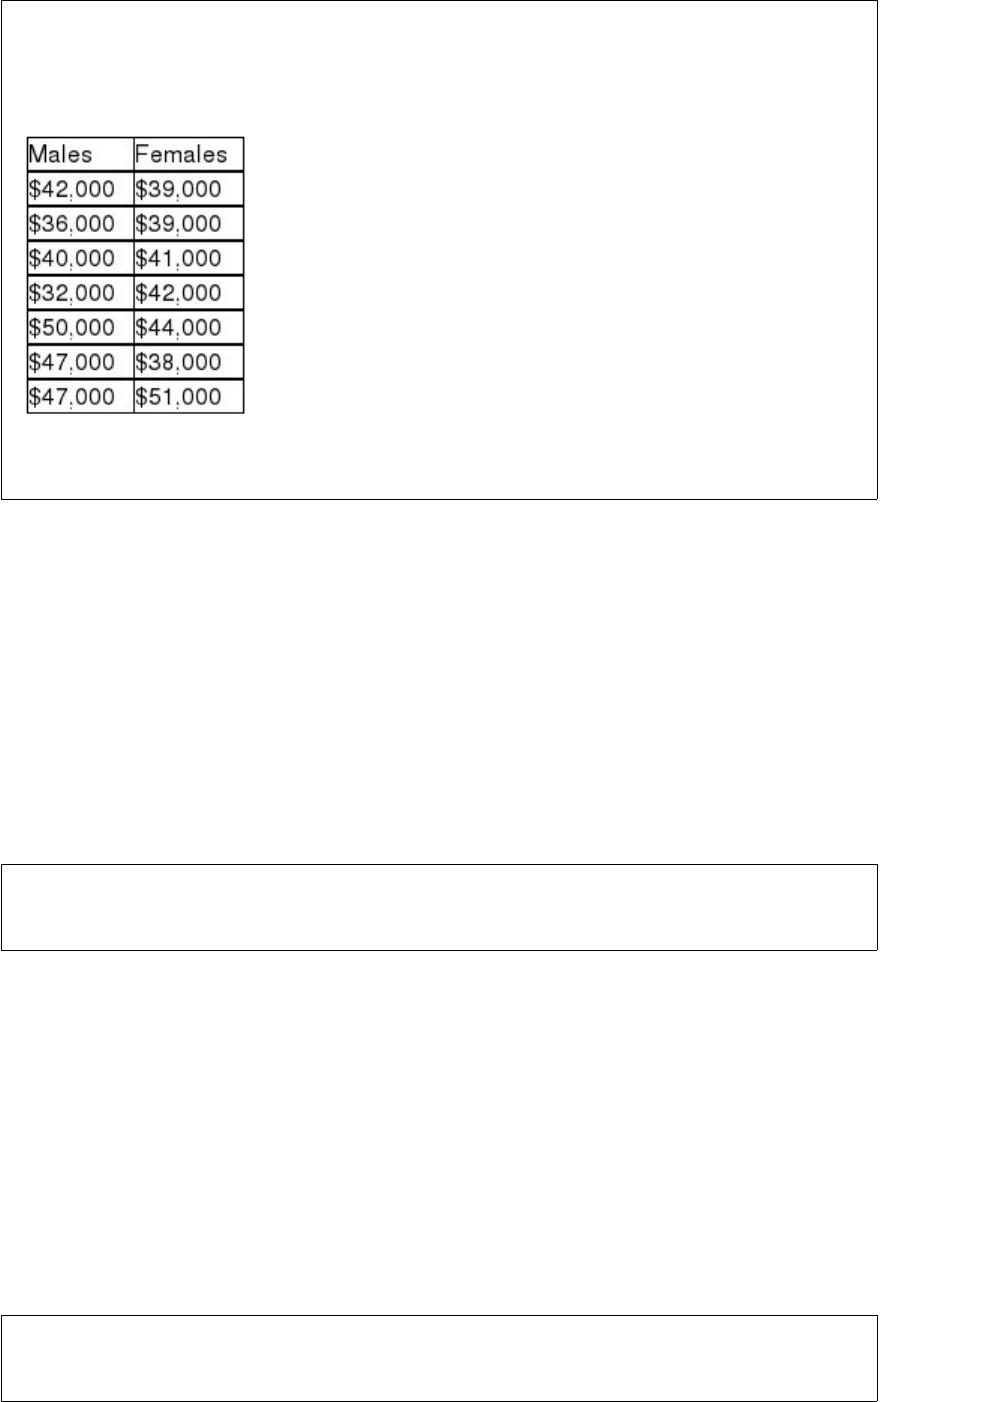
A claim was recently made that stated that the median income for male and female
graduates is the same for those graduating with a degree in operations management. The
following sample data were collected:
In employing the Mann-Whitney U test, the sum of the ranks for the males is 53.5
When determining the sample size for a proportion, if you have no previous
information available to estimate p, then the best value to use is π = 0.5.
A p-chart would potentially be used to monitor the diameters of bolts made by a bolt
manufacturing plant.


Consider a situation in which both a frequency distribution and a relative frequency
distribution have been developed for the same quantitative variable. If histograms are
constructed from each distribution, the graphs will appear to have the same shape.
Assuming that you are planning to collect data using an experiment, it will be very
important to establish an appropriate survey design.
If you are interested in estimating the difference between the means of two samples that
have been paired, the point estimate for this difference is the mean value of the paired
differences.
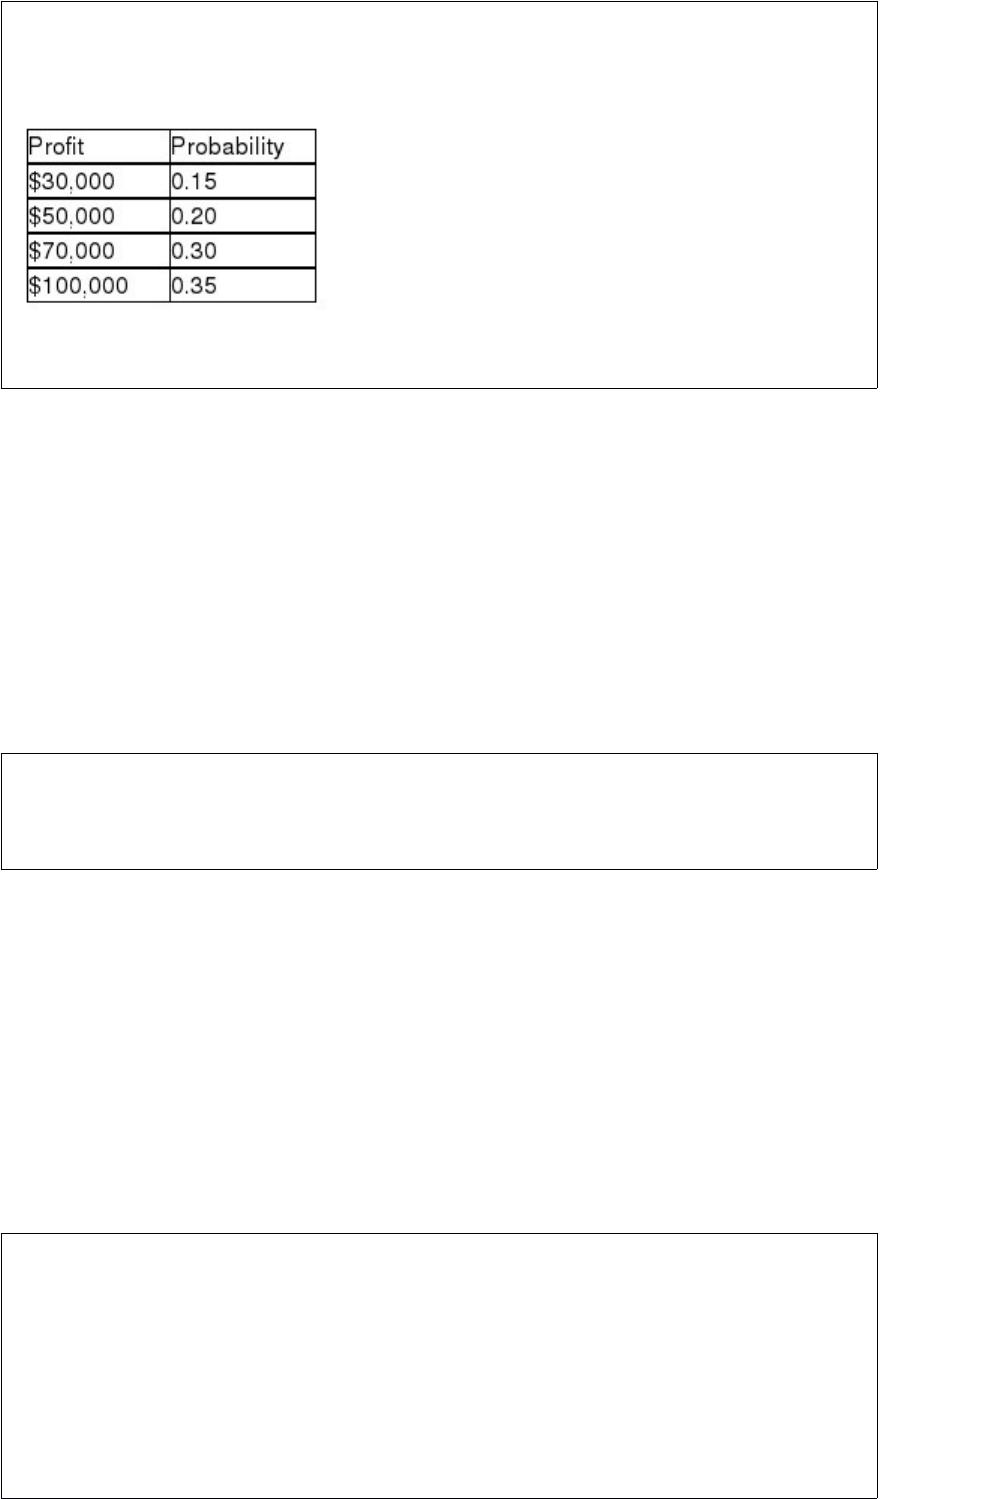
The Cromwell Construction Company has the opportunity to enter into a contract to
build a mountain road. The following table shows the probability distribution for the
profit that could occur if it takes the contract:
Based on this information, the probability of profit being at least $50,000 is 0.50.
Bill Price is a sales rep in northern California representing a line of athletic socks. Each
day, he makes 10 sales calls. The chance of making a sale on each call is thought to be
0.30. The probability that he will make exactly two sales is approximately 0.2335.
The Crystal Window Company makes windows at three locations: Reno, Las Vegas,
and Boise. Some windows made by the company contain a visible defect and must be
replaced. Each defect costs the company $45.00. The Reno plant makes 40 percent of
all windows while the Las Vegas and Boise plants split the remaining production
evenly. A recent quality study shows that 8 percent of the Reno windows contain a
defect, 11 percent of the Las Vegas windows contain a defect, while 4 percent of the
windows made in Boise have a defect. Once the windows are made, they are shipped to
a central warehouse where they are commingled and the location where they were made

is lost.
Based on this information, the percentage of the defective cost that should be allocated
to the Reno plant is approximately 42 percent.
If a contingency analysis test is performed with a 4 6 design, and if alpha = .05, the
critical value from the chi-square distribution is 24.9958
To construct a 99 percent confidence interval where σ is known, the correct critical
value is 1.96.
A grocery store manager is interested in estimating the mean weight of apples received
in a shipment. If she wishes to have the estimate be within .05 pound with 90 percent
confidence, the sample size should be 103 apples if she believes that the standard
deviation is .08 pound.


If the sample data lead the decision maker to reject the null hypothesis, the alpha level
is the maximum probability of committing a Type II error.
In determining the sample size requirement for an application involving the estimation
of the proportion of department store customers who pay using the store’s credit card,
the closer the true proportion is to .5, the larger will be the required sample size for a
given margin of error and confidence level.
When a single die is rolled, each of the six sides are equally likely. This is an example
of a uniform distribution.
In a two-factor ANOVA design with replication, the null hypothesis for testing whether
interaction exists is that no interaction exists. The alternative hypothesis is that
interaction does exist.
If two variables are related in a positive linear manner, the scatter plot will show points
on the x,y space that are generally moving from the lower left to the upper right.
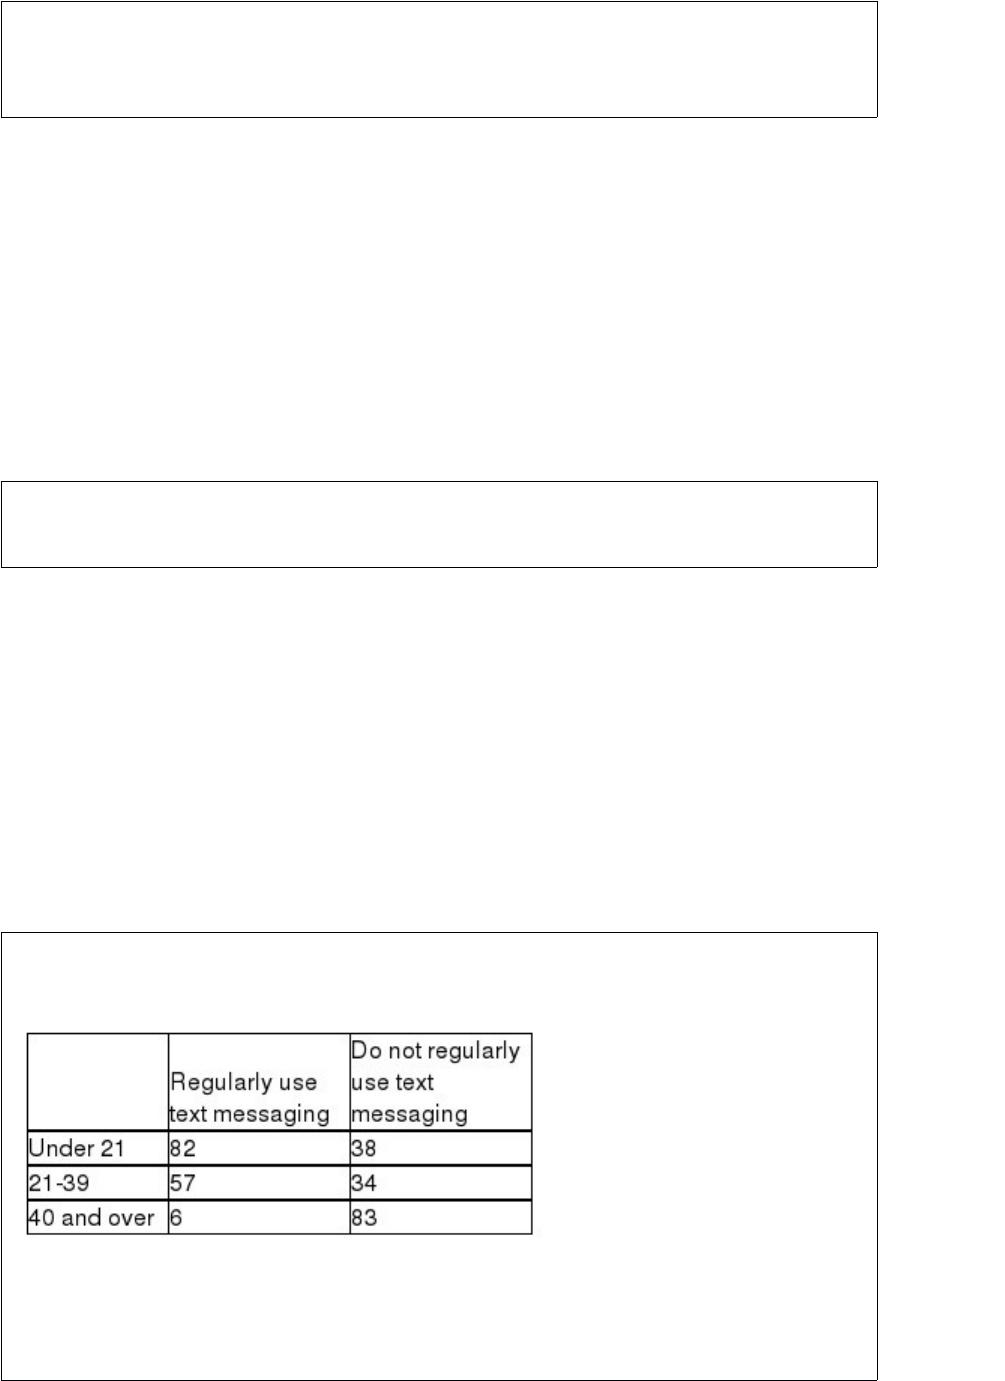
A cell phone company wants to determine if the use of text messaging is independent of
age. The follow data has been collected from a random sample of their customers.
Using the data above, in order to test for the independence of age and the use of text
messaging, the expected value for the “under 21 and regularly use text messaging” cell
is 82.

A local pizza company is interested in estimating the percentage of customers who
would take advantage of a coupon offer. To do this, they give the coupon out to a
random sample of 100 customers. Of these, 45 actually use the coupon. At the 95
percent confidence level it would be appropriate for the manager to conclude that
possibly as many as 50 percent of his customers will redeem the coupon.
The Mann-Whitney U test can be used to test whether two independent populations
have the same median so long as the data are measured on at least an ordinal scale.
A useful method for determining whether a linear function is the appropriate function to
describe the relationship between the x and y variable is a residual plot in which the
residuals are plotted on the vertical axis and the independent variable is on the
horizontal axis.


Another term for the arithmetic average is the mean.
In a simple linear regression analysis, if the test statistic for testing the significance of
the regression slope coefficient is 3.6, the F ratio from the analysis of variance table is
known to be 12.96
The Fallbrook Distributing Company has a soft drink bottling plant in Plano, Texas.
Based on historical records, if its filling machine is working properly, the mean fill
volume per can is 12.0 ounces with a standard deviation equal to 0.13 ounce. Further,
the distribution of fill amounts is known to be normally distributed. The State of Texas
has a department whose job it is to check on such consumer-related processes as soft
drink filling. The idea is to protect the consumer. The department arrives at the
Fallbrook plant once a month on an unscheduled day. When they arrive, they randomly
select n = 4 cans and carefully measure the volume in each can. If any of these cans
contains less than 11.85 ounces, the plant is shut down until a full inspection of the
filling process is performed. Based on this information, the probability that the plant
will get shut down if it is operating properly is approximately 0.1251.
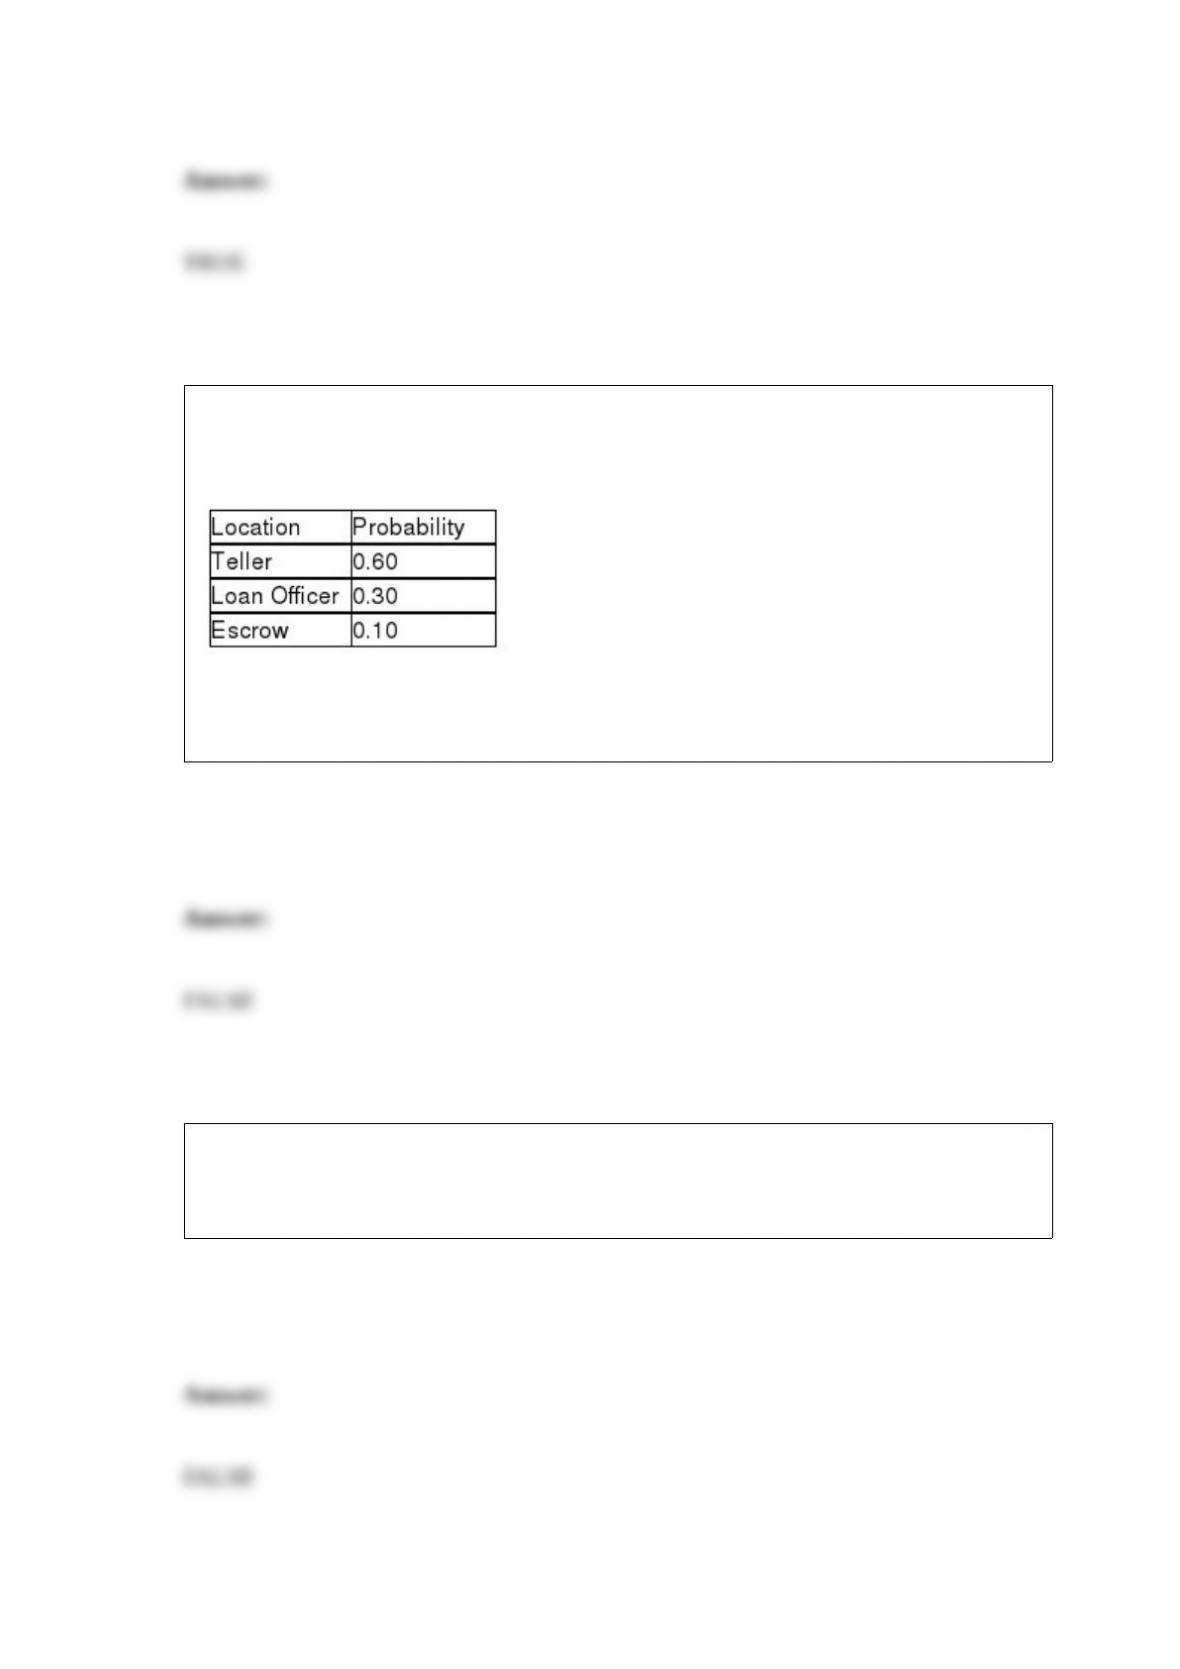
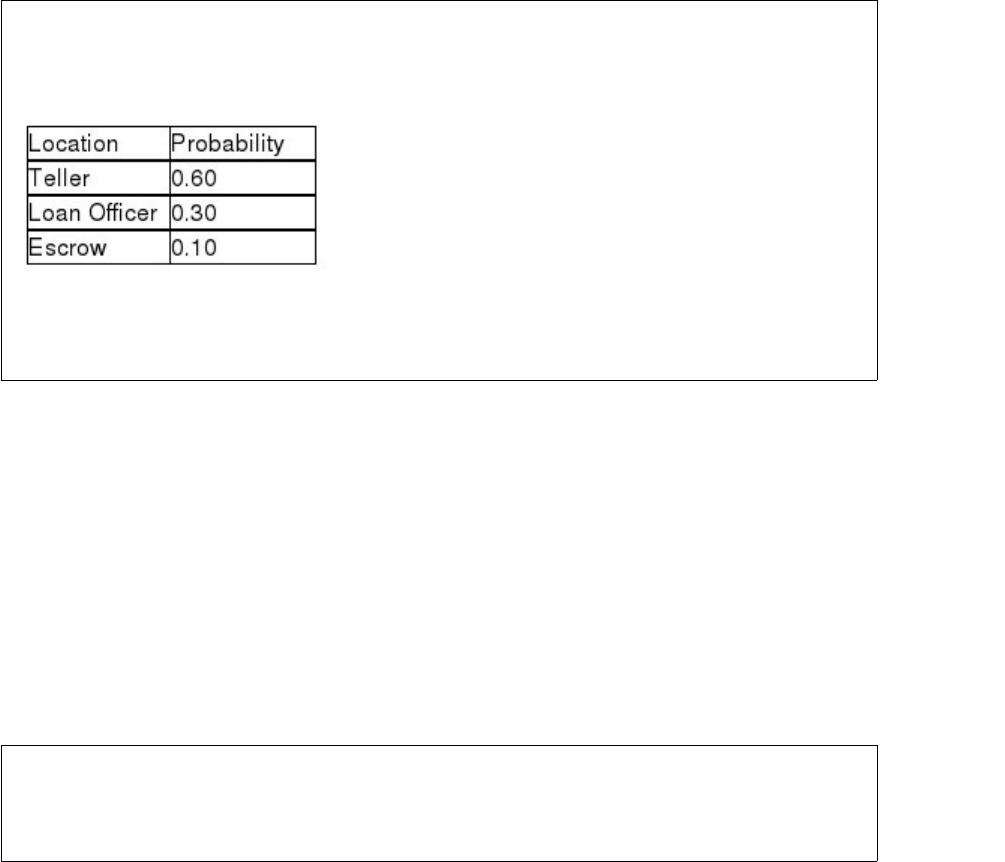
When customers come to a bank, there are three primary locations they may select to go
to: teller, loan officer, or escrow department. Based on past experience, the following
probability distribution applies:
Seventy percent of customers are males. Thus, the probability that the next customer to
enter the bank is a male who goes to the teller is 1.30.
In constructing a histogram for a joint frequency distribution, the histogram will have
the most meaning for the decision maker if there are no gaps between the bars on the
histogram.


A histogram is an example of a numerical measure.
Suppose an airline decides to conduct a survey of its customers to determine their
opinion of a proposed one-bag limit. The plan calls for a random sample of customers
on different flights to be given a short written survey to complete during the flight. One
key question on the survey will be: “Do you approve of limiting the number of carry-on
bags to a maximum of one bag?” Airline managers expect that only about 15% will say
“yes.” Based on this assumption, what size sample should the airline take if it wants to
develop a 95% confidence interval estimate for the population proportion who will say
“yes” with a margin of error of 0.02?
A) 1151
B) 1341
C) 1512
D) 1225
A study was recently conducted by the regional electric and gas company. Data were
collected for three customer categories showing the dollar amount of natural gas and the
dollar amount of electricity consumed during the year. Which of the following graphs
would most likely be used to display both sets of data together?
A) Pie chart
B) Bar chart
C) Line chart
D) Histogram
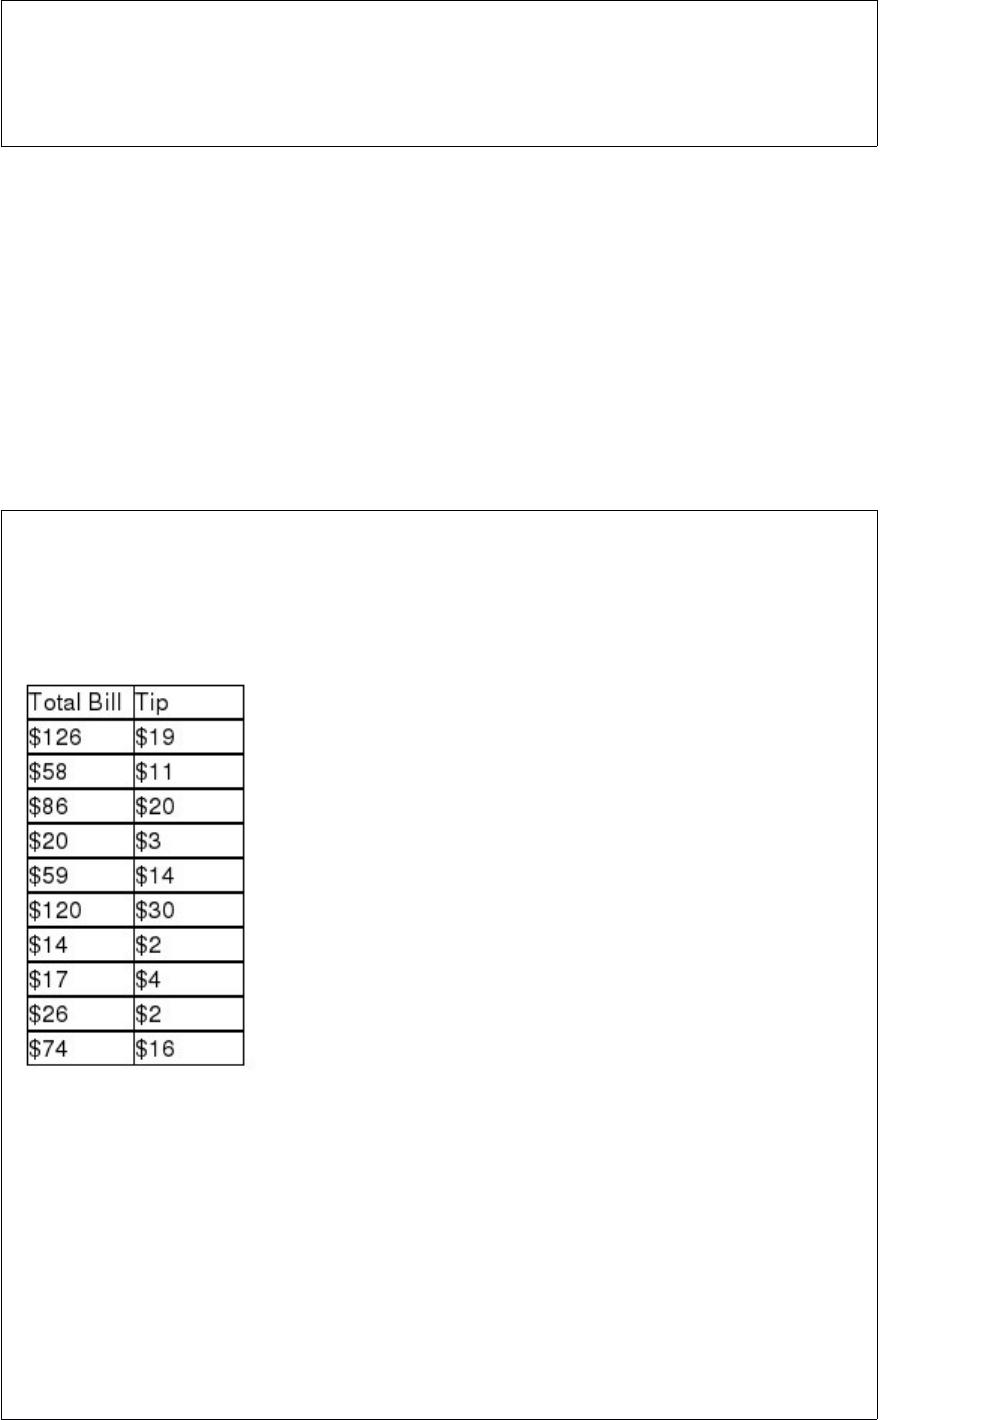
A study was recently performed by the Internal Revenue Service to determine how
much tip income waiters and waitresses should make based on the size of the bill at
each table. A random sample of bills and resulting tips were collected. These data are
shown as follows:
Based upon these data, what is the approximate predicted value for tips if the total bill
is $100?
A) $15.55
B) $20.61
C) $26.03
D) $12.88
A histogram is used to display which of the following characteristics for a quantitative
variable?
A) The approximate center of the data
B) The spread in the data
C) The shape of the distribution
D) All of the above.
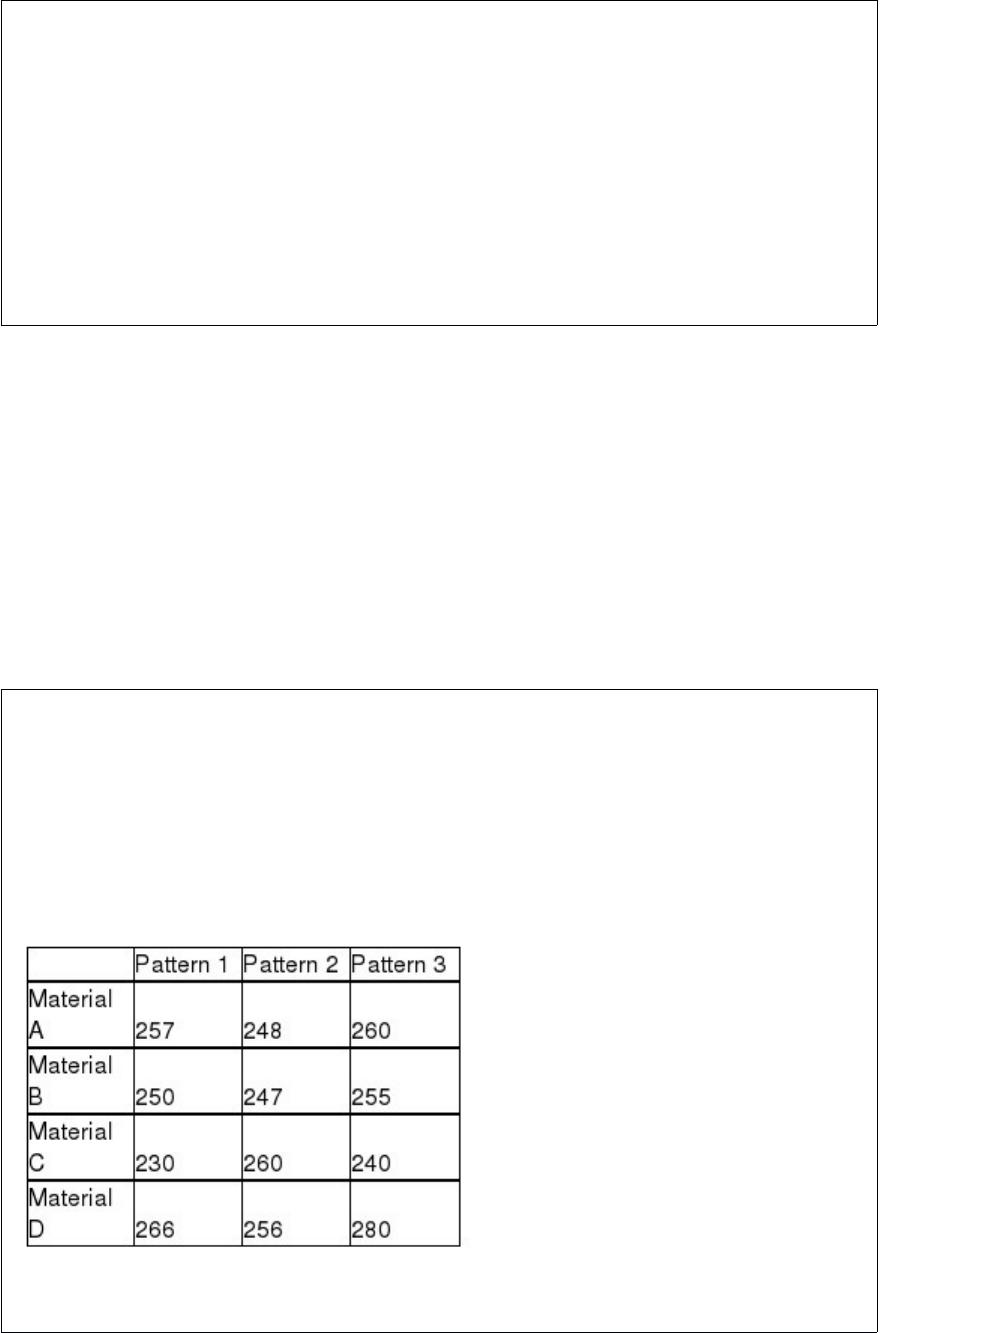
A golf ball manufacturer has three dimple patterns it is interested in analyzing to see
whether one results in longer driving distances. However, it also wishes to control for
the material the ball is made from since it believes that the material might affect driving
distance. Four materials can be used. The following data represent the results of tests in
which each combination of dimple pattern and cover material were used and the length
of the ball hit by a robot has been recorded. The test will be conducted using an alpha =
0.05 level.
Given these data, what is the value of Fisher’s Least Significant Difference critical


value?
A) Approximately 19.06
B) 2.4469
C) About 7.65
D) None of the above
The probability that a product is found to be defective is 0.10. If we examine 50
products, which of the following has the highest probability?
A) 3 defective products are found.
B) 4 defective products are found.
C) 5 defective products are found.
D) 6 defective products are found.
For the normal distribution with parameters μ = 5, σ= 2; calculate P(0 < x < 8).
A) 0.8023
B) 0.4152


C) 0.9270
D) 0.8845
Assume that a medical research study found a correlation of -0.73 between
consumption of vitamin A and the cancer rate of a particular type of cancer. This could
be interpreted to mean:
A) the more vitamin A consumed, the lower a person’s chances are of getting this type
of cancer.
B) the less vitamin A consumed, the lower a person’s chances are of getting this type of
cancer.
C) the more vitamin A consumed, the higher a person’s chances are of getting this type
of cancer.
D) vitamin A causes this type of cancer.
Employees at a large computer company earn sick leave in one-minute increments
depending on how many hours per month they work. They can then use the sick leave
time any time throughout the year. Any unused time goes into a sick bank account that
they or other employees can use in the case of emergencies. The human resources
department has determined that the amount of unused sick time for individual
employees is uniformly distributed between 0 and 480 minutes. Based on this
information, what is the probability that an employee will have less than 20 minutes of
unused sick time?
A) 0.002
B) 0.966
C) 0.063
D) 0.042
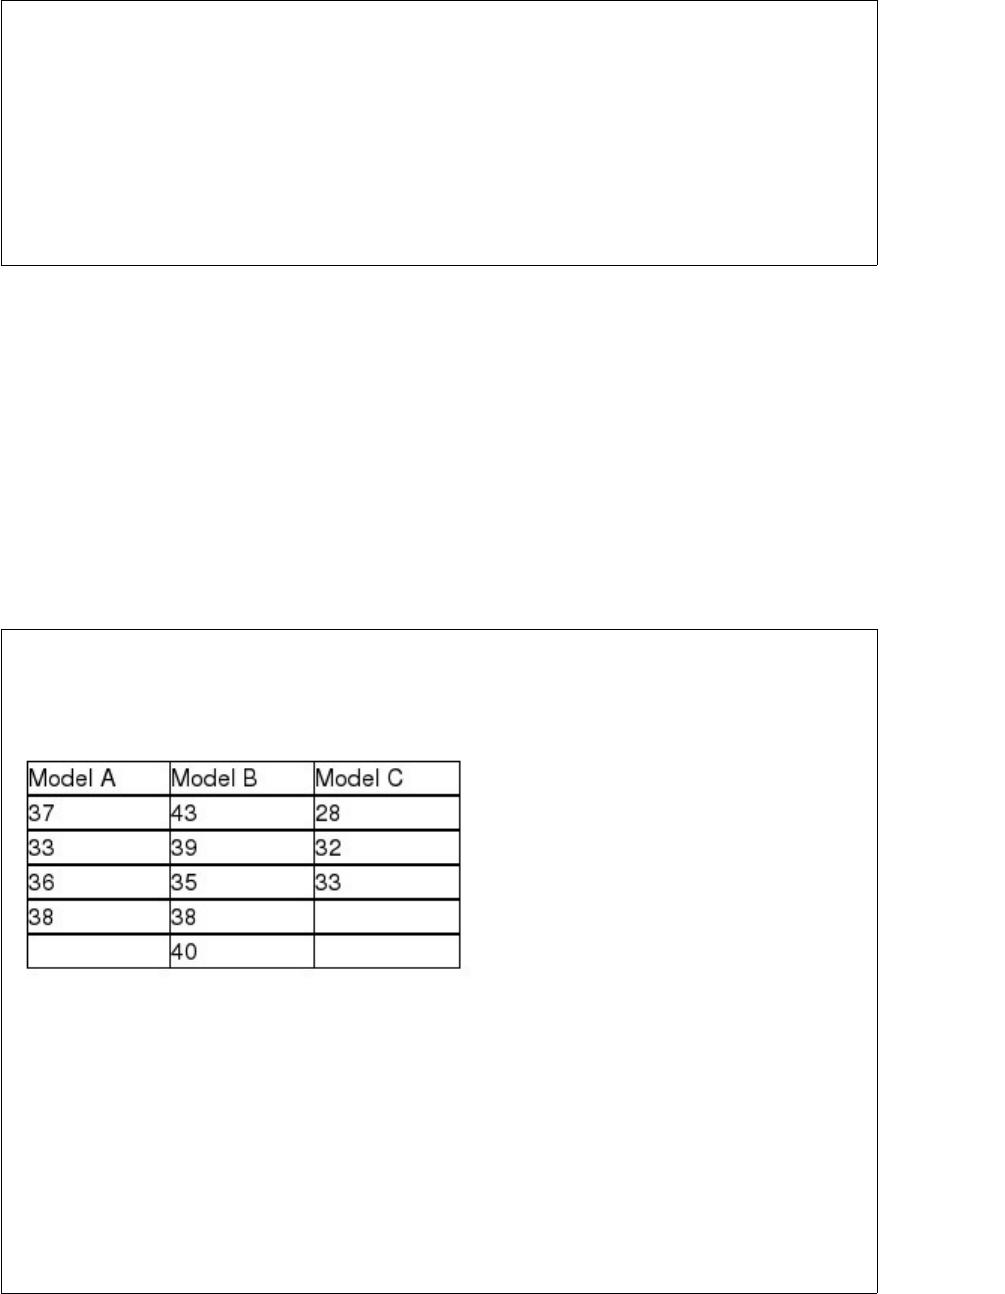
To test the mileage efficiency of three new car models, random samples of various
sample sizes were selected from each of the three cars and the mpg data obtained are
shown below.
Based on the sample date, one can conclude that
A) all three car models have the same mean mpg.
B) at least two car models have different mpgs.
C) Model C has a higher mpg than Model A.
D) None of the above


A contract calls for the mean diameter of a cylinder to be 1.50 inches. As a quality
check, each day a random sample of n = 36 cylinders is selected and the diameters are
measured. Assuming that the population standard deviation is thought to be 0.10 inch
and that the test will be conducted using an alpha equal to 0.025, what would the
probability of a Type II error be?
A) Approximately 0.1267
B) About 0.6789
C) 0.975
D) Can’t be determined without knowing the “true” population mean.
Beacon Hill Trees & Shrubs currently has an inventory of 10 fruit trees, 8 pine trees,
and 14 maple trees. It plans to give 4 trees away at next Saturday’s lawn and garden
show in the city park. The 4 winners can select which type of tree they want. Assume
they select randomly.
What is the probability that 3 winners will select pine trees and the other tree will be a
maple?
A) 0.0058
B) 0.0218
C) 0.0355
D) 0.0709
A test is conducted to compare three different income tax software packages to
determine whether there is any difference in the average time it takes to prepare income
tax returns using the three different software packages. Ten different person’s income
tax returns are done by each of the three software packages and the time is recorded for
each. Which of the following is true?
A) The total degrees of freedom is 30.
B) The between blocks degrees of freedom is 2.
C) The between samples degrees of freedom is 2.
D) The three software packages are the blocks.
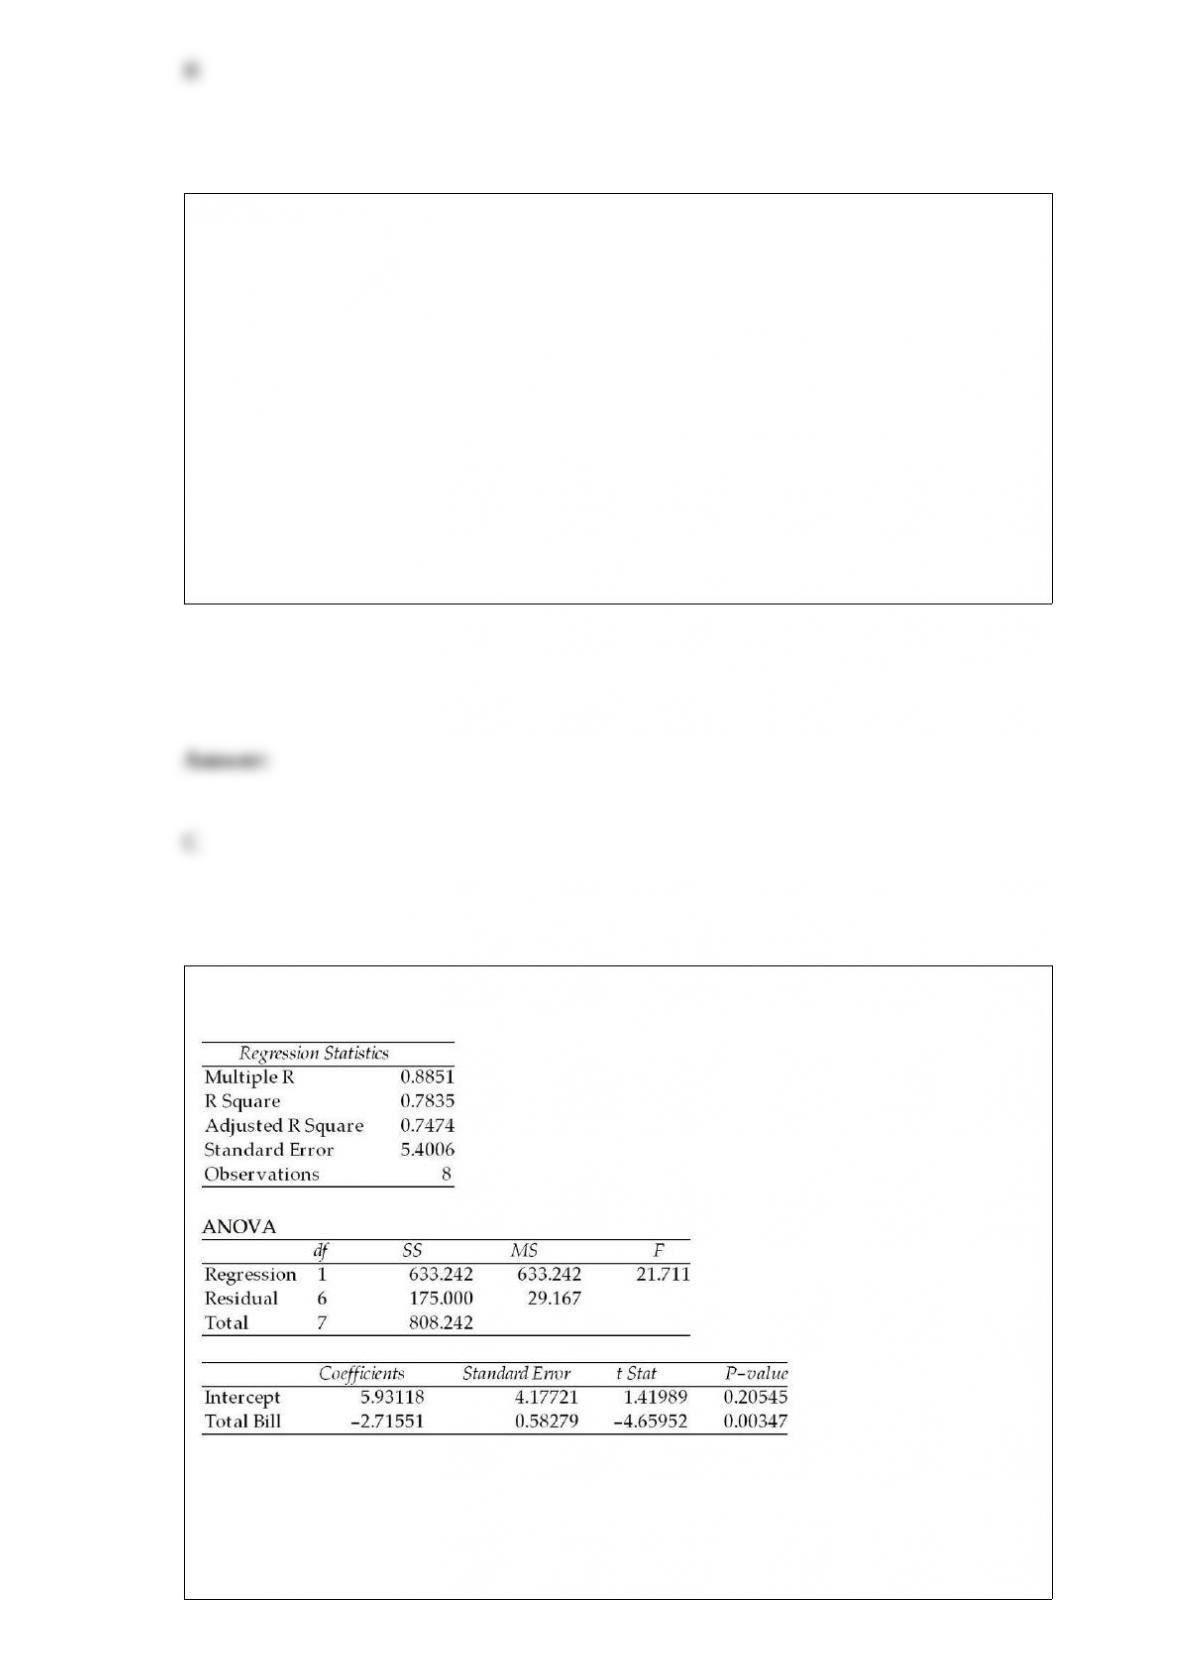
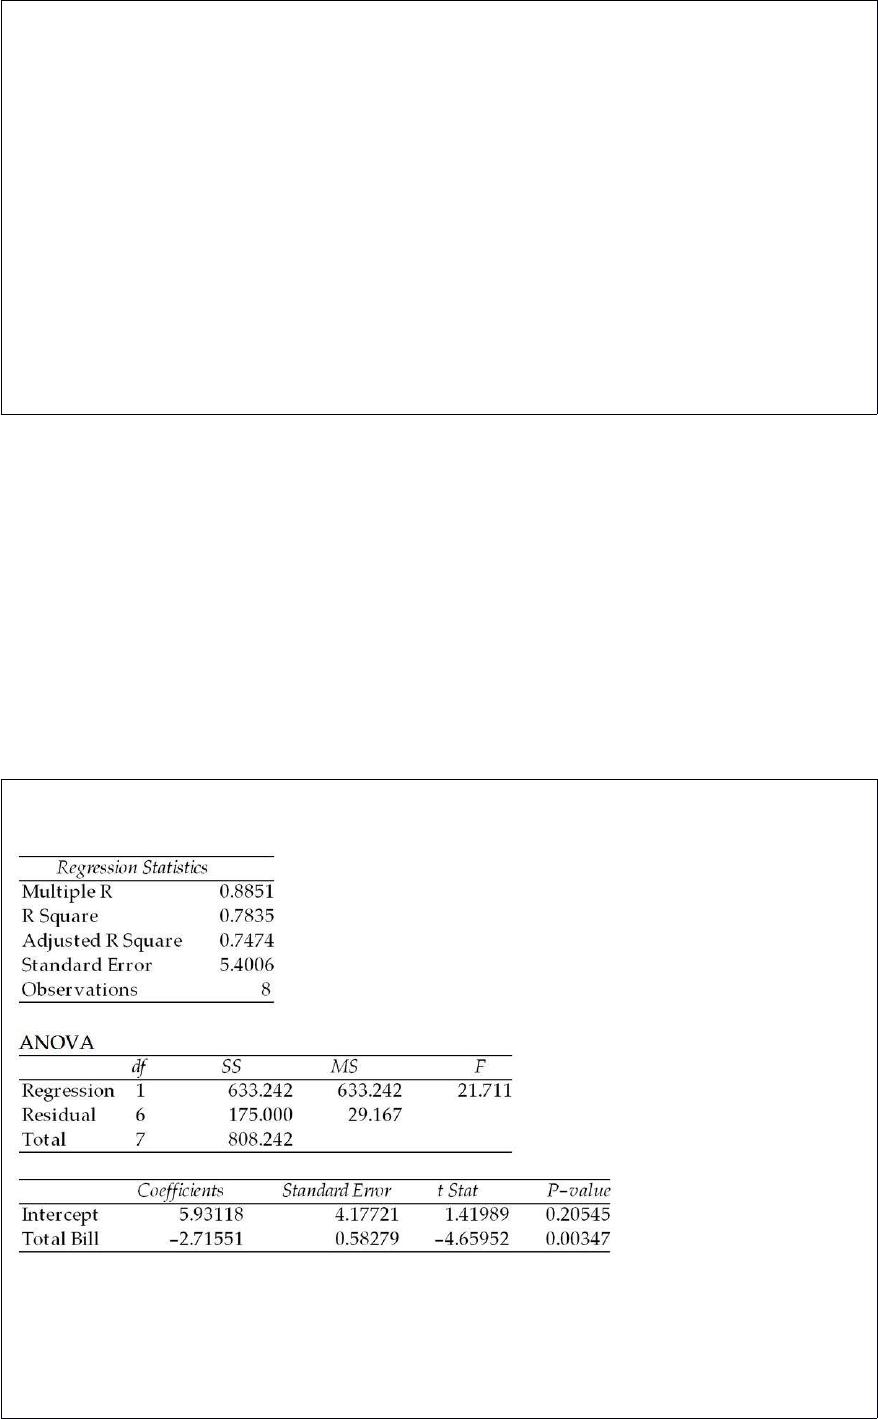
Use the following regression results to answer the question below.
Which of the following is true?
A) x explains about 88.5 percent of the variation in y.


B) y explains about 88.5 percent of the variation in x.
C) x explains about 78.4 percent of the variation in y.
D) y explains about 78.4 percent of the variation in x.
Which of the following is the most frequently used measure of variation?
A) The range
B) The standard deviation
C) The variance
D) The mode
Waiters at Finegold’s Restaurant and Lounge earn most of their income from tips. Each
waiter is required to “tip-out” a portion of tips to the table bussers and hostesses. The
manager has based the “tip-out” rate on the assumption that the mean tip is at least 15%
of the customer bill. To make sure that this is the correct assumption, he has decided to
conduct a test by randomly sampling 60 bills and recording the actual tips.
State the appropriate null and alternative hypotheses.
A) H0 : μ ≥ 15 Ha : μ < 15
B) H0 : μ ≤ 15 Ha : μ > 15
C) H0 : μ ≥ 9 Ha : μ < 9
D) H0 : μ ≤ 9 Ha : μ > 9
A study was conducted to determine if differences in new textbook prices exist between
on-campus bookstores, off-campus bookstores, and Internet bookstores. To control for
differences in textbook prices that might exist across disciplines, the study randomly
selected 12 textbooks and recorded the price of each of the 12 books at each of the three
retailers. You may assume normality and equal-variance assumptions have been met.
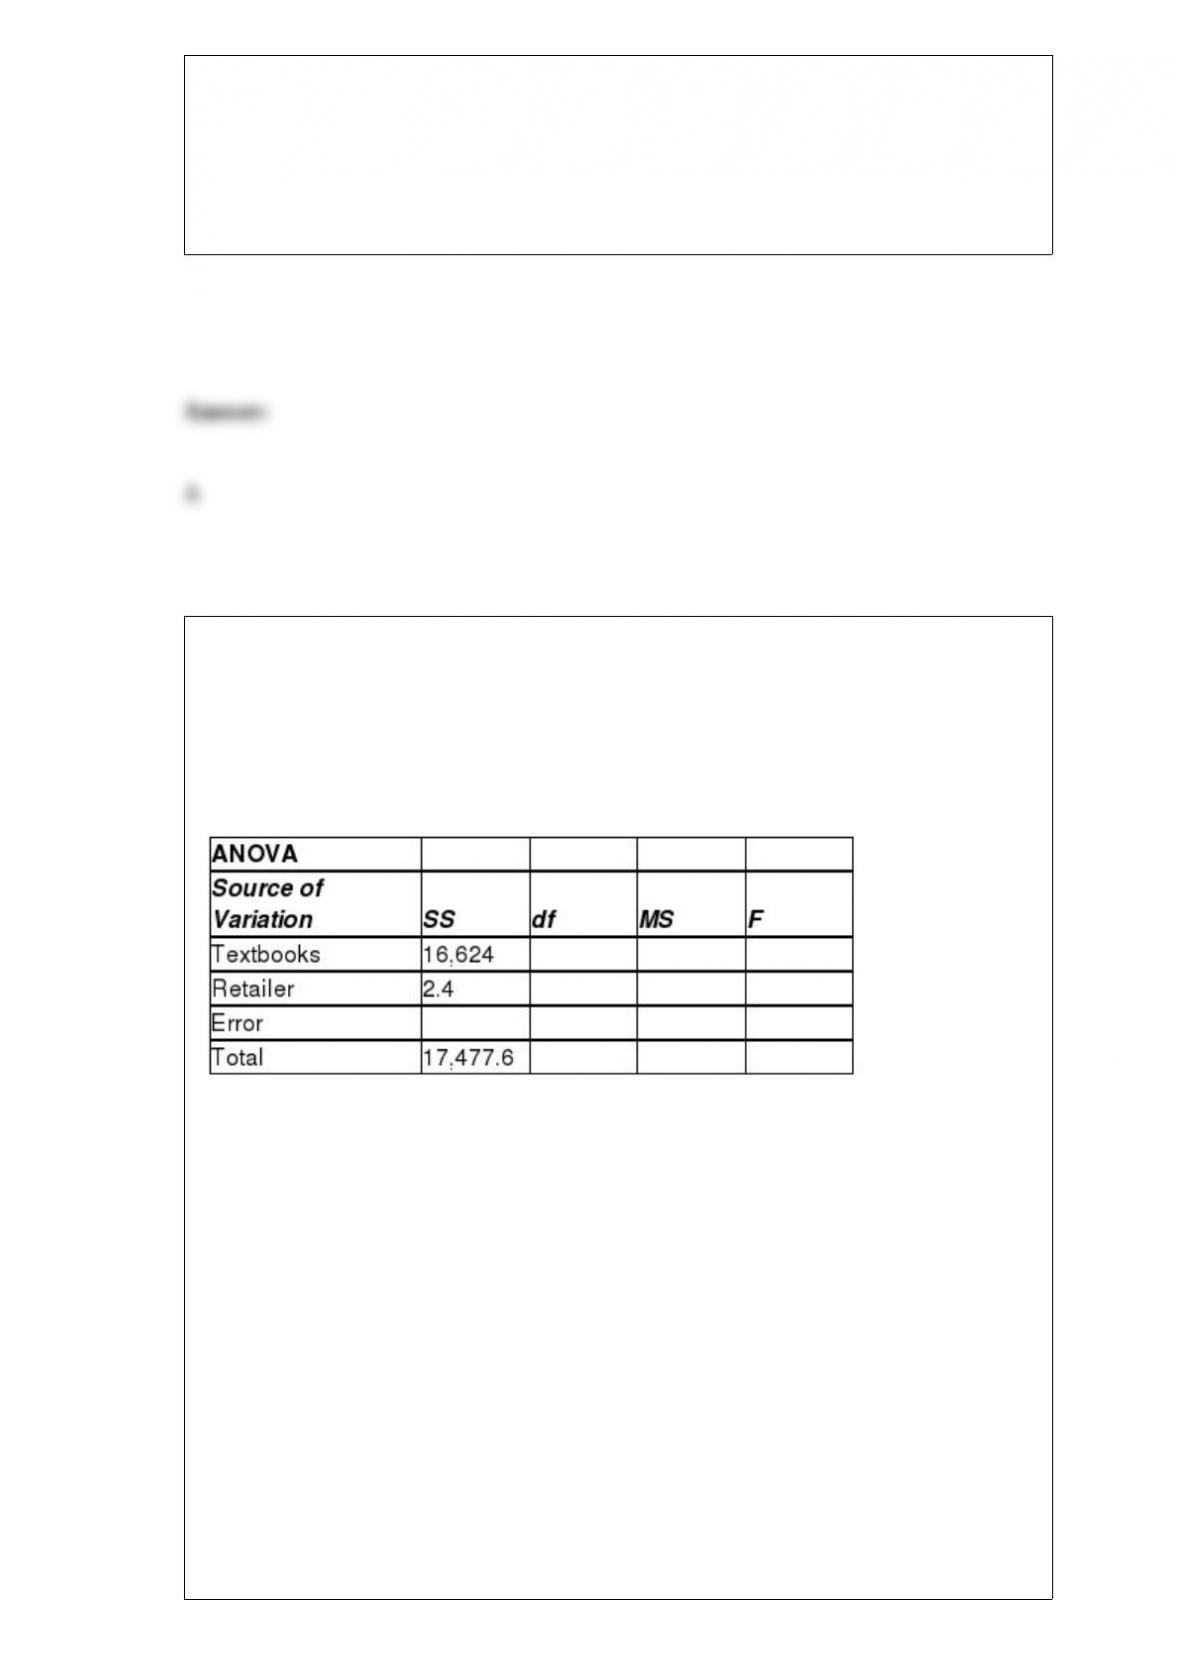
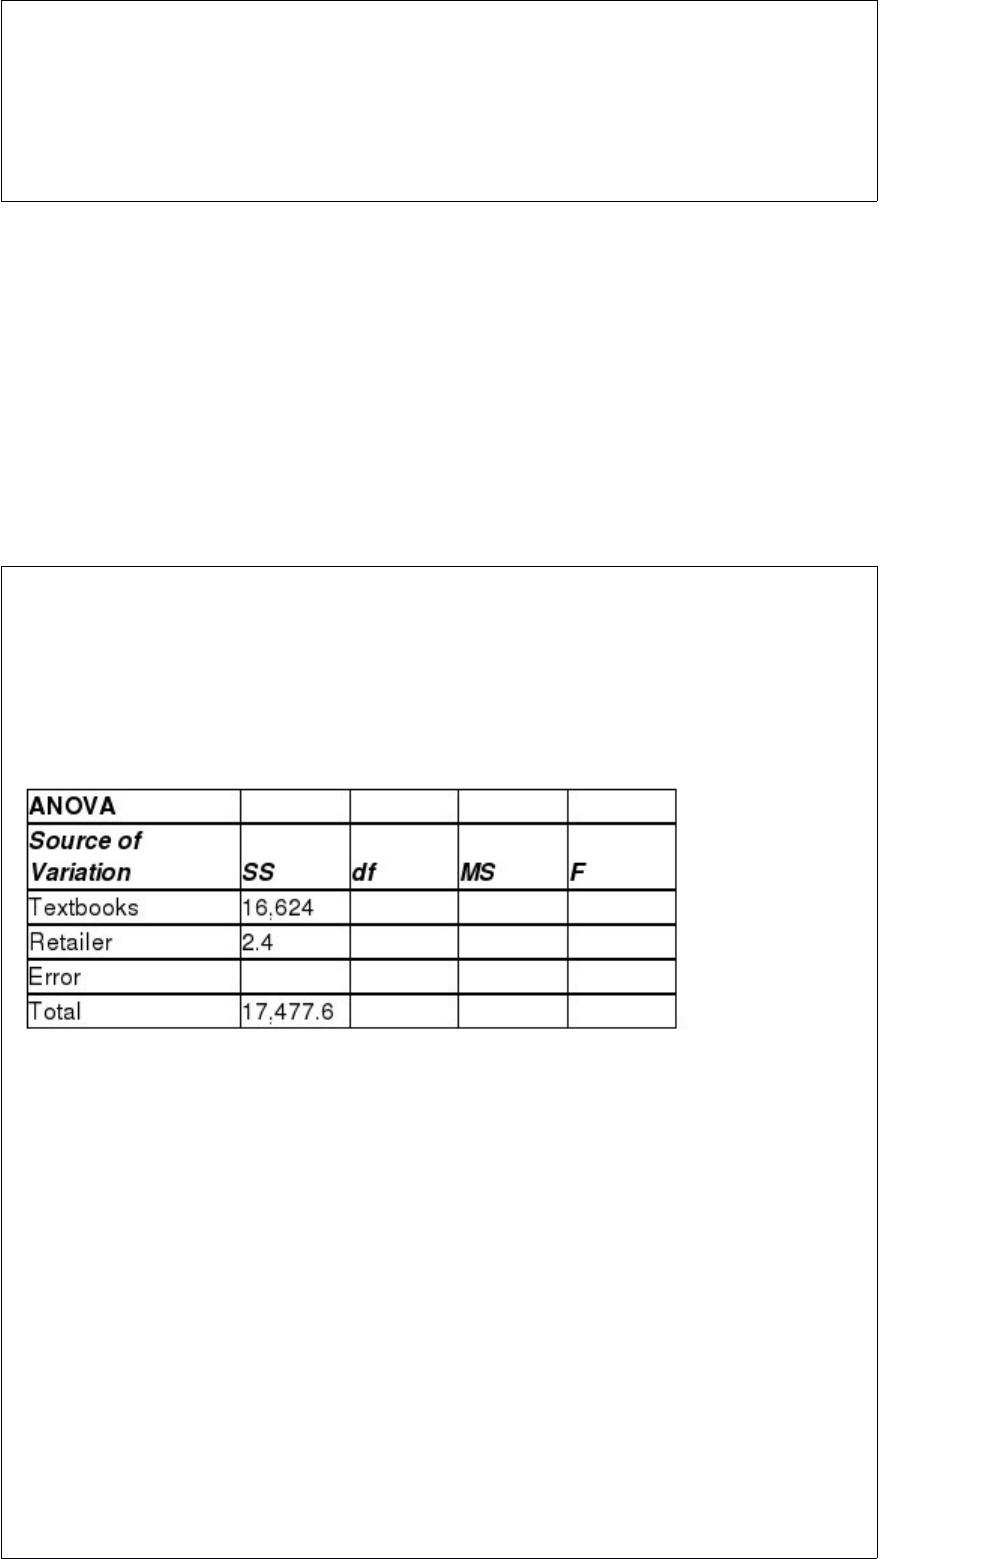
The partially completed ANOVA table based on the study’s findings is shown here:
Based on the study’s findings, can it be concluded that there is a difference in the
average price of textbooks across the three retail outlets? Conduct the appropriate
hypothesis test at the alpha = 0.10 level of significance.
A) F = 0.0411 < Fα=0.10 = 2.56, reject the null hypothesis. Thus, based on these sample
data we can conclude that there is a difference in textbook prices at the three different
types of retail outlets.
B) F = 0.0411 < Fα=0.10 = 2.56, do not reject the null hypothesis. Thus, based on these
sample data we cannot conclude that there is a difference in textbook prices at the three
different types of retail outlets.
C) F = 0.031 < Fα=0.10 = 2.56, reject the null hypothesis. Thus, based on these sample
data we can conclude that there is a difference in textbook prices at the three different
types of retail outlets.
D) F = 0.031 < Fα=0.10 = 2.56, do not reject the null hypothesis. Thus, based on these
sample data we cannot conclude that there is a difference in textbook prices at the three
different types of retail outlets.
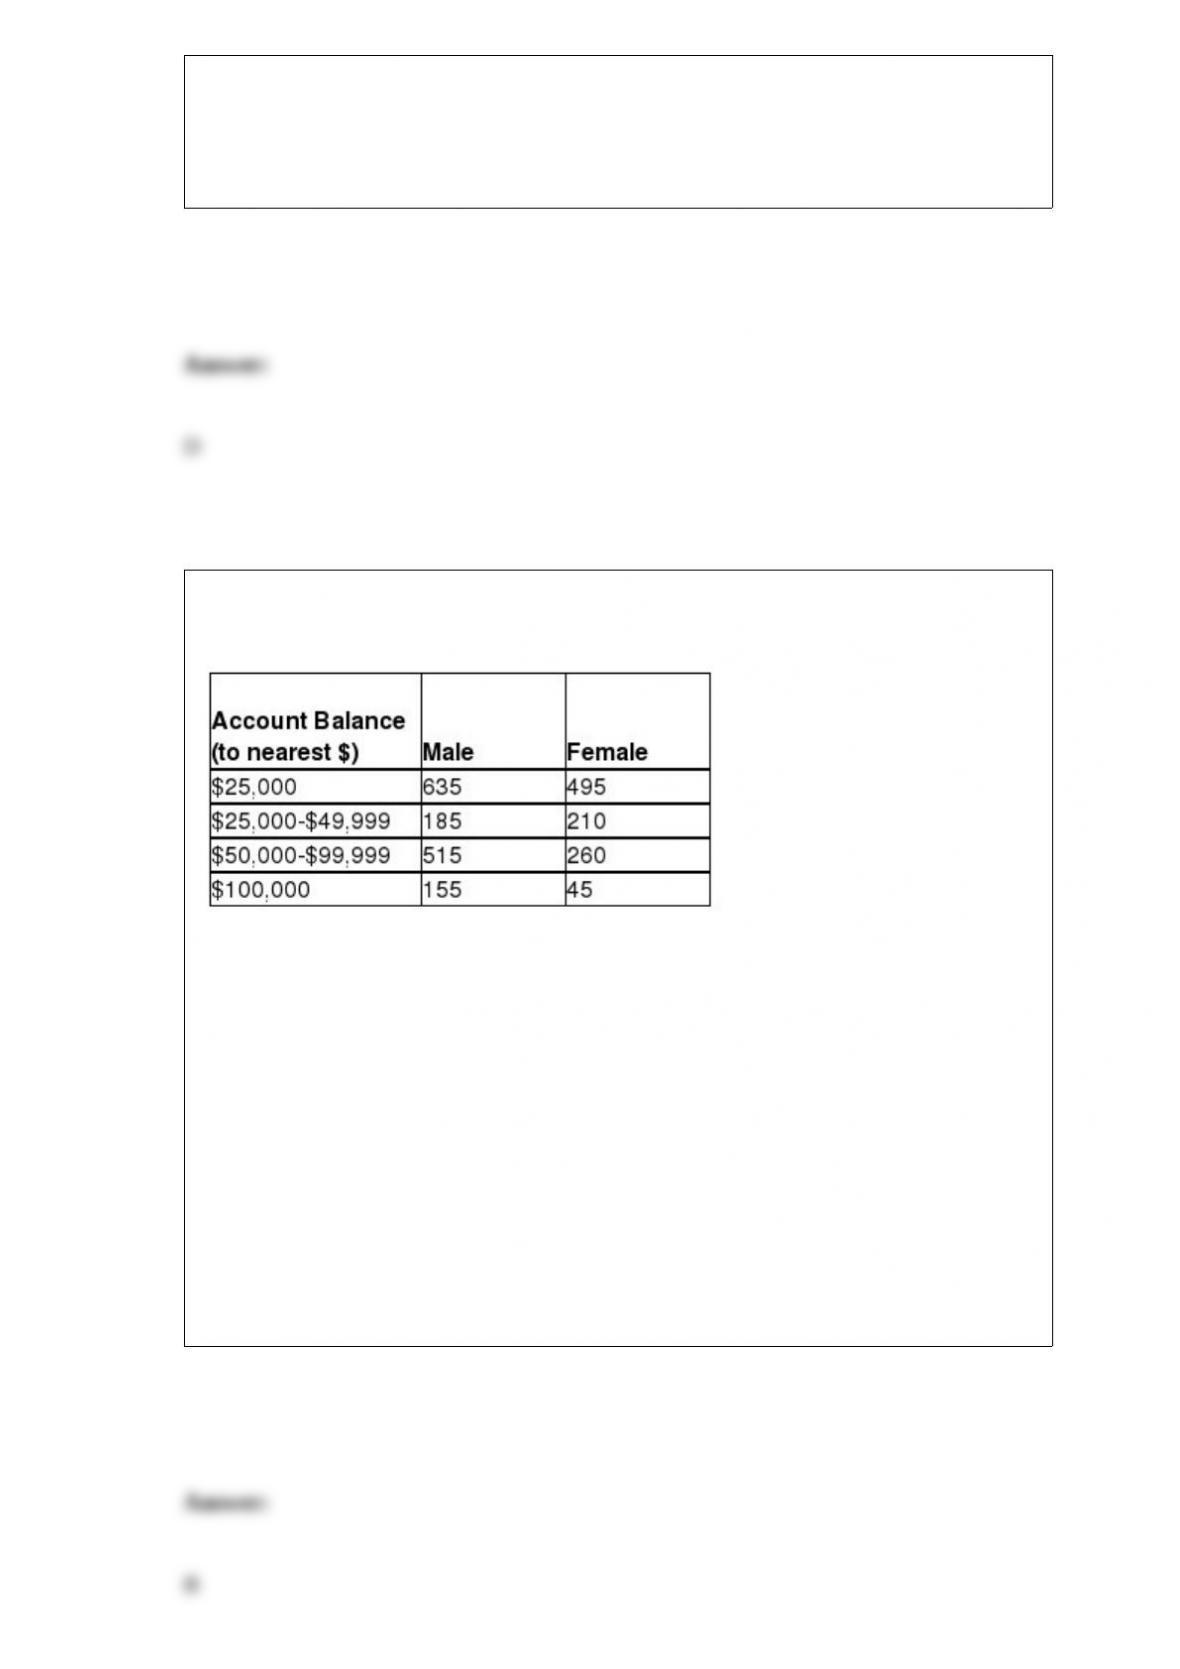
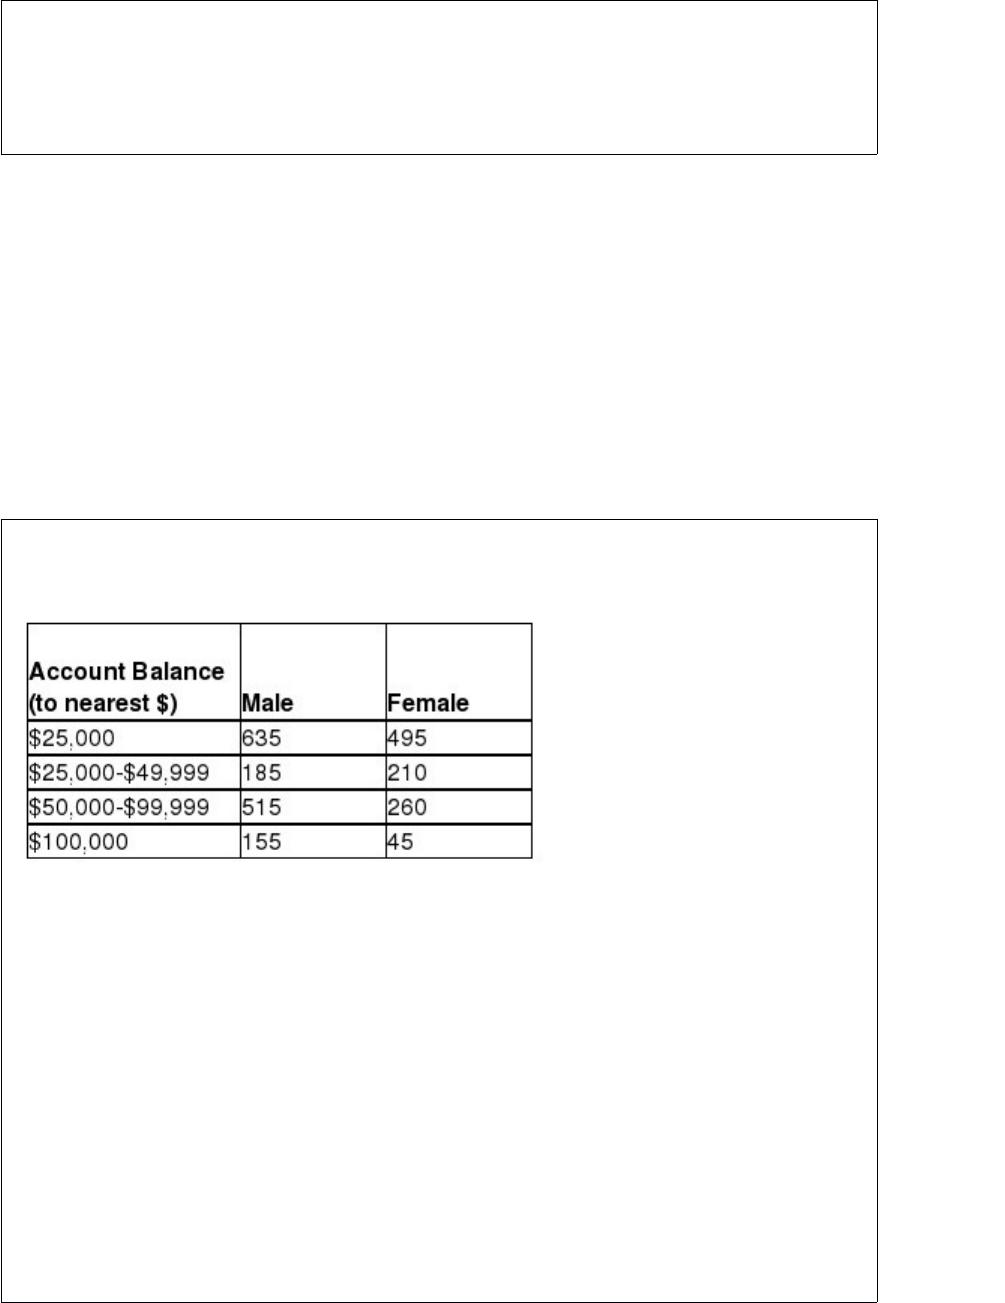
The results of a census of 2,500 employees of a mid-sized company with 401(k)
retirement accounts are as follows:
Suppose researchers are going to sample employees from the company for further
study.
Compute the probability that a randomly selected employee will be a female with an
account balance between $50,000 and $99,999.
A) 0.1580
B) 0.1040
C) 0.6160
D) 0.4040


The human resources department at a major high tech company plans to conduct an
employee satisfaction study by sampling 100 employees from the 3,000 total
employees. They plan to use systematic random sampling since the employee file is in
alphabetic order. The first employee selected in the study should be:
A) the 30th employee.
B) employee 1 to 30 randomly selected.
C) employee 1 to 100 randomly selected.
D) the first employee.
A population measure, such as the population mean, is called a:
A) statistic.
B) parameter.
C) prime number.
D) sample value.
John Thurgood founded a company that translates Chinese books into English. His
company is currently testing a computer-based translation service. Since Chinese
symbols are difficult to translate, John assumes the computer program will make some
errors, but then so do human translators. The computer error rate is supposed to be an
average of 3 per 400 words of translation. Suppose John randomly selects a 1,200-word
passage. Assuming that the Poisson distribution applies, if the computer error rate is
actually 3 errors per 400 words, calculate the probability that more than 14 errors will
be found.
A) 0.000123
B) 0.0141
C) 0.0415
D) 0.4557
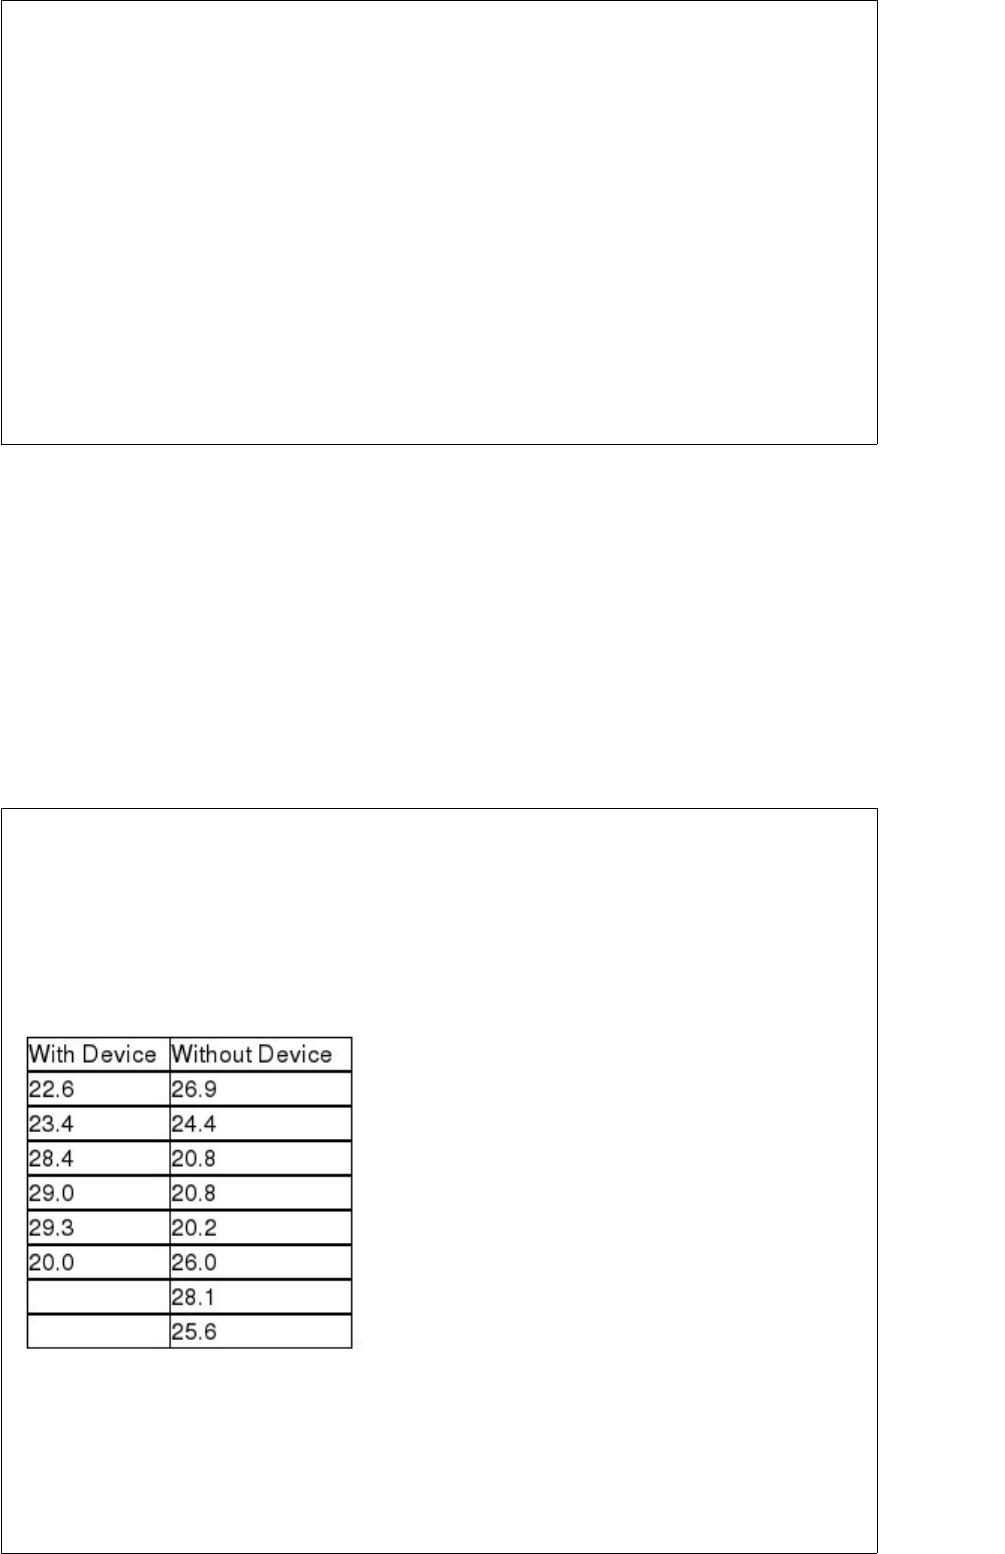
A company in Maryland has developed a device that can be attached to car engines,
which it believes will increase the miles per gallon that cars will get. The owners are
interested in estimating the difference between mean mpg for cars using the device
versus those that are not using the device. The following data represent the mpg for
random independent samples of cars from each population. The variances are assumed
equal and the populations normally distributed.
Given this data, what is the upper limit for a 95 percent confidence interval estimate for
the difference in mean mpg?
A) Approximately 3.88 mpg


B) About 5.44 mpg
C) Just under 25.0
D) None of the above
Which of the following statements is true?
A) When using a simple linear regression analysis model for prediction purposes, the
potential error in the forecast will be less when the value of x used to forecast y is closer
to .
B) The accuracy of the regression forecast is improved if the standard error for the
regression slope coefficient is reduced.
C) The use of regression analysis as a means of predicting the value for a dependent
variable is not impacted by sampling error since the regression model uses all sample
data to arrive at the regression model.
D) None of the above
Which of the following is not a step involved in the Wilcoxon signed rank test?
A) Find the deviations from the hypothesized median
B) Rank the deviations


C) Convert the deviations to absolute values
D) Find the deviations from the sample median
A sample of people who have attended a college football game at your university has a
mean = 3.2 members in their family. The mode number of family members is 2 and the
median number is 2.0. Based on this information:
A) the population mean exceeds 3.2.
B) the distribution is bell-shaped.
C) the distribution is right-skewed.
D) the distribution is left-skewed.
In analyzing the residuals to determine whether the simple regression analysis satisfies
the regression assumptions, which of the following is true?
A) The histogram of the residuals should be approximately bell-shaped.
B) The scatter plot of the residuals against the dependent variable should illustrate that
the variation in residuals is the same over all levels of .
C) Neither A nor B are true.
D) Both A and B are true.
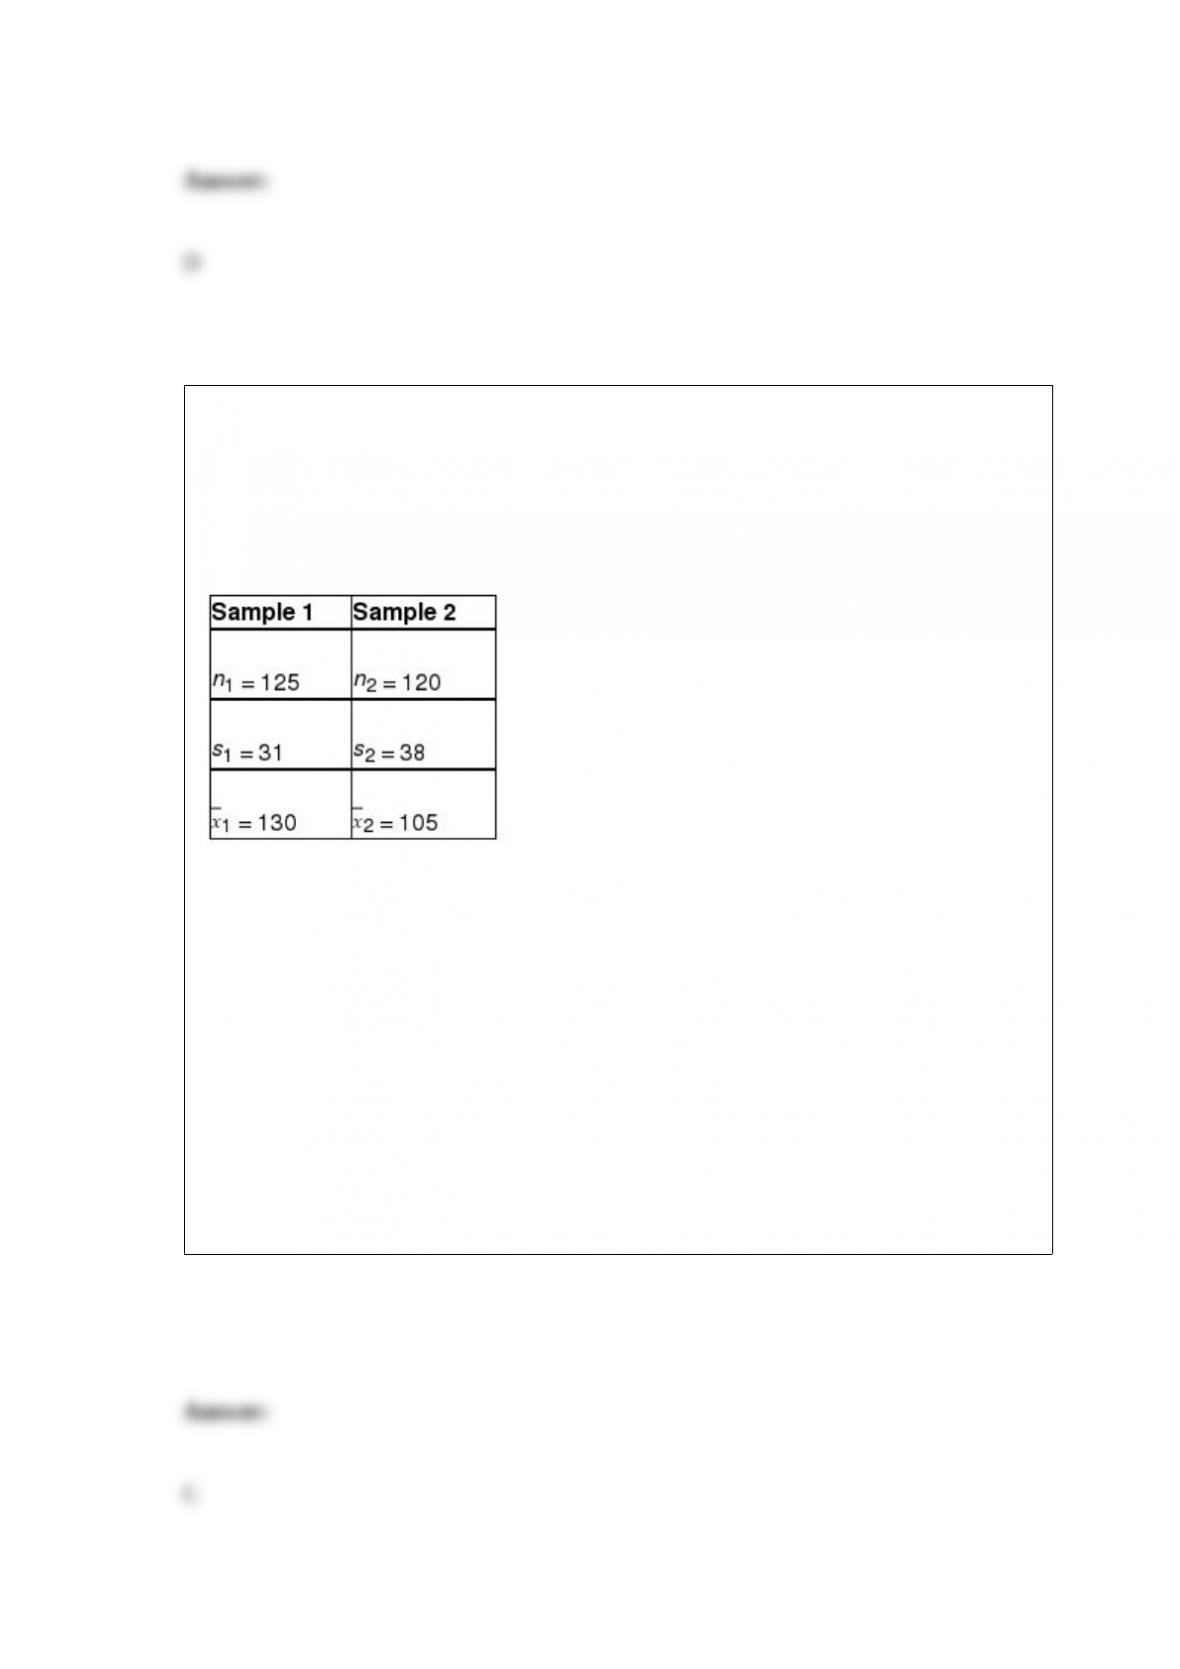
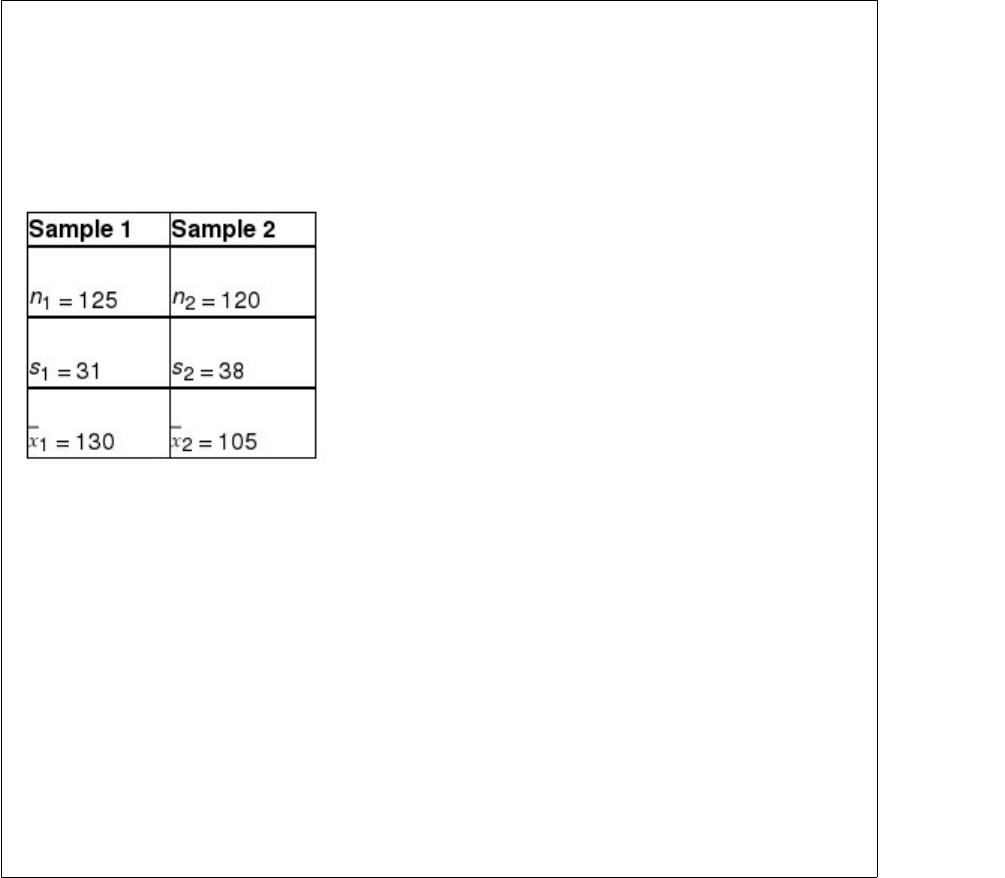
Given the following null and alternative hypotheses
H0 : μ1 – μ2 = 0
HA : μ1 – μ2 ≠ 0
Together with the following sample information
Test the null hypothesis and indicate whether the sample information leads you to reject
or fail to reject the null hypothesis, assuming a significance level of 0.05 is to be used.
Use the test statistic approach.
A) Since 0.812 < 1.9698 reject H0
B) Since 1.041 < 1.9698 reject H0
C) Since 5.652 > 1.9698 reject H0
D) Since 4.418 > 1.9698 reject H0


If a data set has 1,133 sorted values, what value corresponds to the 3rd quartile?
A) The 250th value
B) The 850th value
C) The 760th value
D) The 849th value
When data are organized into levels, the highest data level is:
A) interval level data.
B) nominal level data.
C) ordinal level data.
D) ratio level data.
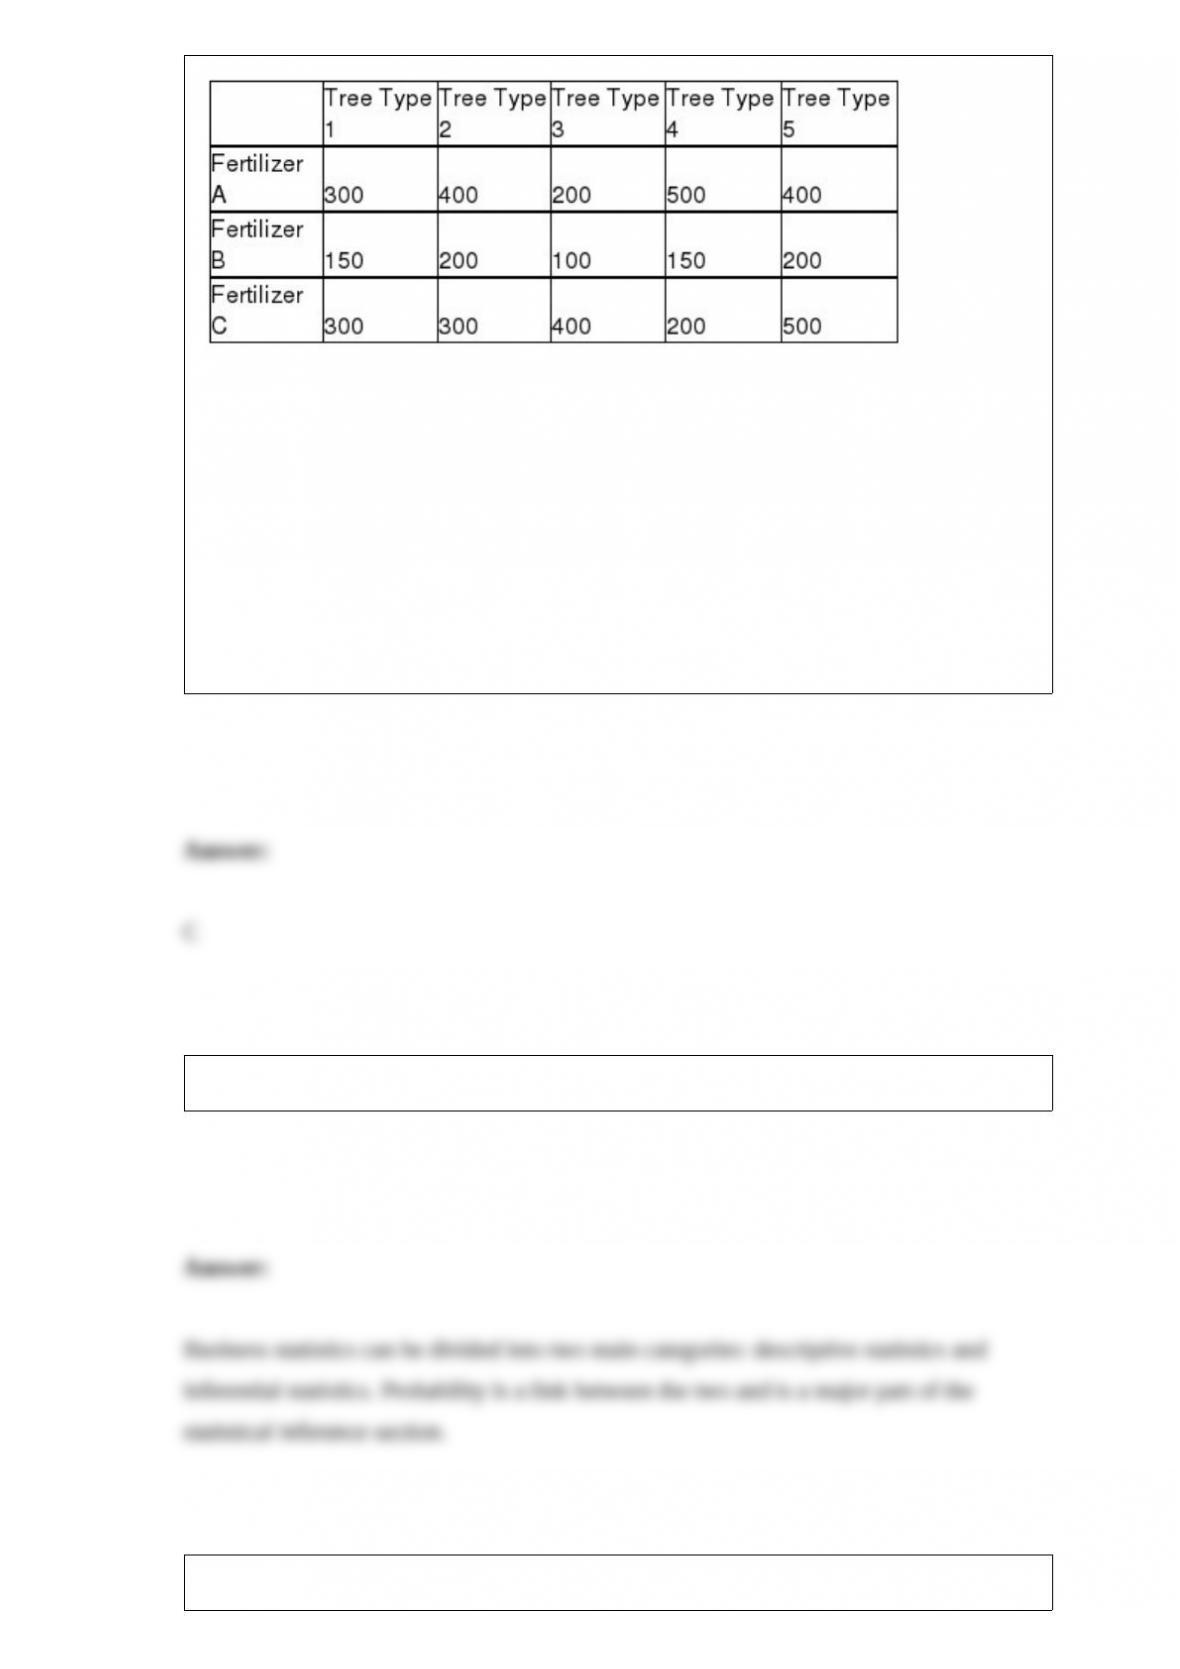
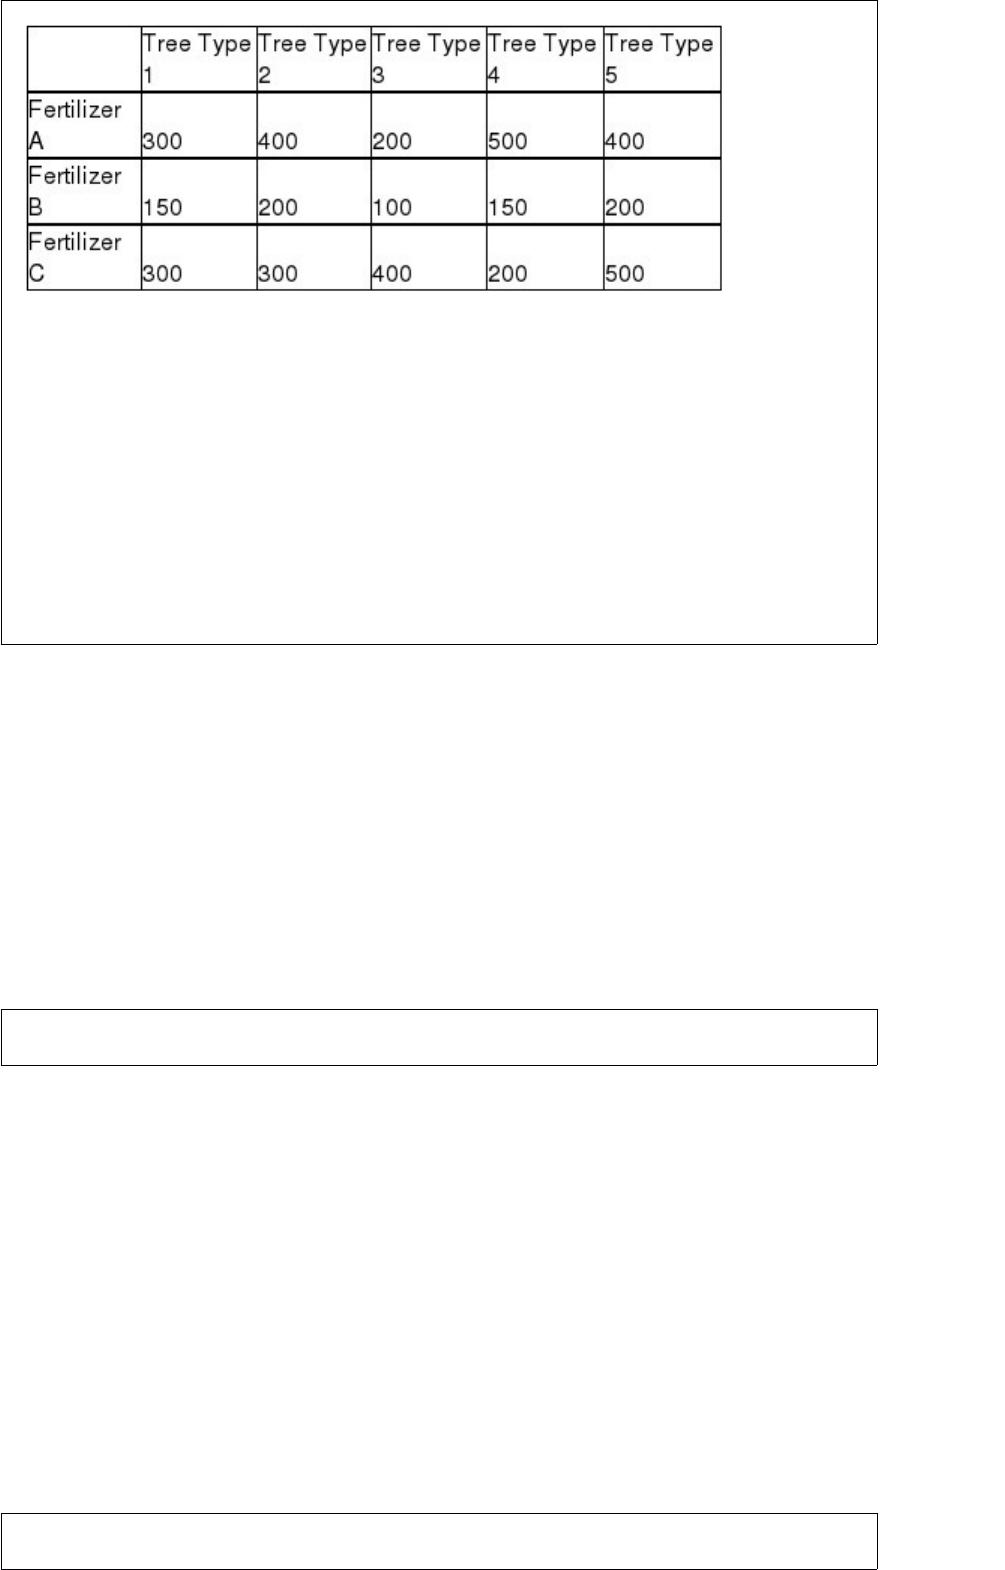
A large orchard owner in the state of Washington is interested in determining whether
the mean number of bushels of peaches per acre is the same or different depending on
the type of tree that is used. He also thinks that production may be affected by the type
of fertilizer that is used. To test, he has set up a test in which a one-acre plot of peach
trees with a combination each of 5 varieties and 3 fertilizer types are studied. The
following data reflect the number of bushels of peaches on each acre plot.
Assuming that the hypothesis tests will be conducted using an alpha equal 0.05 level,
what is the value of the Fisher’s LSD critical value for doing the multiple comparisons?
A) Approximately 16.78
B) About 11.30
C) Approximately 186.7
D) Need to know the number of trees planted on each acre.
What are the major categories of statistical tools that will be covered in this course?
What is meant by the term statistical inference?

Under what circumstances would you use a randomized complete block analysis of
variance design instead of a one-way analysis of variance?

Under what conditions should a decision maker use a nonparametric statistical
procedure?
The following regression output is the result of a multiple regression application in
which we are interested in explaining the variation in retail price of personal computers
based on three independent variables, CPU speed, RAM, and hard drive capacity.
However, some of the regression output has been omitted.
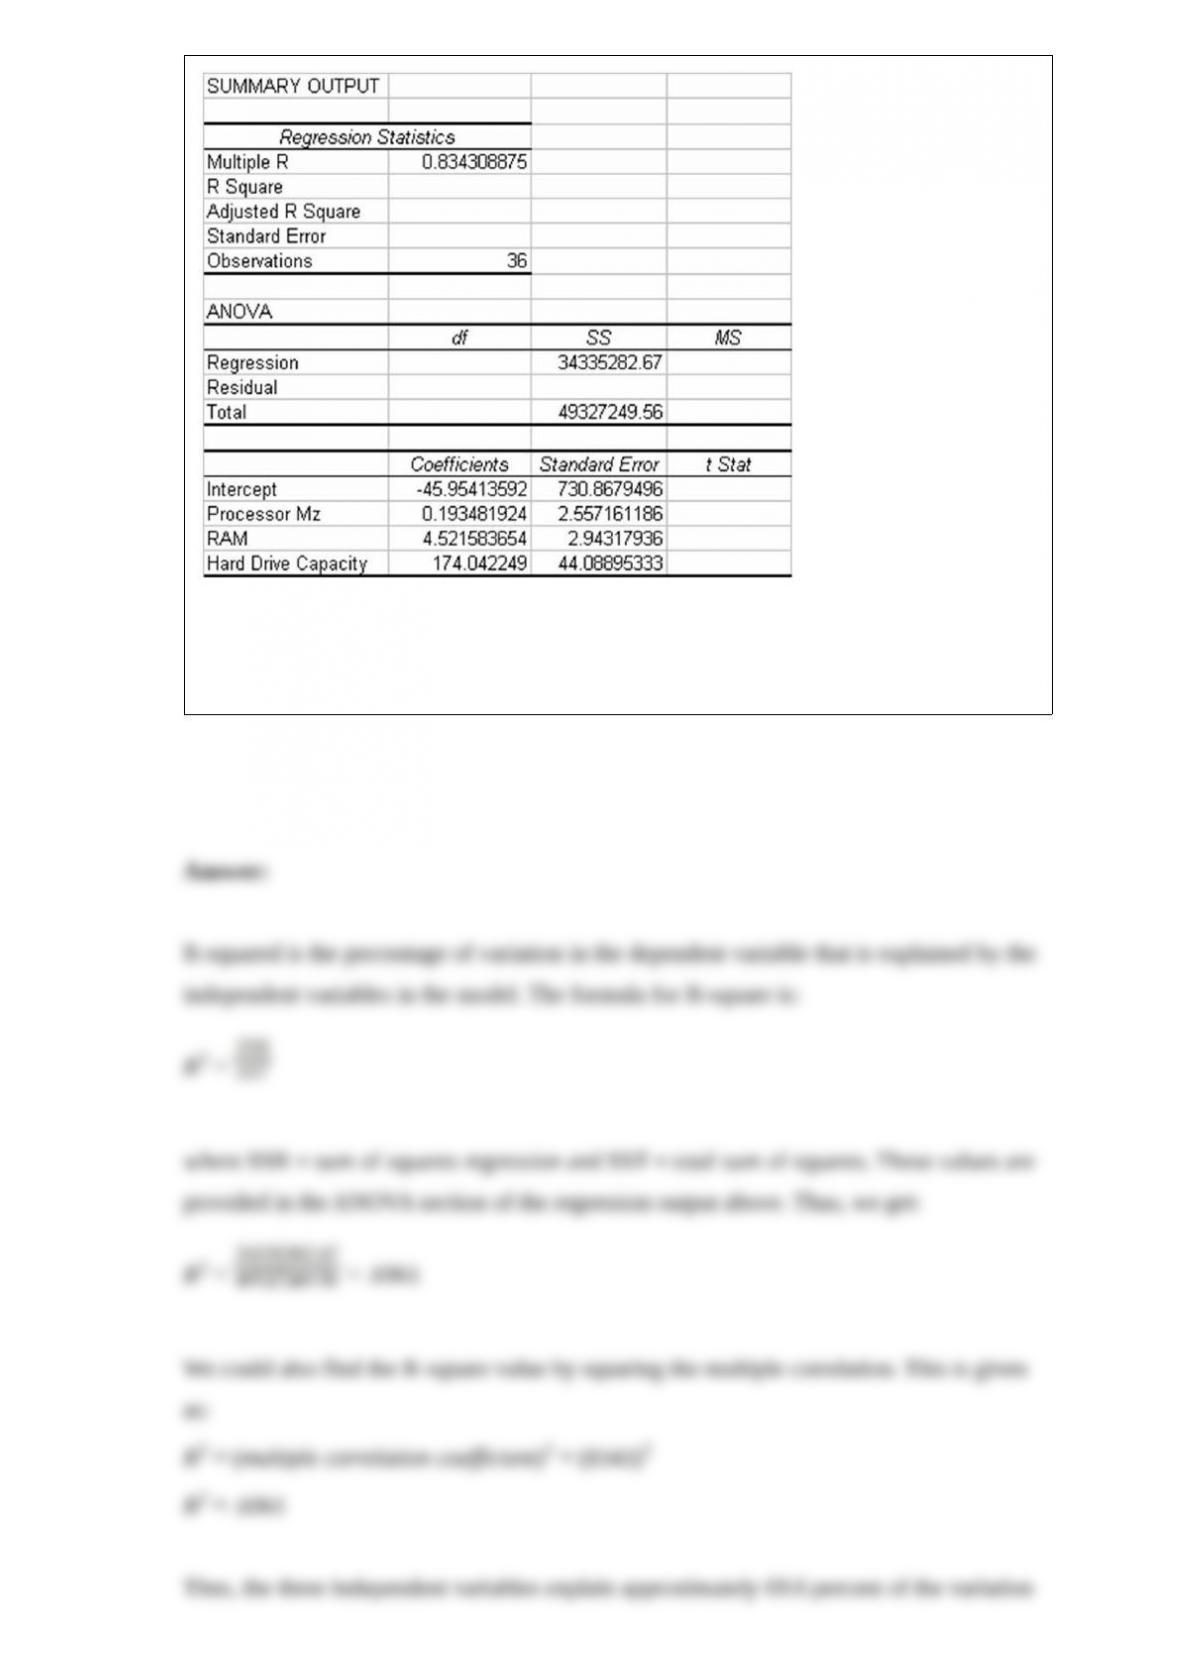
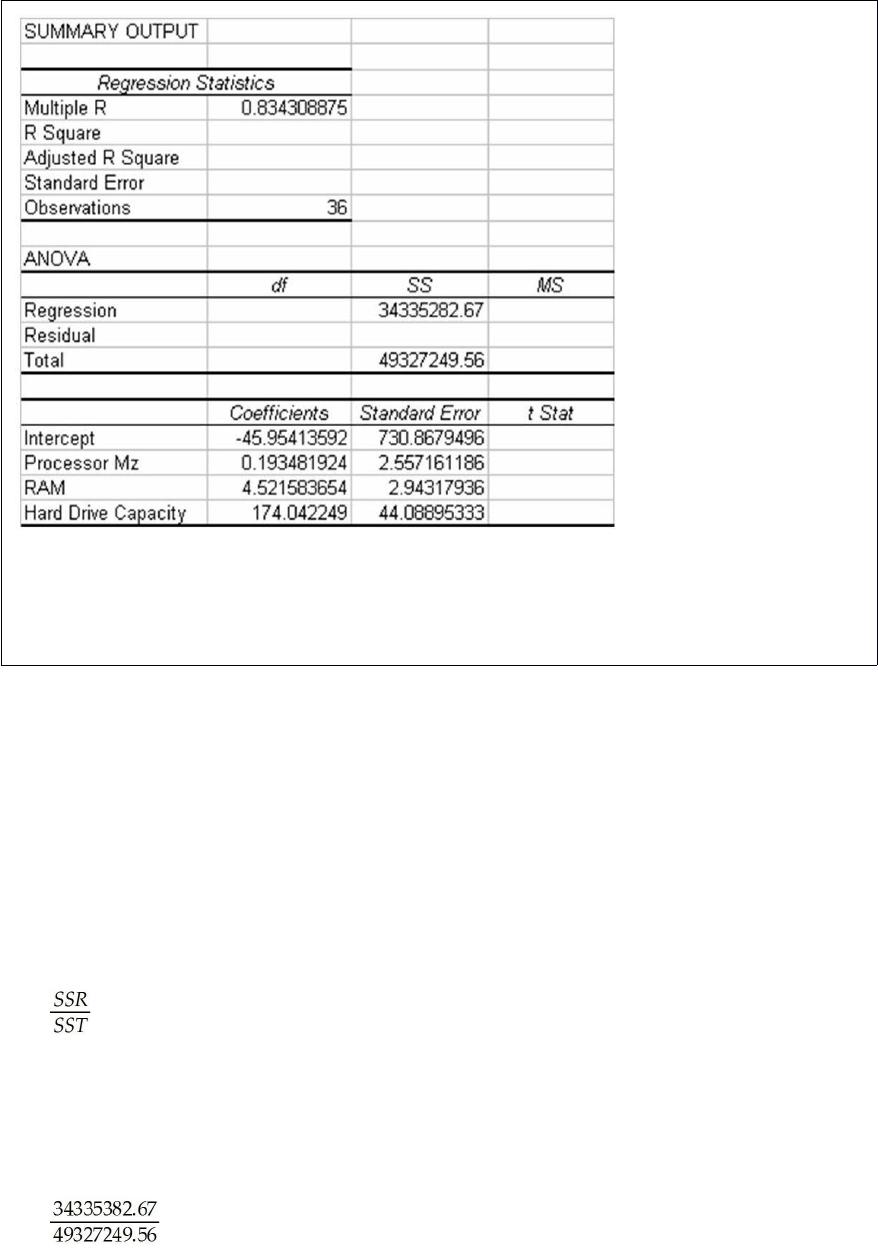
Given this information and your knowledge of multiple regression, what percentage of
variation in the dependent variable is explained by the three independent variables in
the model?

List three methods of assessing probabilities and indicate which is least likely to be
used in business decision making.
What is meant by the terms Type I and Type II statistical error?
Referring to the SPC chart signals that a process is out of control, what type of problem
does each signal indicate? List the signals.

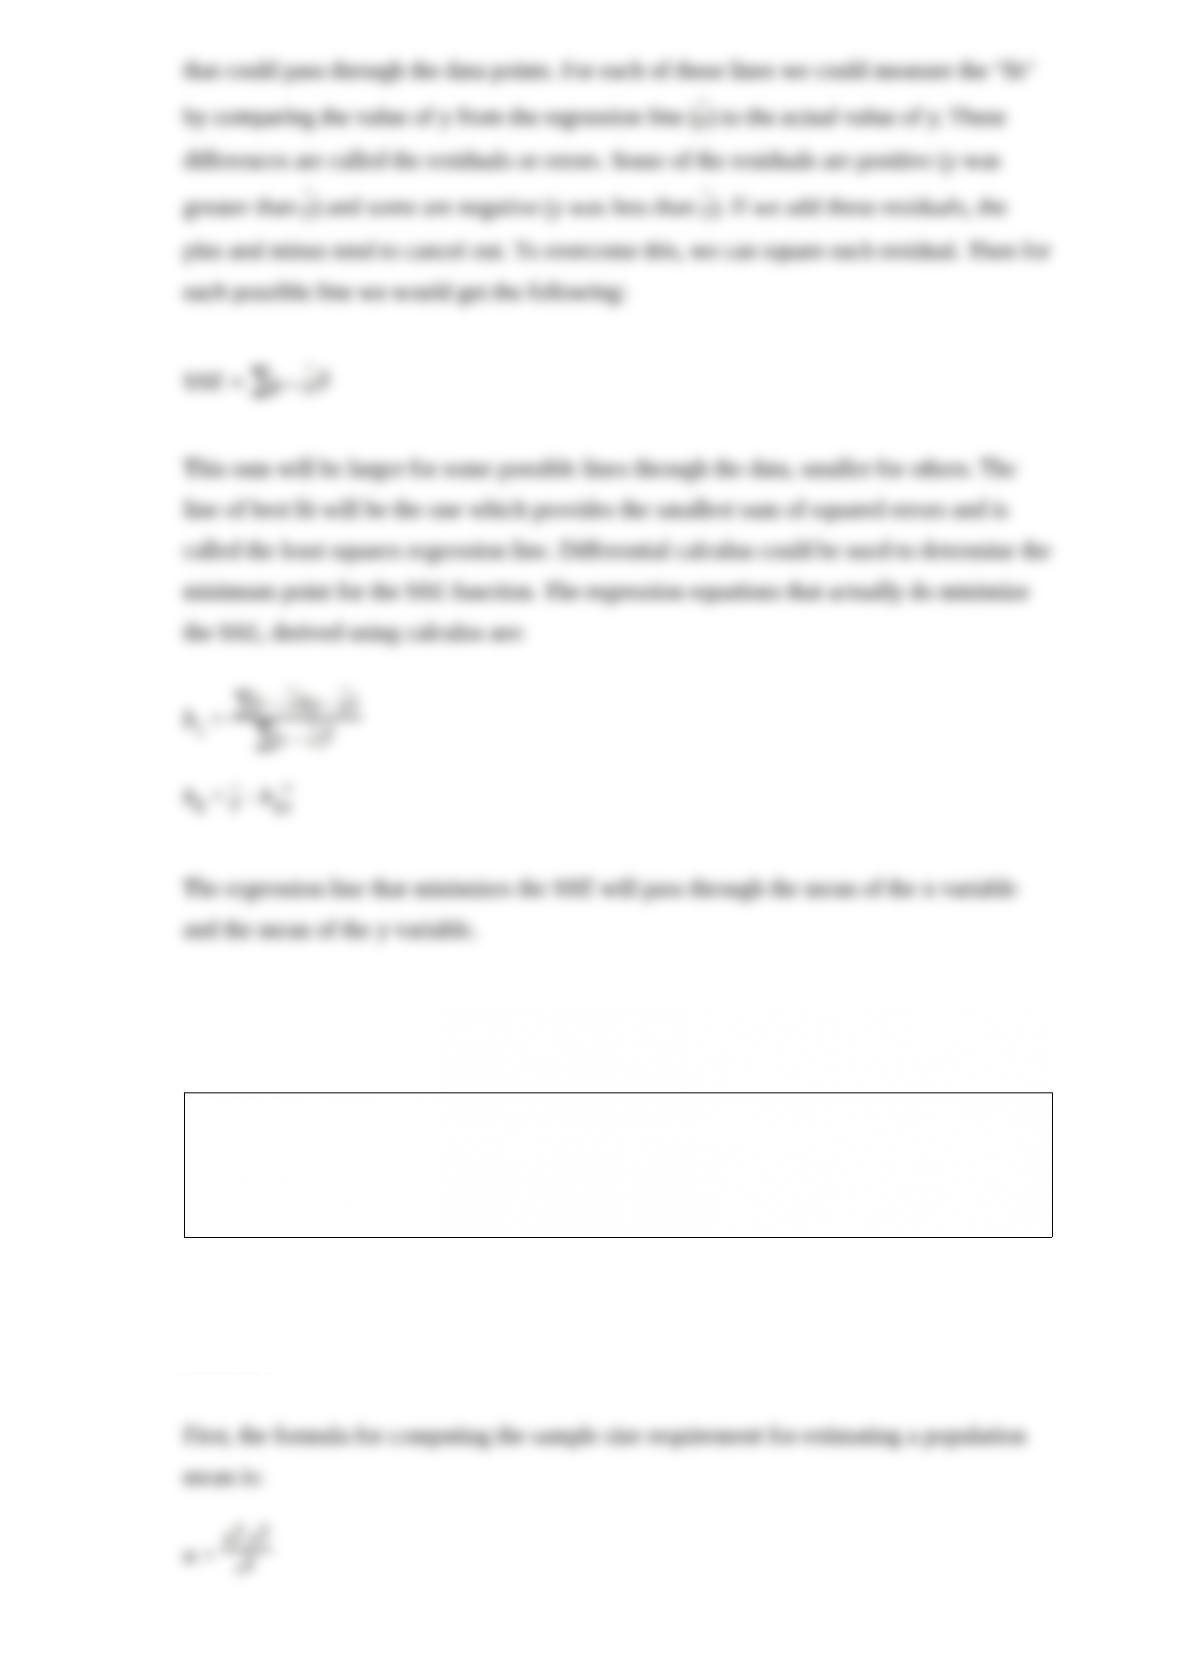
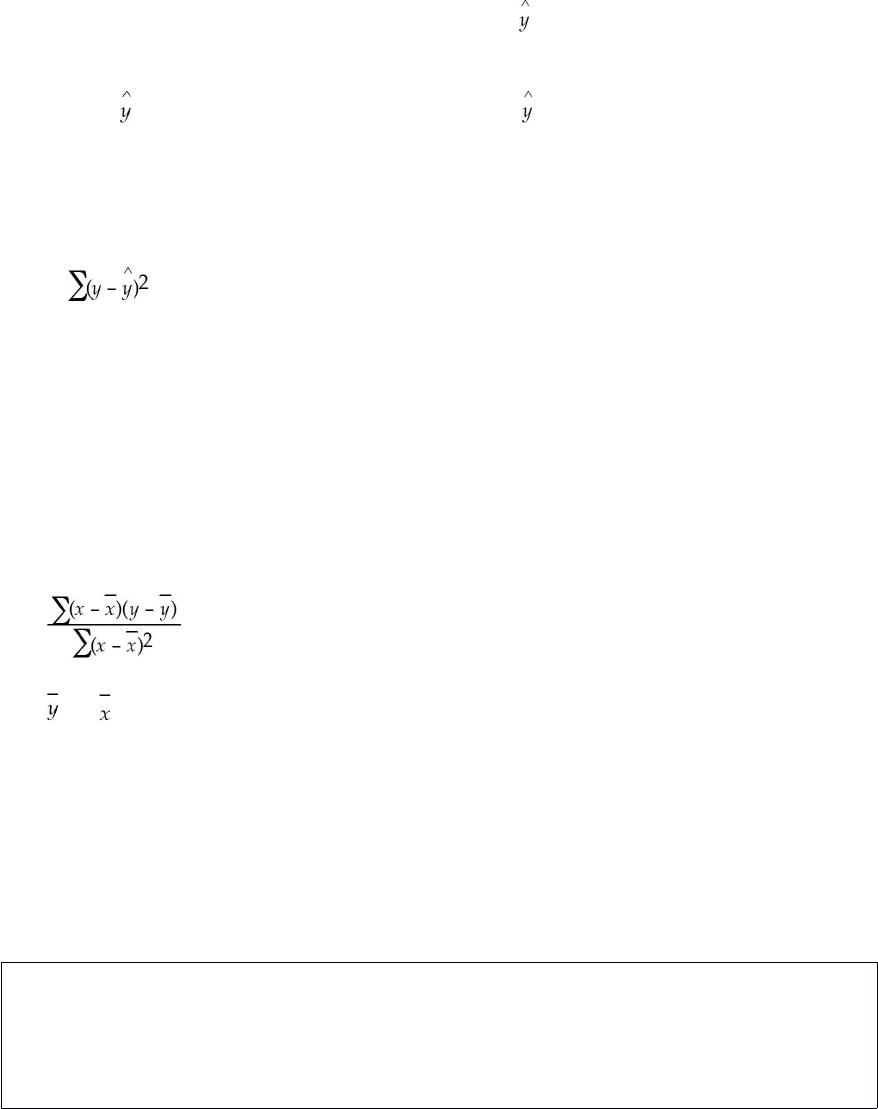
Explain what is meant by the term least squares regression model.
If a manager is interested in estimating the mean time customers spend shopping in a
store on each visit to the store, she may want to develop a confidence interval estimate.
Suppose, she has determined the required sample size and feels that she cannot afford
one that large. What options are available?
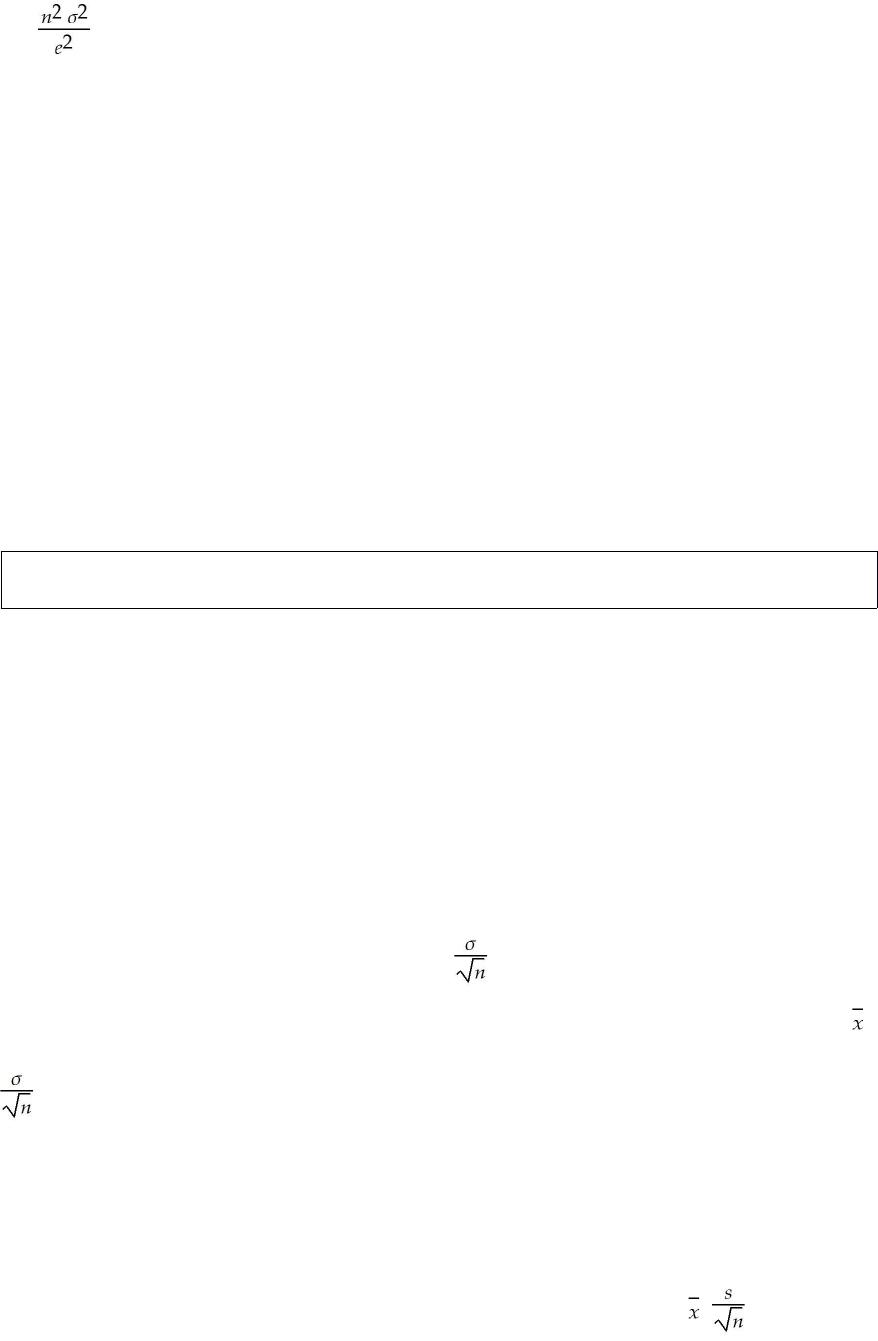
What are the disadvantages of using a small sample to estimate the population mean?
The sampling distribution for a proportion has a formula for that standard error that
involves using p. Yet when a confidence interval is calculated for a proportion, the
standard error formula uses the sample proportion. Why do they differ?
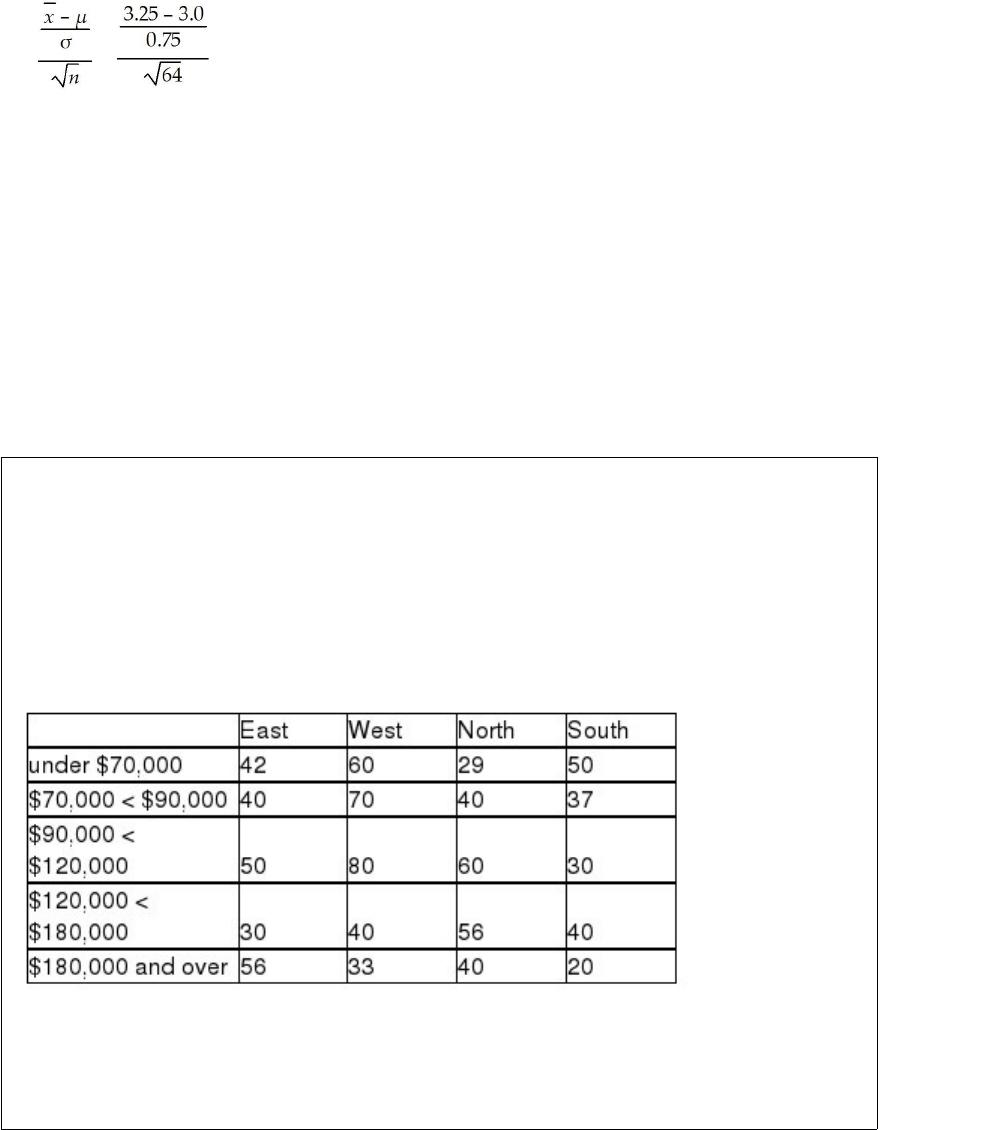
A company makes a device that can be fitted to automobile engines to improve the
mileage. The company claims that if the device is installed, owners will observe a mean
increase of more than 3.0 mpg. Assuming that the population standard deviation of
increase is known to be 0.75 mpg, and a sample of size 64 cars is selected with an =
3.25 mpg, use the p-value approach to test the null hypothesis using a significance level
of 0.05.
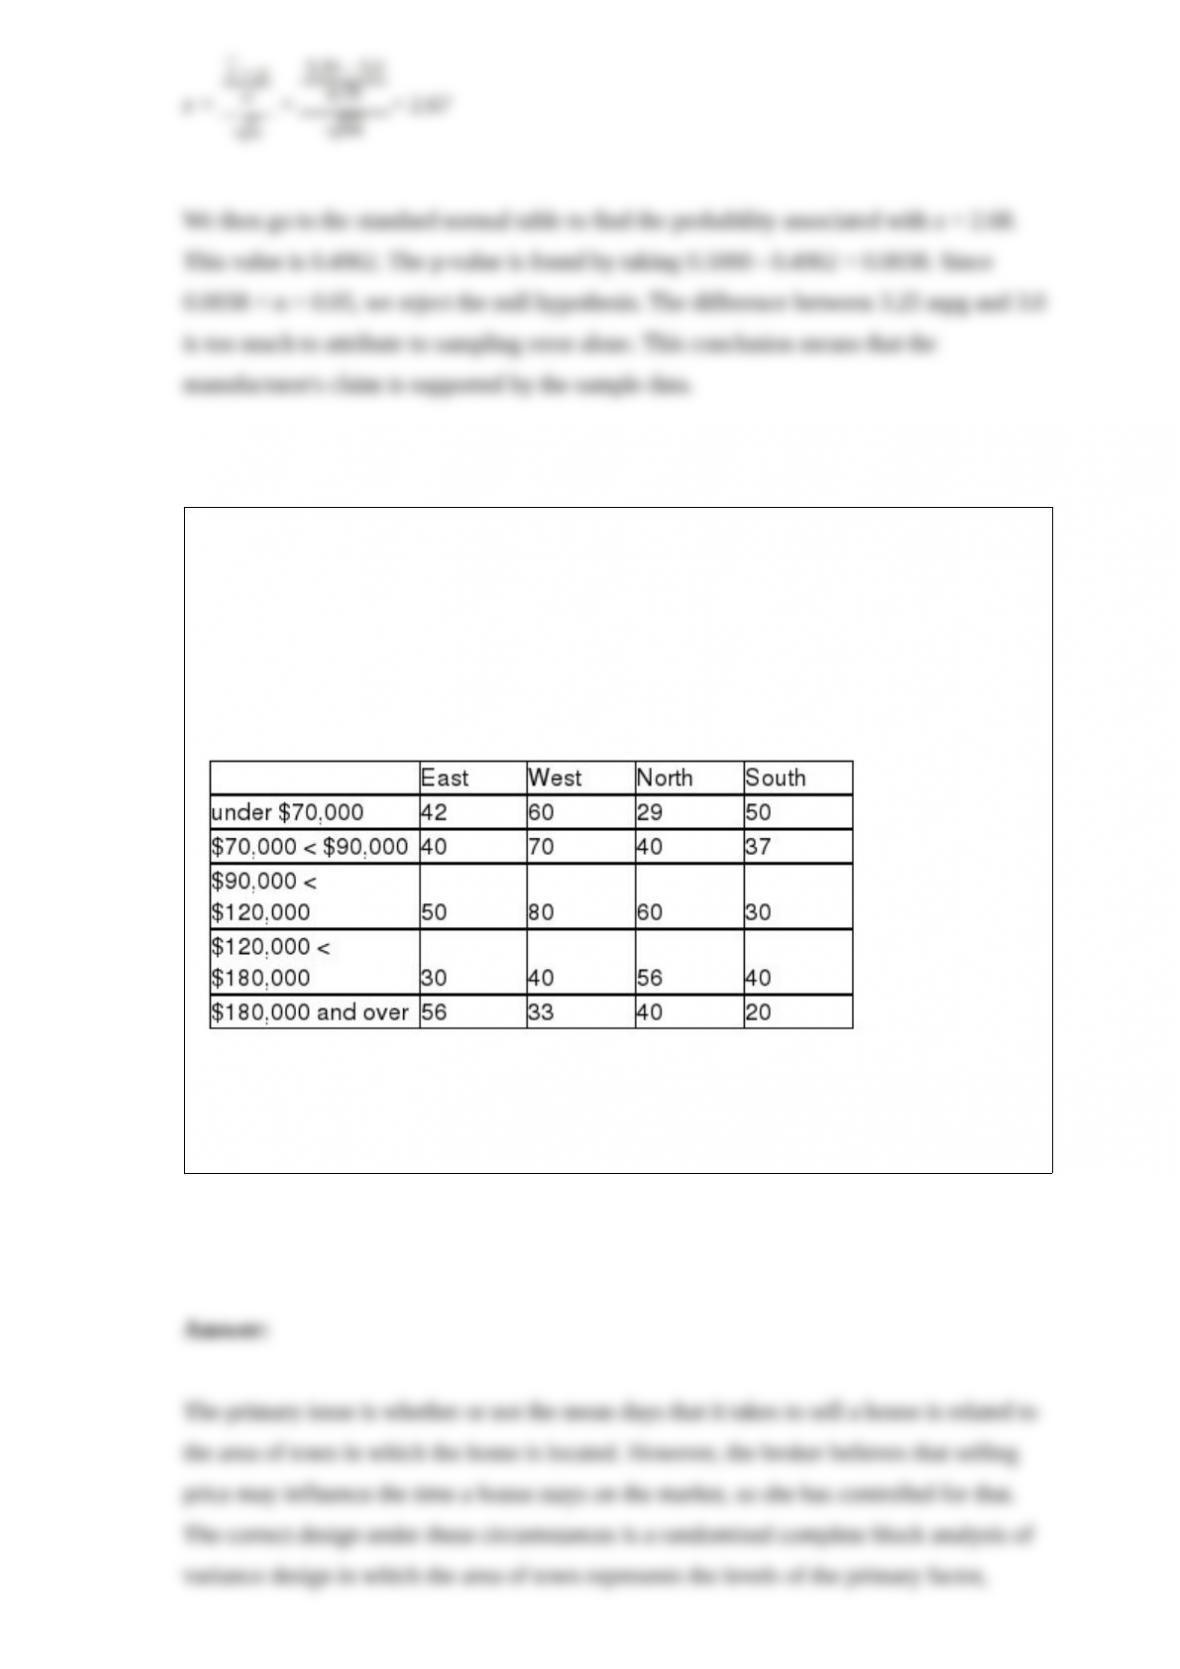
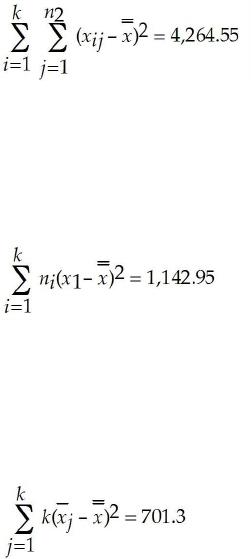
A real estate broker is interested in determining whether there is a difference in the
mean number of days a home stays on the market before selling based on which area of
the city it is located in. However, she is also concerned that the price of the house may
be an issue in determining how long it takes to sell a house, so she wants to control for
this. To carry out the test, she plans to randomly select one house from each part of the
city in each price range. The following data show the number of days for the sample of
houses selected.
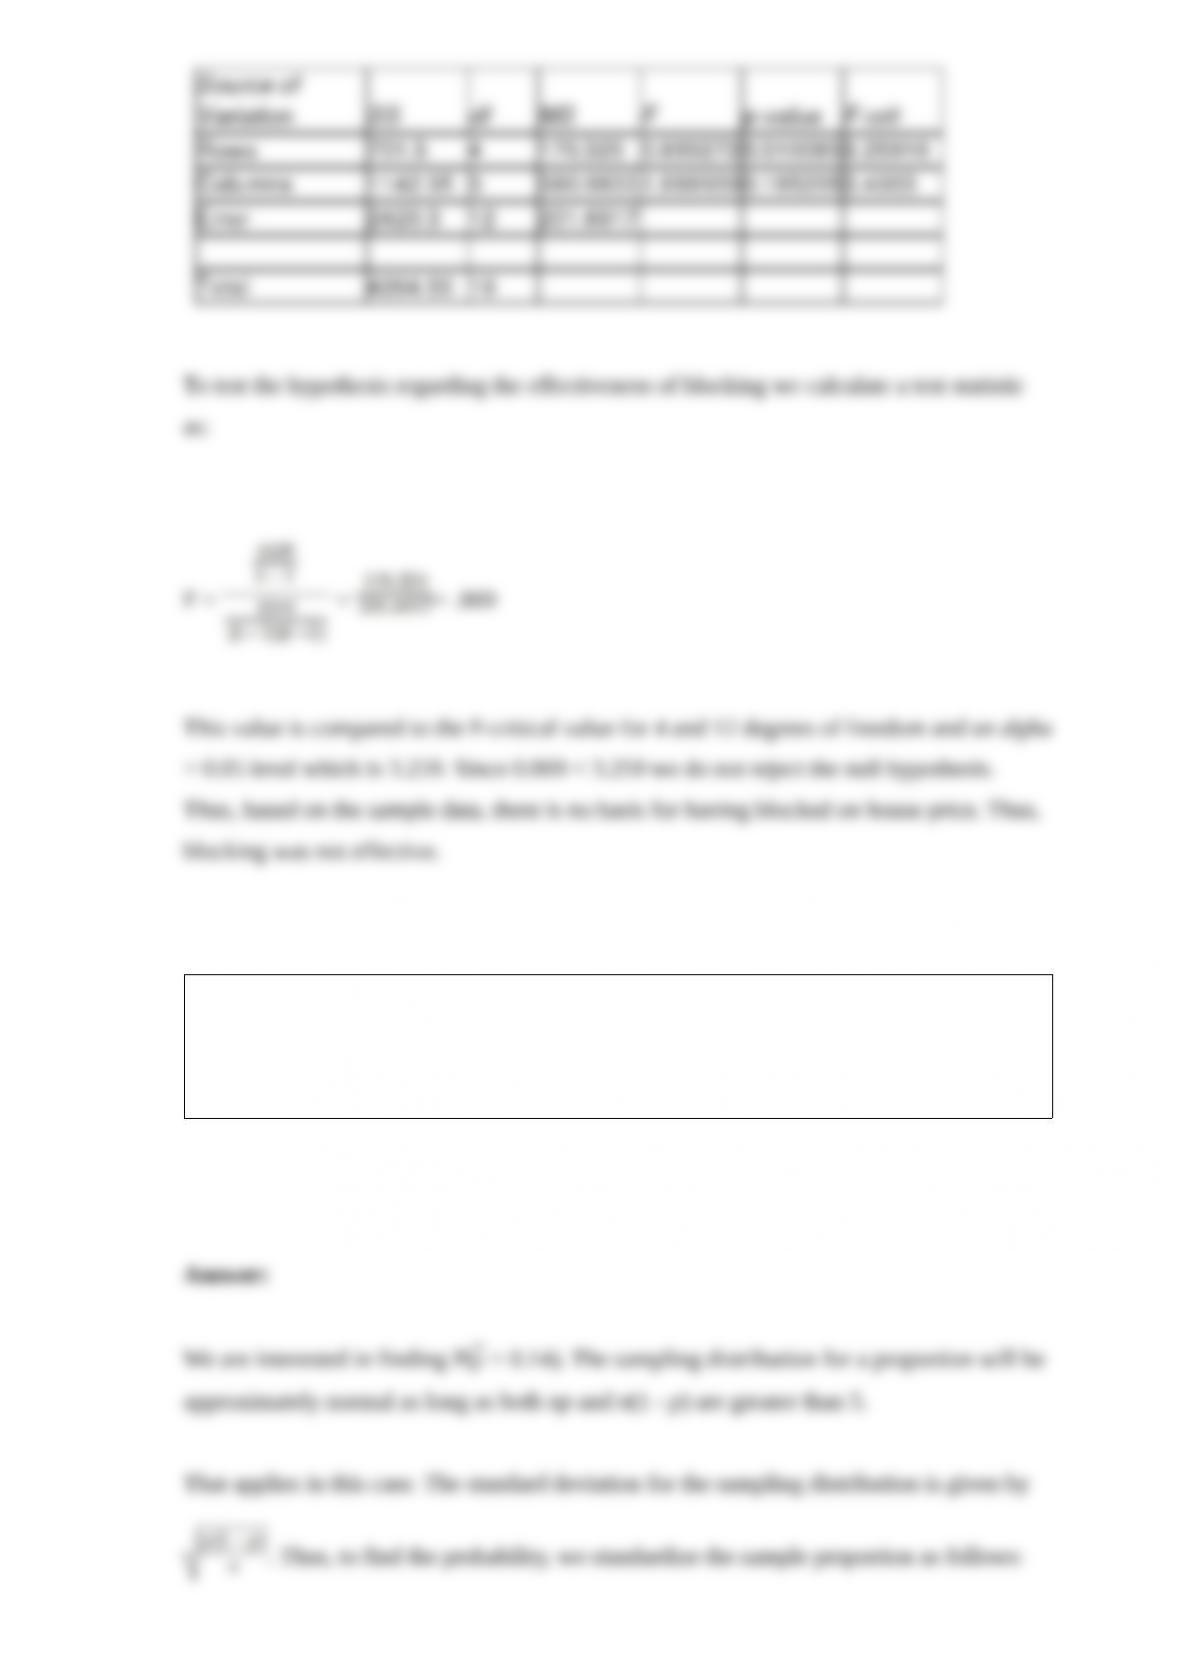
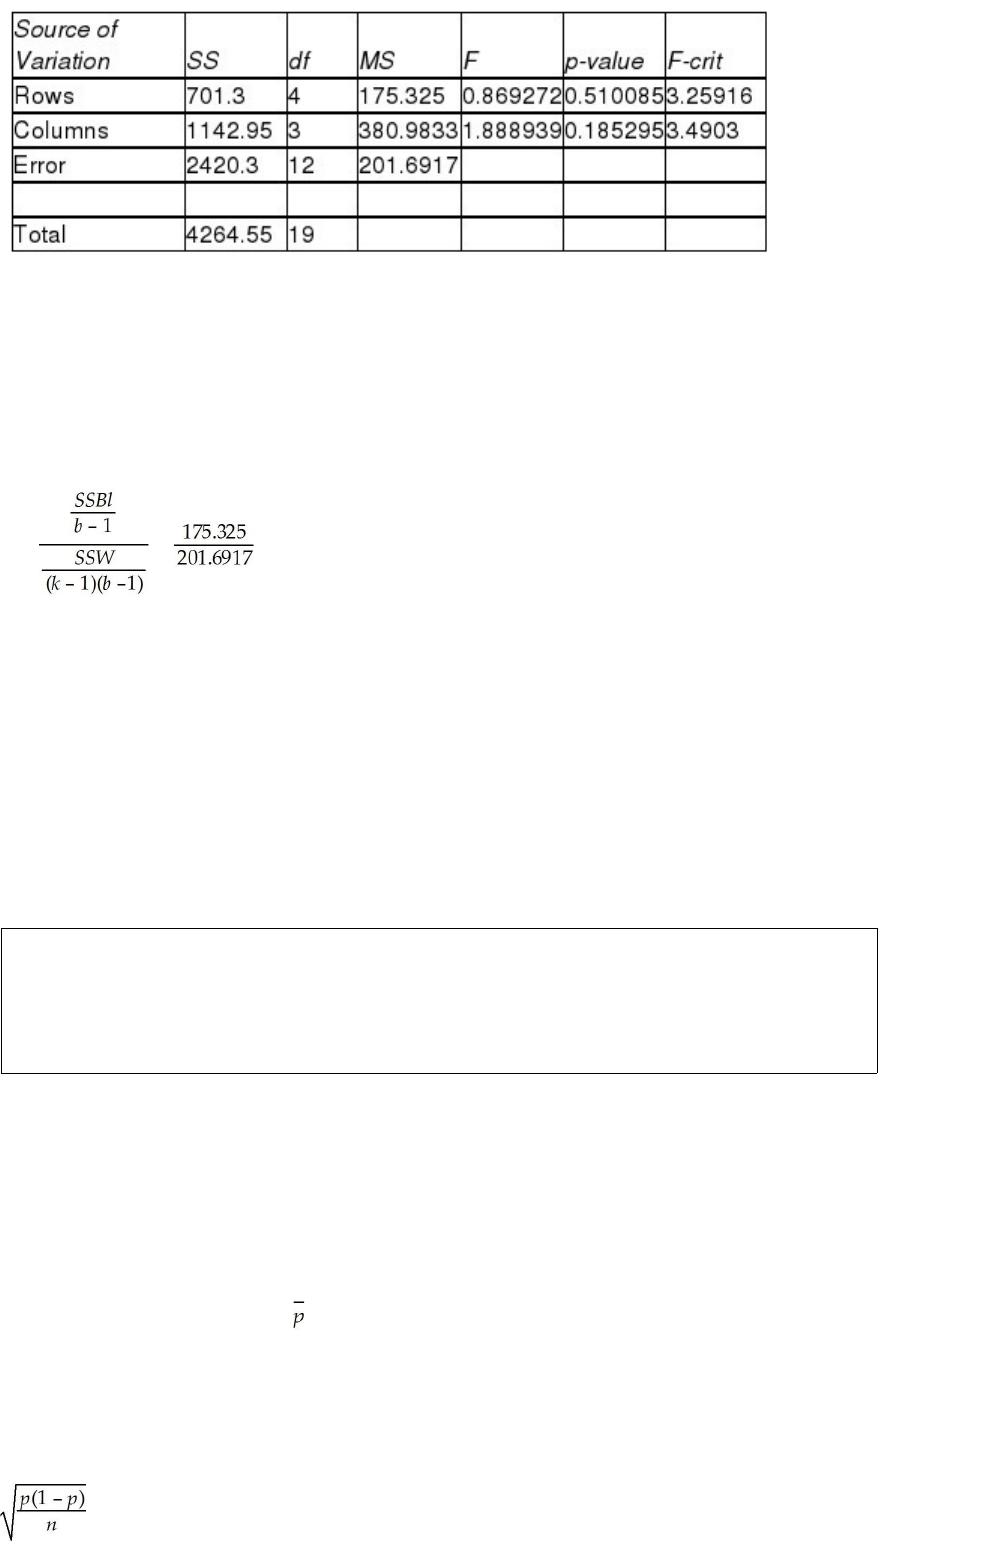
Using a significance level equal to 0.05, determine whether the broker was justified in
controlling for house prices. Be sure to indicate what type of statistical test should be
used and why.
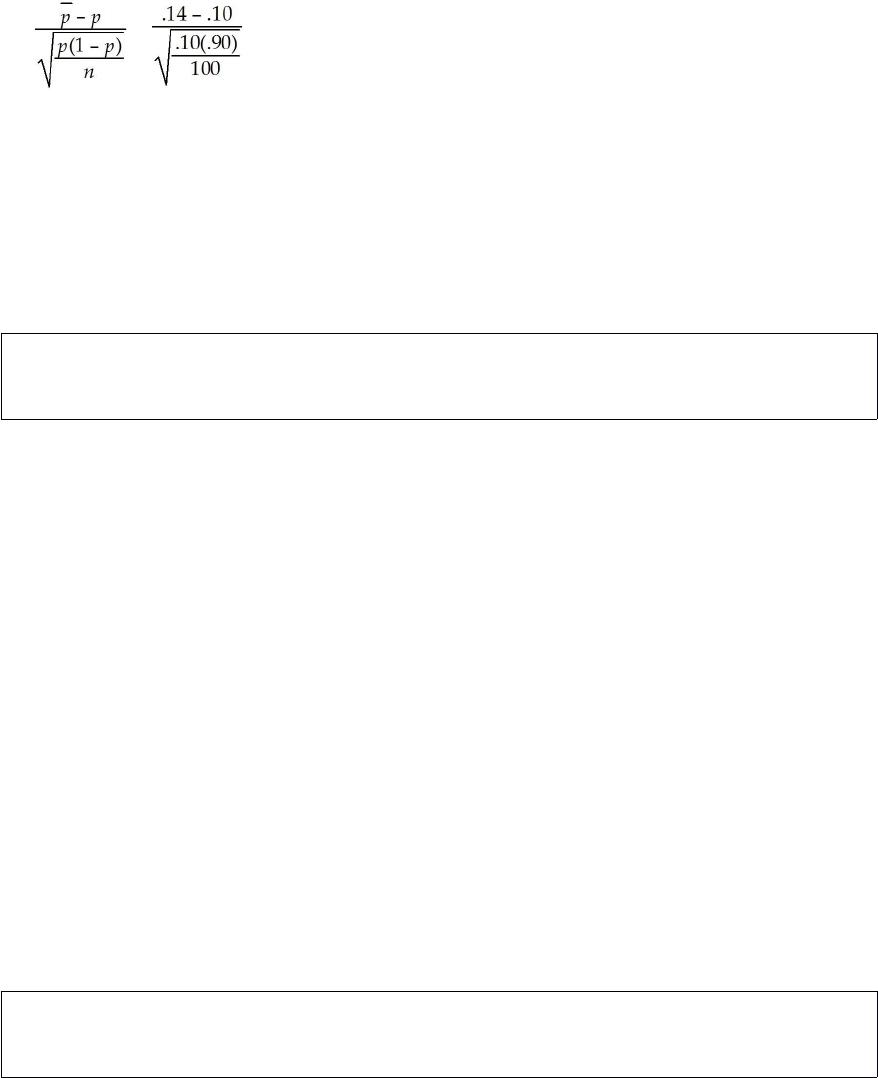
The proportion of parts in an inventory that are outdated and no longer useful is thought
to be 0.10. To check this, a random sample of n = 100 parts is selected and 14 are found
to be outdated. Based upon this information, what is the probability of 14 or more
outdated parts?
How would you respond to a statement that says that by increasing the sample size, the
amount of sampling error will be decreased?
Why is it that when we find the sample standard deviation, we divide by n-1 but when
we find the population standard deviation we divide by n?

Statistical Process Control charts are used to detect whether a process remains in
control or whether it has gone out of control. Explain how the SPC signals work.
The Gordon Beverage Company bottles soft drinks using an automatic filling machine.
When the process is running properly, the mean fill is 12 ounces per can. The machine
has a known standard deviation of 0.20 ounces. Each day, the company selects a
random sample of 36 cans and measures the volume in each can. They then test to
determine whether the filling process is working properly. The test is conducted using a
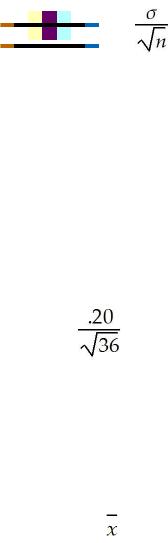
0.05 significance level. What is the critical value in ounces?