In a completely randomized analysis of variance design, the observations from each
factor are selected in an independent and random fashion.
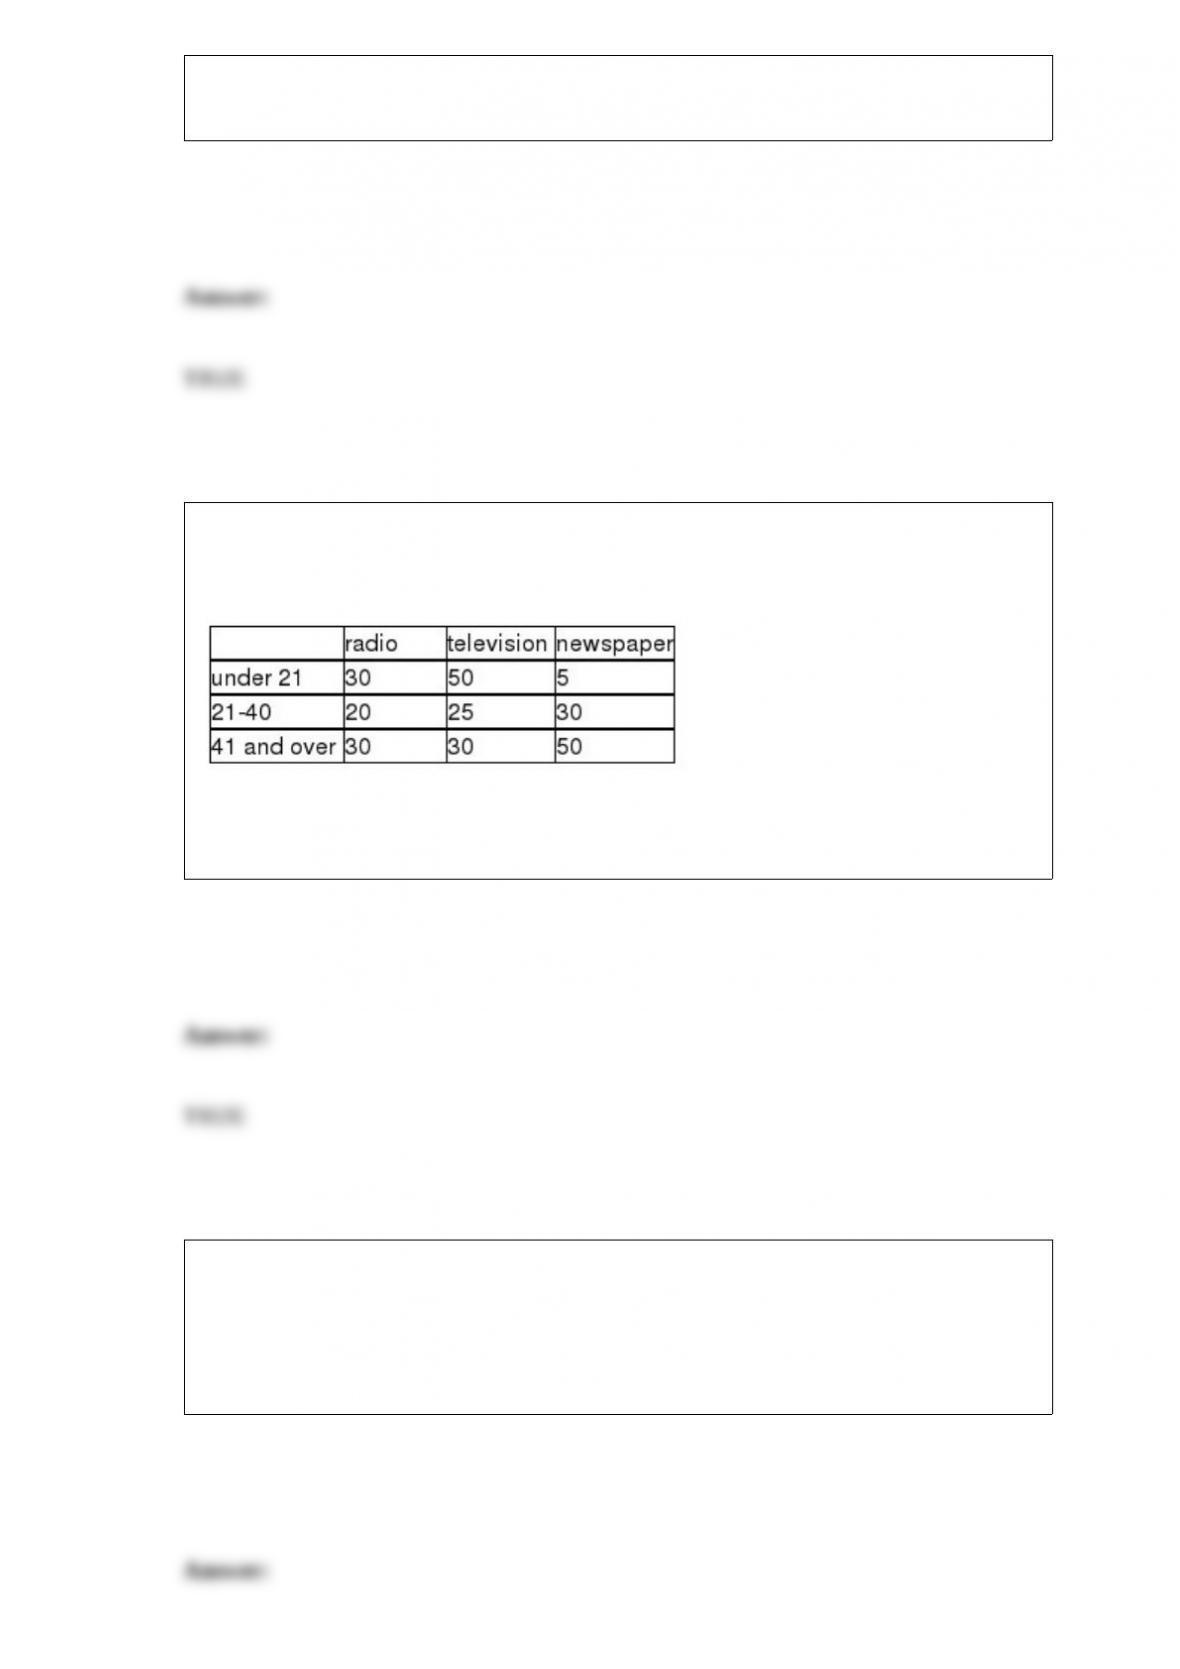
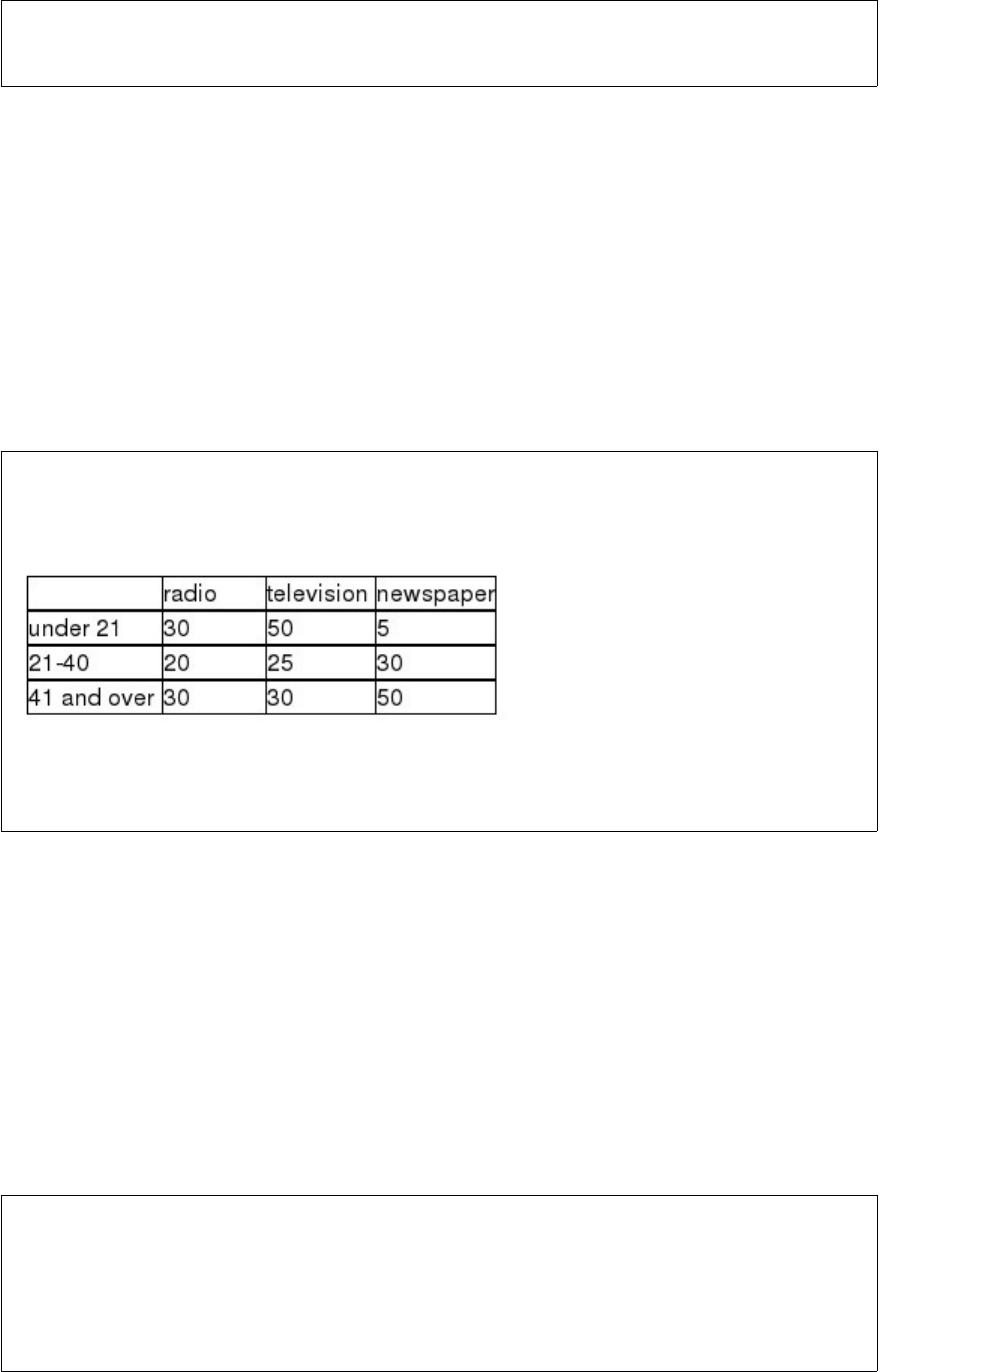
A study was recently conducted in which people were asked to indicate which news
medium was their preferred choice for national news. The following data were
observed:
Given this data, if we wish to test whether the preferred news source is independent of
age, for an alpha = .05 level, the test statistic is computed to be approximately 40.70.
The Georgia Company, a pharmaceutical company, recently conducted a study in which
20 people were given a new drug and 20 other people were given a placebo. The
objective was to determine whether there was a difference in pain relief between those
using the new drug versus those using the placebo. The data collection used here is an
example of an experiment.
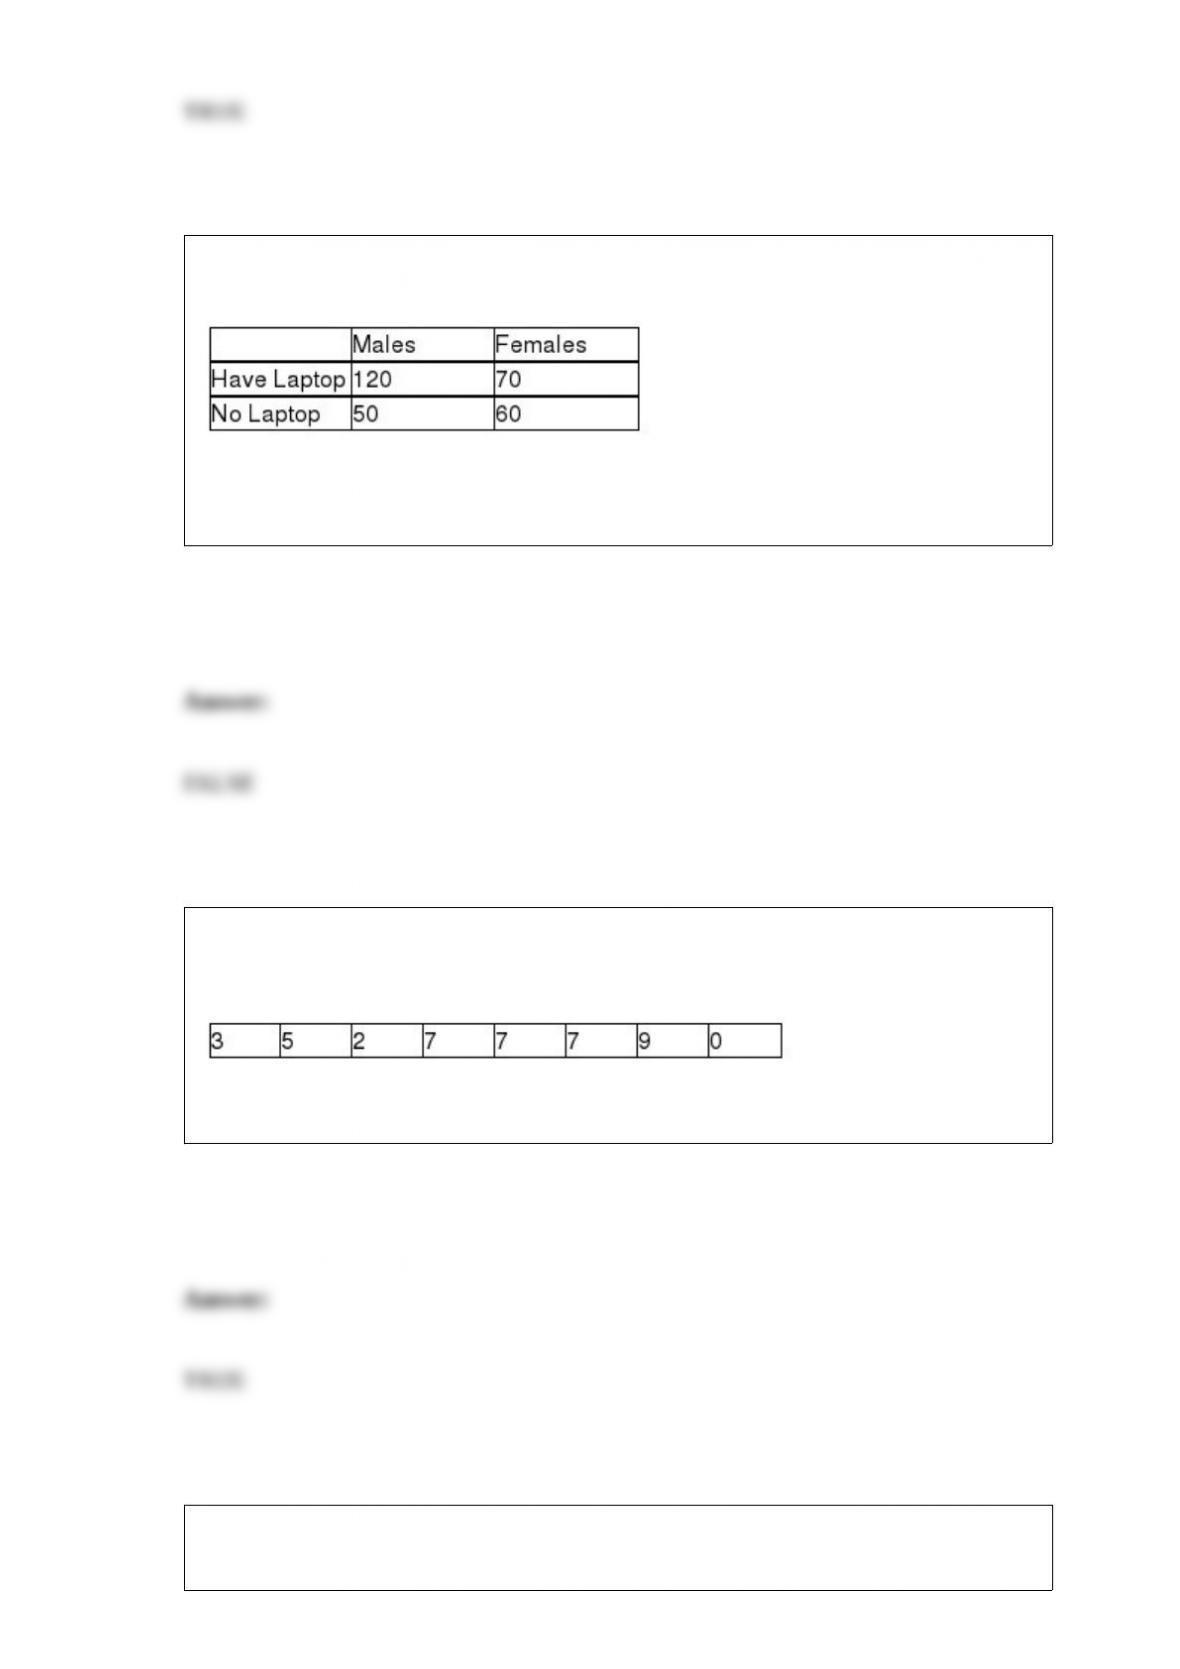
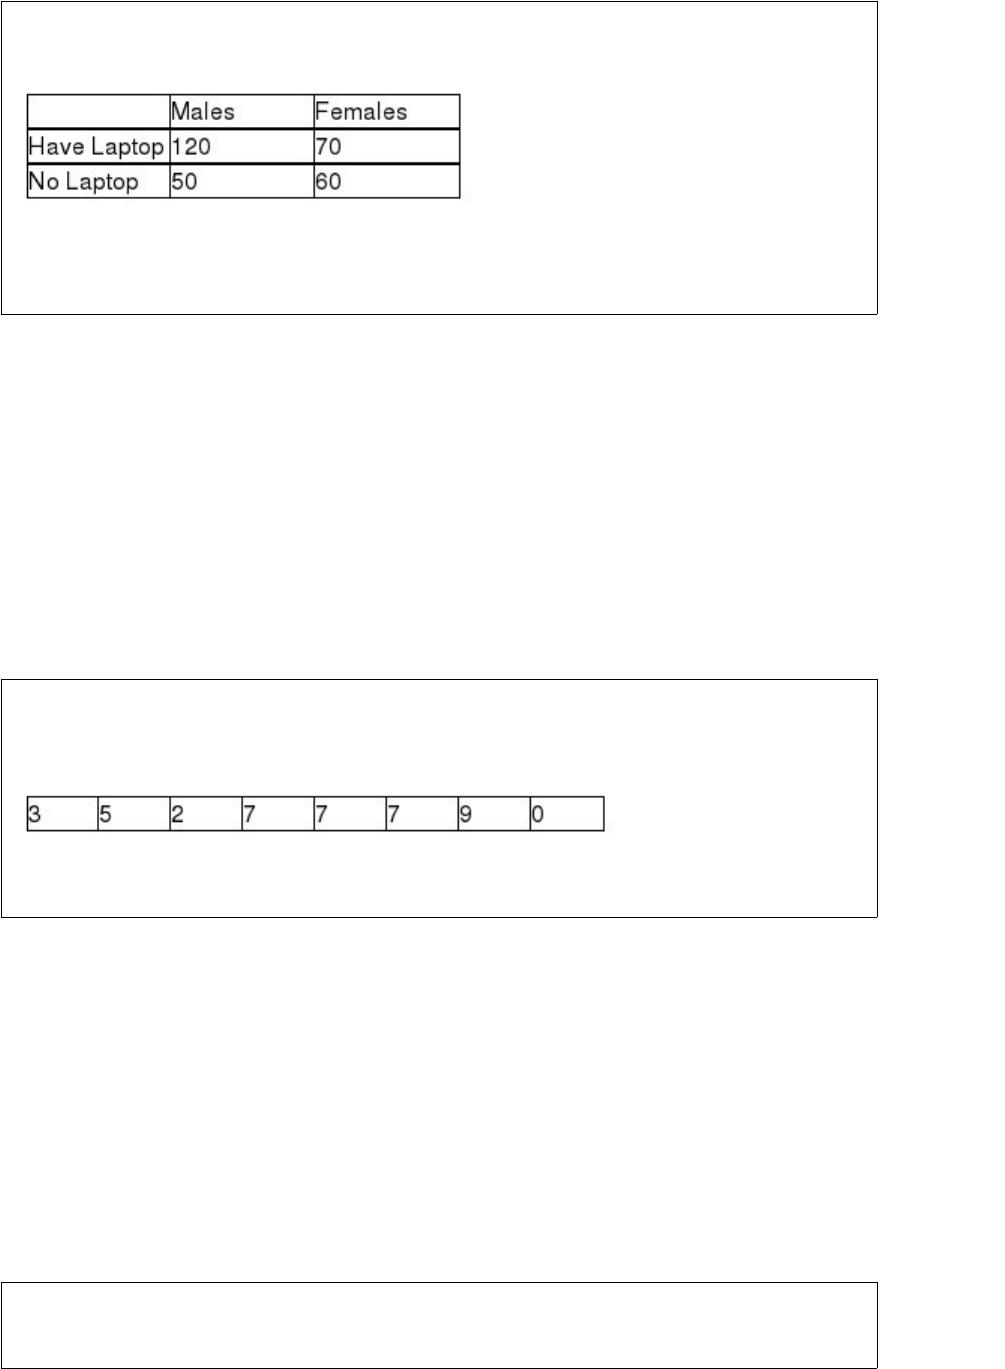
A survey was recently conducted in which males and females were asked whether they
owned a laptop personal computer. The following data were observed:
Given this information, if having a laptop is independent of gender, the expected
number of males with laptops in this survey is 150.
The Good-Guys Car Dealership has tracked the number of used cars sold at its
downtown dealership. Consider the following data as representing the population of
cars sold in each of the 8 weeks that the dealership has been open.
The population standard deviation is approximately 2.87 cars.
One of the key quality characteristics in many service environments is that the variation
in service time be reasonably small. Recently, a major amusement park company
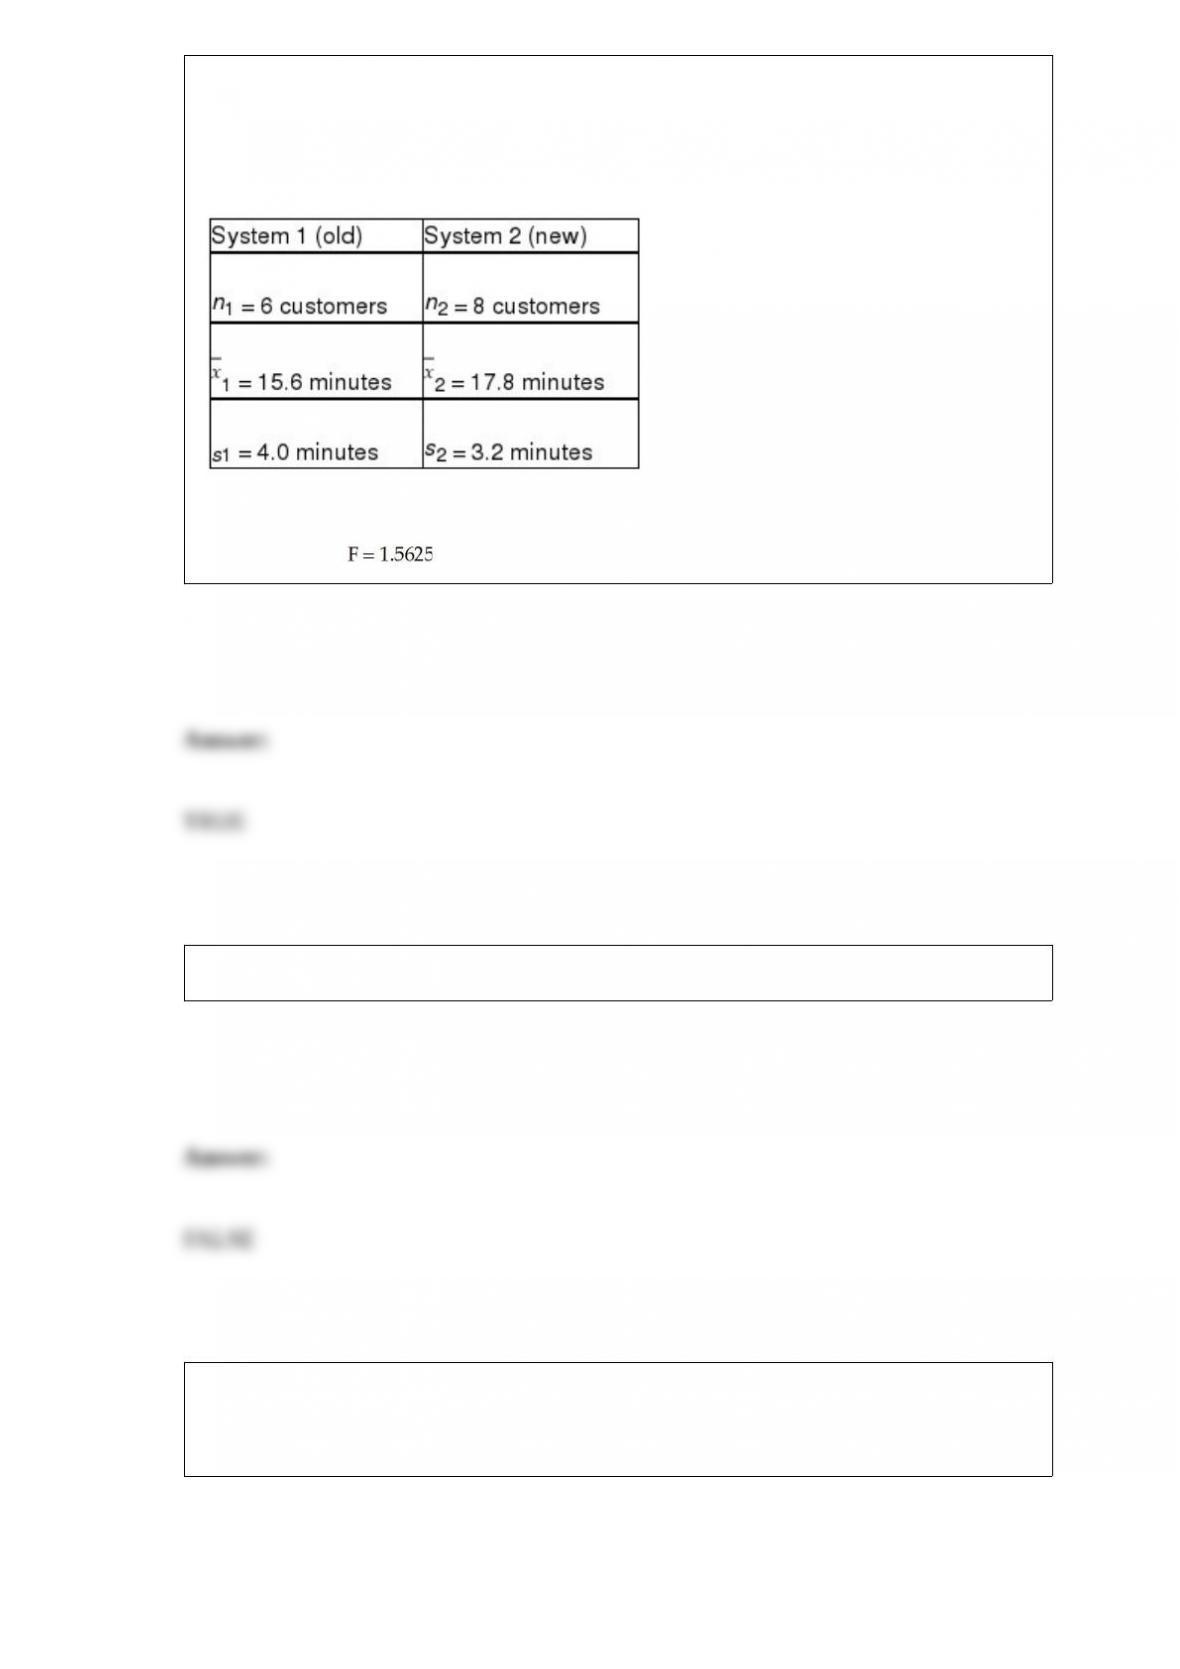
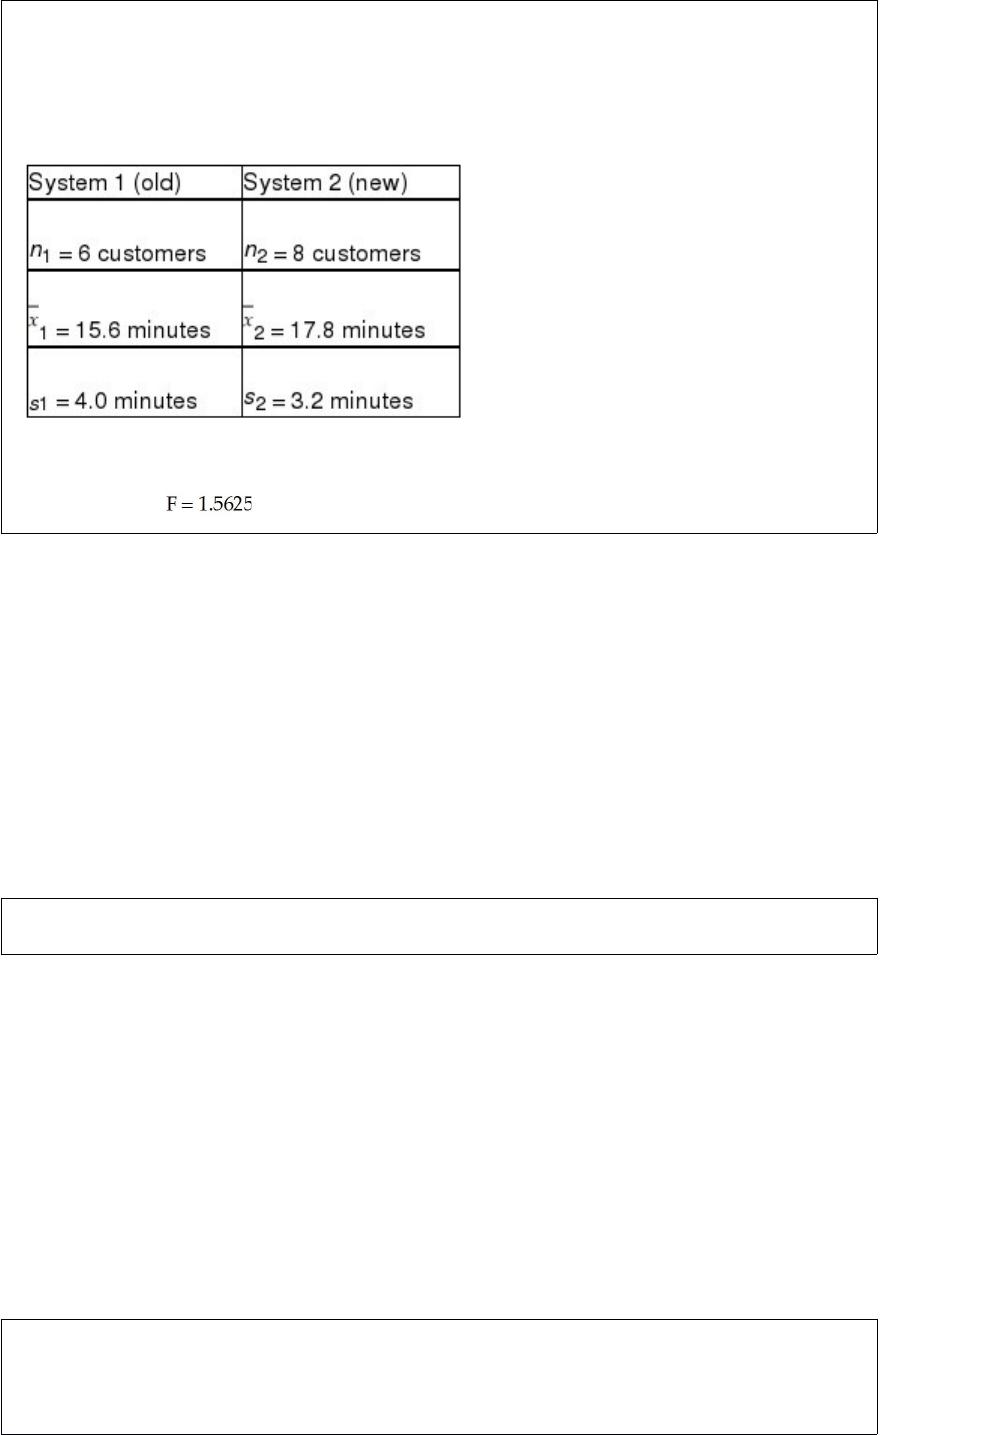
initiated a new line system at one of its parks. It then wished to compare this new
system with the old system in place at a comparable park in another state. At issue is
whether the standard deviation in waiting time is less under the new line system than
under the old line system. The following information was collected:
Assuming that it wishes to conduct the test using a 0.05 level of significance, the test
statistic will be .
In a scatter plot the points should always be connected with a line.
When the salesperson makes a sale, there are three possible sales levels: large, medium,
and small. The probability of a large sale is 0.20 and the chance of a medium sale is
0.60. Thus, when a sale is made, the chance of it being a small sale is 0.20.

In determining the required sample size when estimating a population proportion, it is
necessary to start with some idea of what that proportion is.
Three brands of running shoes are each tested by 10 different runners. The amount of
wear on the sole of the shoes is then measured. The objective is to determine if there is
any difference among the three brands of shoes based on how long the soles last. The
degrees of freedom for testing whether the brands of shoes differ are D1 = 9 and D2 = 2.
It is generally suggested that the sample size in developing a multiple regression model
should be at least four times the number of independent variables.
When developing a frequency distribution, the following classes would be considered
acceptable:
5 to < 10
10 to < 20
20 to < 40
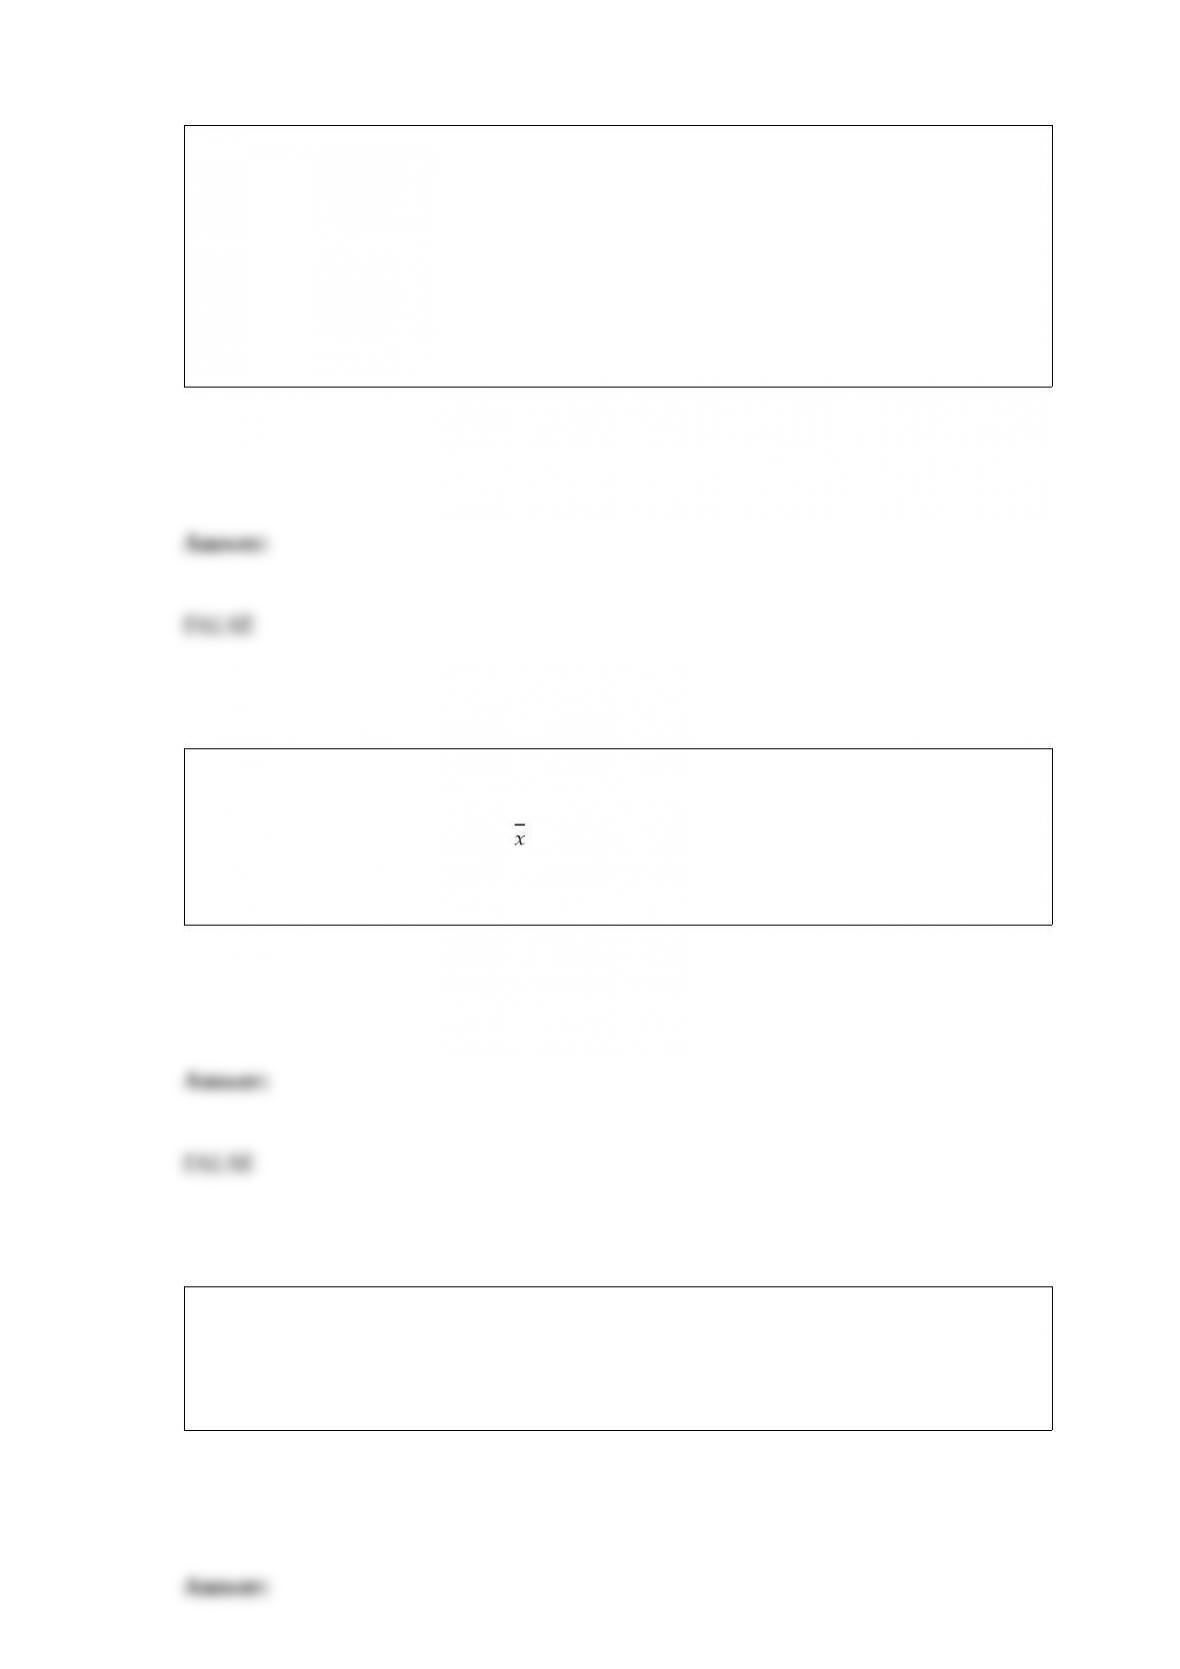
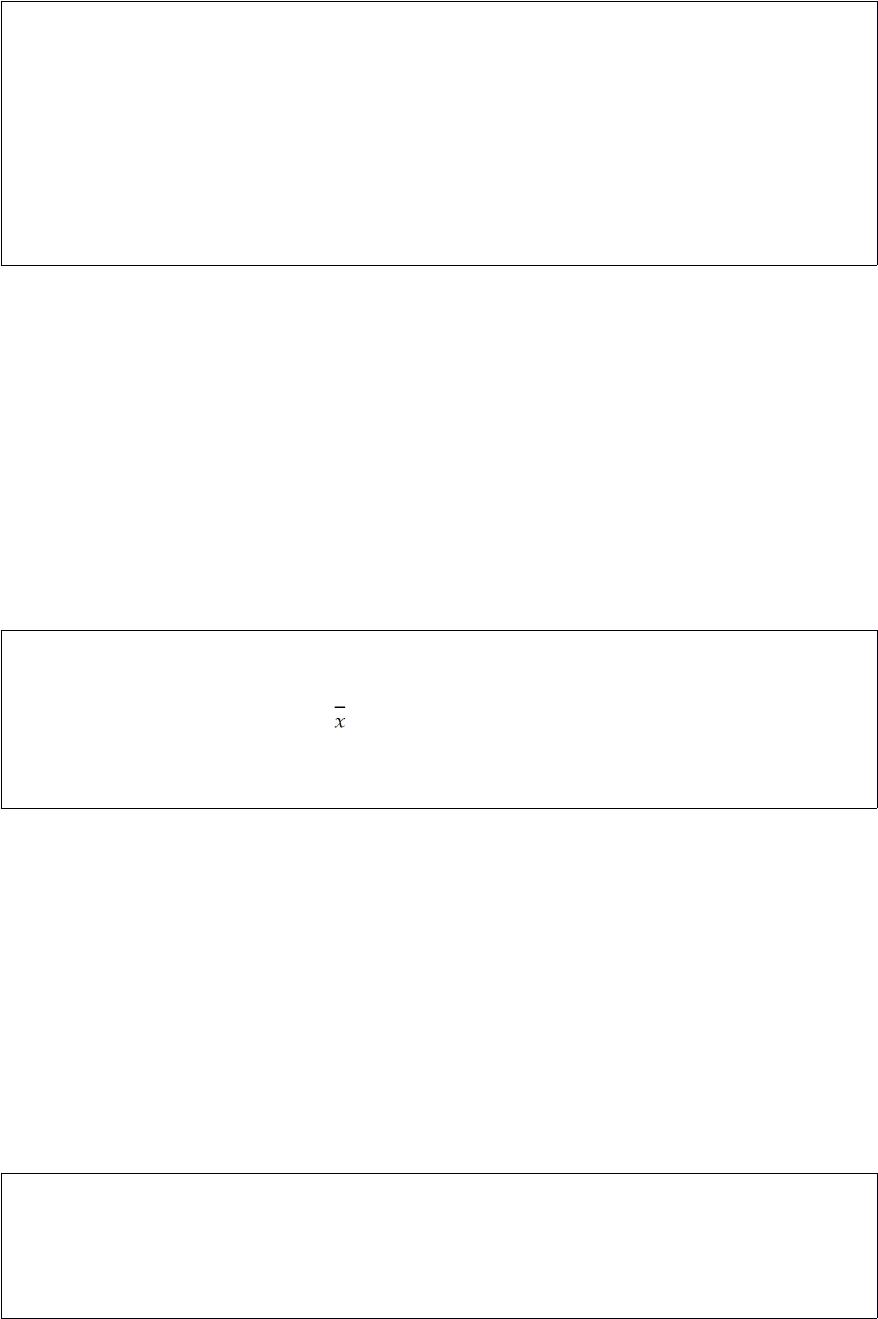
The bottlers of a new fruit juice daily select a random sample of 12 bottles of the drink
to estimate the mean quantity of juice in the bottles filled that day. On one such day, the
following results were observed: = 12.03; s = 0.12. Based on this information, the
margin of error associated with a 90 percent confidence interval estimate for the
population mean is 1.7959 ounces.
Recently a survey was conducted in which customers of a large insurance company
were asked to indicate the number of speeding tickets they had received in the past
three years. The data in this case would most likely be analyzed using a frequency
distribution with the data grouped into classes such as 0-2, 3-5, 6-8, etc.
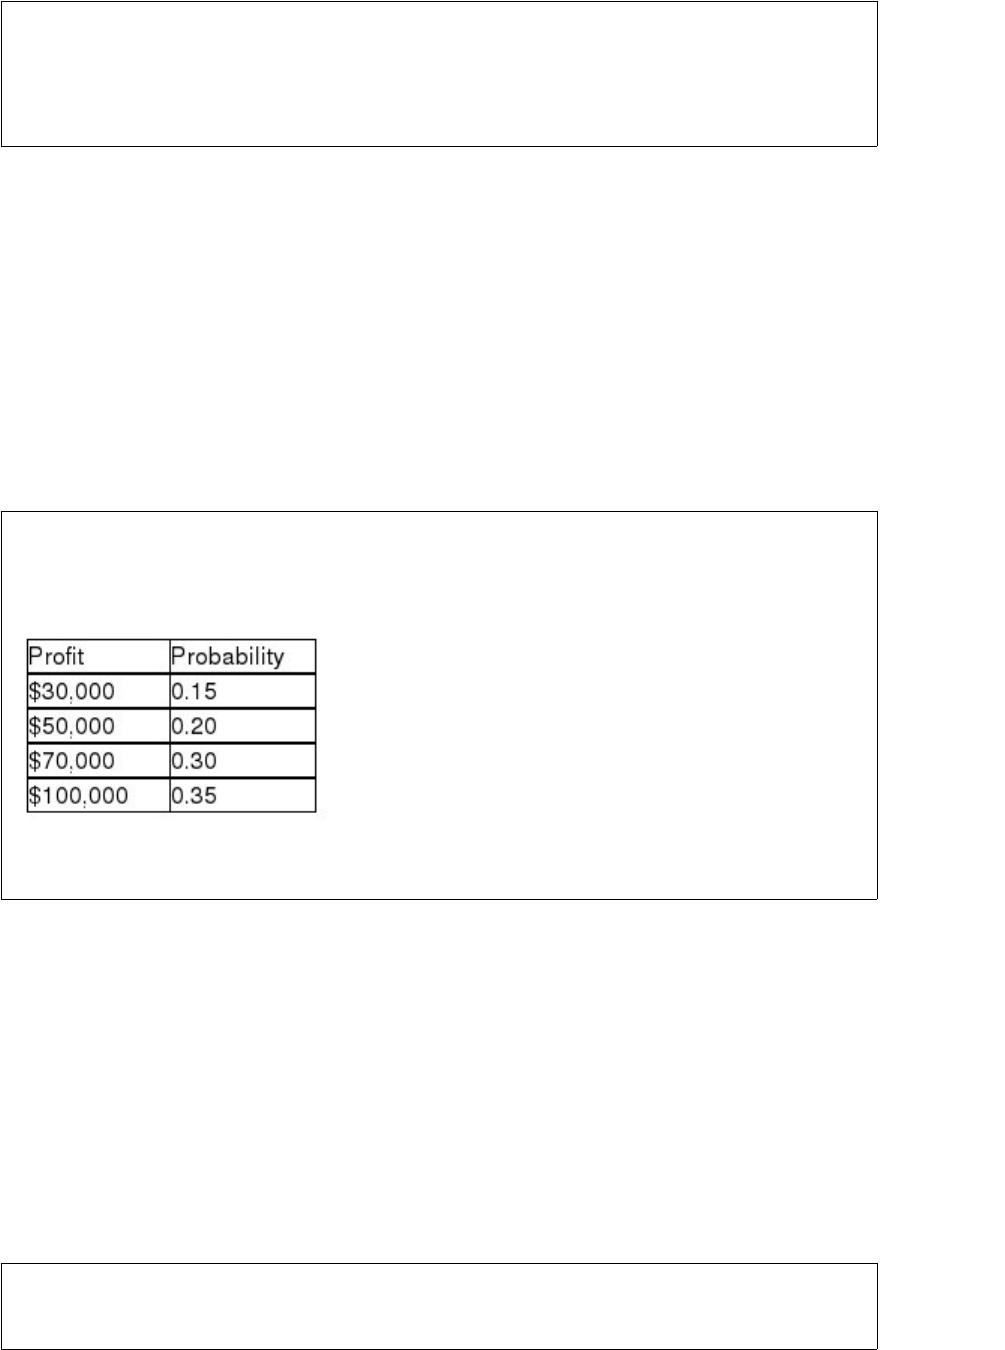
In a recent report to the supply-chain manager in a major electronics company, the
report writer stated that with 90 percent confidence, the manufacturing lead time for a
critical part is between 3.34 hours and 4.14 hours. Based on this, the sample mean that
generated the confidence interval was 3.60.
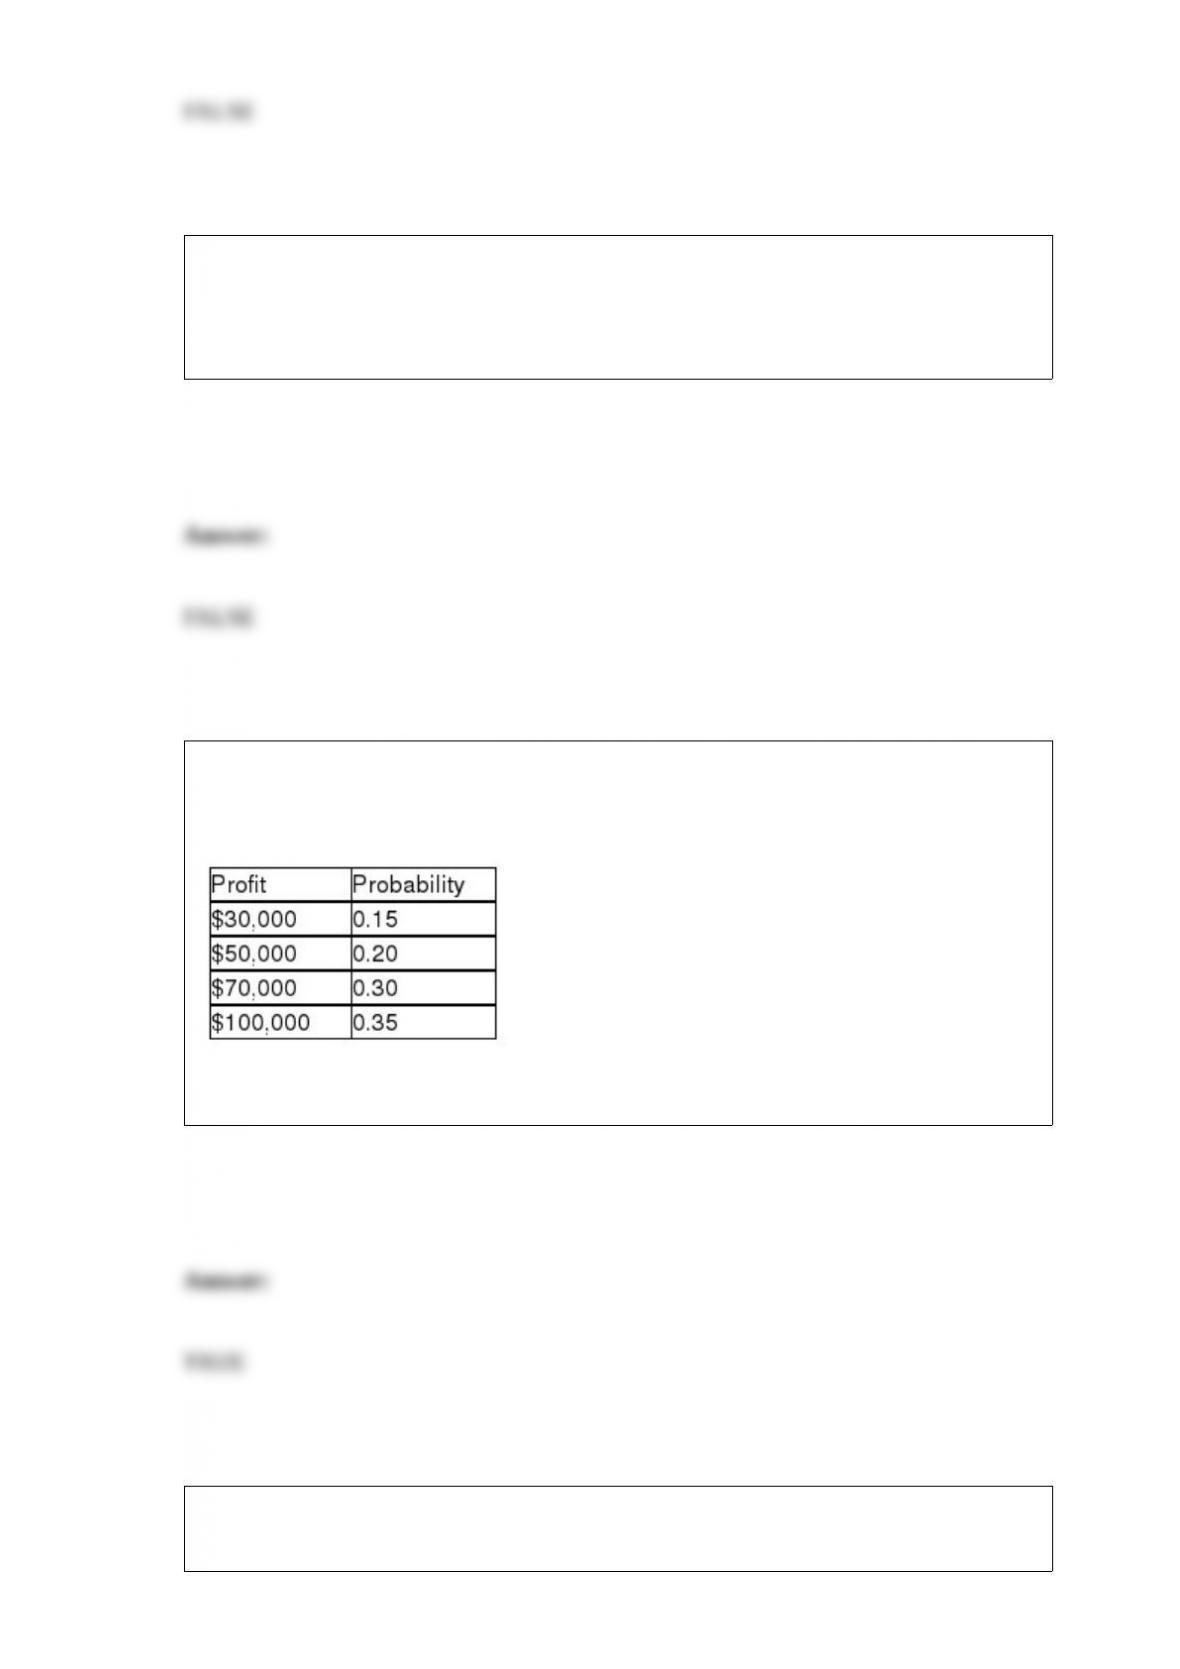
The Cromwell Construction Company has the opportunity to enter into a contract to
build a mountain road. The following table shows the probability distribution for the
profit that could occur if it takes the contract:
Based on this information, the probability of profit being at least $70,000 is 0.65.
If a decision maker wishes to reduce the chance of making a Type II error, one option is
to increase the sample size.


A two-tailed hypothesis test with α = 0.05 is similar to a 95 percent confidence interval.
Because variations are unavoidable in a system, the output of the system is always
unpredictable.
The experiment-wide error rate will be higher than the 0.05 significance level if the
multiple comparison tests for the mean difference between any two populations use the
0.05 level.


A sample is used to obtain a 95 percent confidence interval for the mean of a
population. The confidence interval goes from 15 to 19. If the same sample had been
used to test the null hypothesis that the mean of the population is equal to 20 versus the
alternative hypothesis that the mean of the population differs from 20, the null
hypothesis could be rejected at a level of significance of 0.05.
When an independent variable, that has a positive correlation with the dependent
variable, receives a negative slope in a multiple regression, this is probably caused by
multicollinearity.
Recently, Major League Baseball officials stated that the median cost for a family of
four to attend a baseball game including, parking, tickets, food, and drinks did not
exceed $125.00. As long as the data are considered interval or ratio level, the t-test can
be used to test MLB’s claim.
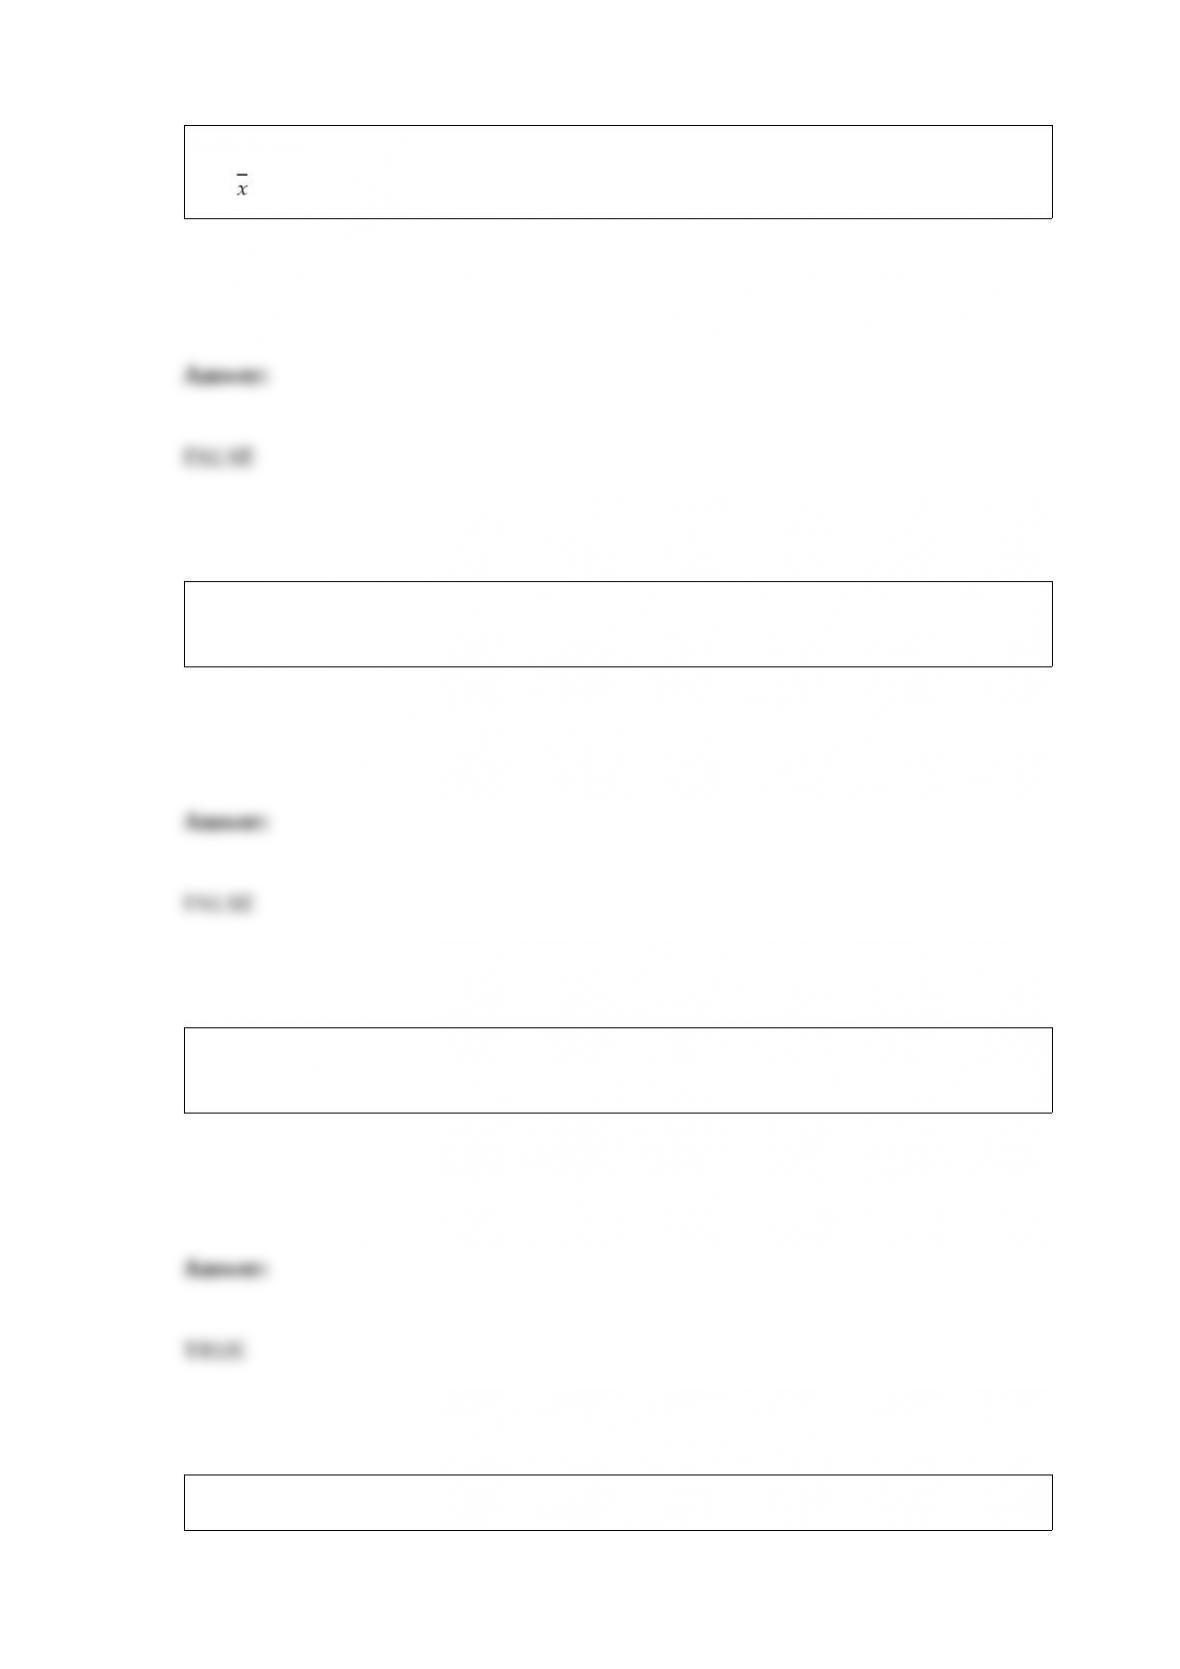

A two-tailed hypothesis test is used when the null hypothesis looks like the following:
H0: = 100.
A conclusion to “not reject” the null hypothesis is the same as the decision to “accept
the null hypothesis”.
A goodness-of-fit test can be used to determine whether a set of sample data comes
from a specific hypothesized population distribution.
You are given the following sample data for two variables:
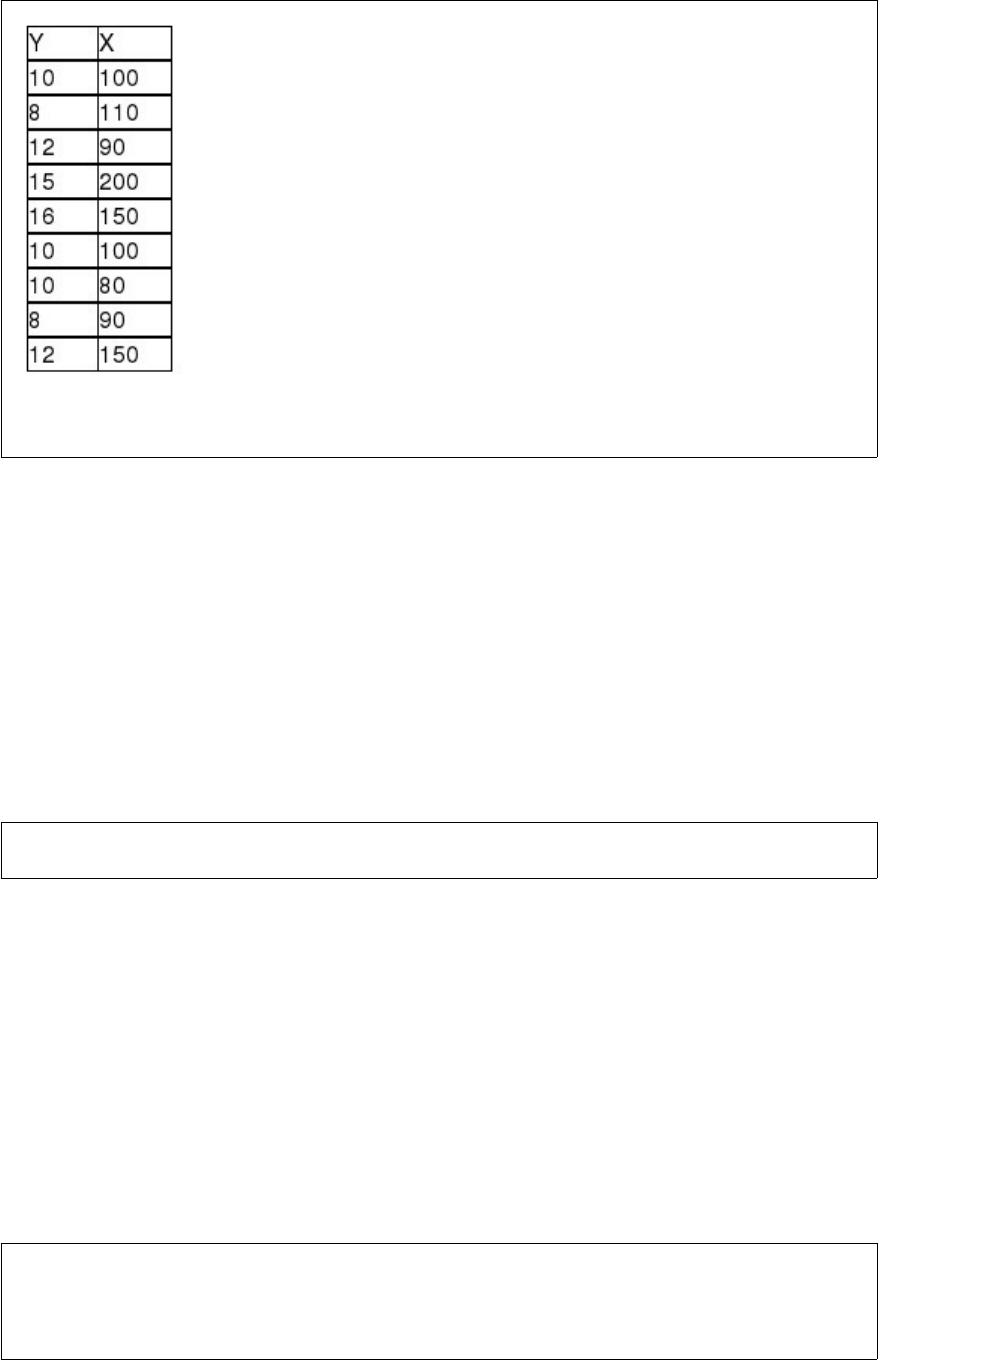
The sample correlation coefficient for these data is approximately r = 0.755.
Type II error is failing to reject the null hypothesis when the null is actually false.
To test for the stopping distances of four brake systems, 10 of the same make and model
of car are selected randomly and then are assigned randomly to each of four brake
systems. This is a randomized complete block design.

The t-distribution is still applicable even when there are small violations of the
assumptions for the case when the variances for two populations are unknown. This is
particularly true when the sample sizes are approximately equal.
The size of the sampling error that comes from a random sample depends on both the
variation in the population and the size of the sample being selected.
Statistics is a discipline that involves tools and techniques used to describe data and
draw conclusions.

In developing a scatter plot, the decision maker has the option of connecting the points
or not.
Populations with larger means will also have larger standard deviations since the data
will be more spread out for populations with larger means.
If any of the observed frequencies are smaller than 5, then categories should be
combined until all observed frequencies are at least 5.
Dell Computers receives large shipments of microprocessors from Intel Corp. It must
try to ensure the proportion of microprocessors that are defective is small. Suppose Dell
decides to test five microprocessors out of a shipment of thousands of these
microprocessors. Suppose that if at least one of the microprocessors is defective, the
shipment is returned.
If Intel Corp.’s shipment contains 10% defective microprocessors, calculate the
probability the entire shipment will be returned.
A) 0.4980
B) 0.4209
C) 0.4095
D) 0.4550
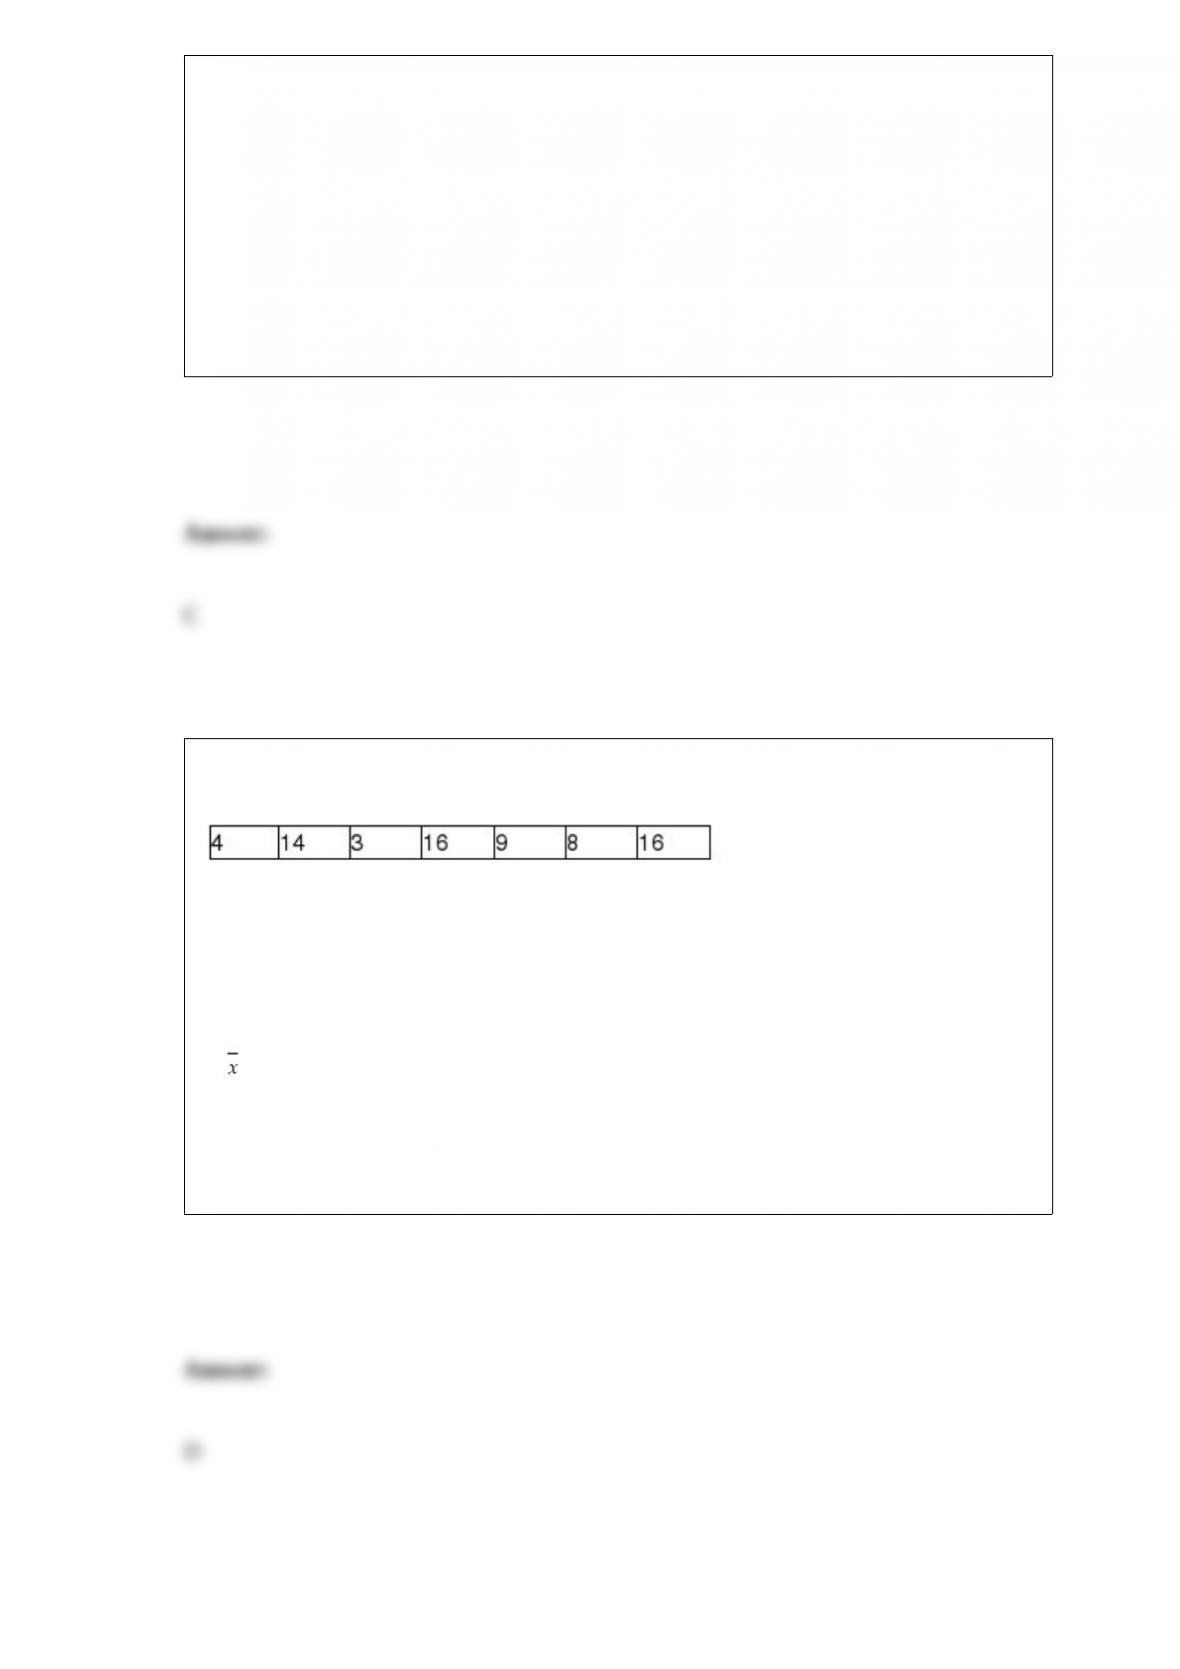
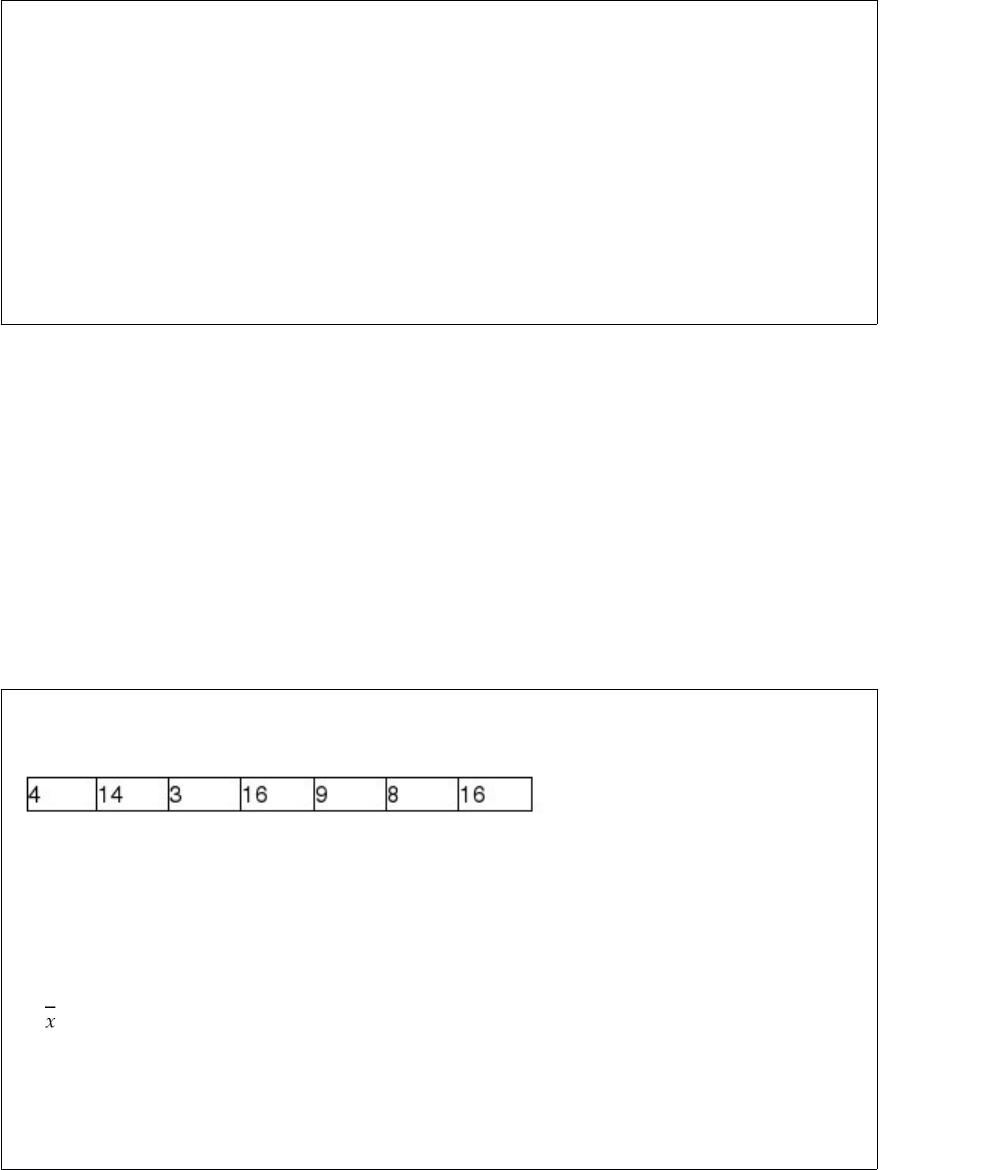
A small company has 7 employees. The numbers of years these employees have worked
for this company are shown as follows:
Based upon this information, the mean number of years that employees have been with
this company is:
A) 16
B)
C) 8.40
D) 10


As the automobile accident rate increases, insurers are forced to increase their premium
rates. Companies such as Allstate have recently been running a campaign they hope will
result in fewer accidents by their policyholders. For each six-month period that a
customer goes without an accident, Allstate will reduce the customer’s premium rate by
a certain percentage. Companies like Allstate have reason to be concerned about driving
habits, based on a survey conducted by Drive for Life, a safety group sponsored by
Volvo of North America, in which 1,100 drivers were surveyed. Among those surveyed,
74% said that careless or aggressive driving was the biggest threat on the road.
One-third of the respondents said that cell phone usage by other drivers was the driving
behavior that annoyed them the most.
Based on these data, assuming that the sample was a simple random sample, construct
and interpret a 95% confidence interval estimate for the true proportion in the
population of all drivers who are annoyed by cell phone users.
A) (0.313, 0.347)
B) (0.306, 0.354)
C) (0.302, 0.358)
D) (0.316, 0.344)
Which of the following is an example of graphs used to describe data?
A) Histograms
B) Bar charts
C) Both A and B are correct.
D) None of the above.


Recently, a legislative committee commissioned a study of incomes in a western state.
At issue was whether the ratings of the legislature’s performance differed between rural
citizens and city residents. A random sample of 25 city residents and 35 rural residents
was asked to rate the performance of the legislature on a scale of 1 to 100. The analysts
believe that the population distribution of ratings would be highly skewed so they
decided to use the Mann-Whiney U test to test whether there is a difference in median
ratings by the two groups. Given this information, which of the following is the correct
critical value if the test is to be conducted at the .10 level of significance?
A) z = 1.96
B) t = 2.0357
C) U = 437.5
D) z = 1.645
Given a population in which the probability of success is p = 0.20, if a sample of 500
items is taken, then calculate the probability the proportion of successes in the sample
will be between 0.18 and 0.23 if the sample size is 200.
A) 0.8911
B) 0.7121
C) 0.8712
D) 0.6165


The human resources department at a major high tech company recently conducted an
employee satisfaction survey of 100 of its 3,000 employees. Data were collected on
such variables as age, gender, marital status, current salary, level of overall satisfaction
on a scale from 1 to 5, number of years with the company, and job title. Considering the
age variable where employees were asked to list their age at their last birthday, which of
the following best describes the level of data measurement for that variable?
A) Interval level
B) Nominal level
C) Ratio level
D) Cross-sectional data
If a data set has 740 values that have been sorted from low to high, which value in the
data set will be the 20th percentile?
A) The average of the 148th and 149th values
B) The 20th value
C) The 148th value
D) None of the above


Assume that you are conducting a small sample Mann-Whitney U test where n1 = 14
and n2 = 16 and that U1 = 98. Assuming that U1 has been found correctly, what is the
value of U2?
A) 112
B) 126
C) 224
D) Insufficient information to determine U2.
A random sample of 100 items is selected from a population of size 350. What is the
probability that the sample mean will exceed 200 if the population mean is 195 and the
population standard deviation equals 20? (Hint: Use the finite correction factor since
the sample size is more than 5% of the population size.)
A) 0.0415
B) 0.0016
C) 0.0241
D) 0.0171
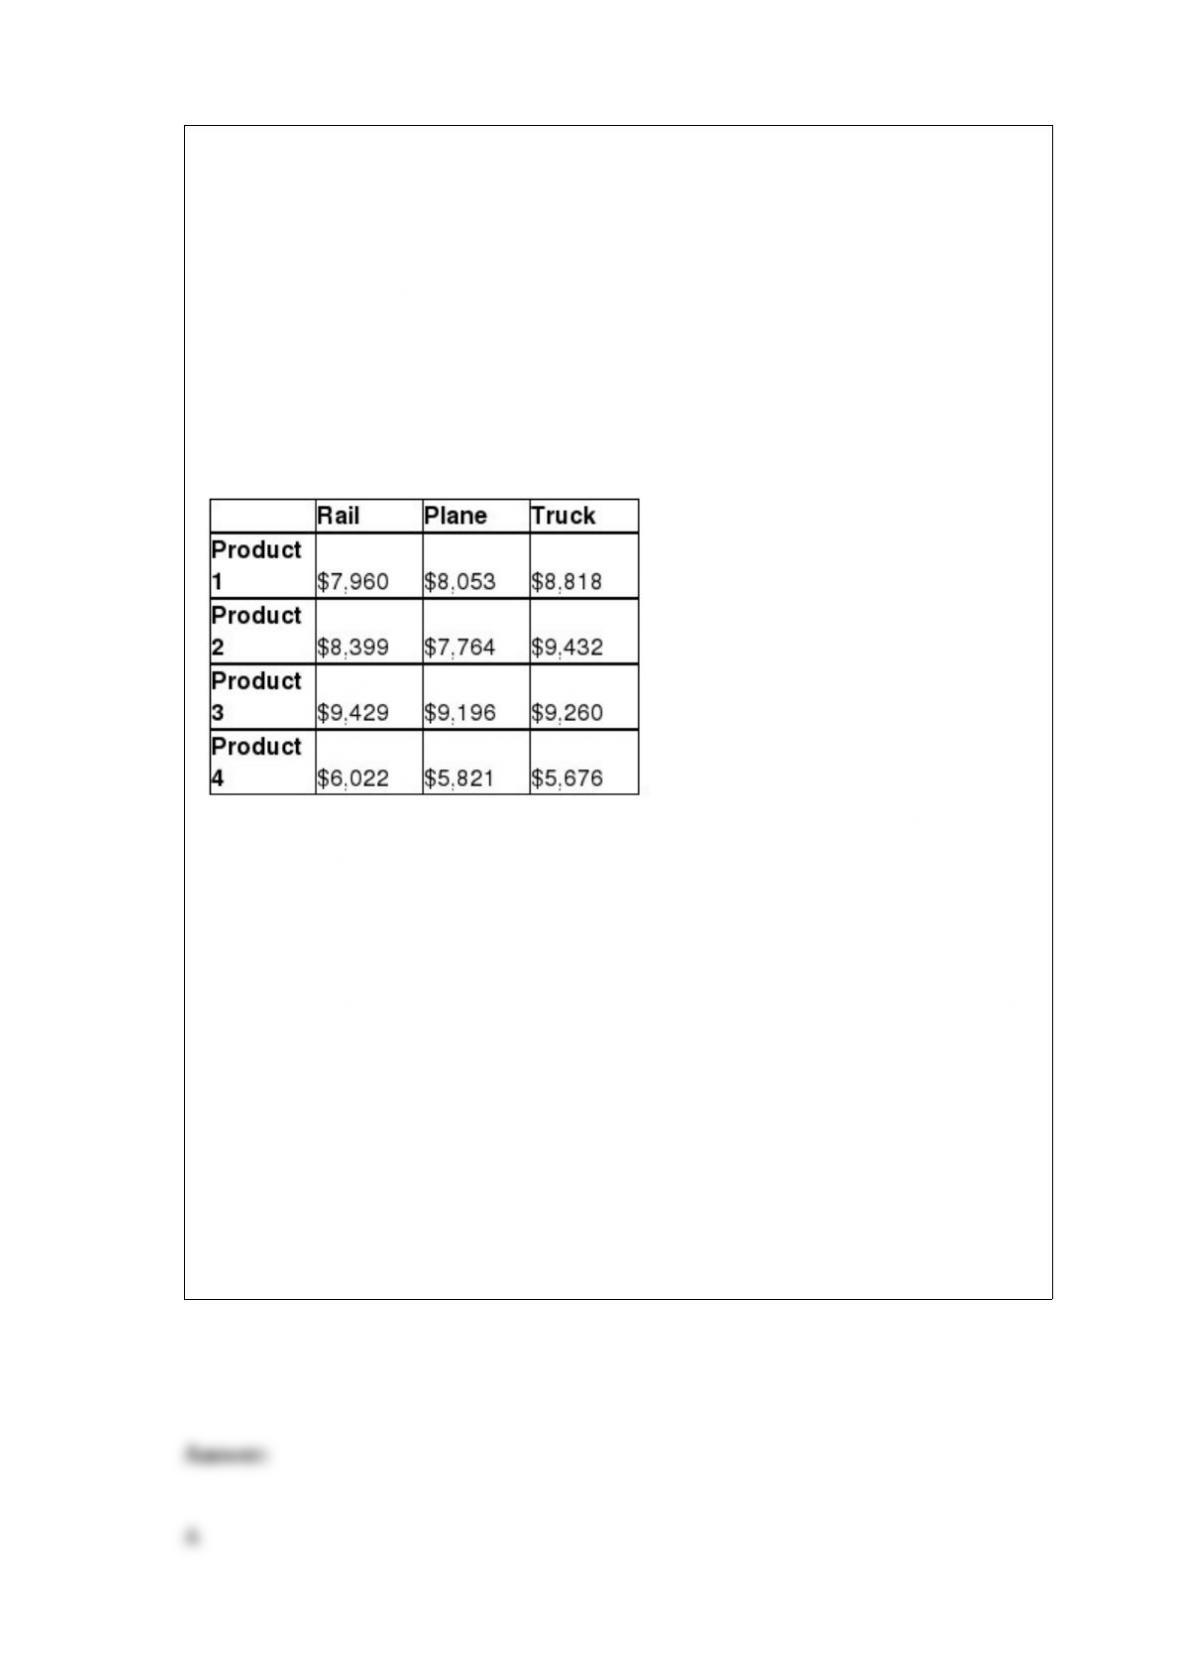
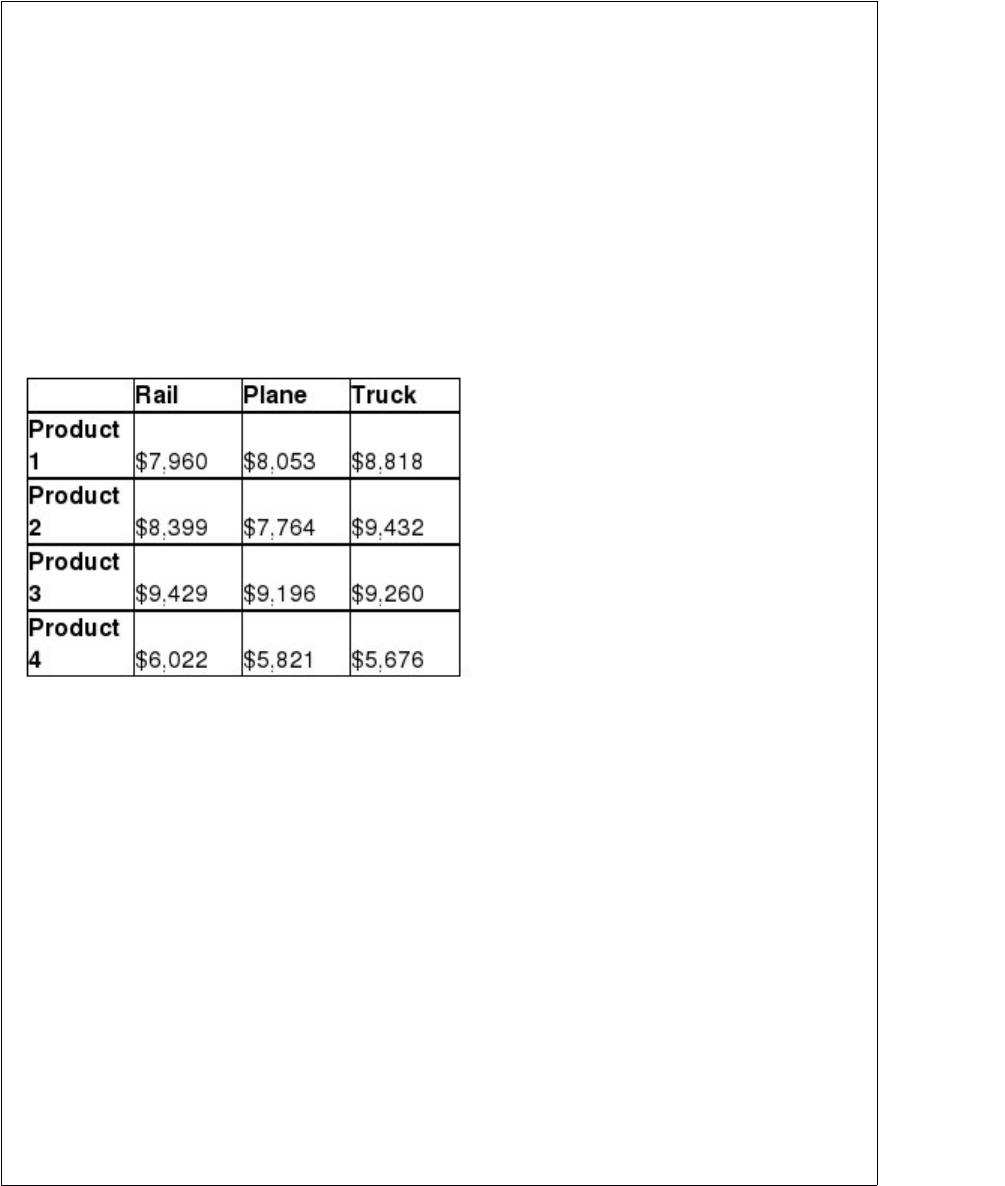
Frasier and Company manufactures four different products that it ships to customers
throughout the United States. Delivery times are not a driving factor in the decision as
to which type of carrier to use (rail, plane, or truck) to deliver the product. However,
breakage cost is very expensive, and Frasier would like to select a mode of delivery that
reduces the amount of product breakage. To help it reach a decision, the managers have
decided to examine the dollar amount of breakage incurred by the three alternative
modes of transportation under consideration. Because each product’s fragility is
different, the executives conducting the study wish to control for differences due to type
of product. The company randomly assigns each product to each carrier and monitors
the dollar breakage that occurs over the course of 100 shipments. The dollar breakage
per shipment (to the nearest dollar) is as follows:
Was Frasier and Company correct in its decision to block for type of product? Conduct
the appropriate hypothesis test using a level of significance of 0.01.
A) Because F = 32.12 > Fα=0.01 = 9.78, reject the null hypothesis. Thus, based on these
sample data we conclude that blocking is effective.
B) Because F = 28.14 > Fα=0.01 = 7.63, reject the null hypothesis. Thus, based on these
sample data we conclude that blocking is effective.
C) Because F = 32.12 > Fα=0.01 = 9.78, do not reject the null hypothesis. Thus, based on
these sample data we conclude that blocking is not effective.
D) Because F = 28.14 > Fα=0.01 = 7.63, do not reject the null hypothesis. Thus, based on
these sample data we conclude that blocking is not effective.


To test the following hypotheses at the 0.05 level of significance, using a sample size of
n = 15.
H0 : σ2 = 0.05
HA : σ2 ≠ 0.05
What is the upper tail critical value?
A) 23.685
B) 24.996
C) 27.488
D) 26.119
A major issue facing many states is whether to legalize casino gambling. Suppose the
governor of one state believes that more than 55% of the state’s registered voters would
favor some form of legal casino gambling. However, before backing a proposal to allow
such gambling, the governor has instructed his aides to conduct a statistical test on the
issue. To do this, the aides have hired a consulting firm to survey a simple random
sample of 300 voters in the state. Of these 300 voters, 175 actually favored legalized
gambling.
Assuming that a significance level of 0.05 is used, what conclusion should the governor
reach based on these sample data?
A) Since z = 1.1594 < 1.645, do not reject the null hypothesis.
The sample data do not provide sufficient evidence to conclude that more than 55
percent of the population favor legalized gambling.
B) Since z = 2.1316 > 1.645, reject the null hypothesis.
The sample data provide sufficient evidence to conclude that more than 55 percent of
the population favor legalized gambling.
C) Since z = 1.1594 < 1.645, do not reject the null hypothesis.
The sample data do not provide sufficient evidence to conclude that more than 58
percent of the population favor legalized gambling.
D) Since z = 2.1316 > 1.645, reject the null hypothesis.
The sample data provide sufficient evidence to conclude that more than 58 percent of
the population favor legalized gambling.
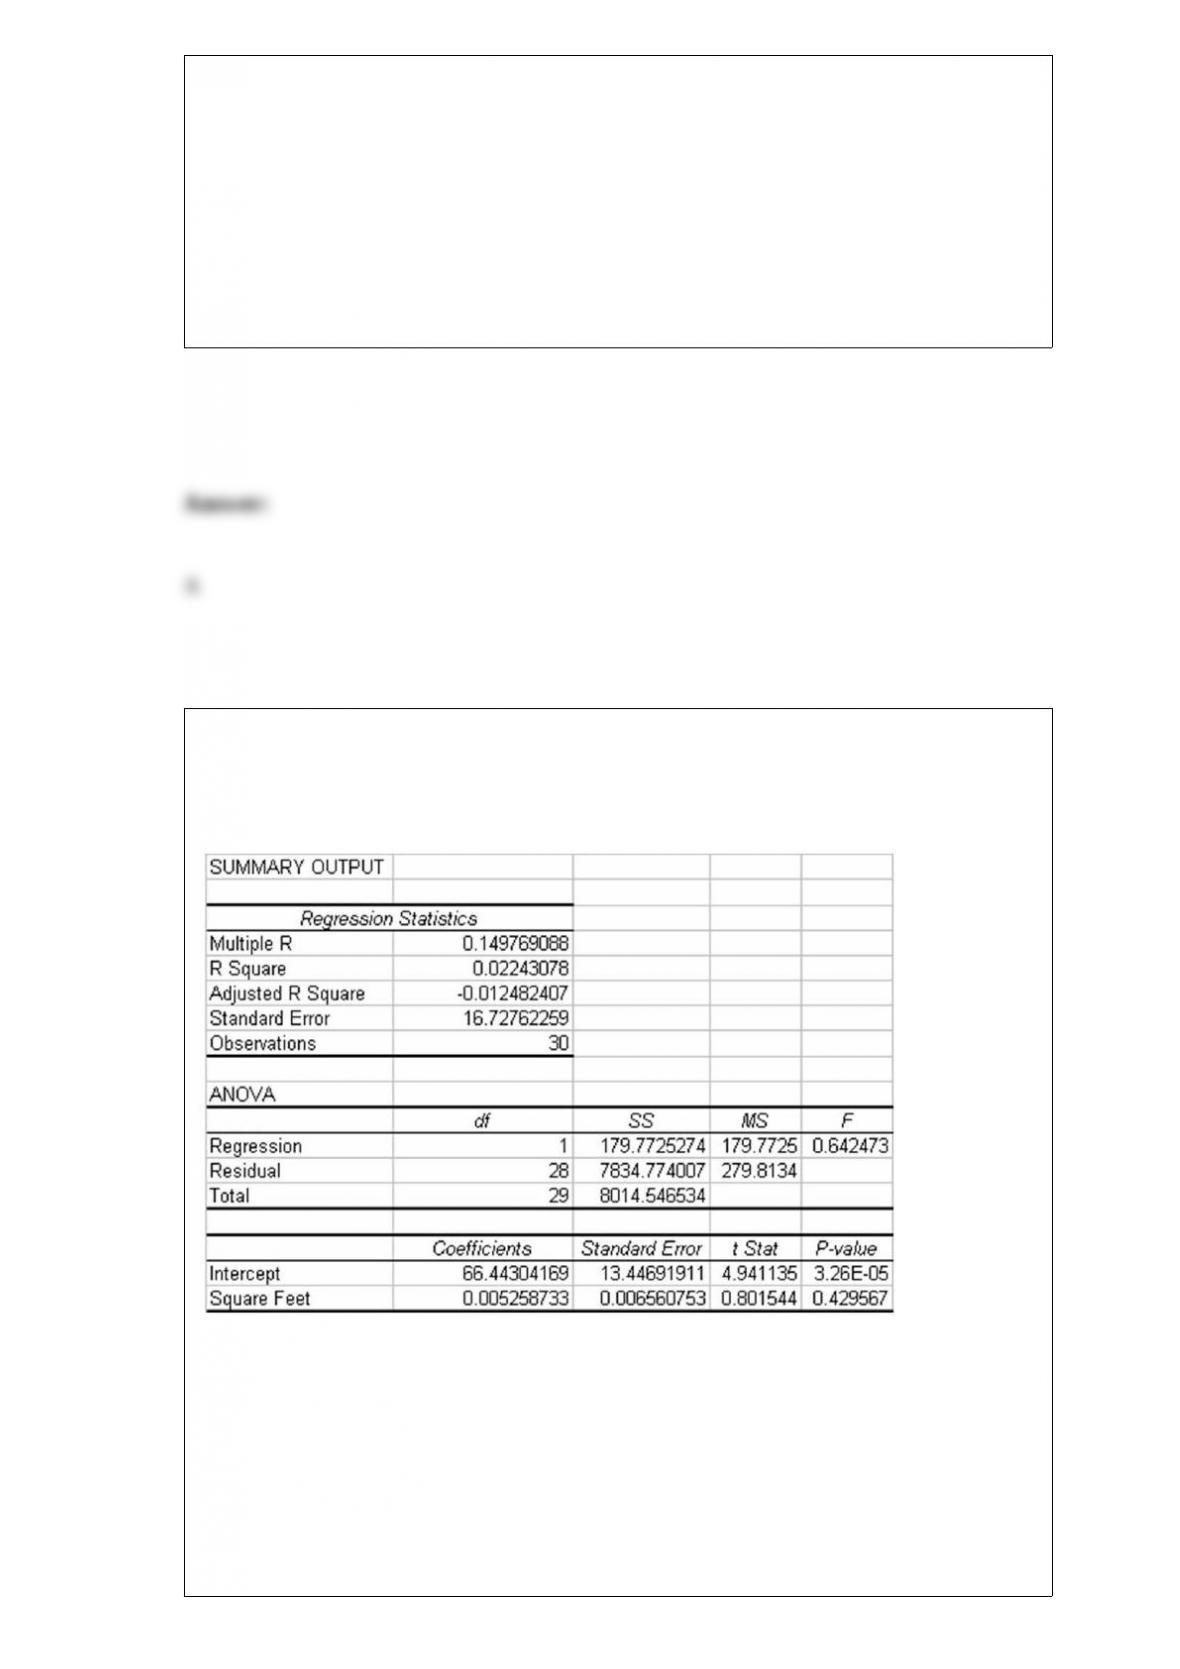
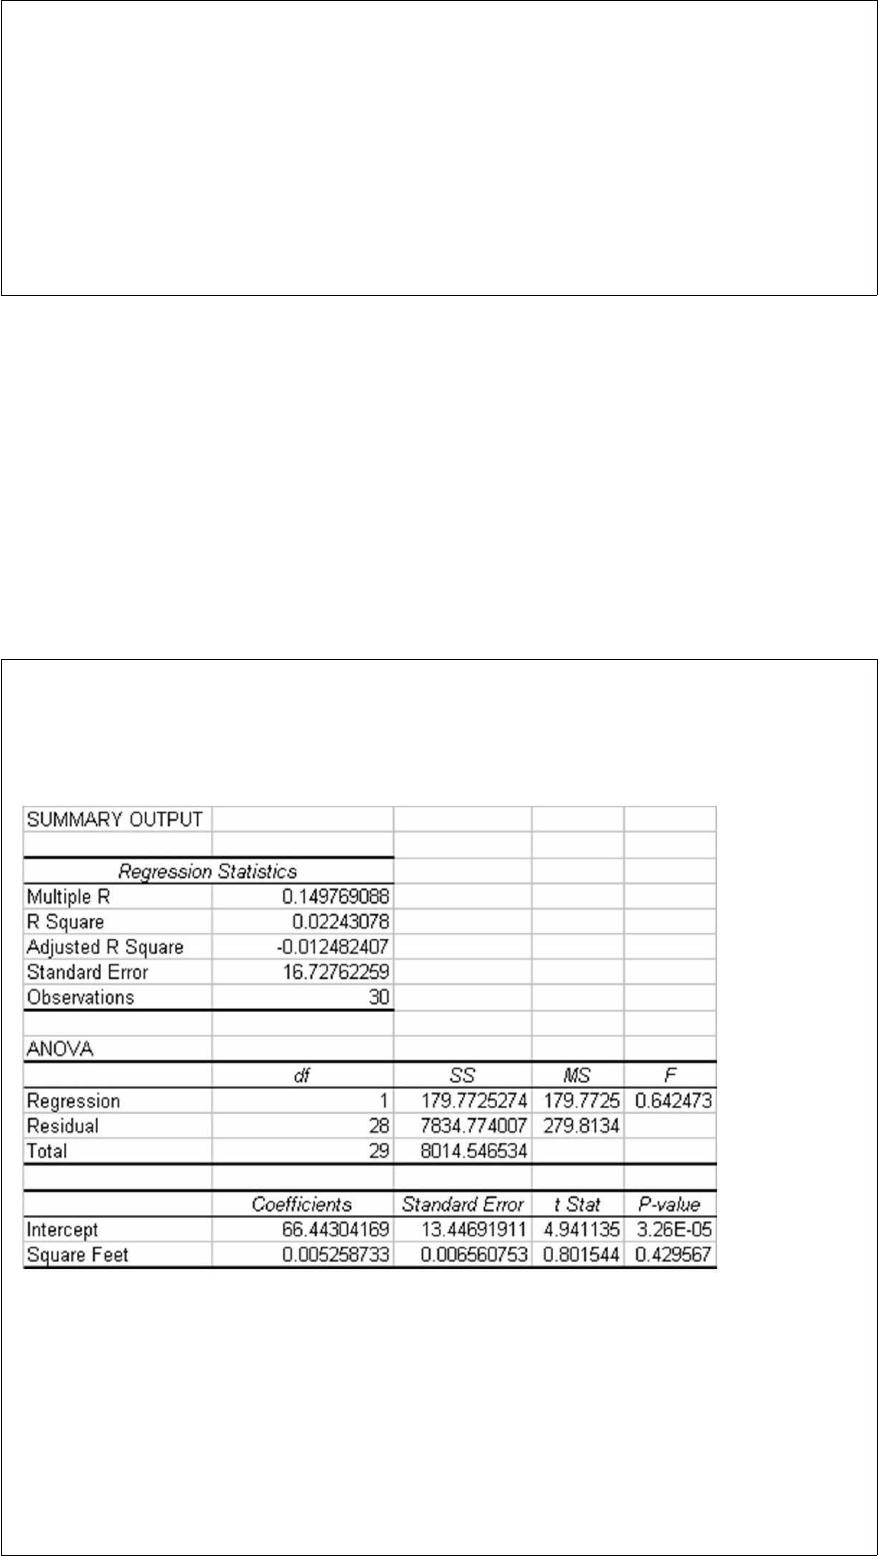
The following regression output was generated based on a sample of utility customers.
The dependent variable was the dollar amount of the monthly bill and the independent
variable was the size of the house in square feet.
Based on this regression output, which of the following statements is not true?
A) The number of square feet in the house explains only about 2 percent of the variation
in the monthly power bill.
B) At an alpha level equal to 0.05, there is no basis for rejecting the hypothesis that the
slope coefficient is equal to zero.


C) The average increase in the monthly power bill is about 66.4 for each additional
square foot of space in the house.
D) The correlation of the monthly power bill with the square footage of the house is
0.149
Which of the following is an acceptable format for setting up class boundaries for a
frequency distribution?
A) 20 to under 40
B) 20 to 40
C) 200 to 299.99
D) All of the above.
A manufacturer of industrial plywood has a contract to supply a boat maker with a large
amount of plywood. One of the specifications calls for the standard deviation in
thickness to not exceed .03 inch. A sample of n = 30 sheets was sampled randomly from
a recent production run. The mean thickness was right at the 3/4 inch target thickness
and the sample standard deviation was .05 inch. Testing at the 0.05 level of
significance, which of the following is true?
A) The test statistic is approximately 80.56.
B) The critical value is approximately χ2 = 43.773.
C) The test statistic is approximately 48.333.
D) Based on the sample data, there is no evidence to suggest that the plywood is not
meeting the specifications.
Magic Valley Memorial Hospital administrators have recently received an internal audit
report that indicates that 15% of all patient bills contain an error of one form or another.
After spending considerable effort to improve the hospital’s billing process, the
administrators are convinced that things have improved. They believe that the new error
rate is somewhere closer to 0.05.Suppose that recently the hospital randomly sampled
10 patient bills and conducted a thorough study to determine whether an error exists. It
found 3 bills with errors. Assuming that managers are correct that they have improved
the error rate to 0.05, what is the probability that they would find 3 or more errors in a
sample of 10 bills?
A) 0.0115
B) 0.0233
C) 0.0884
D) 0.0766
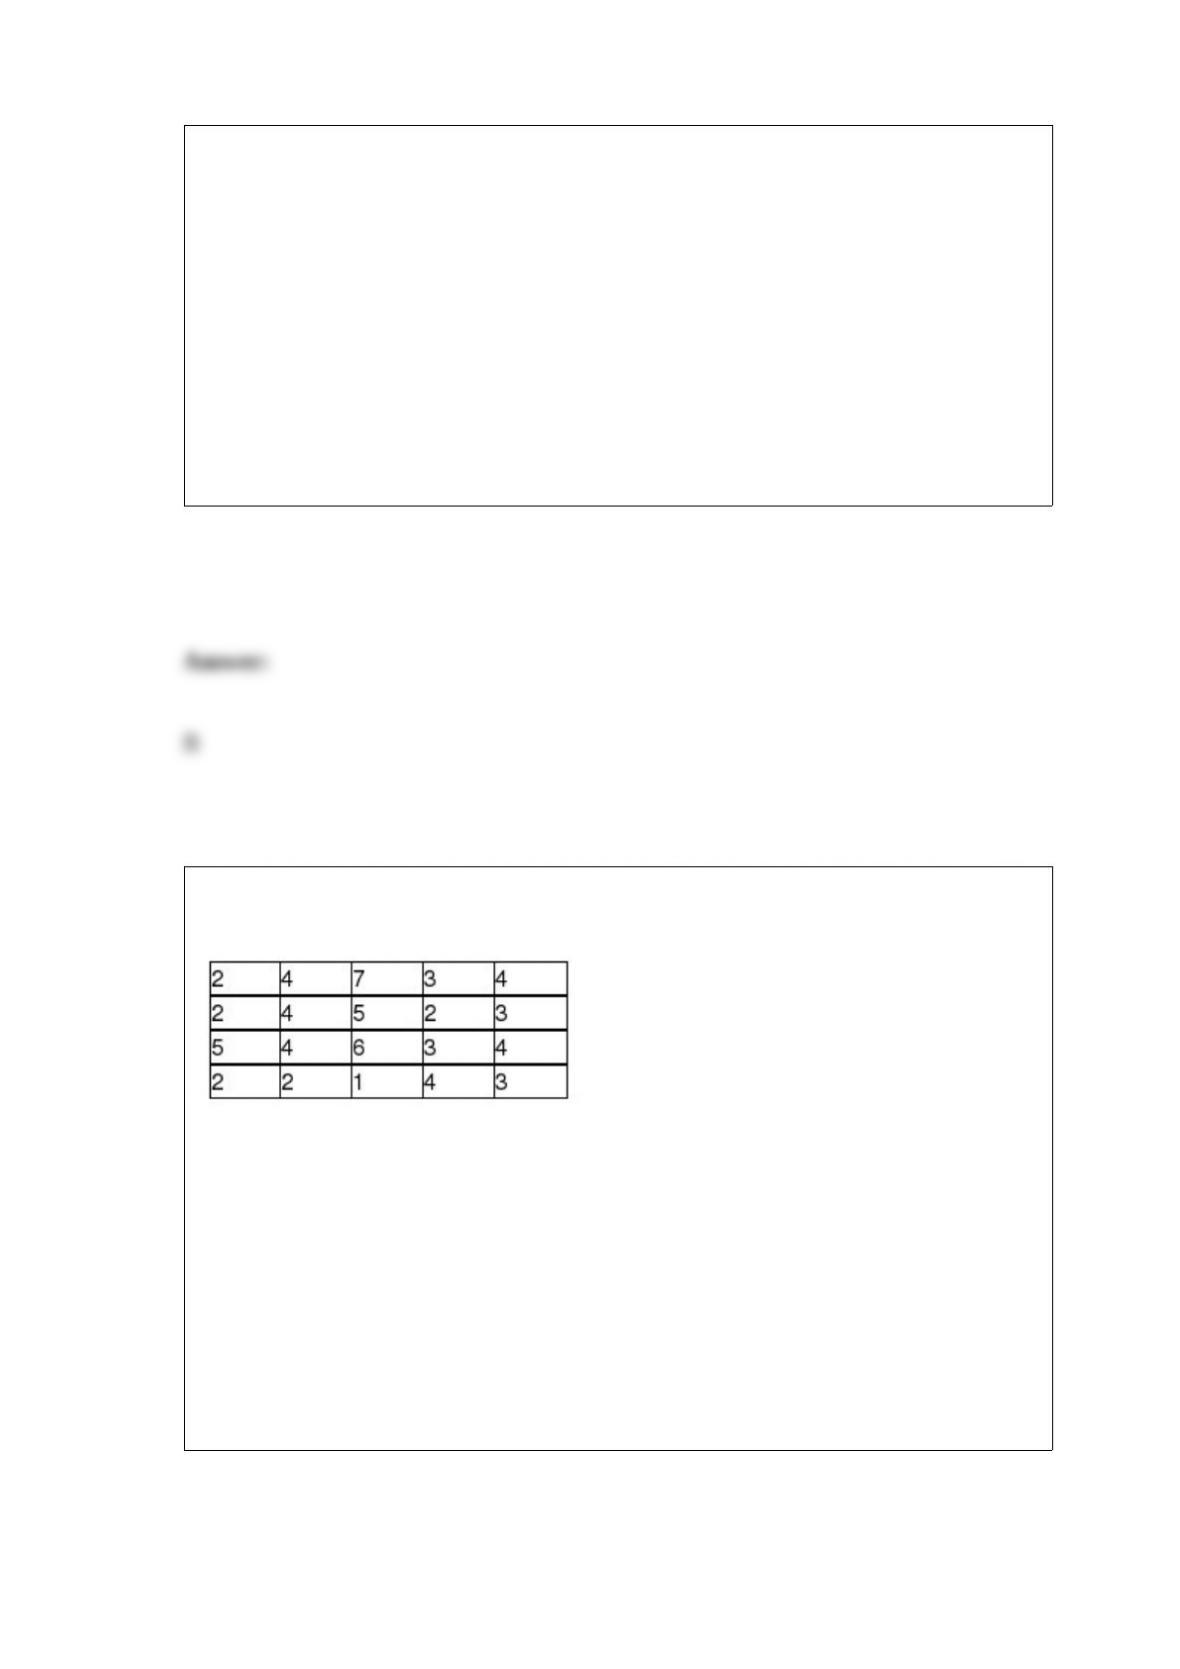
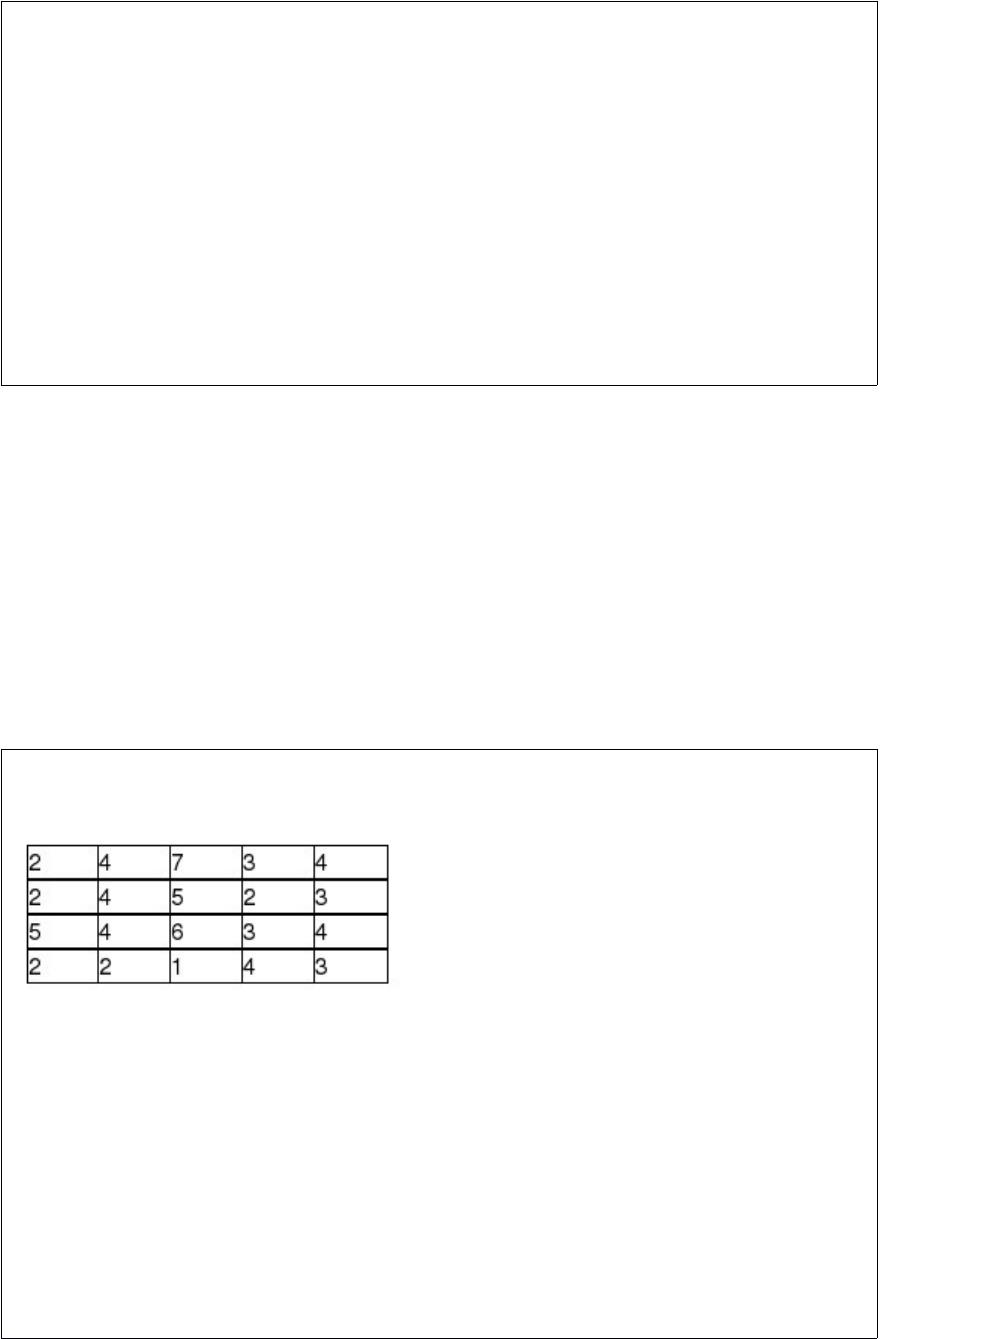
At a sawmill in Oregon, a process improvement team measured the diameters for a
sample of 1,500 logs. The following summary statistics were computed:


Given this information, for a box and whisker plot which of the following statements is
appropriate?
A) Seventy-five percent of the trees in the sample have values between 8.9 in. and 15.6
in.
B) Virtually all of the data should fall between 0 in. and 25.65 in.
C) No tree will have a diameter of more than 22.3 in.
D) Fifty percent of the trees will have diameters between 13.5 in. and 15.6 in.
The mayor of a large U.S. city is interested in addressing complaints from many
property owners regarding recent property assessments. Many people feel that they are
being overtaxed and that their assessments are too high. To study this issue, the mayor
plans to hire consultants to randomly select homes in the city and have these homes
independently assessed for value. However, she is concerned that the cost of sampling
will be very high since the city is spread out over a wide geographical area. To
potentially reduce the cost of sampling, which of the following statistical sampling
techniques should be applied?
A) Cluster sampling
B) Ratio sampling
C) Simple random sampling
D) Stratified random sampling
The manager of a movie theater has determined that the distribution of customers
arriving at the concession stand is Poisson distributed with a standard deviation equal to
2 people per 10 minutes. What is the probability that 0 customers arrive during a
10-minute period?
A) 0.1353
B) 0.0183
C) 0.9817
D) Essentially 0
A particular subdivision has 20 homes. The number of people living in each of these
homes is listed as follows:
If a random sample of n = 3 homes were selected, what would be the highest possible
positive sampling error?
A) 6.0
B) 3.0
C) 0.5
D) 2.5


Consider a random variable, z, that has a standardized normal distribution. Determine
P(0 < z < 1.96).
A) 0.1250
B) 0.5250
C) 0.3250
D) 0.4750
Which of the following is an assumption for the one-way analysis of variance
experimental design?
A) All populations are normally distributed.
B) The populations have equal variances.
C) The observations are independent.
D) All of the above
A major U.S. automaker has determined that the city mileage for one of its new SUV
models is normally distributed with a mean equal to 15.2 mpg. A report issued by the
company indicated that 22 percent of the SUV model vehicles will get more than 17
mpg in the city. Given this information, what is the city mileage standard deviation for
this SUV model?
A) 0.77 mpg
B) Approximately 2.34 mpg
C) 1.8 mpg
D) Approximately 3.1 mpg
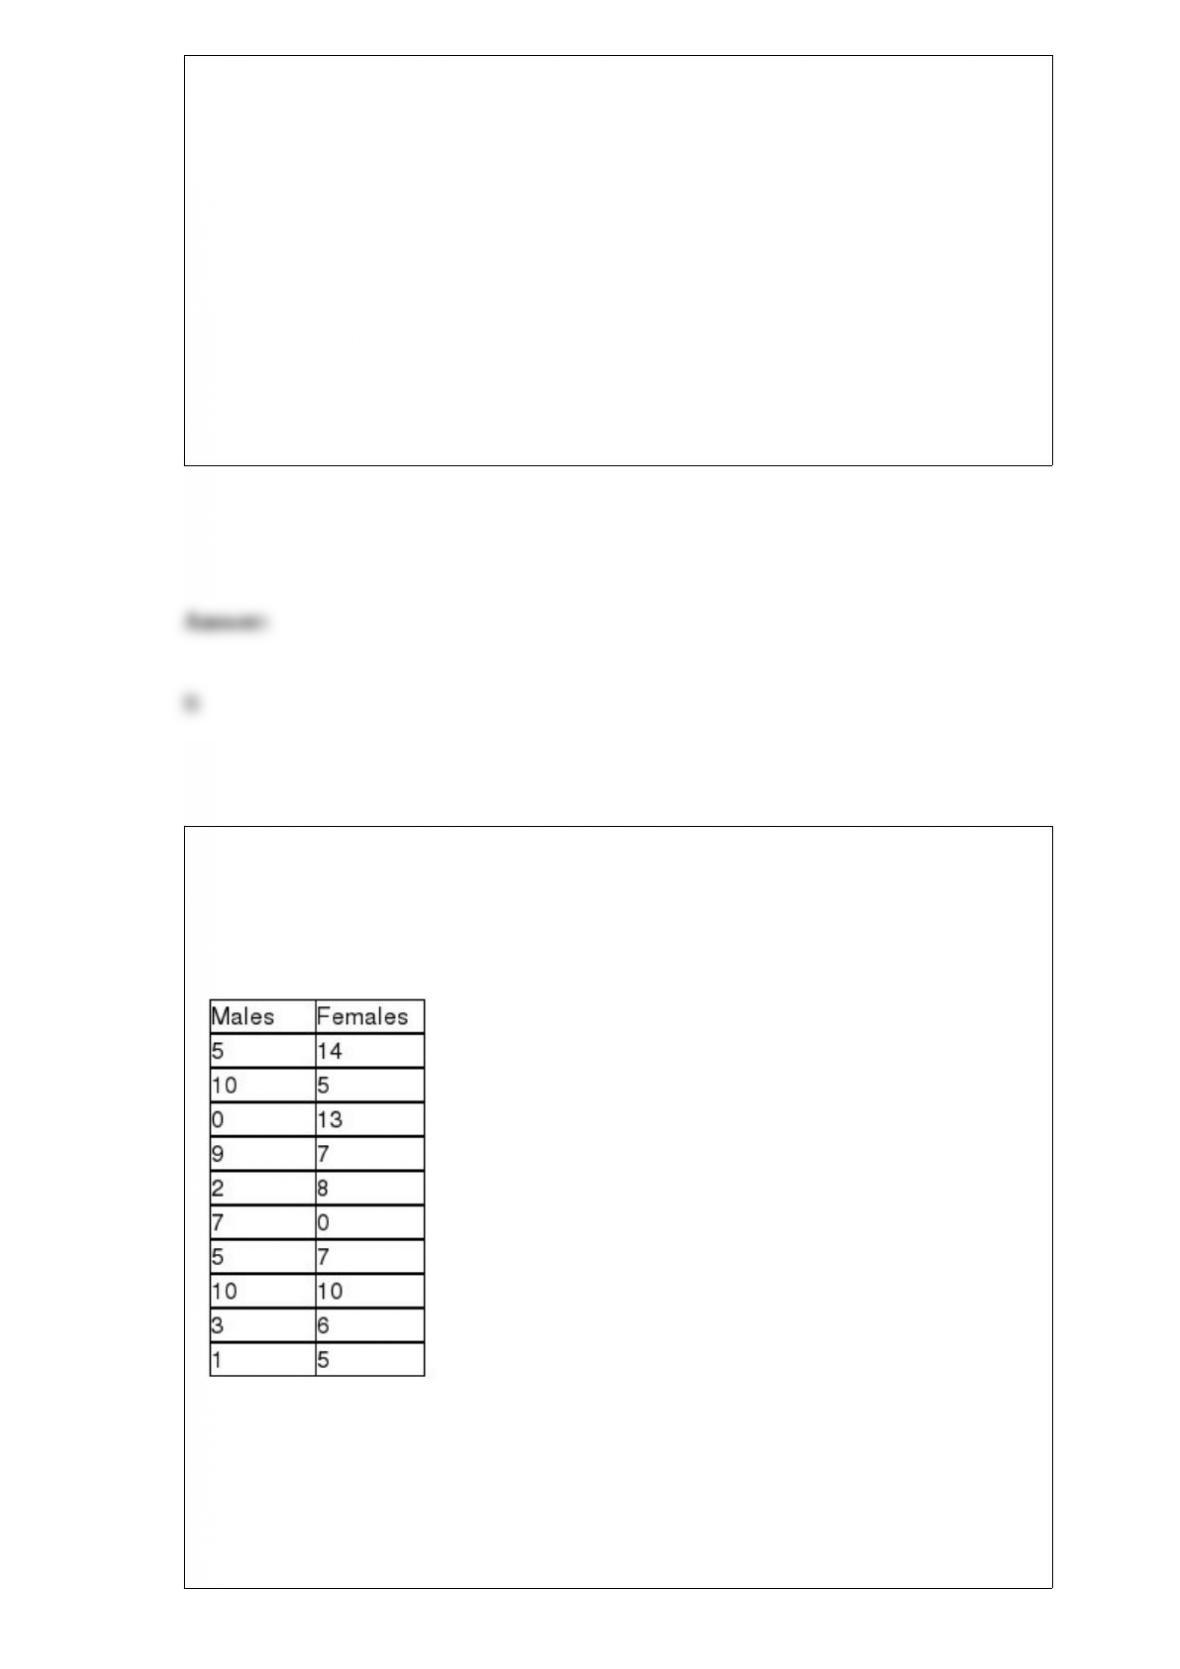
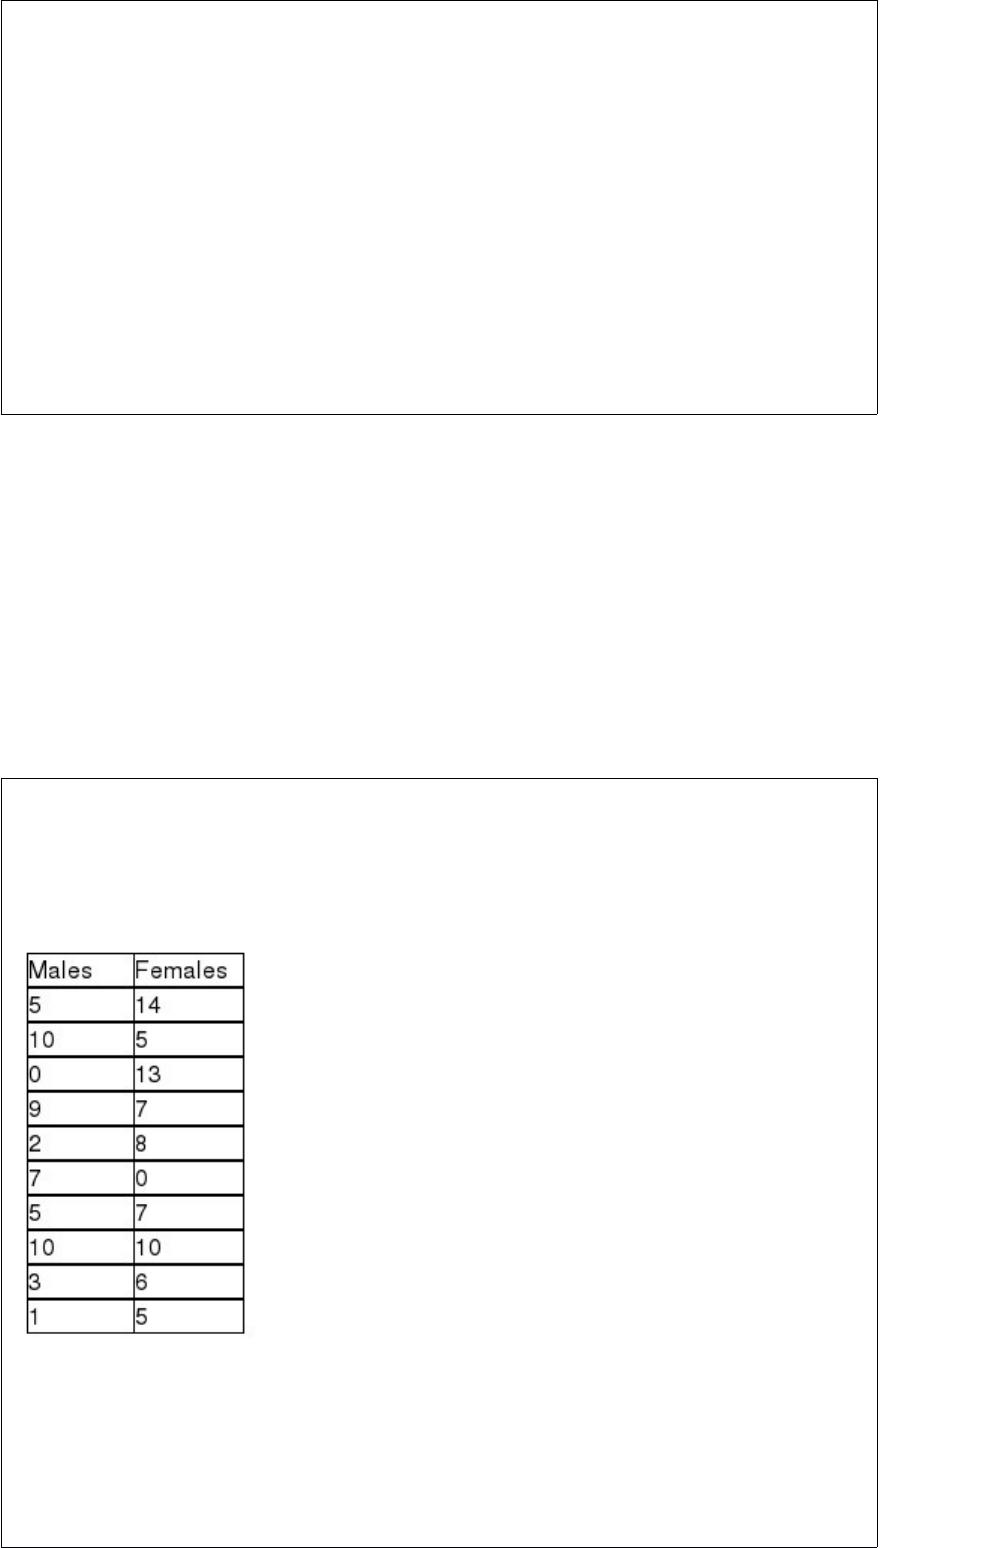
Consider the situation in which a human resources manager wishes to determine
whether the median number of days of sick leave per year is the same for female
employees as for male employees. The following data represent random samples of
males and females:
If the manager is unwilling to assume that the populations are normally distributed,
which of the following would be the appropriate null hypothesis to be tested?
A) H0 : μ = 0


B) H0 : = 0
C) H0 : μ1 = μ2
D) H0 : 1 = 2
A marketing firm is interested to know whether the median age of college students is 21
years. A sample of 80 college students is taken. Thirty of the students were under 21, 45
of the students were over 21, and 10 were 21 years old. The conclusion is that
A) the median age of college students is significantly different from 21.
B) the median age of college students is not significantly different from 21.
C) the median age of college students is significantly older than from 21.
D) the median age of college students is significantly younger than from 21.
In a Kruskal-Wallis test when ties occur, each observation is given the ________ for
which it is tied.
A) highest rank
B) lowest rank
C) mean rank
D) median rank
The Grangeville Power Company has four classifications for its customers. For each
customer classification, the company tracks the total amount of electricity used during
the year. Which of the following types of graphs would be most appropriate to use?
A) A horizontal bar chart
B) A vertical bar chart
C) Both A and B would be appropriate.
D) A histogram
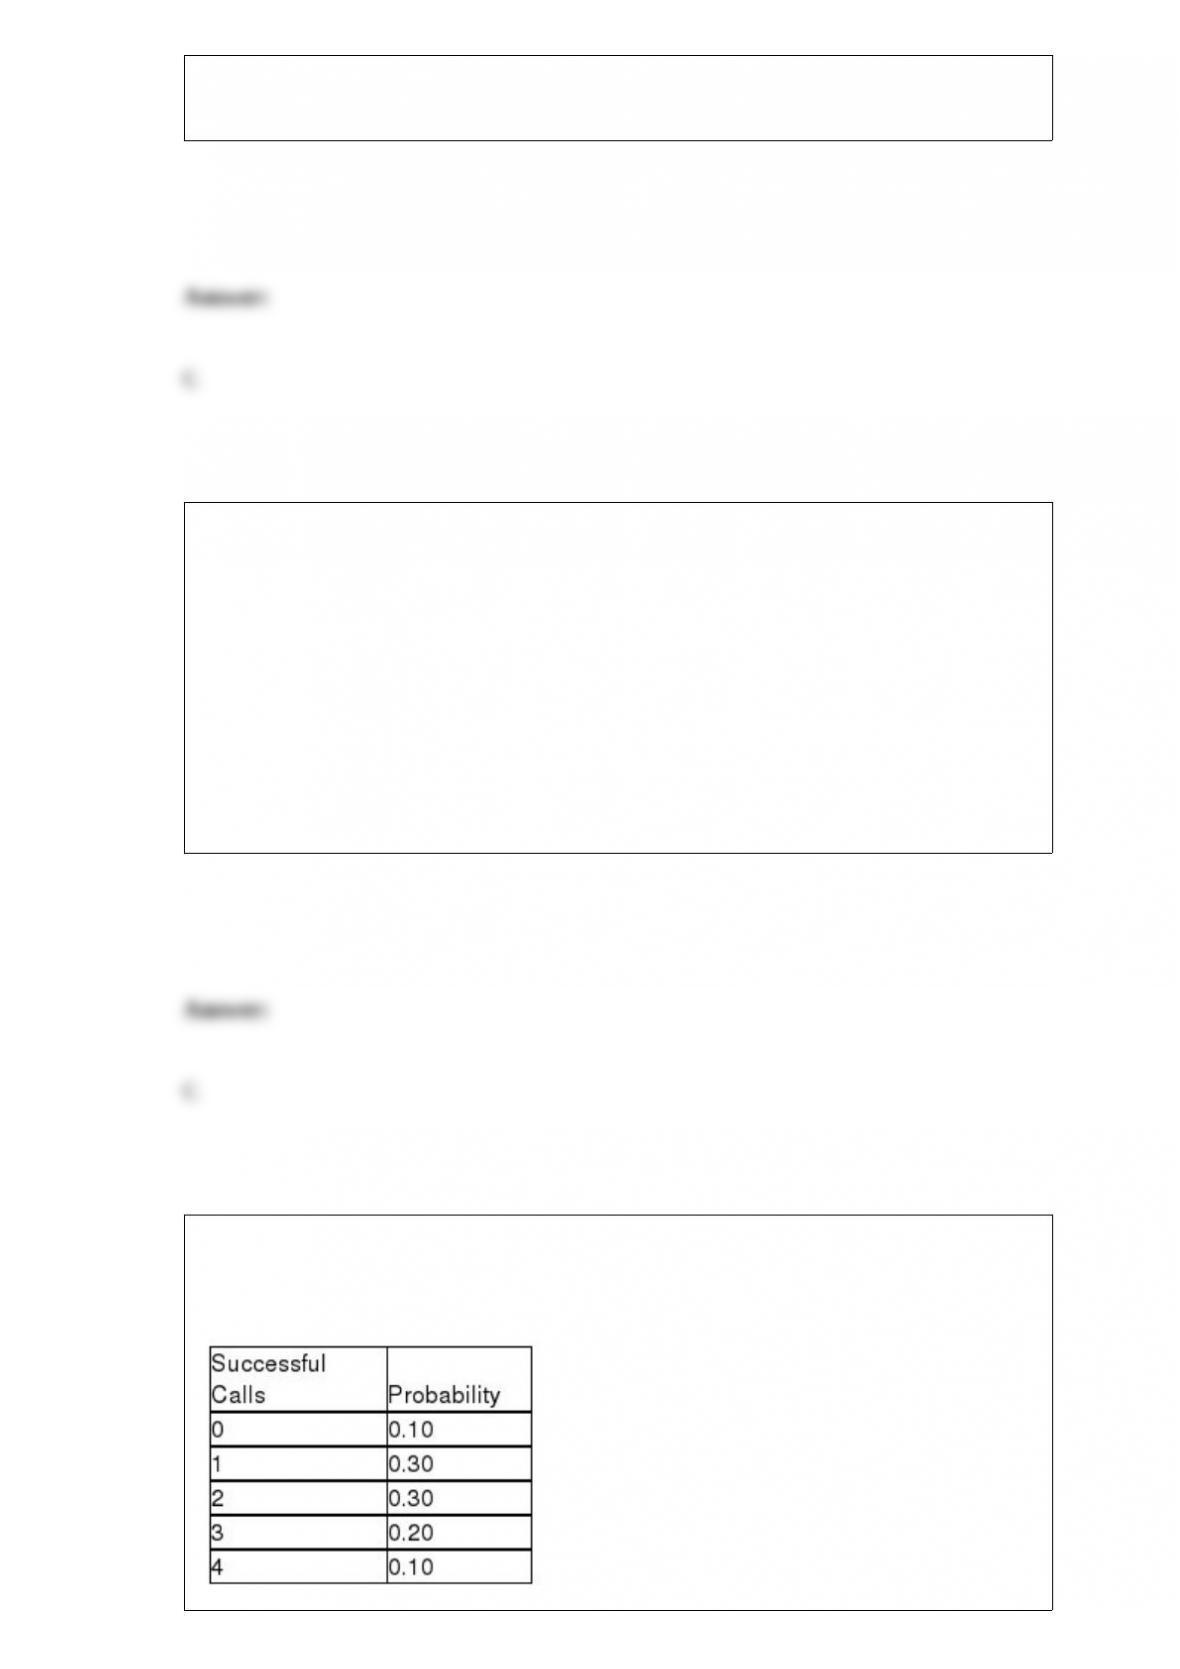
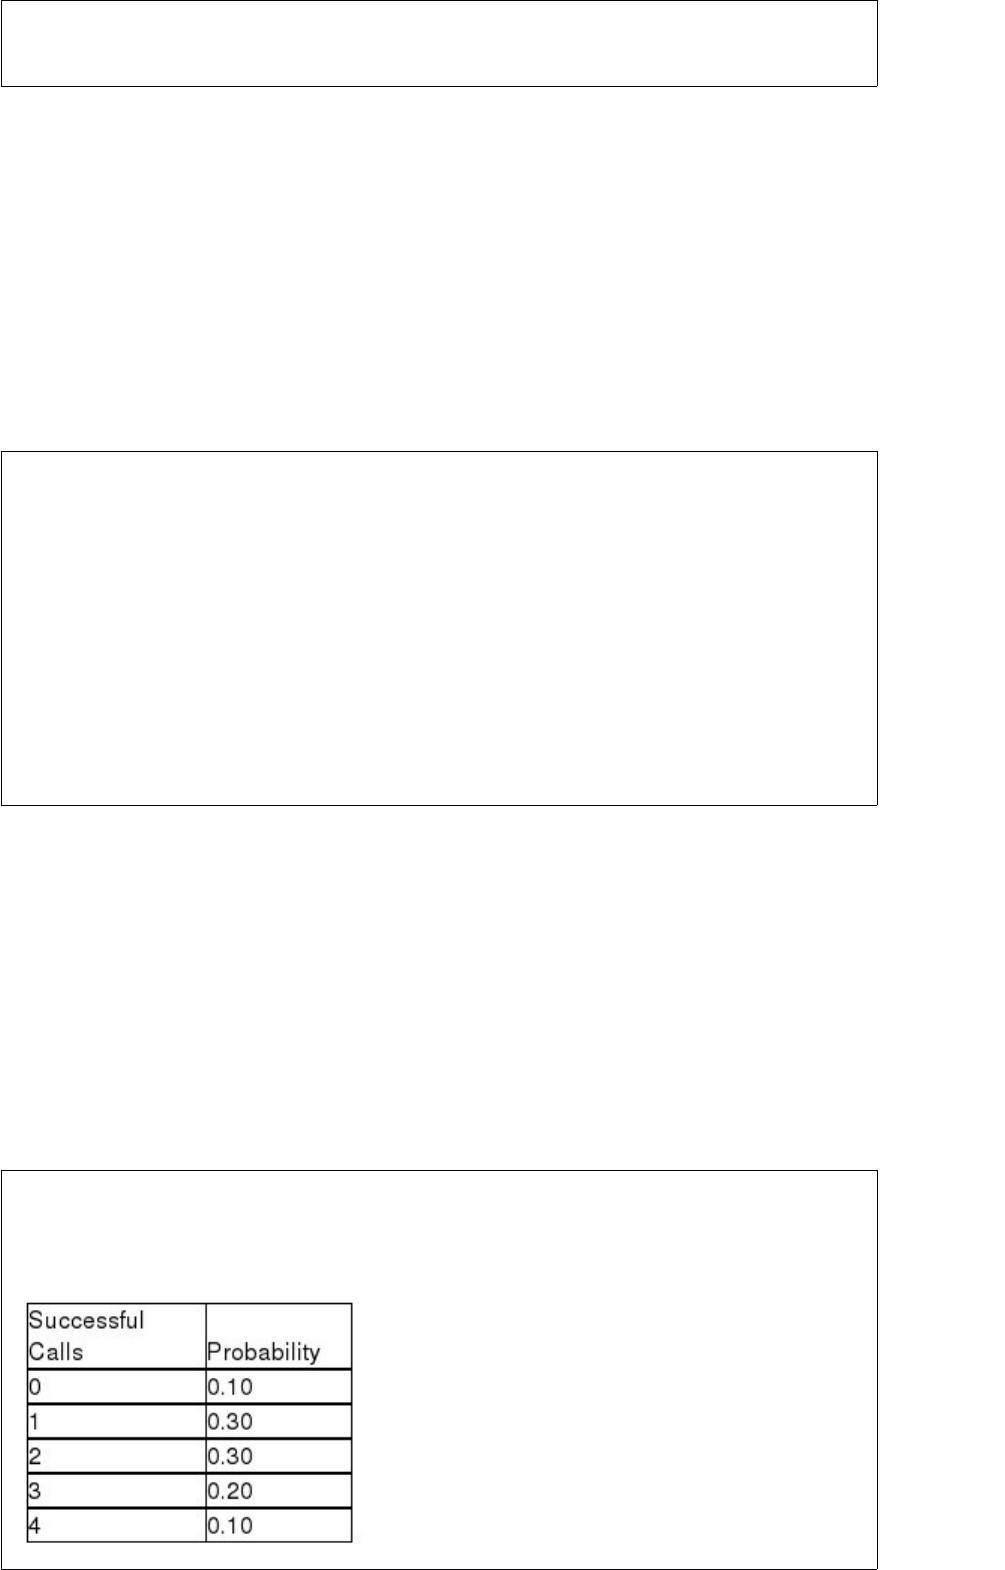
A sales rep for a national clothing company makes 4 calls per day. Based on historical
records, the following probability distribution describes the number of successful calls
each day:
The expected number of successful sales calls per day is:
A) 2.00
B) 1.15
C) 1.90
D) 2.50
A study was recently conducted in which makers of toothpaste tracked sales for the
month at different stores in a market area. The variable of interest was the number of
units sold. The numbers ranged from 1,200 to 22,700. In this case, the stems in a stem
and leaf diagram might be values such as 1 and 22 while the leaves would be 200 and
700.
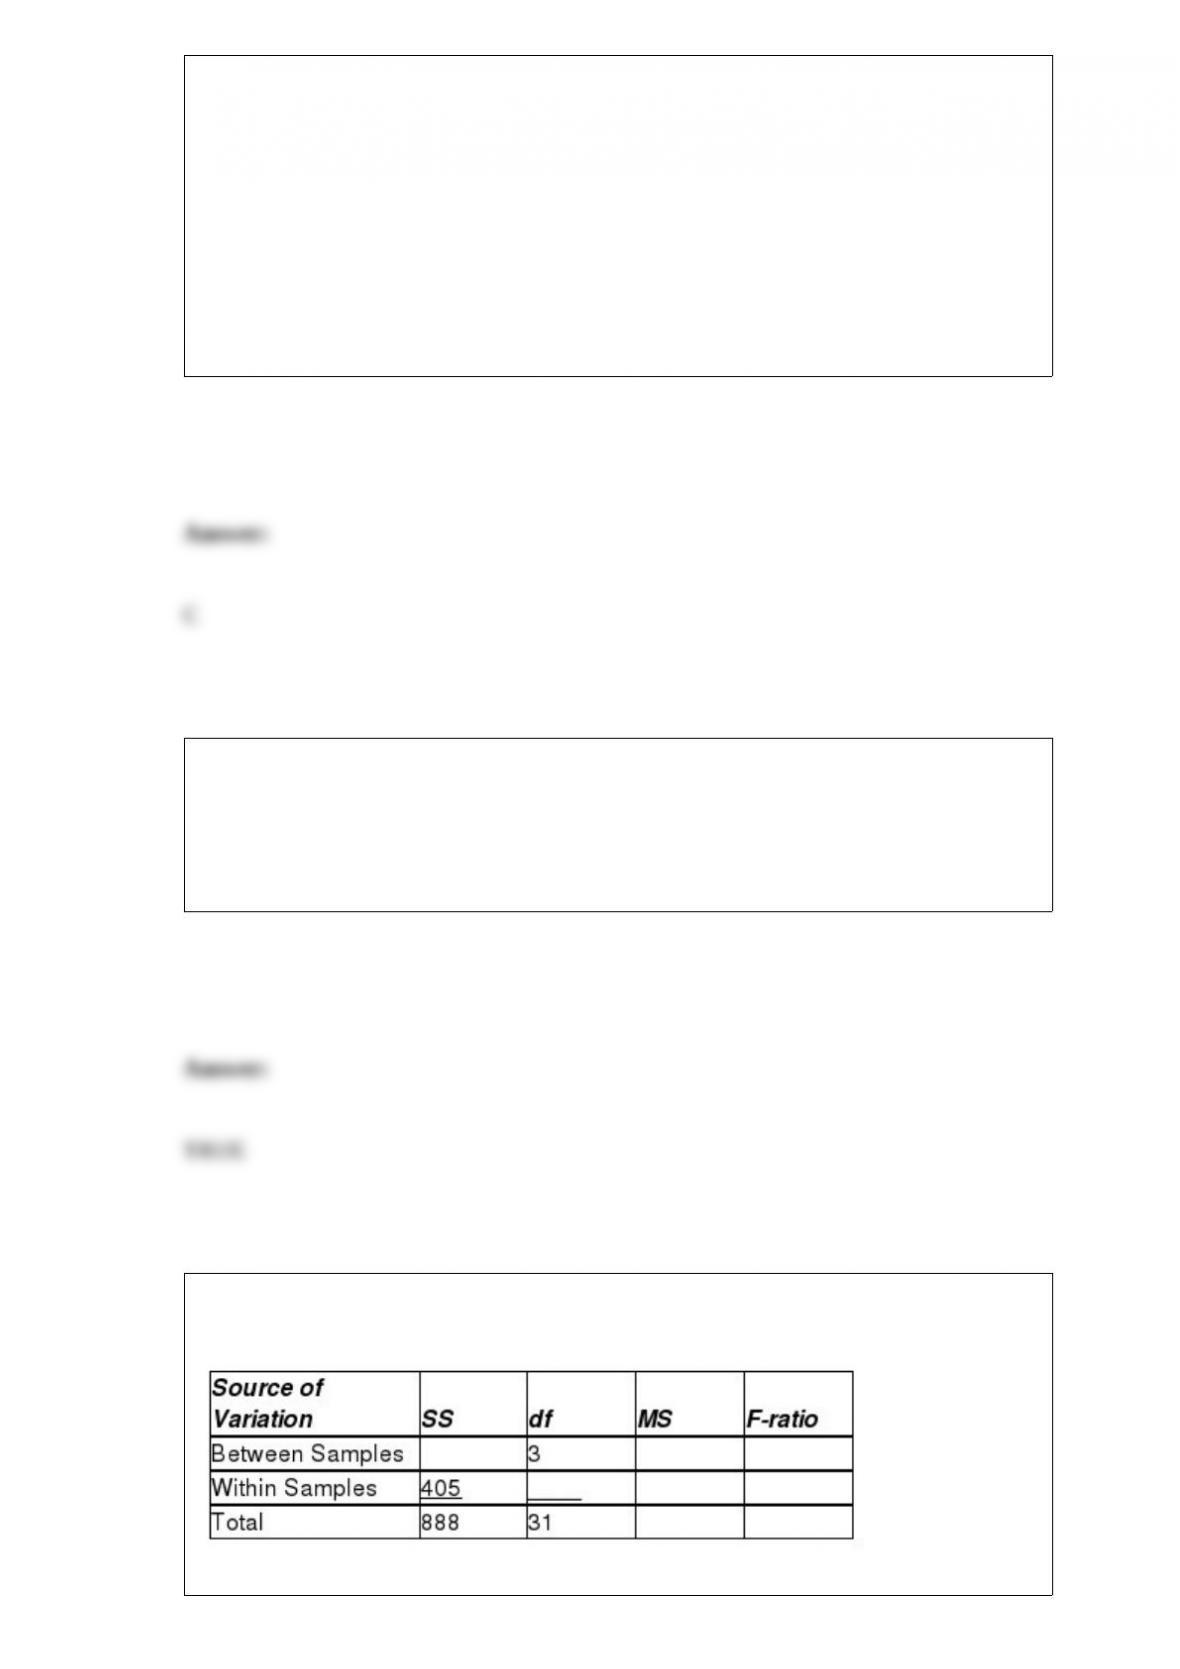
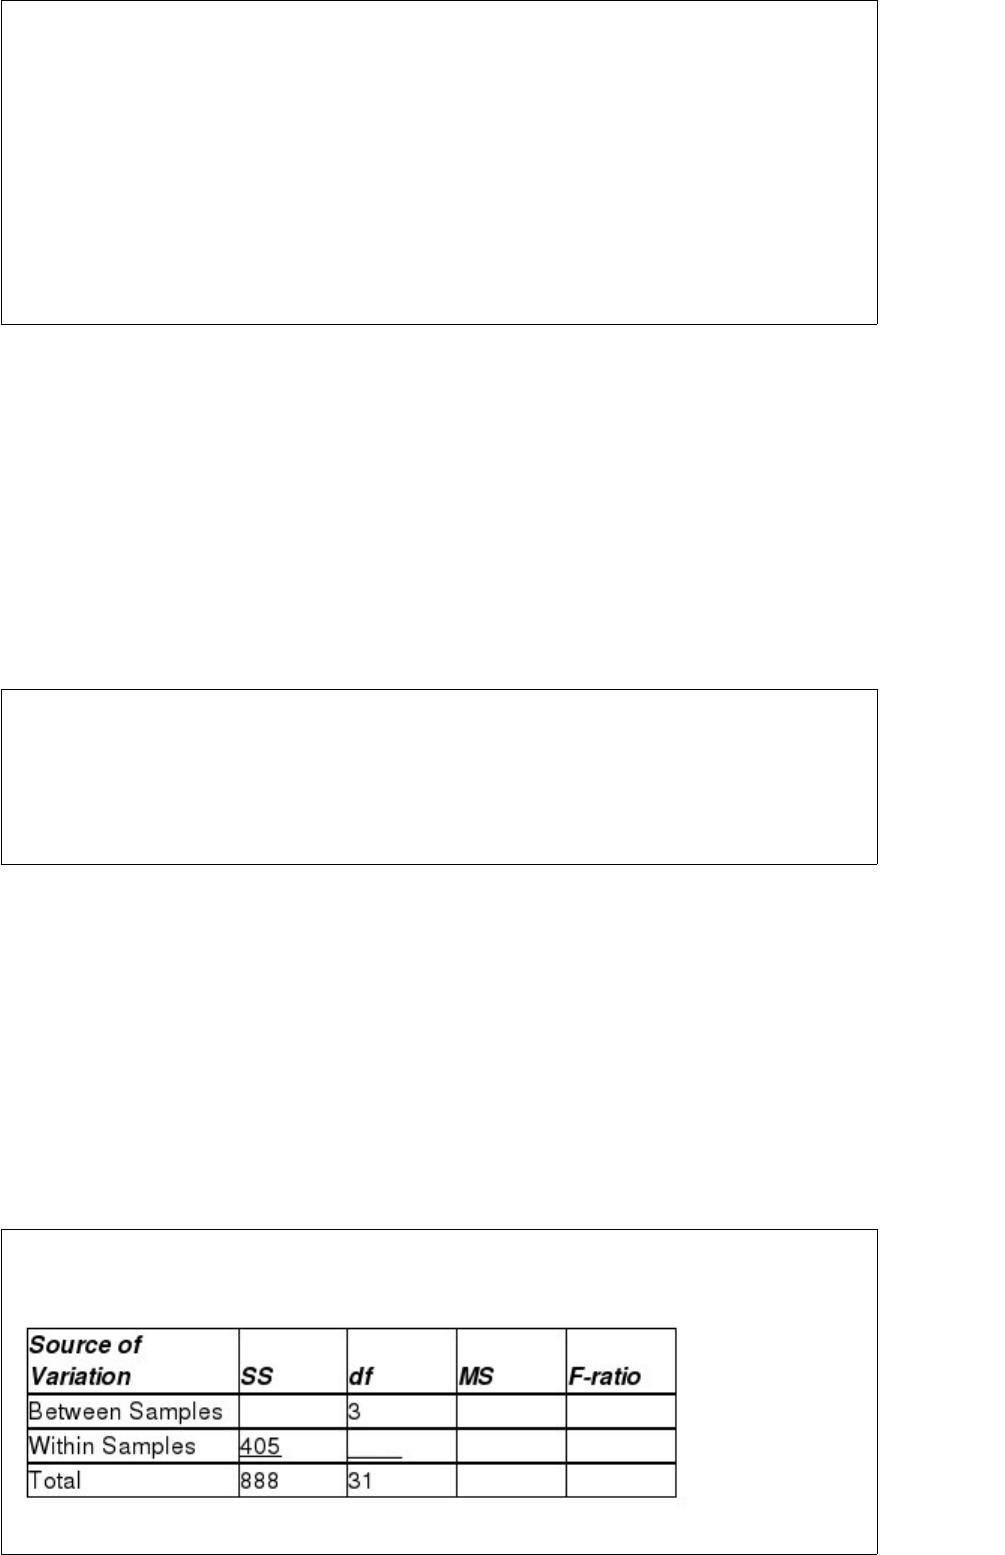
Respond to the following questions using this partially completed one-way ANOVA
table:
Fill in the ANOVA table with the missing values.
A) SSB = 483, MSB = 161, F-ratio = 11.1309, Within Samples df = 28, MSW = 14.464
B) SSB = 483, MSB = 161, F- ratio = 8.1629, Within Samples df = 28, MSW = 14.464
C) SSB = 483, MSB = 161, F-ratio = 8.1629, Within Samples df = 25, MSW = 14.464
D) SSB = 504, MSB = 161, F-ratio = 8.1629, Within Samples df = 28, MSW = 14.464
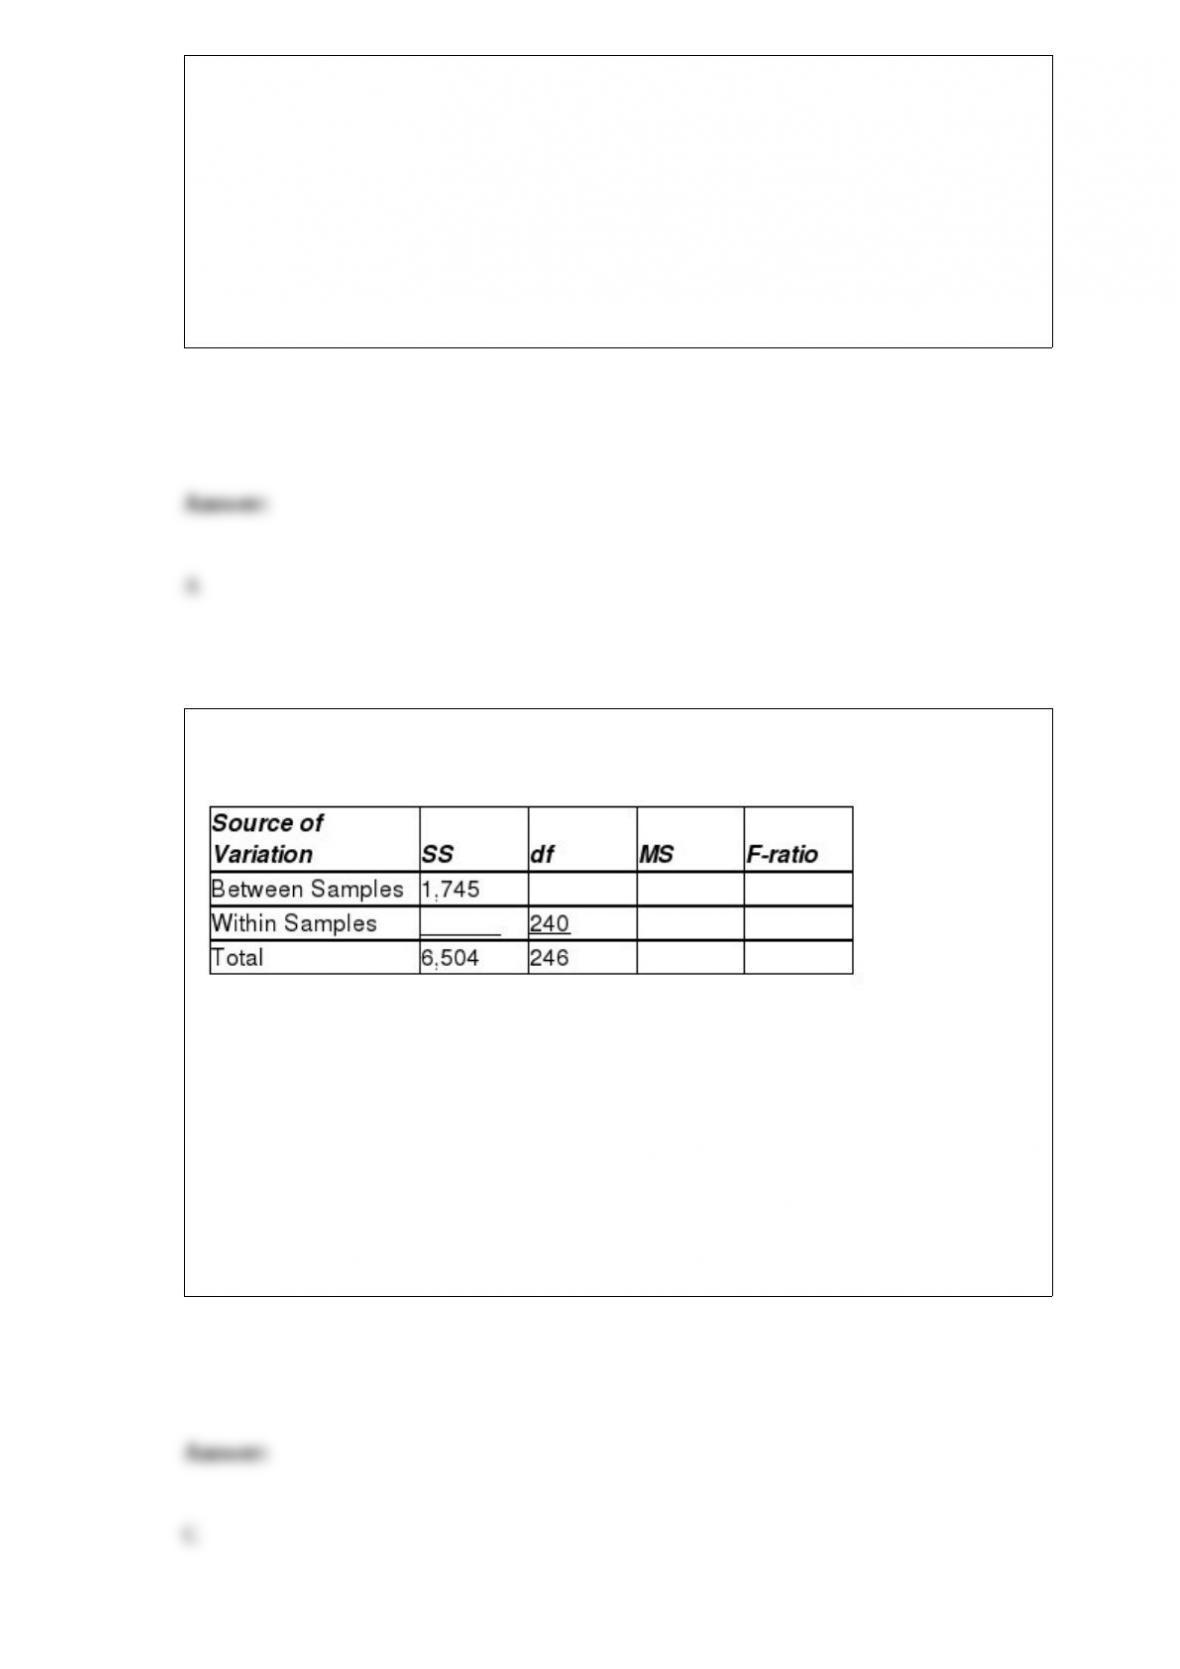
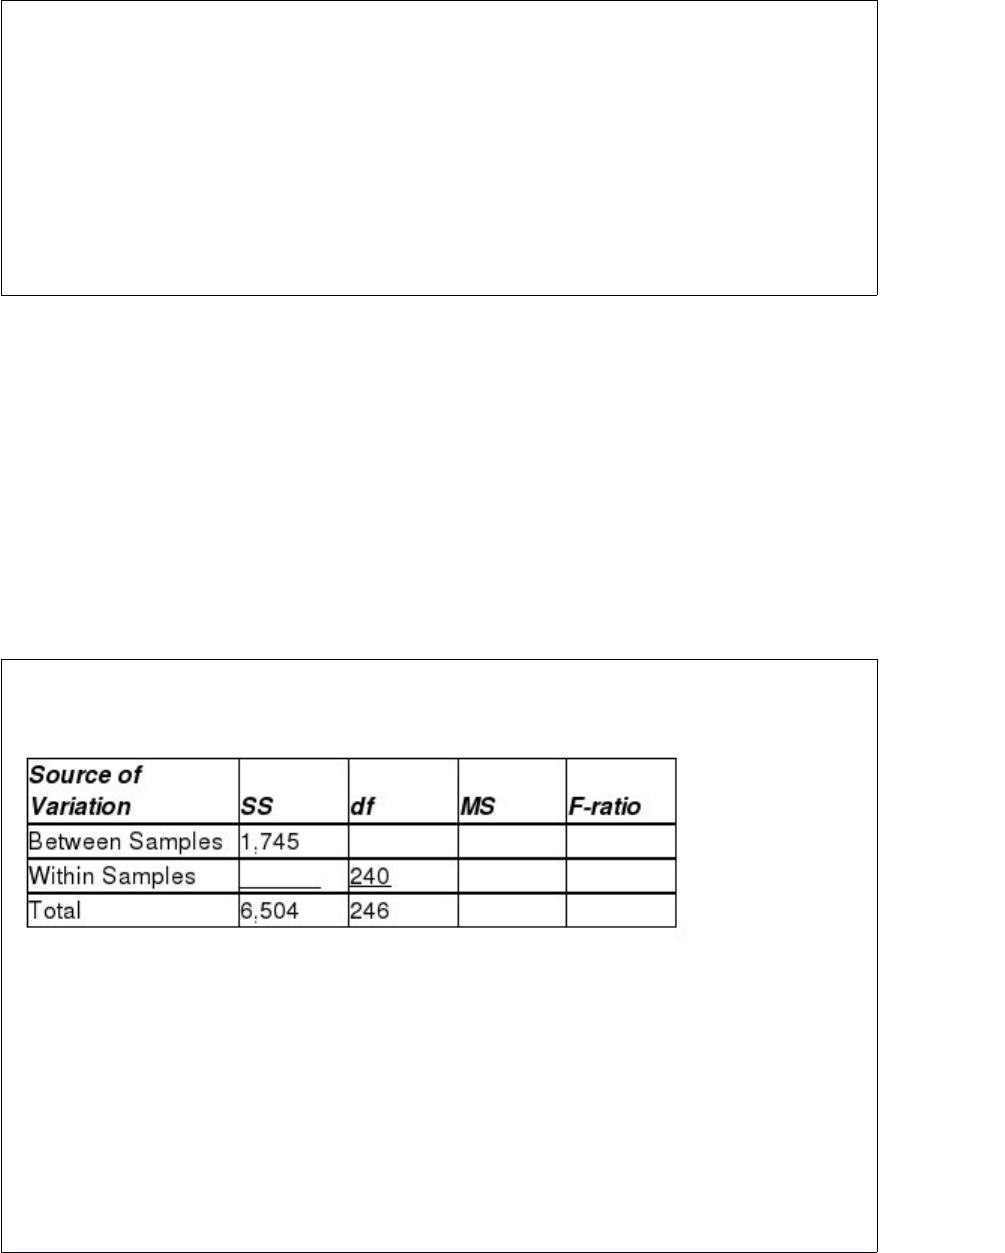
Respond to the following questions using this partially completed one-way ANOVA
table:
How many different populations are being considered in this analysis?
A) 5
B) 8
C) 7
D) 6

An issue that faces individuals investing for retirement is allocating assets among
different investment choices. Suppose a study conducted 10 years ago showed that 65%
of investors preferred stocks to real estate as an investment. In a recent random sample
of 900 investors, 540 preferred real estate to stocks. Is this new data sufficient to allow
you to conclude that the proportion of investors preferring stocks to real estate has
declined from 10 years ago? Conduct your analysis at the α = 0.02 level of significance.
A) Because z = -1.915 is not less than -2.055, do not reject H0. A higher proportion of
investors prefer stocks today than 10 years ago.
B) Because z = -1.915 is not less than -2.055, do not reject H0. A lower proportion of
investors prefer stocks today than 10 years ago.
C) Because z = -3.145 is less than -2.055, reject H0. A lower proportion of investors
prefer stocks today than 10 years ago.
D) Because z = -3.145 is less than -2.055, reject H0. A higher proportion of investors
prefer stocks today than 10 years ago.
Explain what the expected value of a discrete random variable measures.
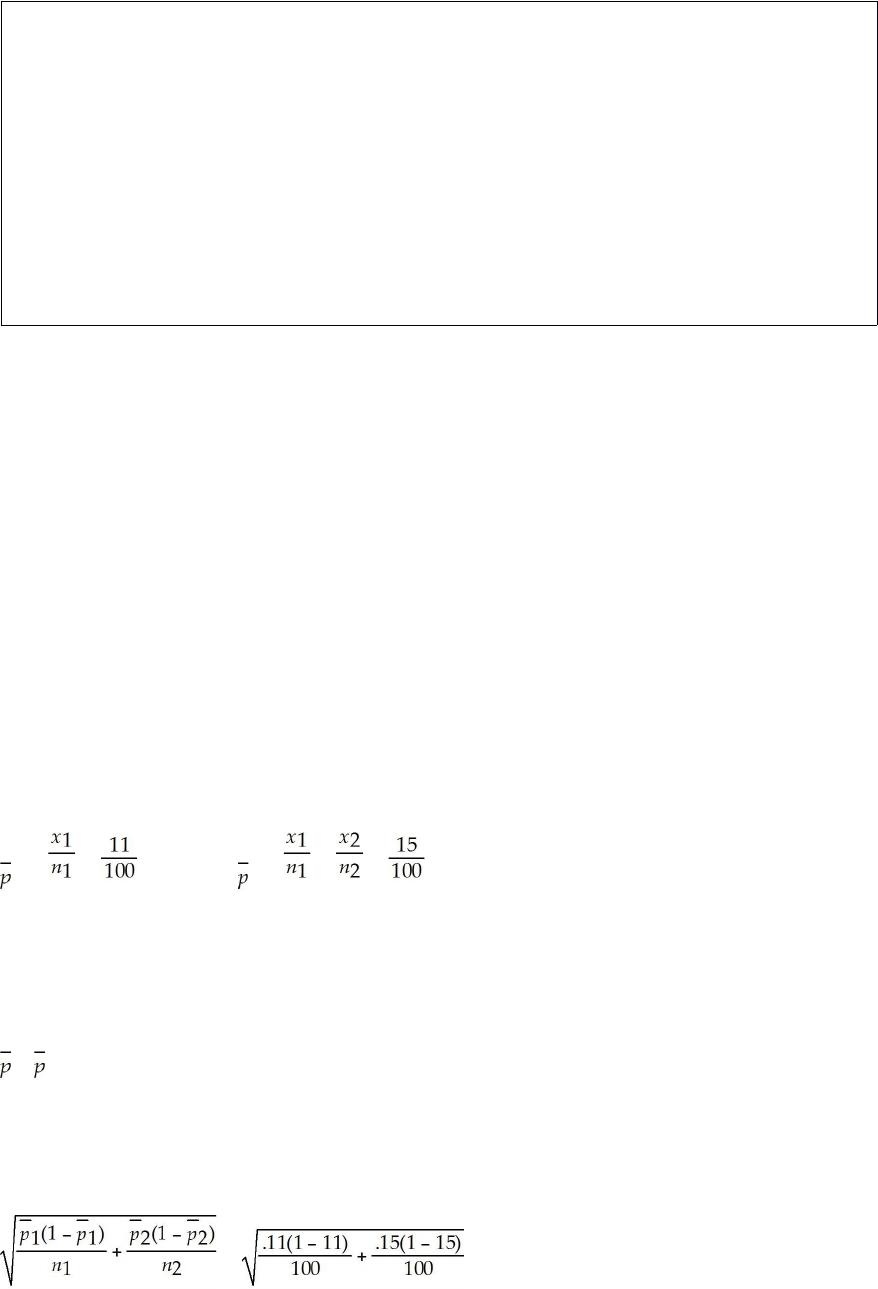
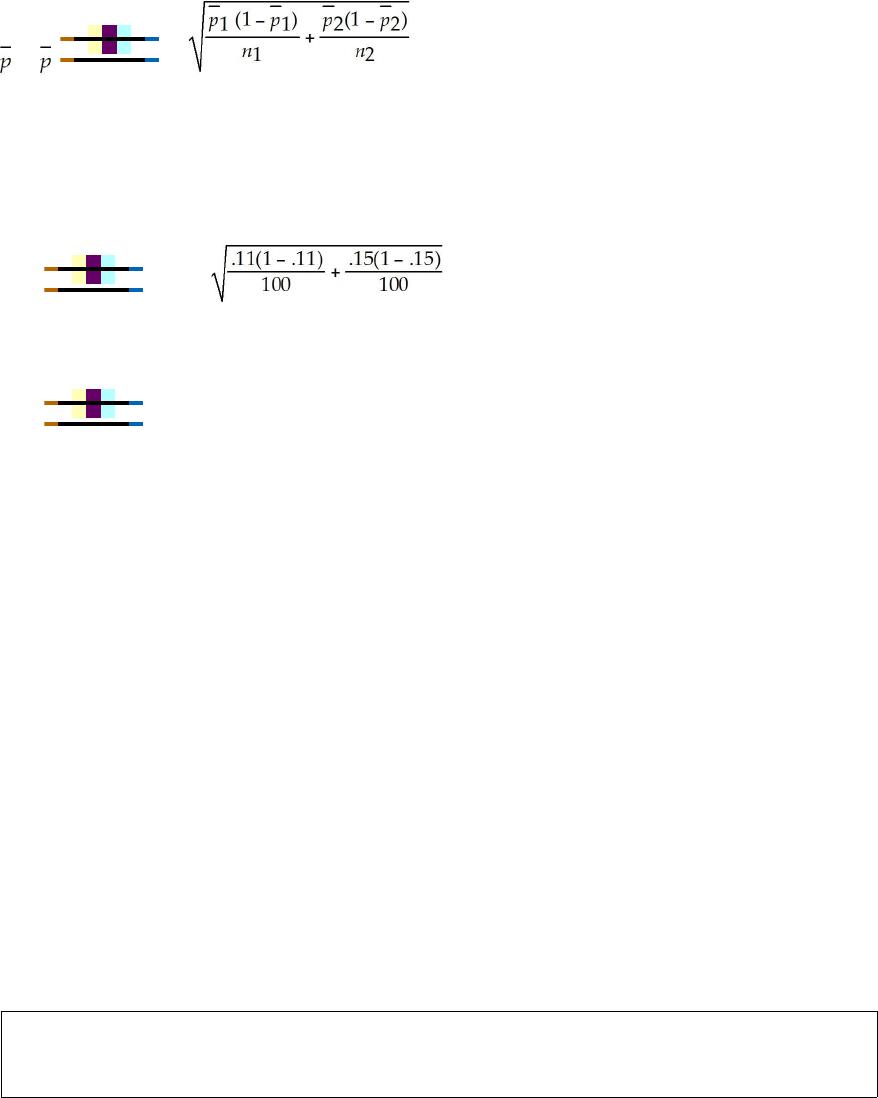
A market research firm has come up with two coupon designs that could be inserted
into the envelopes that go out with the monthly statement to credit card customers. The
coupons offer the customer an opportunity to become a member of a travel club. The
research firm is interested in estimating the difference in proportion of customers who
will join the club after receiving one or the other of the two coupons. To obtain this
estimate, the research firm has sent out coupon design 1 to a random sample of 100
customers. A second random sample of 100 customers received coupon 2. For the first
coupon, 11 customers joined the travel club, while 15 customers who received coupon 2
joined. Based upon this sample information, develop and interpret the desired 95
percent confidence interval estimate.
Discuss the steps that you would use to manually construct a histogram for the salaries
of the 1,124 employees in the Ferris Steel Company.

What is the difference between a discrete random variable and a continuous random
variable?
Explain how the empirical rule can be used to help describe data in a population or a
sample.
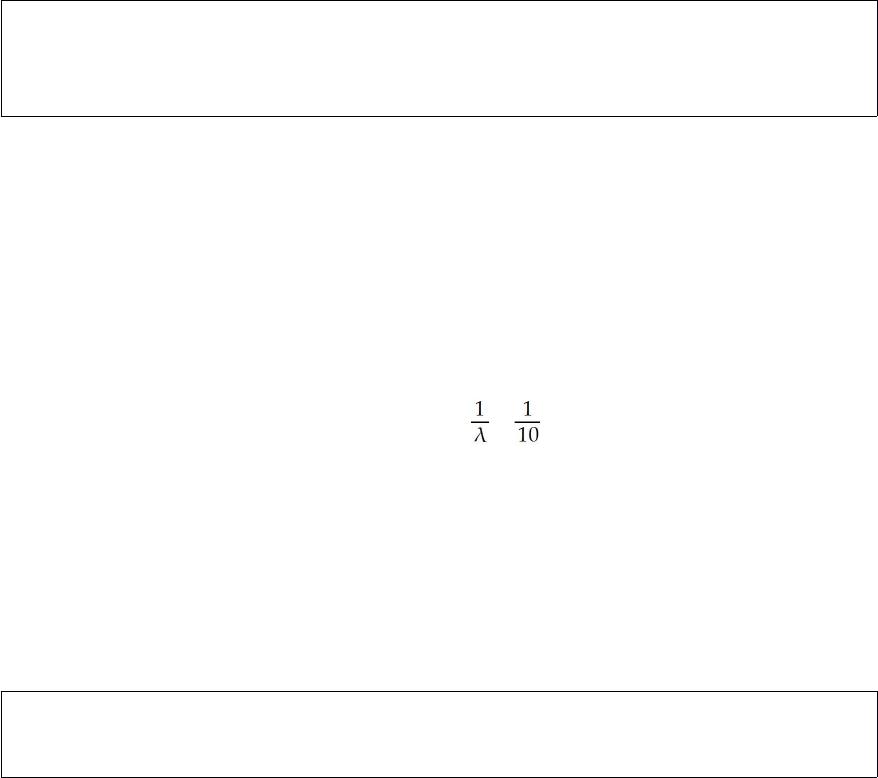
At the West-Side Drive-Inn, customers arrive at the rate of 10 every 30 minutes. The
time between arrivals is exponentially distributed. Given this, what is the mean time
between arrivals?
Suppose that the distribution of grocery purchases is thought to be symmetric. If the
mean purchase is $23.14, what would the median purchase be?
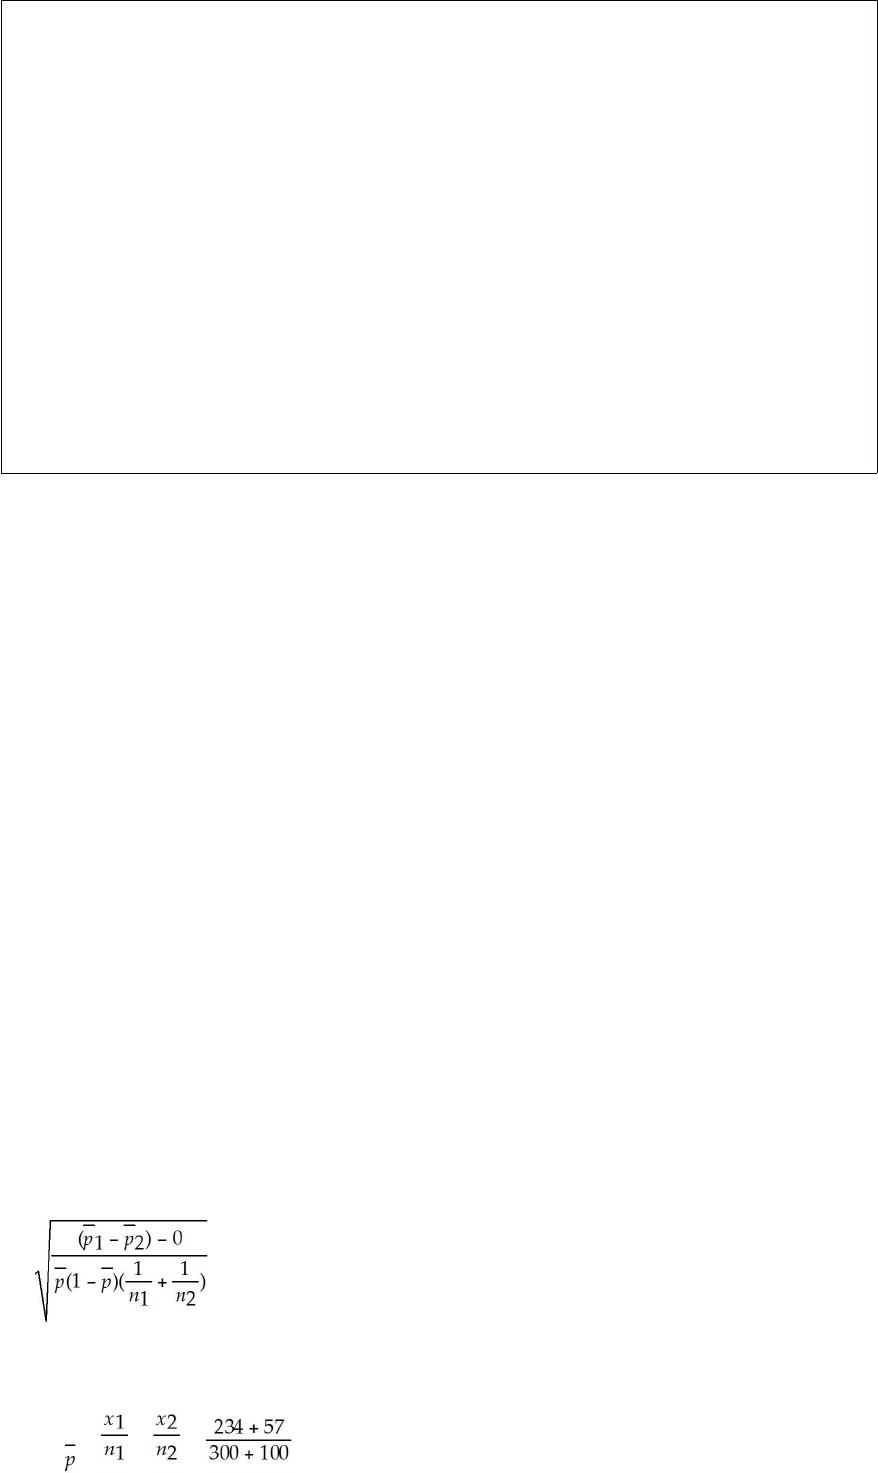
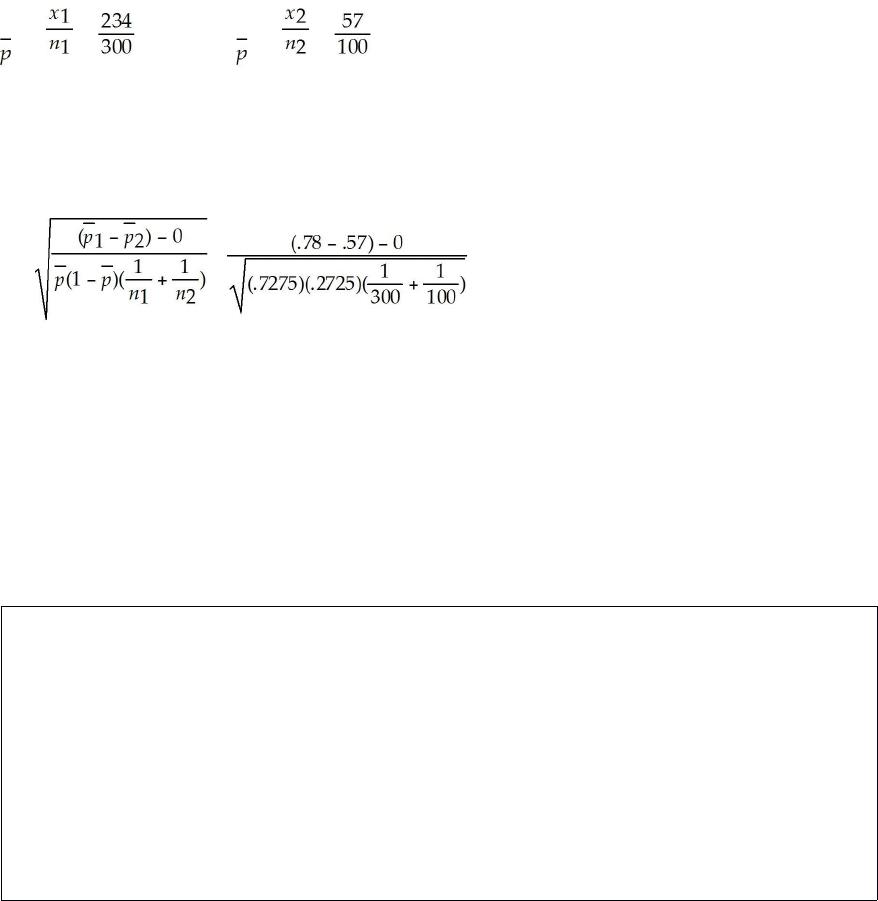
The National Football League (NFL) is interested in testing to see whether there is a
difference in the proportion of male fans that prefer instant replay to review officials’
calls and the proportion of female fans that prefer instant replay. It is believed that
males tend to favor the practice to a higher degree than do females. To test this, random
samples of male fans and female fans were selected and the following results were
obtained:
Male Fans Female Fans
Sample size 300 100
Number Preferring 234 57
Using a significance level equal to 0.05, what conclusion should be reached based on
the sample data?
One of the factors that a company will use in determining whether it will locate a new
facility in a community is the status of the real estate market. The managers believe that
an important measure of the real estate market is the average length of time that homes
stay on the market before selling. They believe that if the mean time on the market is
less than 45 days, the real estate market is favorable. To test this in a particular area, a
random sample of n = 100 homes that sold during the past six months was selected. The
mean for this sample was 40 days. It is believed that the population standard deviation
is 15 days. If the test is conducted using a 0.05 level of significance, what conclusion
should be reached?
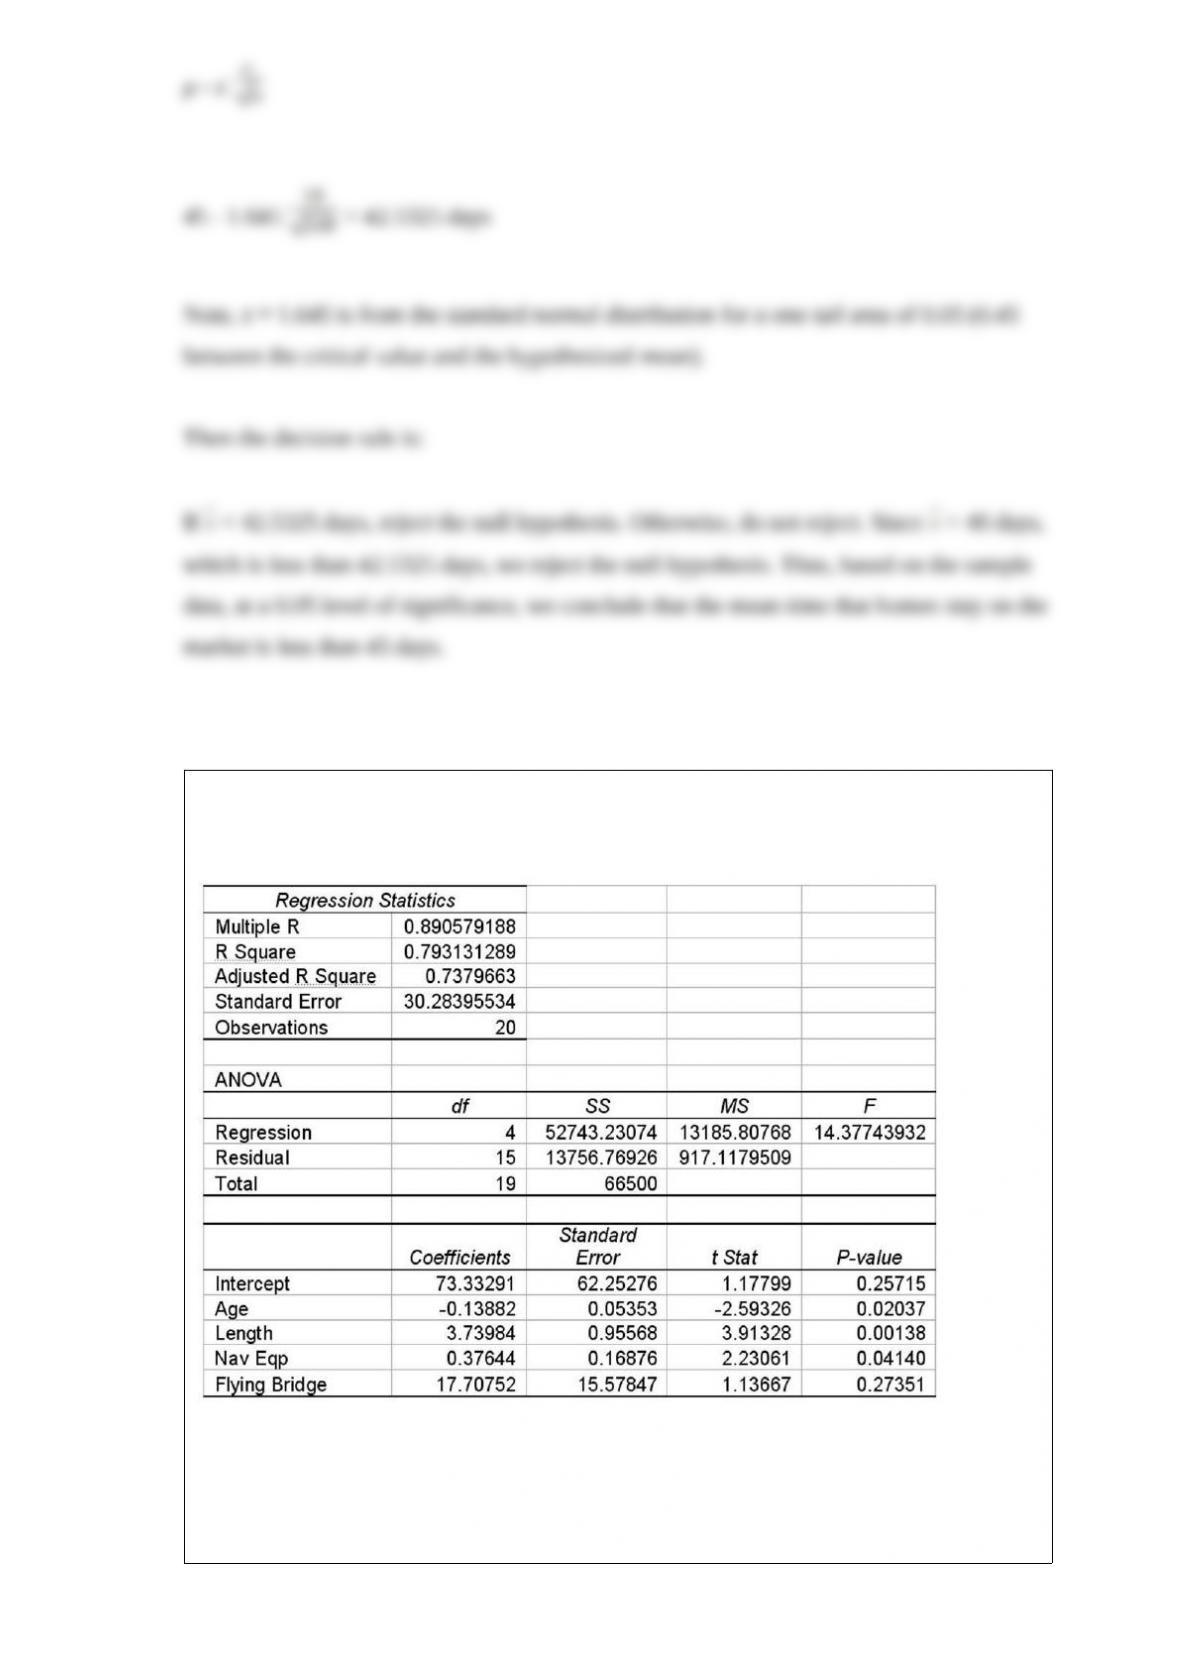
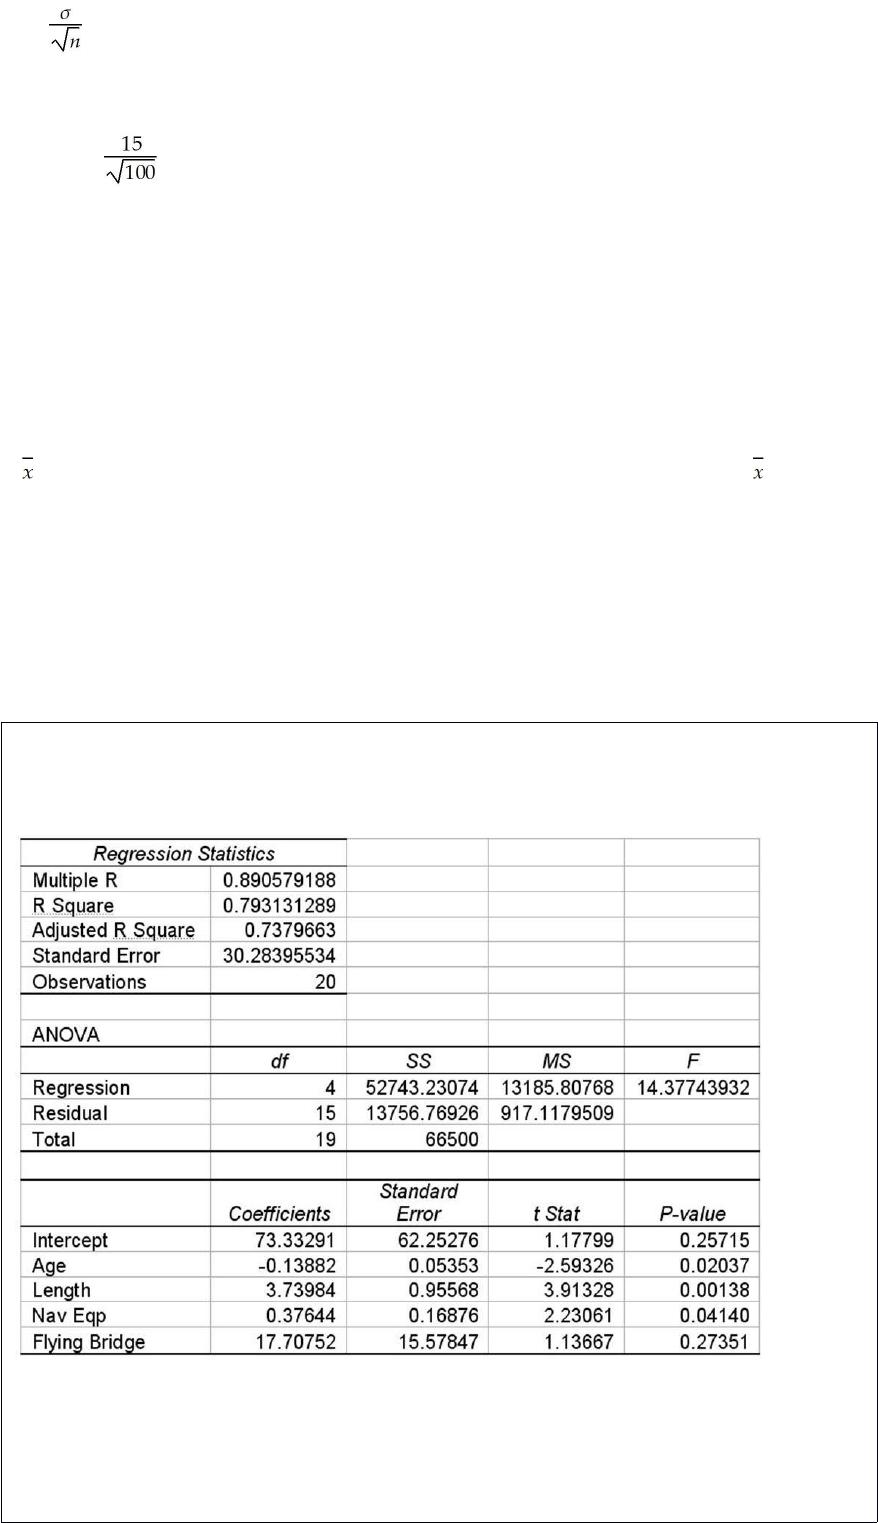
The following multiple regression was conducted to attempt to predict the price of
yachts based on the independent variables shown.
Given this information and your knowledge of multiple regression, determine which, if
any, of the four independent variables are statistically significant in explaining the
variation in the dependent variable. Use a 0.05 level of significance and use the p-value
method.

Assume you are conducting a two-way ANOVA and have found a significant interaction
between the two factors. Explain what conclusions you can make from the results and
what if any further steps should be taken.
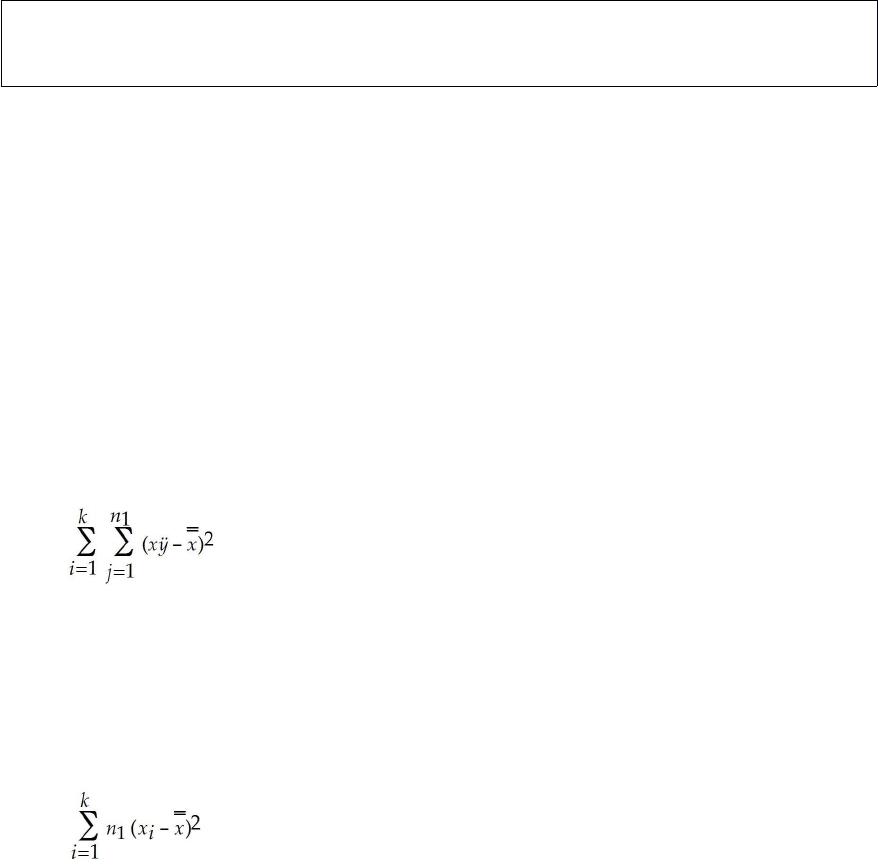
Explain what is meant by partitioning the sum of squares in a one-way analysis of
variance application.

Explain why it is possible for two managers to assess different values for the probability
that a supplier will fail to deliver a shipment on time.
A contract with a parts supplier calls for no more than .04 defects in the large shipment
of parts. To test whether the shipment meets the contract, the receiving company has
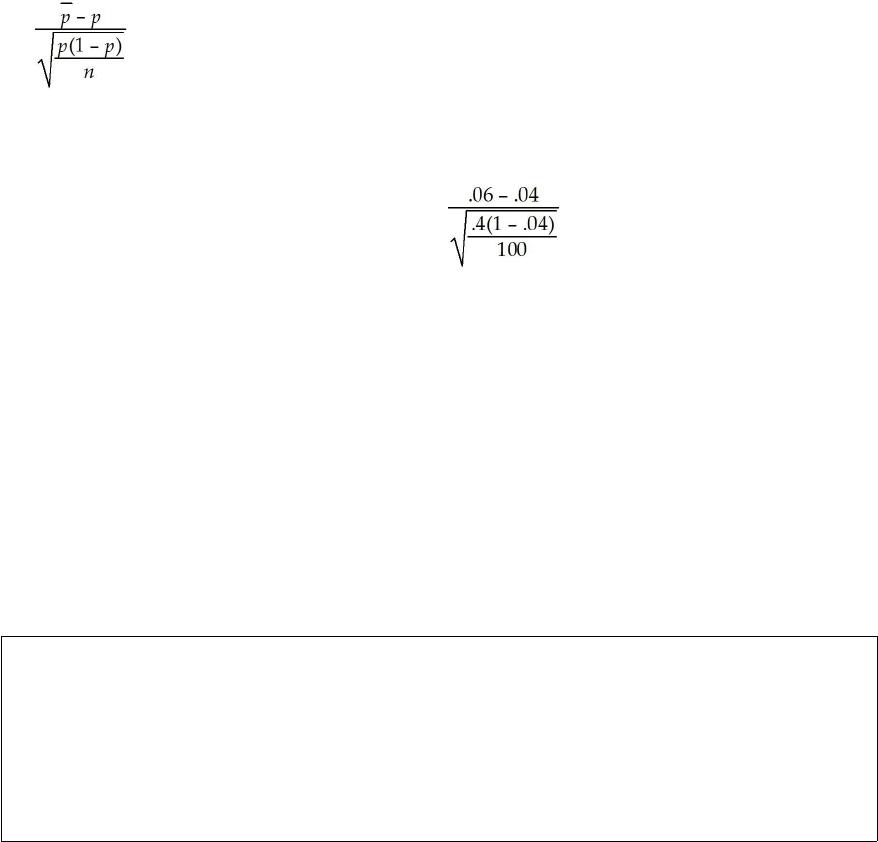
selected a random sample of n = 100 parts and found 6 defects. If the hypothesis test is
to be conducted using a significance level equal to 0.05, what is the test statistic and
what conclusion should the company reach based on the sample data?
A company makes a device that can be fitted to automobile engines to improve the
mileage. The company claims that if the device is installed, owners will observe a mean
increase of more than 3.0 mpg. Assuming that the population standard deviation of
increase is known to be 0.75 mpg, and a sample of size 64 cars is selected, what is the
probability of “accepting” the null hypothesis if the true population mean is 3.10 mpg
increase? Assume that the test will be performed using a 0.05 level of significance.