
If the number of surface nonconformities on a specific size of a metal piece is the
discrete random variable in question, then the appropriate probability distribution that
can describe the probability of a specific size metal sheet containing 3 nonconformities
is most likely given by the binomial distribution.
If p = .8 and n = 50, then we can conclude that the sampling distribution of is
approximately a normal distribution.
The quantity √[(N − n)/N] in the confidence intervals for μ and τ is called the finite
population correction and is always less than 1.
A cause-and-effect diagram enumerates the potential causes of an undesirable effect on

the process to discover sources of process variation and to identify opportunities for
process improvement.
When testing the difference between two proportions selected from populations with
large independent samples, the z test statistic is used.
Mutually exclusive events have a nonempty intersection.
The odds of an event occurring is the probability that the event will not occur divided
by the probability that the event will occur.

Data warehousing is defined as a process of centralized data management and retrieval.
In forming a confidence interval for μ1 − μ2, only two assumptions are required:
independent samples and sample sizes of at least 30.
If a company is using an chart for a given process with measurement data, it is
generally not important or necessary to use an R chart or s chart.

A subjective probability is a probability assessment that is based on experience,
intuitive judgment, or expertise.
By taking a systematic sample in which we select every 100th shopper arriving at a
specific store, we are approximating a random sample of shoppers.
In performing a chi-square goodness-of-fit test with multinomial probabilities, the
smaller the difference between observed and expected frequencies, the higher the
probability of concluding that the probabilities specified in the null hypothesis are
correct.

Removing the seasonal effect by dividing the actual time series observation by the
estimated seasonal factor associated with the time series observation is called
deseasonalization.
If the limits of the confidence interval of the difference between the means of two
normally distributed populations were 8.5 and 11.5 at the 95 percent confidence level,
then we can conclude that we are 95 percent certain that there is a significant difference
between the two population means.
Bayes’ Theorem is always based on two states of nature and three experimental
outcomes.

The mode is the measurement in a sample or population that occurs most frequently.
The Wilcoxon signed ranks test is a nonparametric test.
Dfbetas and Dffits are statistics used to determine an outlier.

A treemap graphic is a series of clustered rectangles.
We are testing H0: ≤ 42; versus HA: > 42. When = 45, s =1.2, and n = 15, at α = .01 we
do not reject the null hypothesis. (Assume that the population from which the sample is
selected is normally distributed.)
We are testing H0: μ = 32; versus HA: μ > 32. If = 36, s = 1.6, and n = 30, at α = .05,
we should reject H0.
The Central Limit Theorem states that as sample size increases, the population
distribution more closely approximates a normal distribution.
In a Pareto chart, the bar for the “Other” category should be placed to the far left of the
chart.

Maximin is a criterion used when making decisions under certainty.
In testing the difference between the means of two normally distributed populations
using independent random samples, we can only use a two-sided test.
When the F test is used to test the overall significance of a multiple regression model, if
the null hypothesis is rejected, it can be concluded that all of the independent variables
x1, x2, . . . ,xk are significantly related to the dependent variable y.

The F statistic can assume either a positive or a negative value.
Everything else being constant, increasing the sample size decreases the probability of
committing a Type II error.
The ending value of an initial investment can be calculated using weighted means.
A Type II error is failing to reject a false null hypothesis.
Sparklines always need to be displayed with either their axes or coordinates.
In a contingency table, when all the expected frequencies equal the observed
frequencies, the calculated χ2 statistic equals zero.

When the sample size and sample standard deviation remain the same, a 99 percent
confidence interval for a population mean, μ, will be narrower than the 95 percent
confidence interval for μ.
The standard deviation of a standard normal distribution is always equal to 1.
The simple linear regression (least squares method) minimizes
A. the explained variation.
B. SSyy.
C. total variation.
D. SSxx.
E. SSE.

A continuous probability distribution having a rectangular shape, where the probability
is evenly distributed over an interval of numbers is a(n) ____________ distribution.
A. exponential
B. binomial
C. normal
D. uniform
For a binomial process, the probability of success is 40 percent and the number of trials
is 5. Find the expected value.
A. 5.0
B. 1.2
C. 2.0
D. 1.1

The _____________ criterion is best used when a large number of similar decisions
will be made.
A. expected monetary value
B. expected value of perfect information
C. expected value of sample information
D. expected net gain of sampling
A CFO is looking at what percentage of a company’s resources are spent on computing.
He samples companies in the pharmaceutical industry and develops the following
stem-and-leaf graph.
If you were creating a frequency histogram using these data, how many classes would
you create?
A. 4
B. 5
C. 6
D. 7
E. 8

In a completely randomized ANOVA, with other things equal, as the sample means get
closer to each other, the probability of rejecting the null hypothesis
A. decreases.
B. increases.
C. is unaffected.
The weight of a product is measured in pounds. A sample of 50 units is taken from a
recent production. The sample yielded = 75 lb, and we know that σ2 = 100 lb.
Calculate a 95 percent confidence interval for μ.
A. [71.25, 78.75]
B. [72.23, 77.77]
C. [47.28, 102.72]
D. [72.67, 77.33]
is defined as

A. total variation/explained variation.
B. explained variation/total variation.
C. unexplained variation/explained variation.
D. unexplained variation/total variation.
In a statistics class, the following 10 scores were randomly selected: 74, 73, 77, 77, 71,
68, 65, 77, 67, 66.
What is the mode?
A. 71.5
B. 72.0
C. 77.0
D. 71.0
E. 73.0
A _____ is a list of all the units in a population.
A. sample
B. frame
C. census

D. variable
Assume that the following data set is not normally distributed.
(21, 18, 4, 9, 14, 16, 17, 12, 15, 8, 7, 5)
If Ha: Md ≠ 7, then the p value is
A. .0161.
B. .0029.
C. .1458.
D. .0729.
E. .0537.
A research study investigated differences between male and female students. Based on
the study results, we can assume the population mean and standard deviation for the
GPA of male students are = 3.5 and σ = 0.5. Suppose a random sample of 100 male
students is selected and the GPA for each student is calculated. What is the probability
that the random sample of 100 male students has a mean GPA greater than 3.42?

A. .0548
B. .4364
C. .9452
D. .5636
According to a hospital administrator, historical records over the past 10 years have
shown that 20 percent of the major surgery patients are dissatisfied with after-surgery
care in the hospital. A scientific poll based on 400 hospital patients has just been
conducted. What is the probability that at least 70 patients will not be satisfied with the
after-surgery care?
A. 89.44%
B. 39.44%
C. 10.56%
D. 78.88%
E. 84.49%
A local airport keeps track of the percentage of flights arriving within 15 minutes of
their scheduled arrivals. The stem-and-leaf plot of the data for one year is below.

In developing a histogram of these data, how many classes would be used?
A. 4
B. 5
C. 6
D. 7
E. 8
A study conducted by a local university found that 25 percent of college freshmen
support increased spending on environmental issues. If 6 college freshmen are
randomly selected, find the probability that only 1 supports increased spending on
environmental issues.
A. .0330
B. .1318
C. .3560
D. .7844

A report on high school graduation stated that 85 percent of high school students
graduate. Suppose 3 high school students are randomly selected from different schools.
What is the probability that all graduate?
A. 0.85
B. 0.947
C. 0.614
D. 0.283
E. 0.003
Using the p-value rule, if a null hypothesis is rejected at a significance level of .01, it
will ____________ be rejected at a significance level of .05
A. always
B. sometimes
C. never

The χ2 statistic is used to test whether the assumption of normality is reasonable for a
given population distribution. The sample consists of 5,000 observations and is divided
into 6 categories (intervals). The degrees of freedom for the chi-square statistic are
A. 4,999.
B. 6.
C. 5.
D. 4.
E. 3.
Determine whether these two events are mutually exclusive: voter who favors gun
control and an unregistered voter.
A. mutually exclusive
B. not mutually exclusive
The variable of interest in an experiment is referred to as the __________ variable.
A. categorical
B. regression

C. response
D. factor
Find the z-score for an IQ test score of 118 when the mean is 100 and the standard
deviation is 15.
A. 1.2
B. 1.0
C. 18.0
D. −1.03
E. −1.2
Determine whether these two events are mutually exclusive: someone born in the
United States and a US citizen.
A. mutually exclusive
B. not mutually exclusive

A card is drawn from a standard deck. What is the probability the card is an ace, given
that it is a club?
A. 1/52
B. 1/13
C. 4/13
D. 1/4
If P(A|B) = .2 and P(B) = .8, determine the intersection of events A and B.
A. 0.20
B. 1.0
C. 0.25
D. 0.16
E. 0.60
The coffee and soup machine at the local subway station is supposed to fill cups with 6
ounces of soup. Ten cups of soup are bought with results of a mean of 5.93 ounces and
a standard deviation of 0.13 ounces. Construct a 99 percent confidence interval for the
true machine-fill amount.
A. [5.75, 5.99]
B. [5.85, 6.05]
C. [5.90, 6.00]
D. [5.70, 6.16]
E. [5.80, 6.06]
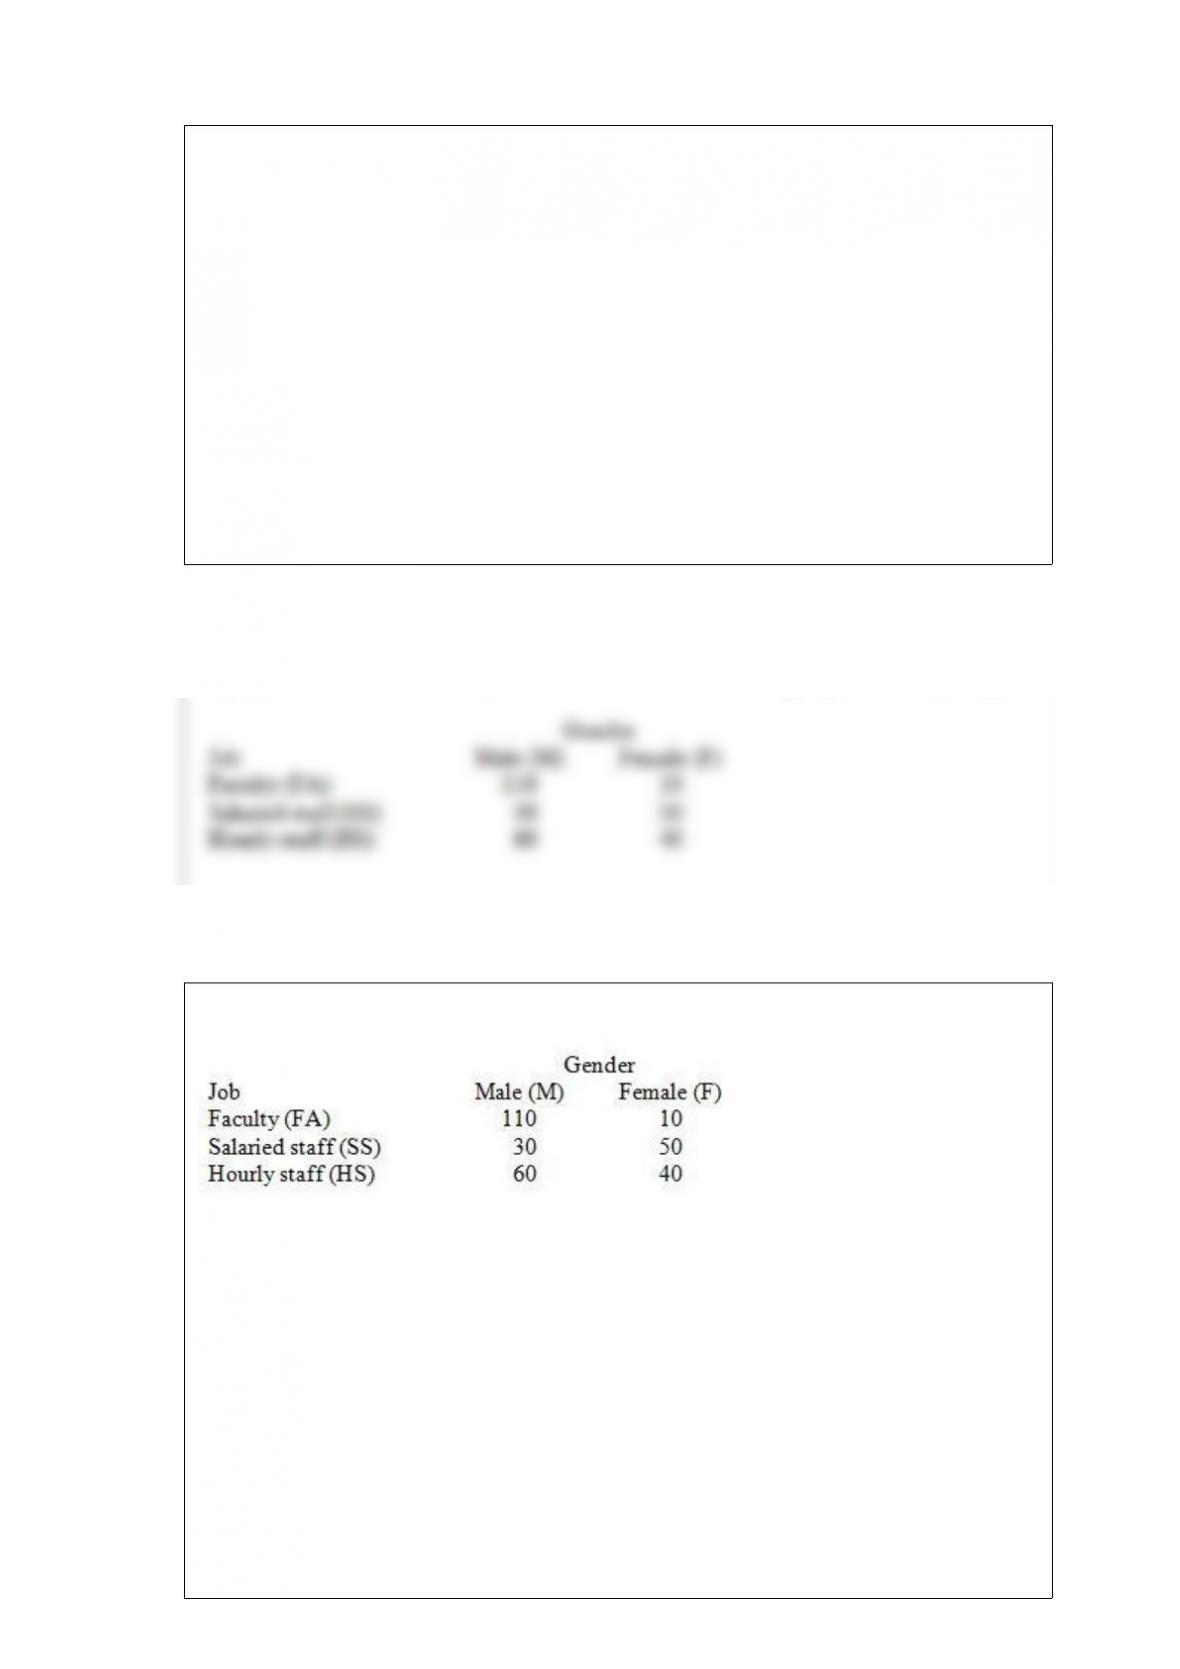
Employees of a local university have been classified according to gender and job type.
If an employee is selected at random, what is the probability that the employee is
female or works as a member of the faculty?
A. 0.73
B. 0.08
C. 0.33
D. 0.70
E. 0.05
The Post Office has established a record in a major midwestern city for delivering 90
percent of its local mail the next working day. When there are 8 local letters mailed,
what is the probability that the number delivered will be within 2 standard deviations of
the mean?
A. .9950
B. .9619
C. .8131
D. .9996
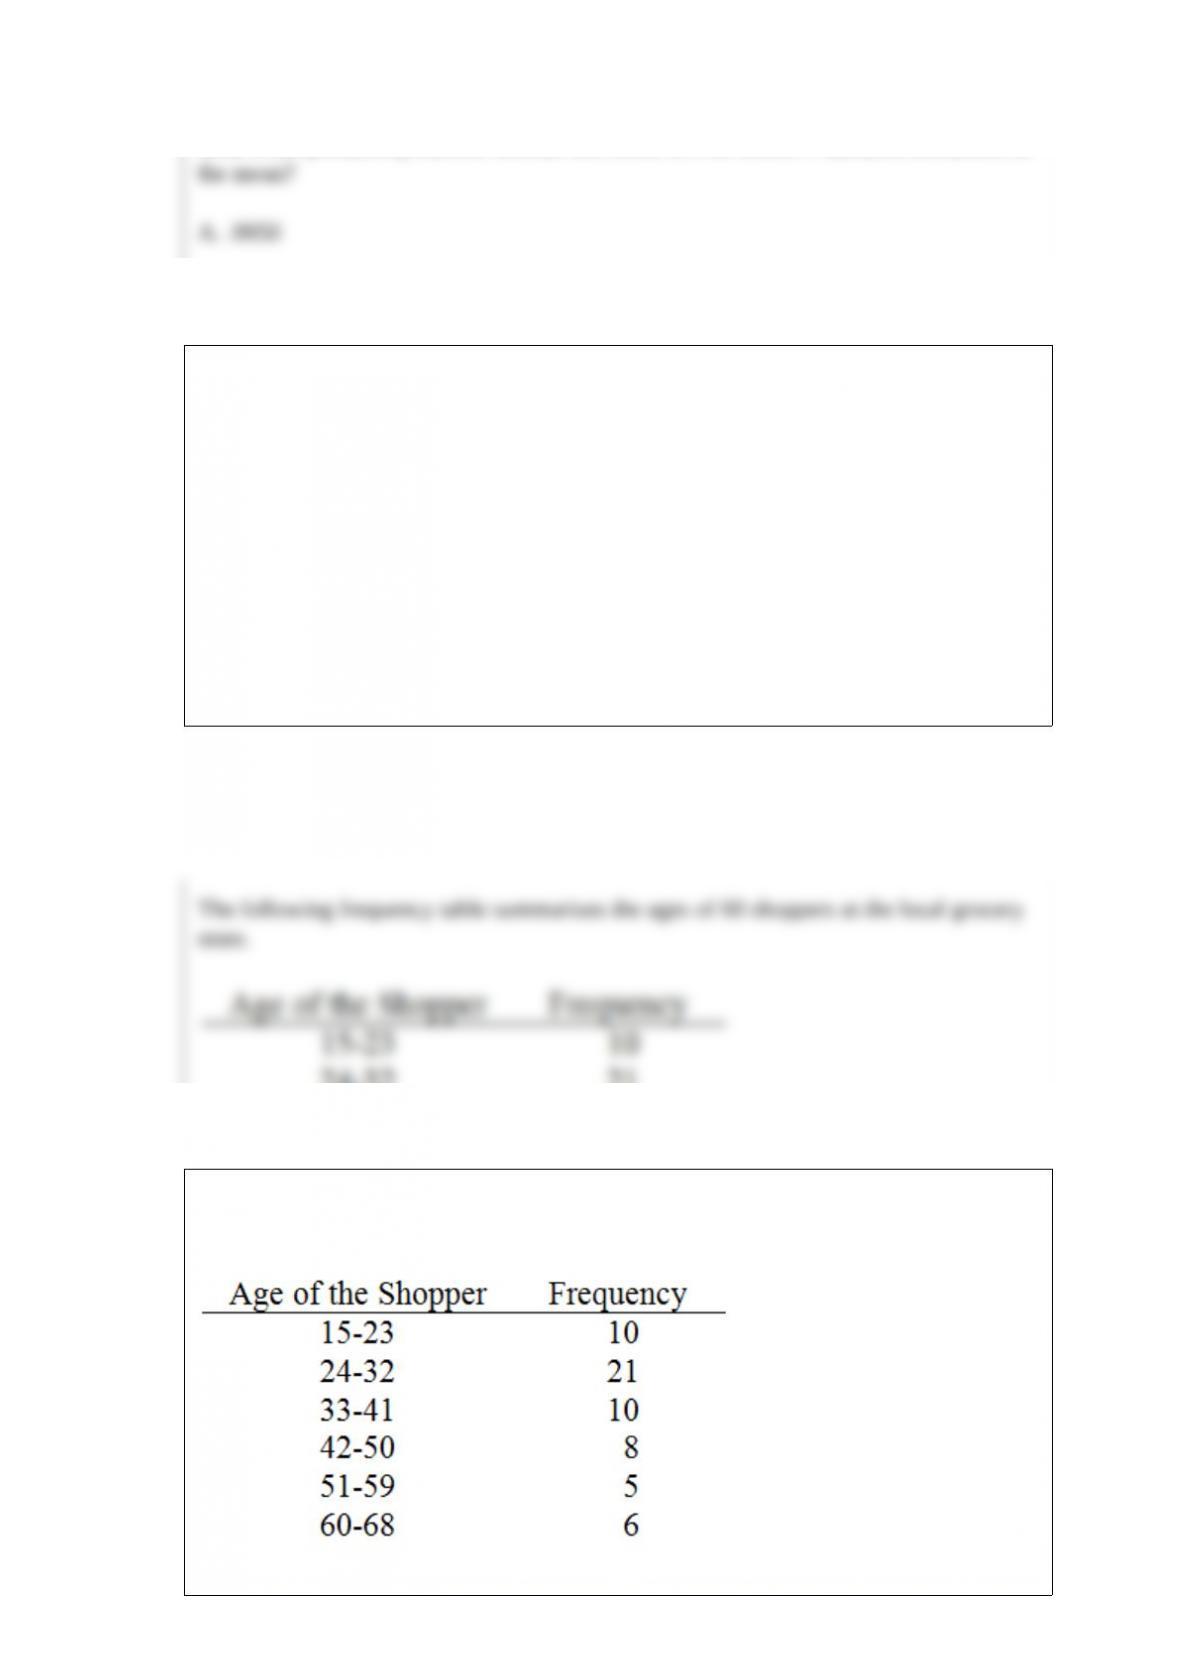
The following frequency table summarizes the ages of 60 shoppers at the local grocery
store.

The sample mean for the above frequency table is calculated as 36.25. Calculate the
approximate sample standard deviation for this data set.
A. 181.08
B. 184.15
C. 26.83
D. 13.46
E. 13.57
When using simple linear regression, we would like to use confidence intervals for the
___________ and prediction intervals for the ___________ at a given value of x.
A. Individual y-value, mean y-value
B. mean y-value, individual y-value
C. slope, mean slope
D. y-intercept, mean y-intercept
In a manufacturing process, a random sample of 9 manufactured bolts has a mean
length of 3 inches with a variance of .09. What is the 90 percent confidence interval for
the true mean length of the manufactured bolt?
A. 2.8355 to 3.1645

B. 2.5065 to 3.4935
C. 2.4420 to 3.5580
D. 2.8140 to 3.1860
E. 2.9442 to 3.0558
A survey is made in a neighborhood of 80 voters. 65 are Democrats and 15 are
Republicans. Of the Democrats, 35 are women, while 5 of the Republicans are women.
If one subject from the group is randomly selected, find the probability the individual is
a male Republican.
A. .125
B. .500
C. .333
D. .667
E. .188
In a major midwestern university, 55 percent of all undergraduates are female, 25

percent of all undergraduates belong to a Greek organization (fraternity or sorority), and
40 percent of all males belong to a Greek organization. What is the probability that one
randomly selected undergraduate will be either a female or belong to a Greek
organization?
A. .55
B. .73
C. .80
D. .07
E. .87
A psychologist is collecting data on the time it takes to learn a certain task. For 50
randomly selected adult subjects, the sample mean is 16.40 minutes and the sample
standard deviation is 4.00 minutes. Construct the 95 percent confidence interval for the
mean time required by all adults to learn the task.
A. [8.56, 24.24]
B. [15.47, 17.33]
C. [16.24, 16.56]
D. [15.26, 17.54]
E. [17.12, 48.48]

The population of lengths of aluminum-coated steel sheets is normally distributed with
a mean of 30.05 inches and a standard deviation of 0.2 inches. What is the probability
that a sheet selected at random from the population is between 29.75 and 30.5 inches
long?
A. .4332
B. .4878
C. .0546
D. .9210
For eight randomly selected states, the following table lists the per capita beer
consumption (in gallons) and the per capita wine consumption (in gallons).
Beer Wine
32.2 3.1
29.4 4.4
35.3 2.3
34.9 1.7
29.9 1.4
28.7 1.2
26.8 1.2
41.4 3.0
Calculate the rank correlation coefficient when beer consumption = x, and wine
consumption = y.
A. rs = .506

B. rs = .703
C. rs = .711
D. rs = .494
An auditing firm has developed a set of criteria for determining whether a particular
account (and its balance) is in error. Historically, at companies where the gross sales are
under $25 million, they know that of balances that were in error, 75 percent were
regarded as unusual. Assume Company A shows a history of only 10 percent of the
account balances being in error and it also shows that 25 percent of the account
balances were unusual. If in an audit, a particular account appears unusual, what is the
probability that it is in error for Company A?
Calculate the pooled variance where sample 1 has data: 16, 14, 19, 18, 19, 20, 15, 18,

17, 18; and sample 2 has data: 13, 19, 14, 17, 21, 14, 15, 10, 13, 15.
AAA Co. operates distribution centers in the Midwest. Three of their centers were
recently audited to determine if they are in compliance with company standard billing
procedures. According to the auditing firm, a billing had an equal probability of being
from each of the three centers. A random sample of the audited billings had the
following distribution.
Center 1: 385 billings
Center 2: 305 billings
Center 3: 210 billings
What is the critical value at α = .01 to test the null hypothesis (equal billings from each
center)?
Consider a set of 50 measurements with mean 50.2 and standard deviation 18.7 and
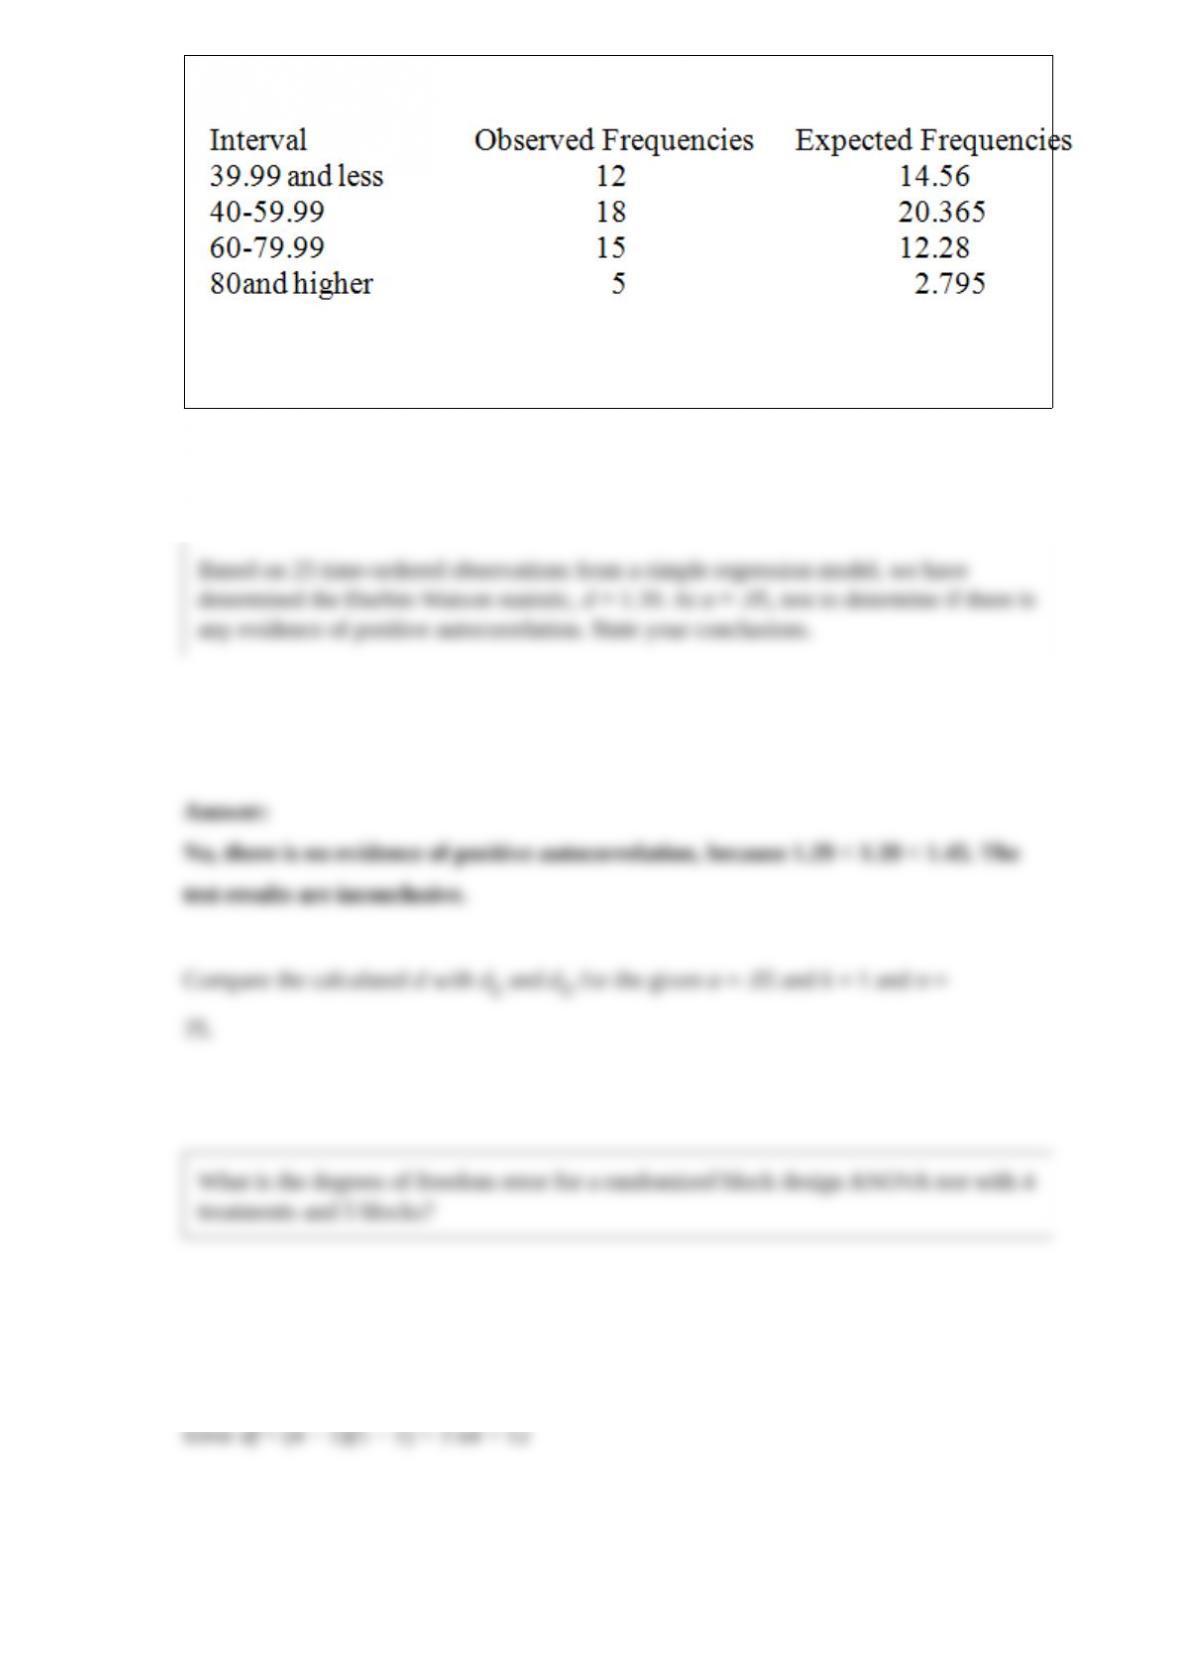
with the following observed and expected frequencies.
It is desired to test whether these measurements came from a normal population.
Calculate the value of the chi-square test statistic.
What is the degrees of freedom error for a randomized block design ANOVA test with 4
treatments and 5 blocks?
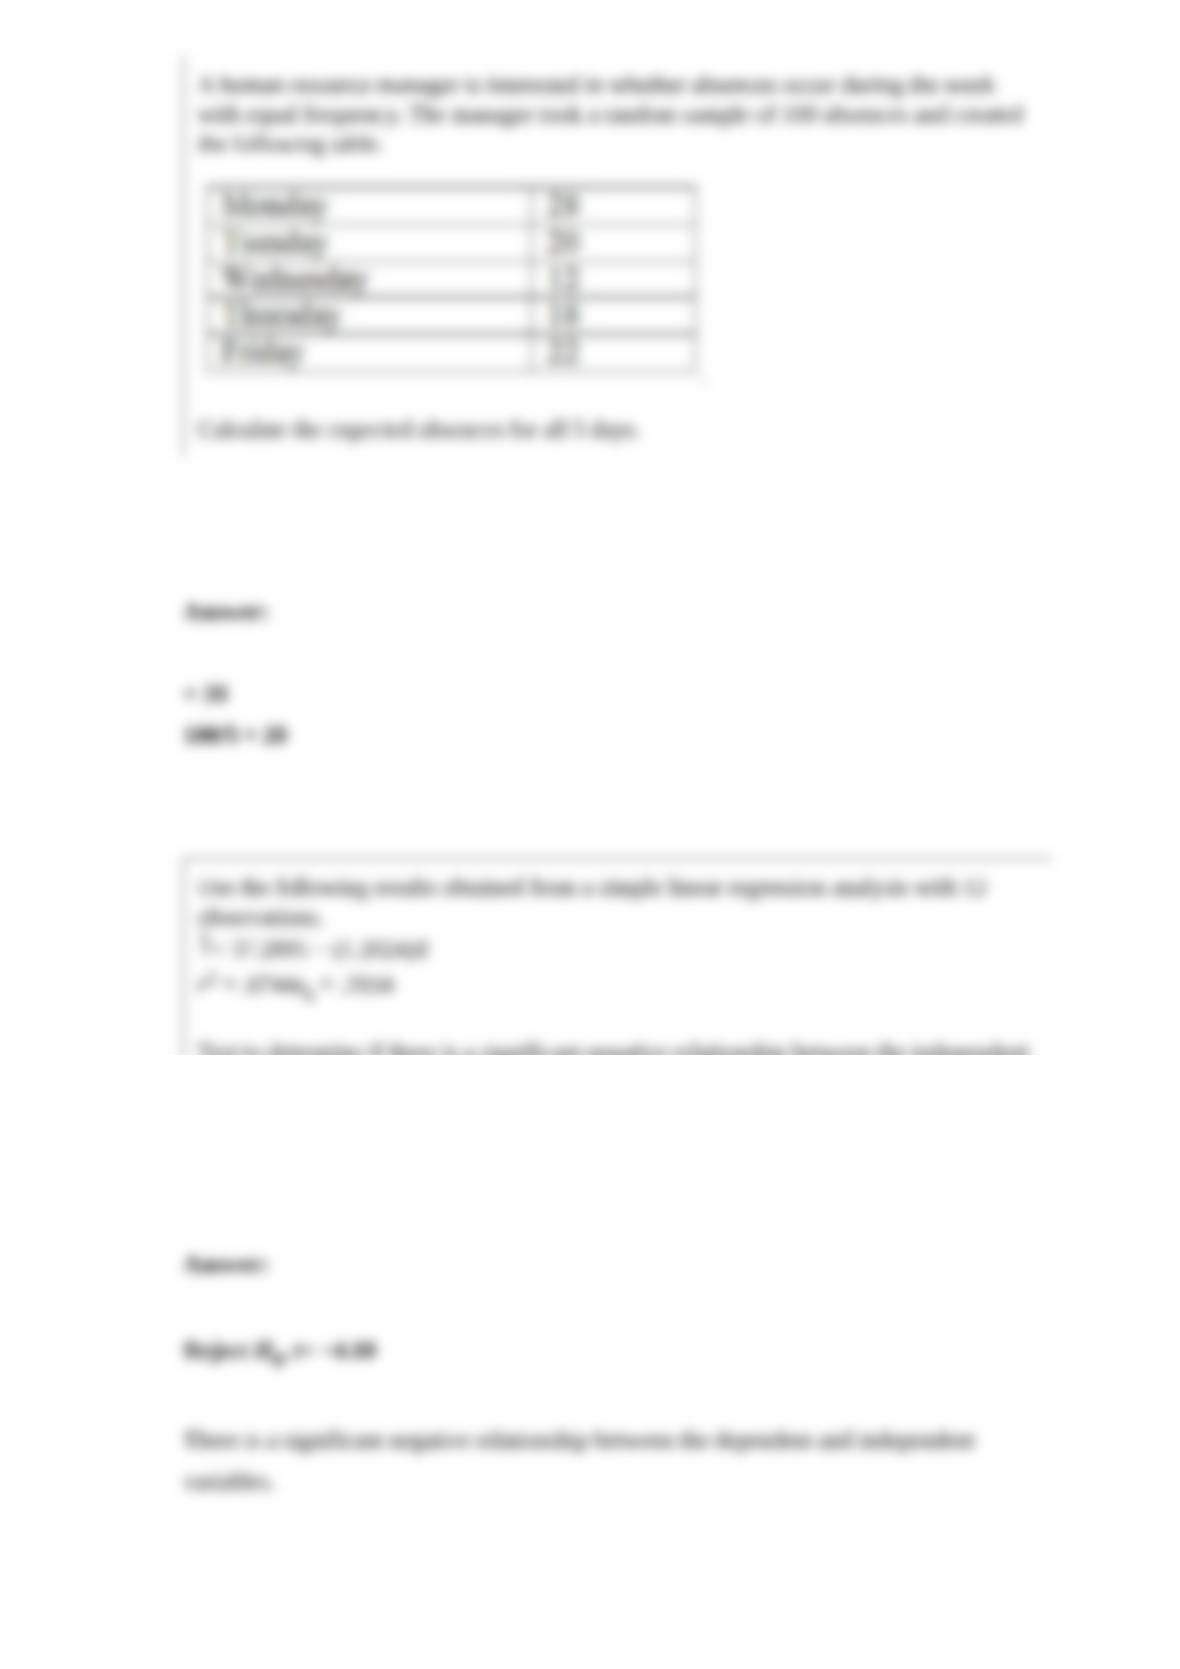
A human resource manager is interested in whether absences occur during the week
with equal frequency. The manager took a random sample of 100 absences and created
the following table.
Calculate the expected absences for all 5 days.
Use the following results obtained from a simple linear regression analysis with 12
observations.
= 37.2895 − (1.2024)X
r2 = .6744sb = .2934
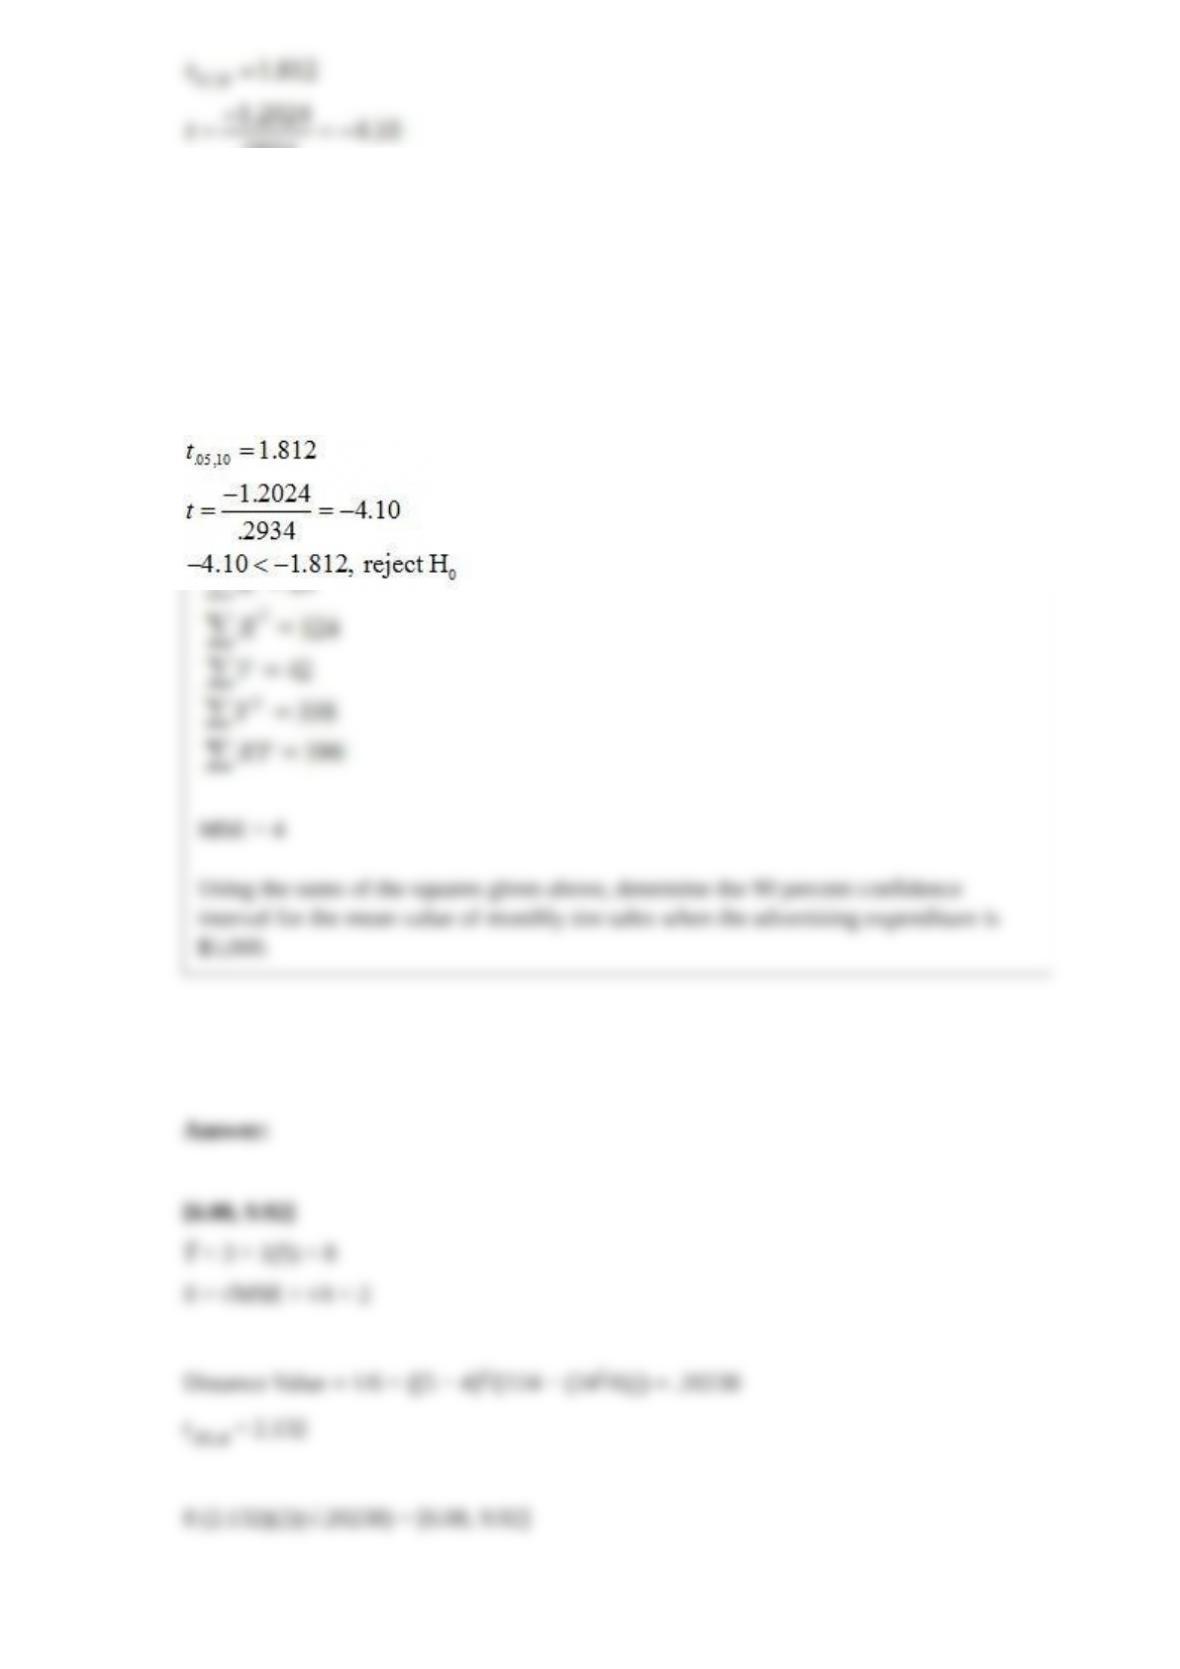
Test to determine if there is a significant negative relationship between the independent
and dependent variables at α = .05. Give the test statistic and the resulting conclusion.
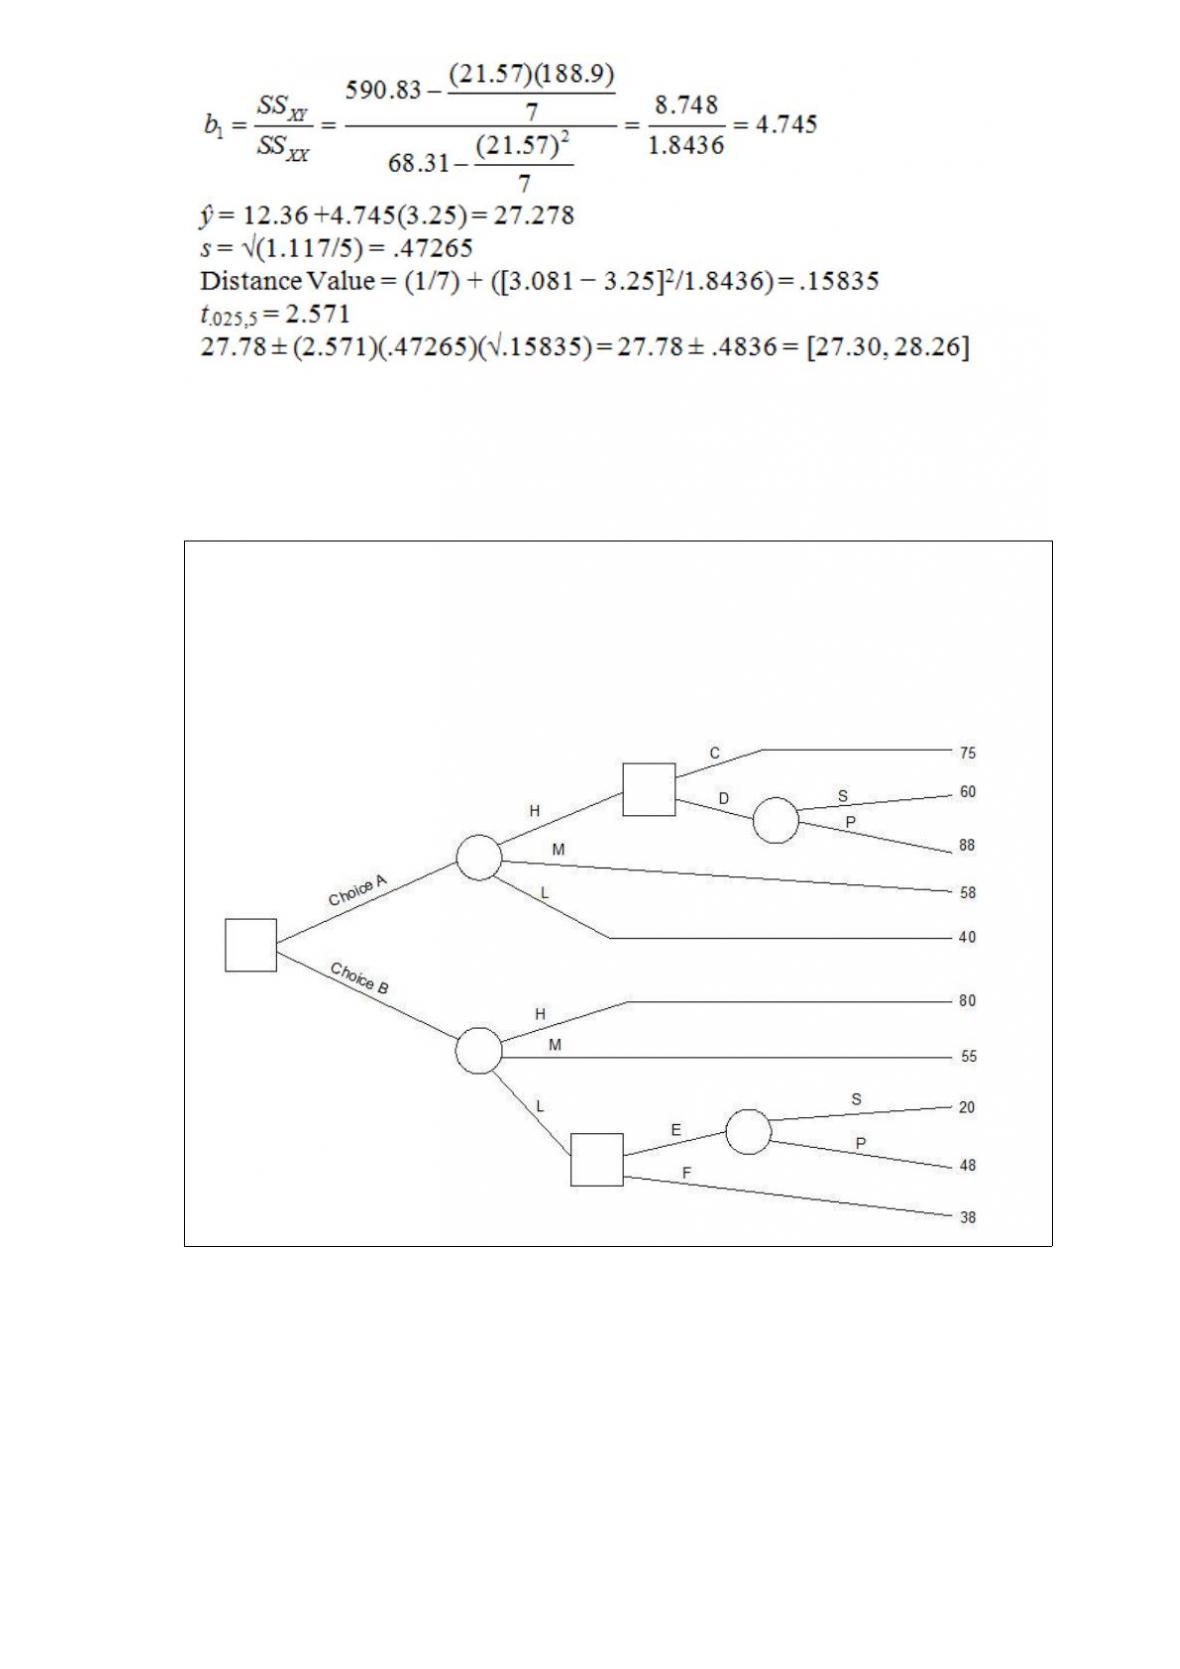
A local tire dealer wants to predict the number of tires sold each month. He believes
that the number of tires sold is a linear function of the amount of money invested in
advertising. He randomly selects 6 months of data consisting of tire sales (in thousands
of tires) and advertising expenditures (in thousands of dollars). Based on the data set
with 6 observations, the simple linear regression equation of the least squares line is ŷ =
3 + 1x.
MSE = 4
Using the sums of the squares given above, determine the 90 percent confidence
interval for the mean value of monthly tire sales when the advertising expenditure is
$5,000.
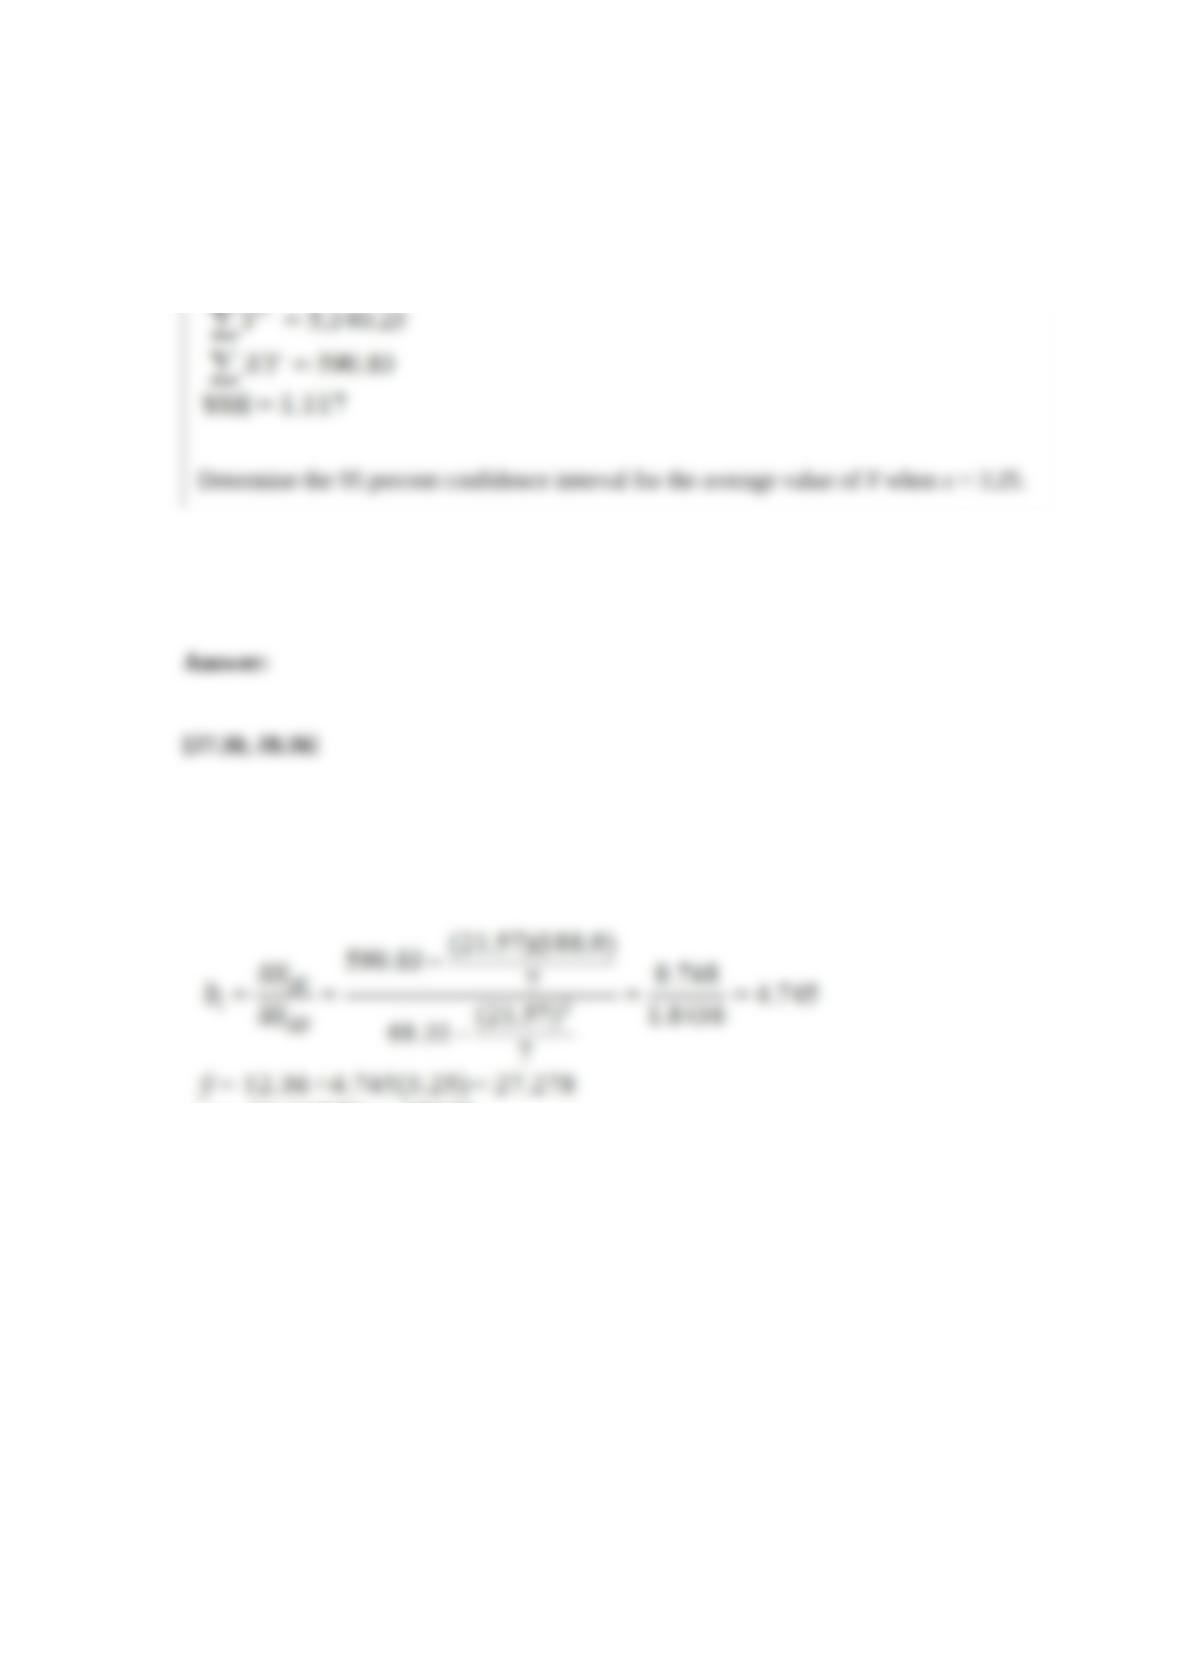
A data set with 7 observations yielded the following. Use the simple linear regression
model.
Determine the 95 percent confidence interval for the average value of Y when x = 3.25.
In a manufacturing facility producing fasteners, a foreman suspects that the diameter of
the bolts produced by his first-shift workers is greater than the diameter of the bolts
produced by his second-shift workers. He takes a sample of five bolts from the
first-shift and a sample of four bolts from the second-shift and measures the diameters
in inches. Below are the results from five first-shift and four second-shift observations.
The bolt diameter measurements are not normally distributed.

Bolt Diameter (inches)
1st shift 2nd shift
2.01 1.80
2.25 1.95
1.98 2.30
2.05 2.00
2.03
At α = .05, can we conclude that his suspicion is correct?
A. Reject the null hypothesis, the diameter is greater for 1st shift versus 2nd shift.
B. Do not reject the null hypothesis, there is no evidence that the diameters differ by
shift.