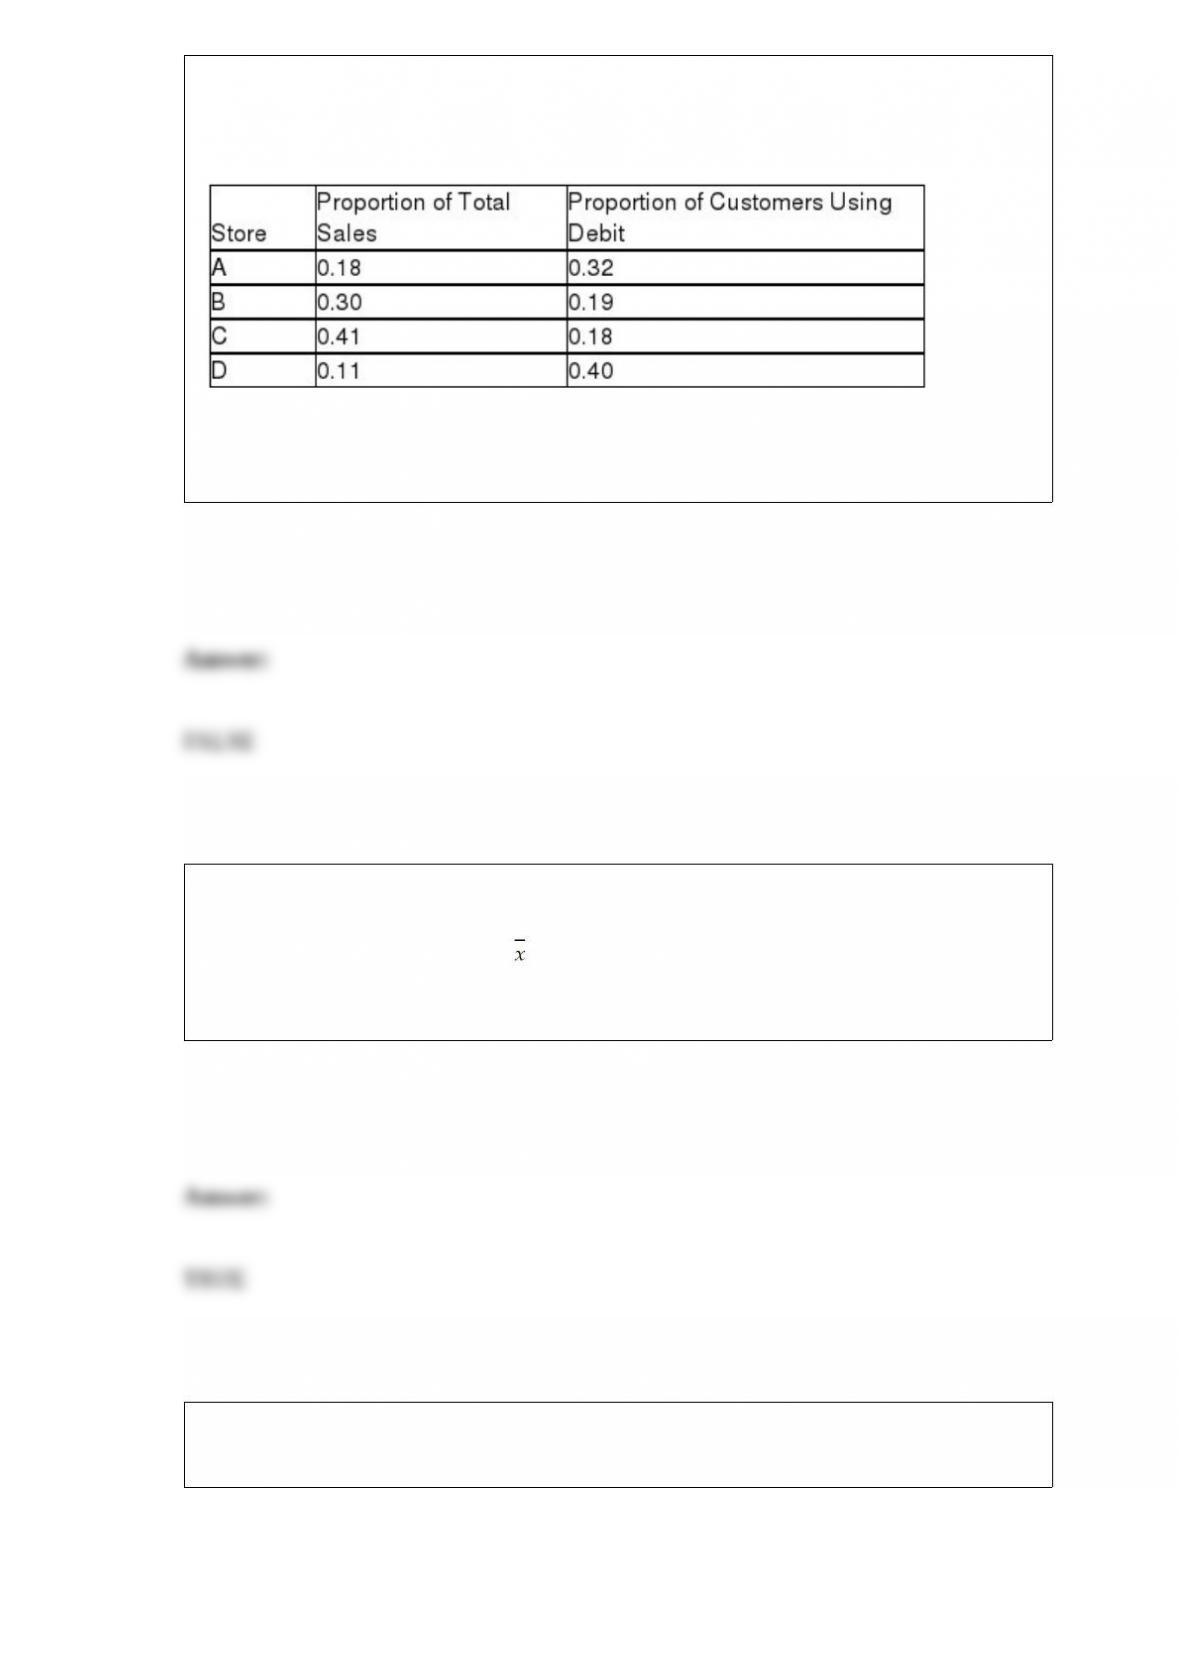
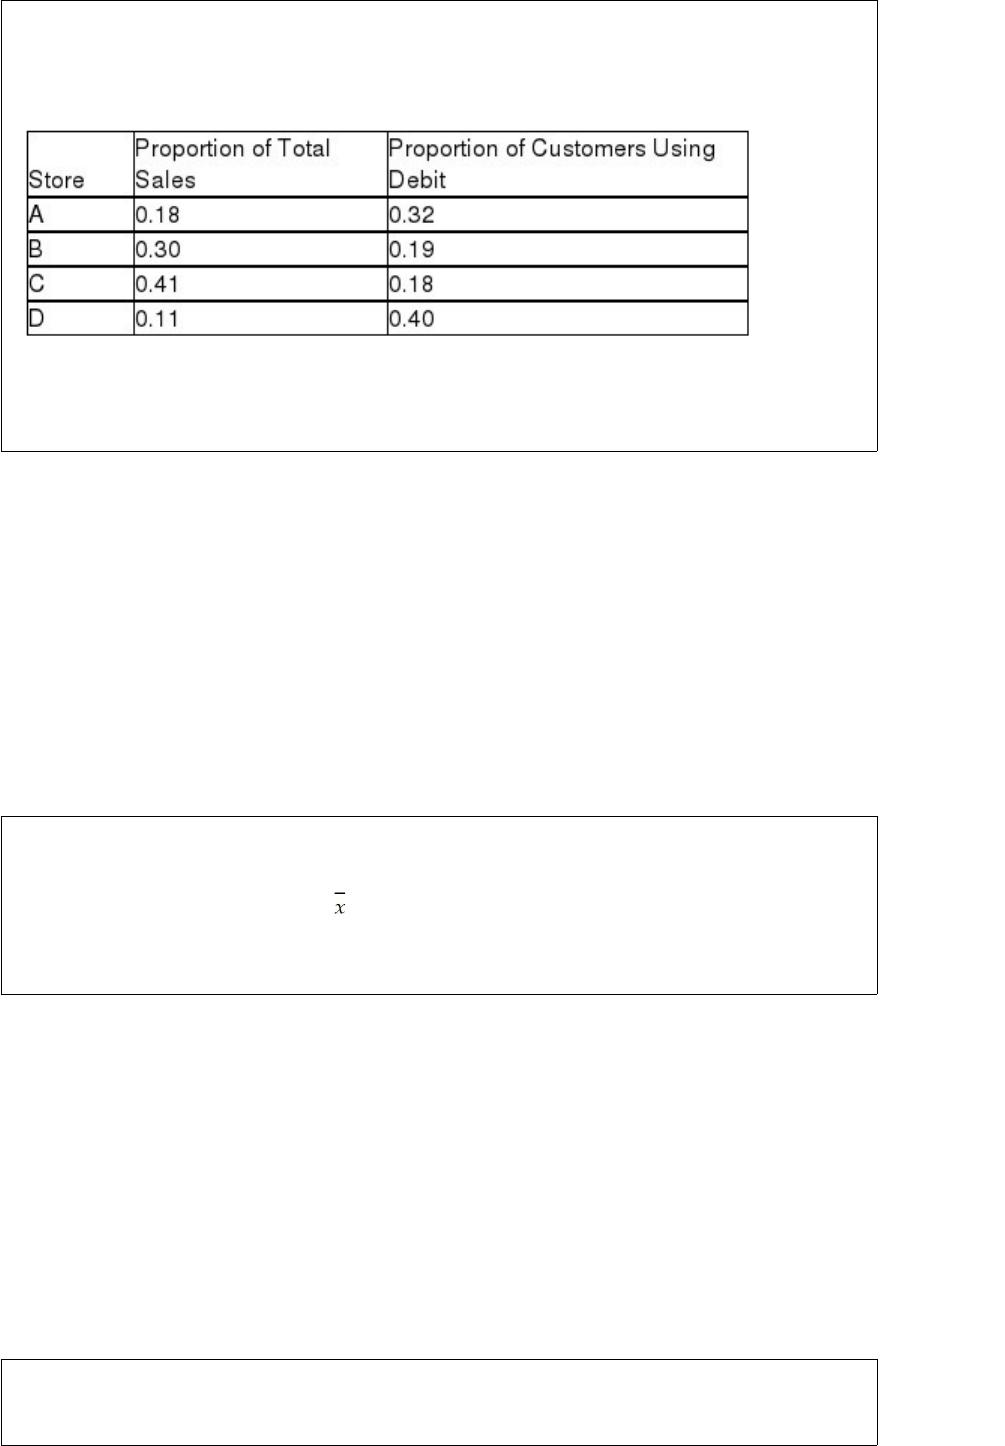
The Baker Oil and Gas Company has four retail locations, code-named A, B, C, and D.
The following table illustrates the percentage of total company sales at each store and
also the percentage of customers at that store who make purchases with debit cards:
Based on this information, the probability that a customer who used a debit card
shopped at store C is 0.0738.
The bottlers of a new fruit juice daily select a random sample of 12 bottles of the drink
to estimate the mean quantity of juice in the bottles filled that day. On one such day, the
following results were observed: = 12.03; s = 0.12. Based on this information, the
upper limit for a 95 percent confidence interval estimate is approximately 12.106
ounces.
Two football teams play in the Super Bowl. The event of team A winning and the event
of team B winning can be said to be mutually exclusive.
In a recent one-way ANOVA test, SSW was equal to 15,900 and the SSB was equal to
3,100. Therefore, SST is equal to 12,800.
When a variance is calculated for a data set, the resulting value is the same regardless of
whether the data set is treated as a population or a sample.
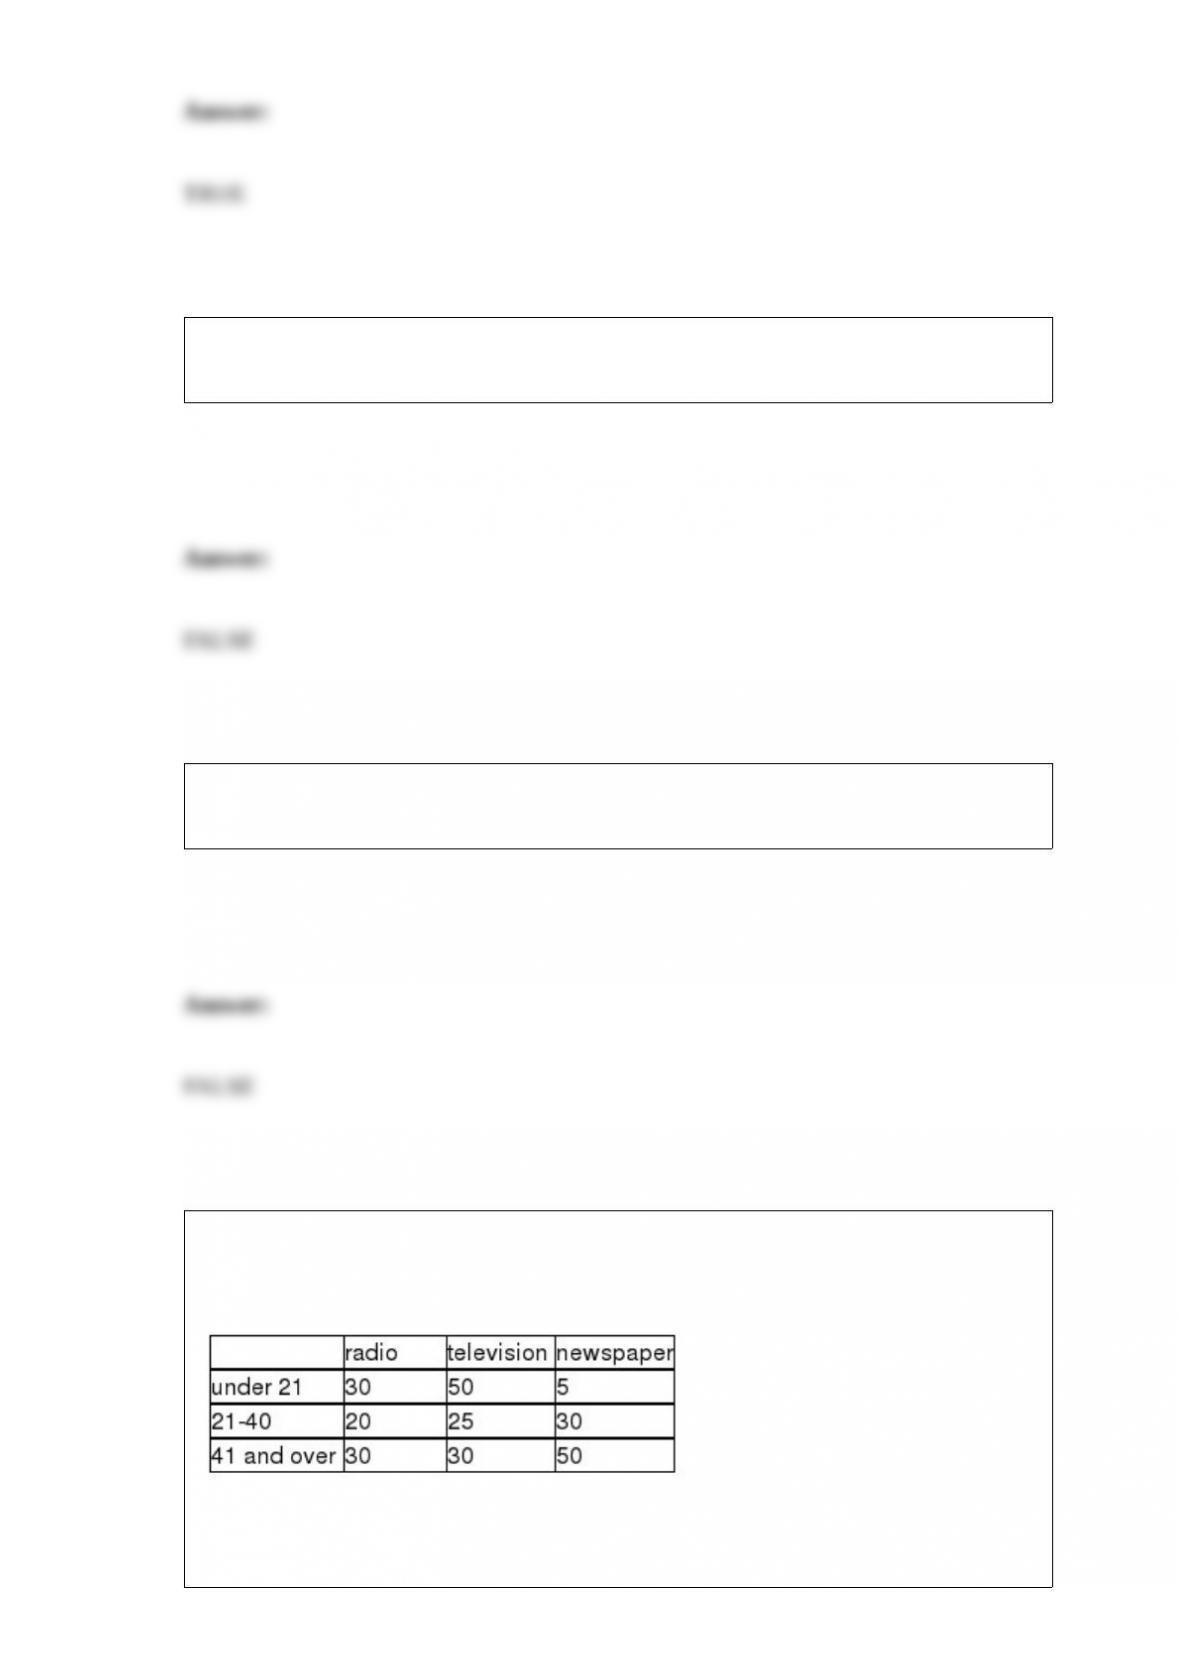
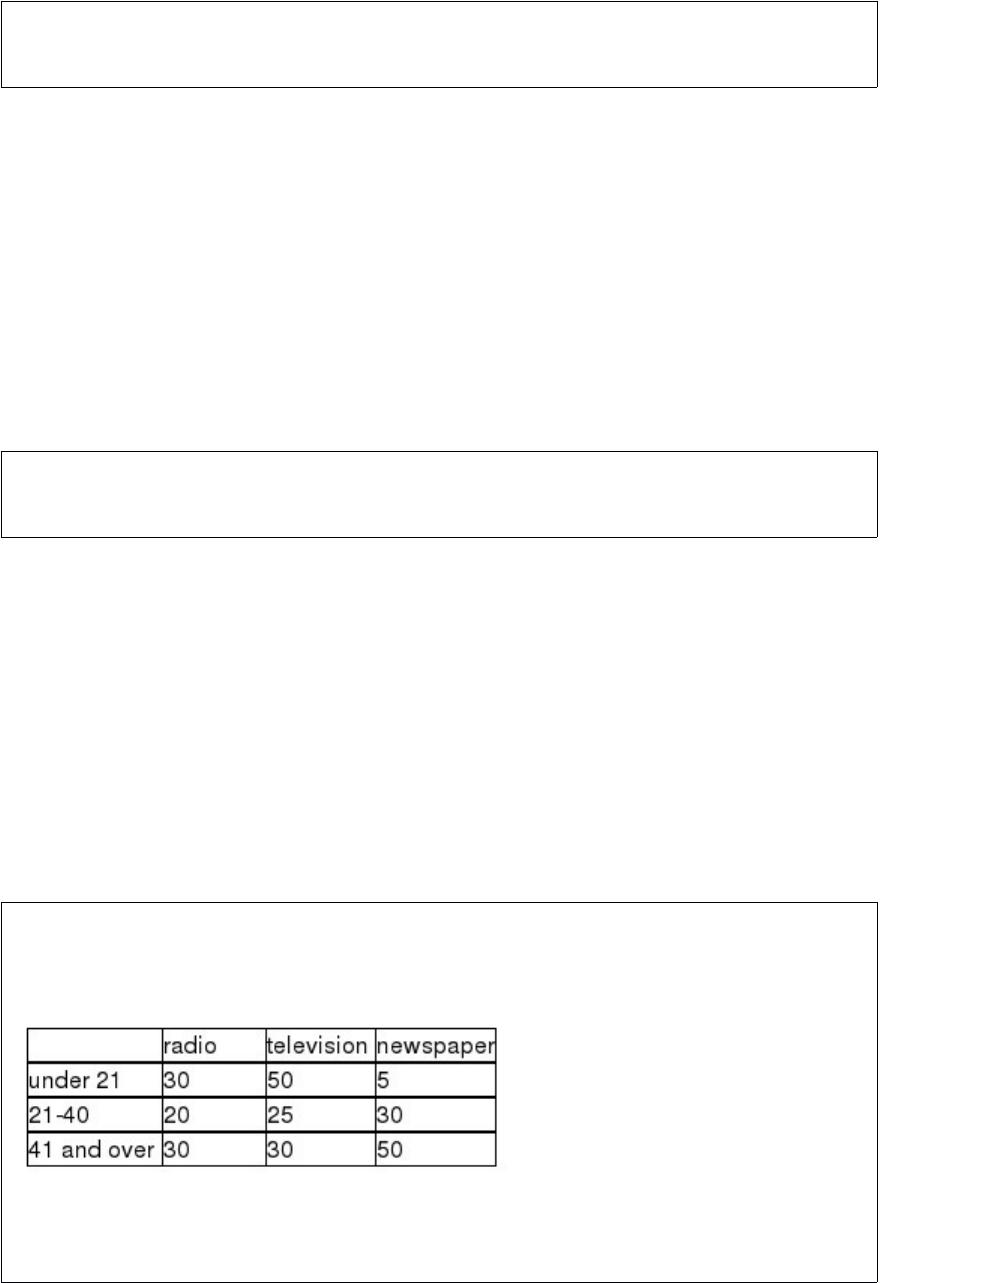
A study was recently conducted in which people were asked to indicate which news
medium was their preferred choice for national news. The following data were
observed:
Given this data, if we wish to test whether the preferred news source is independent of
age, for an alpha = .05 level, the critical value from the chi-square table is based on 8

degrees of freedom.
If a single die is rolled (a cube where the sides are numbered 1 through 6), the
probability of rolling at least a 3 is 0.33.
A sample proportion can be assumed normally distributed if n ≥ 30.
Given a sample correlation r = -0.5 and a sample size of n = 30, the test statistic for
testing whether the two variables are significantly correlated is approximately t =
-3.055.
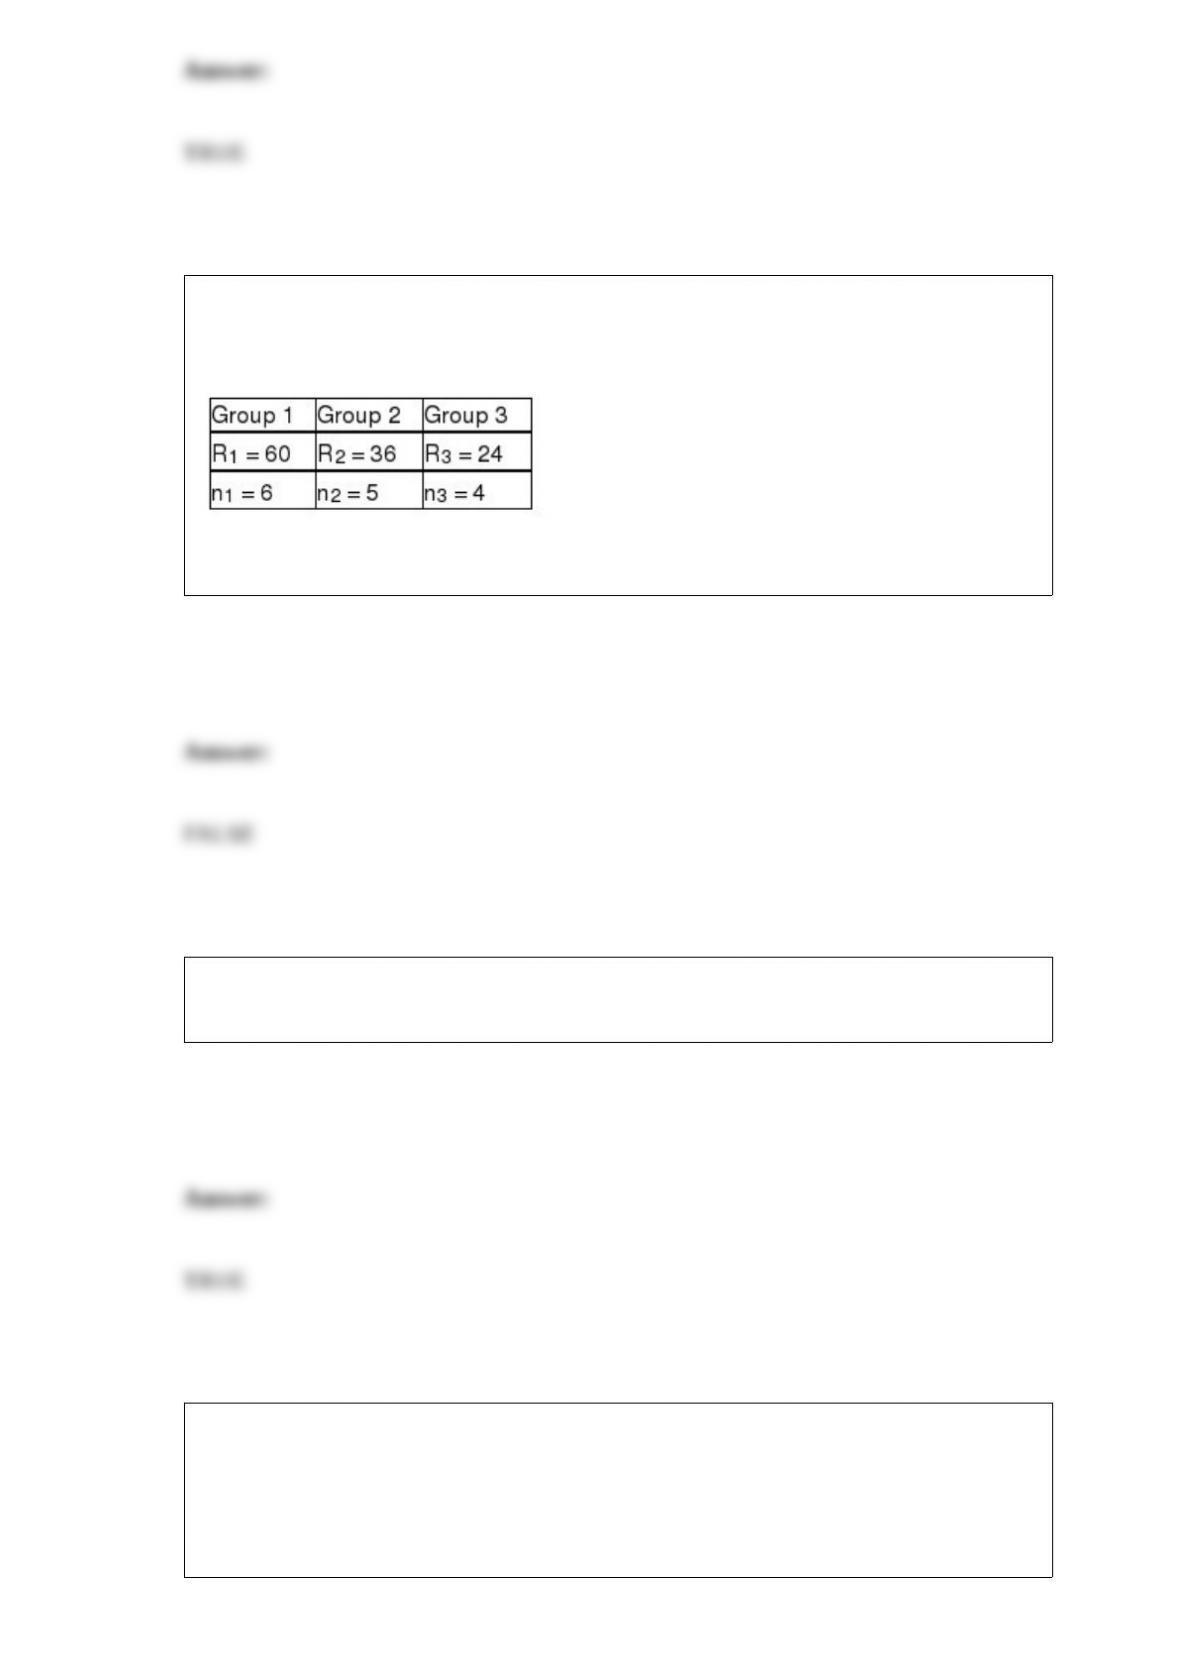
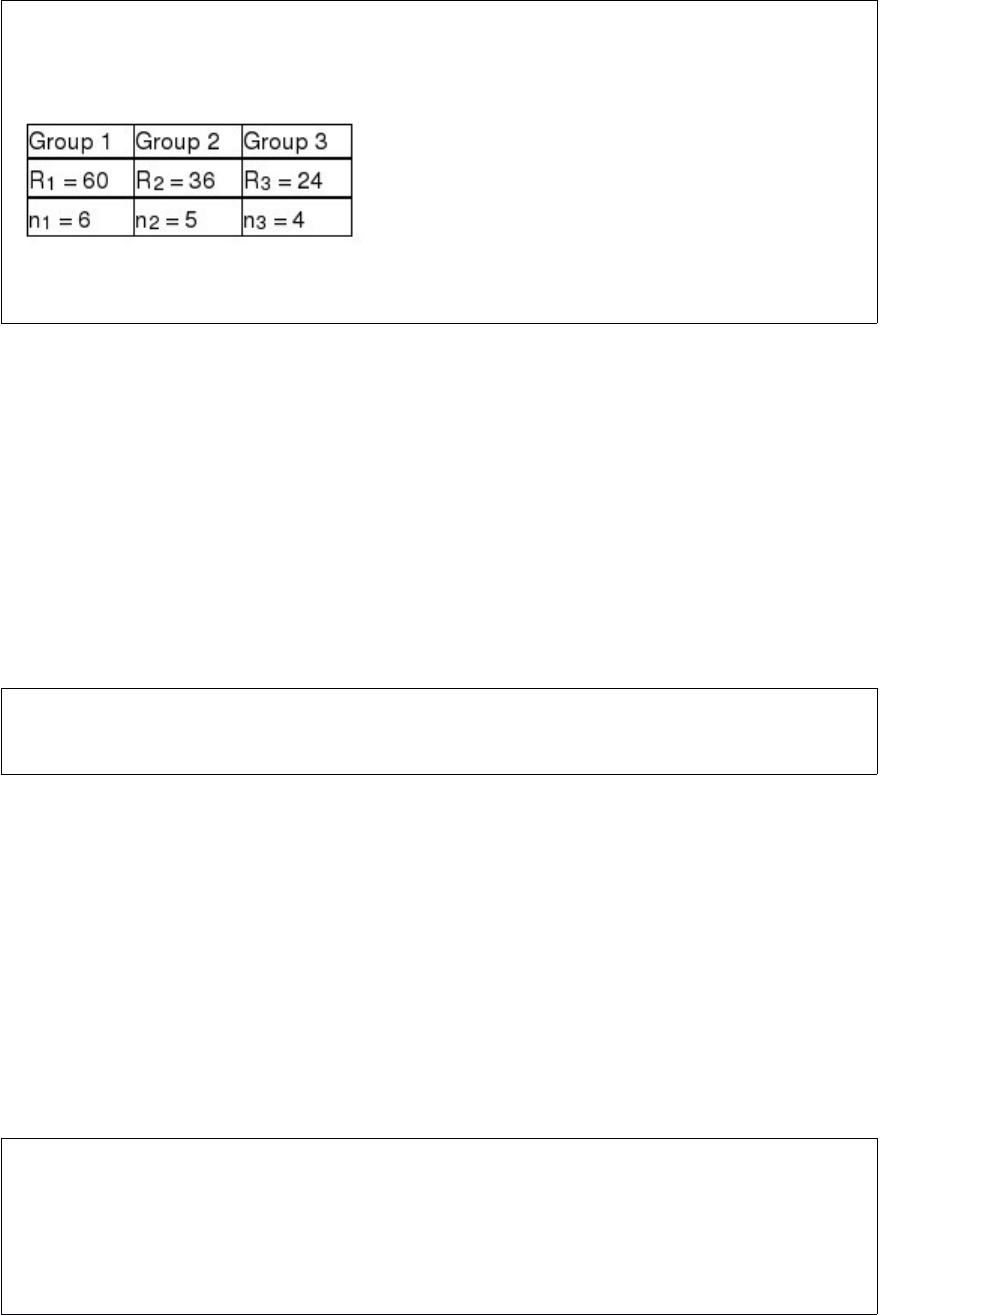
Assume that a Kruskal-Wallis test is being conducted to determine whether or not the
medians of three populations are equal. The sum of rankings and the sample size for
each group are below.
The value of the test statistic is H = 0.68
It is generally suggested that the sample size in developing a multiple regression model
should be at least four times the number of independent variables.
The national sales manager for a textbook publishing company wishes to estimate the
mean number of books sold per college. She wishes to have her estimate be within 30
copies and wants a 95 percent confidence interval estimate. If a pilot sample of 30
schools gave a sample standard deviation equal to 60 books, the required total sample
size is less than the pilot sample already taken.


An accountant who recently examined 200 accounts from a company’s total of 4,000
accounts in an effort to estimate the percentage of all accounts that have incorrect
journal entries is using descriptive statistical analysis to reach the conclusion.
Increasing the size of the samples in a study to estimate the difference between two
population means will increase the level of confidence that a decision maker can have
regarding the interval estimate.
Sampling error occurs when the population parameter and the sample statistic are
different.

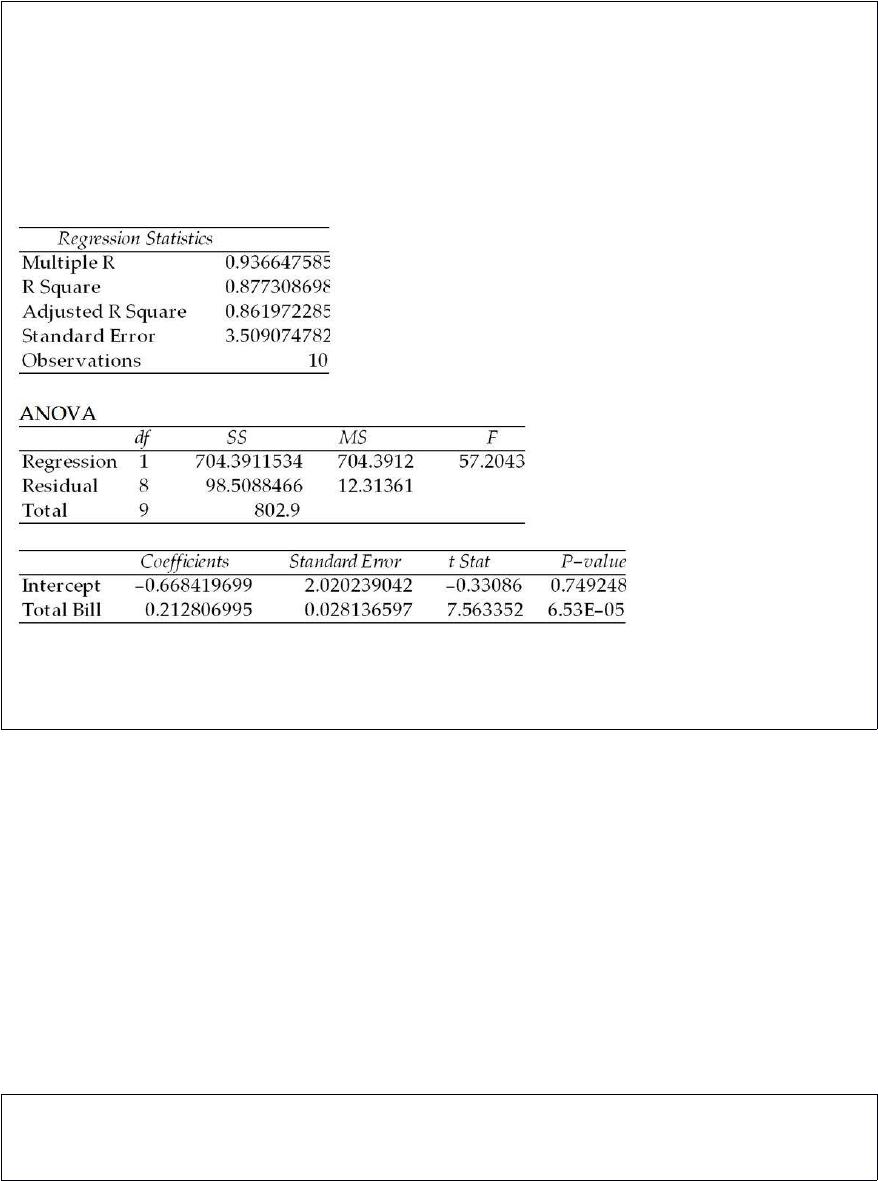
A study was recently performed by the Internal Revenue Service to determine how
much tip income waiters and waitresses should make based on the size of the bill at
each table. A random sample of bills and resulting tips were collected and the following
regression results were observed:
SUMMARY OUTPUT
Given this output, the upper limit for the 95 percent confidence interval estimate for the
true regression slope coefficient is approximately 0.28.
A point estimate is equally likely to be higher or lower than the population mean if the
sampling is done using a statistical sampling procedure.


Recently the managers for a large retail department store stated that a study has
revealed that female shoppers spend on average 23.5 minutes longer in the store per
visit than do male shoppers. Based on this information, the managers can be confident
that female shoppers, as a population, do spend longer times in the store than do males
shoppers, as a population.
Typically, a continuous random variable is one whose value is determined by
measurement instead of counting.
A car salesman has noted that the probability that the dealership sells a car on a
Saturday morning is .30. Then the probability of the dealership not selling a car on
Saturday morning is .70.
The mean of a sampling distribution would be equal to the mean of the population from
which the sampling distribution is constructed.
A short survey with closed-end questions is likely to have a better response rate than a
long survey with open-ended questions.
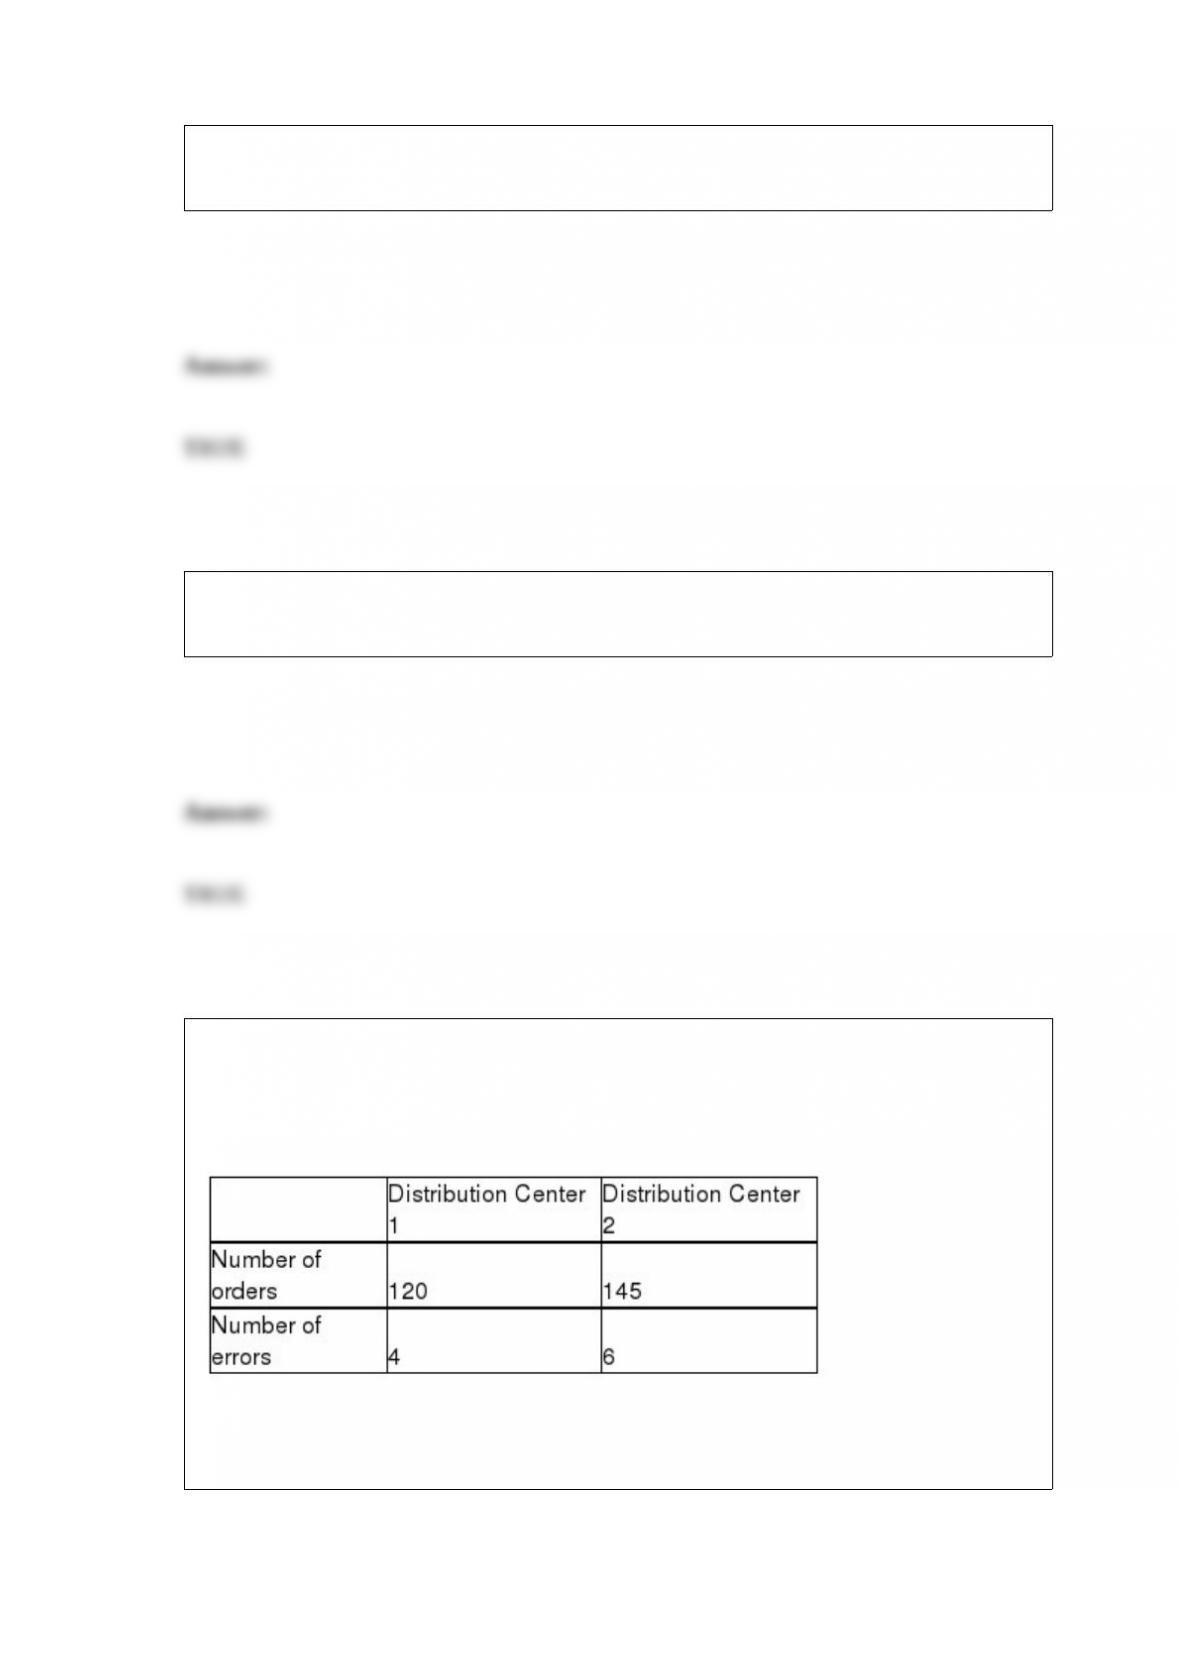
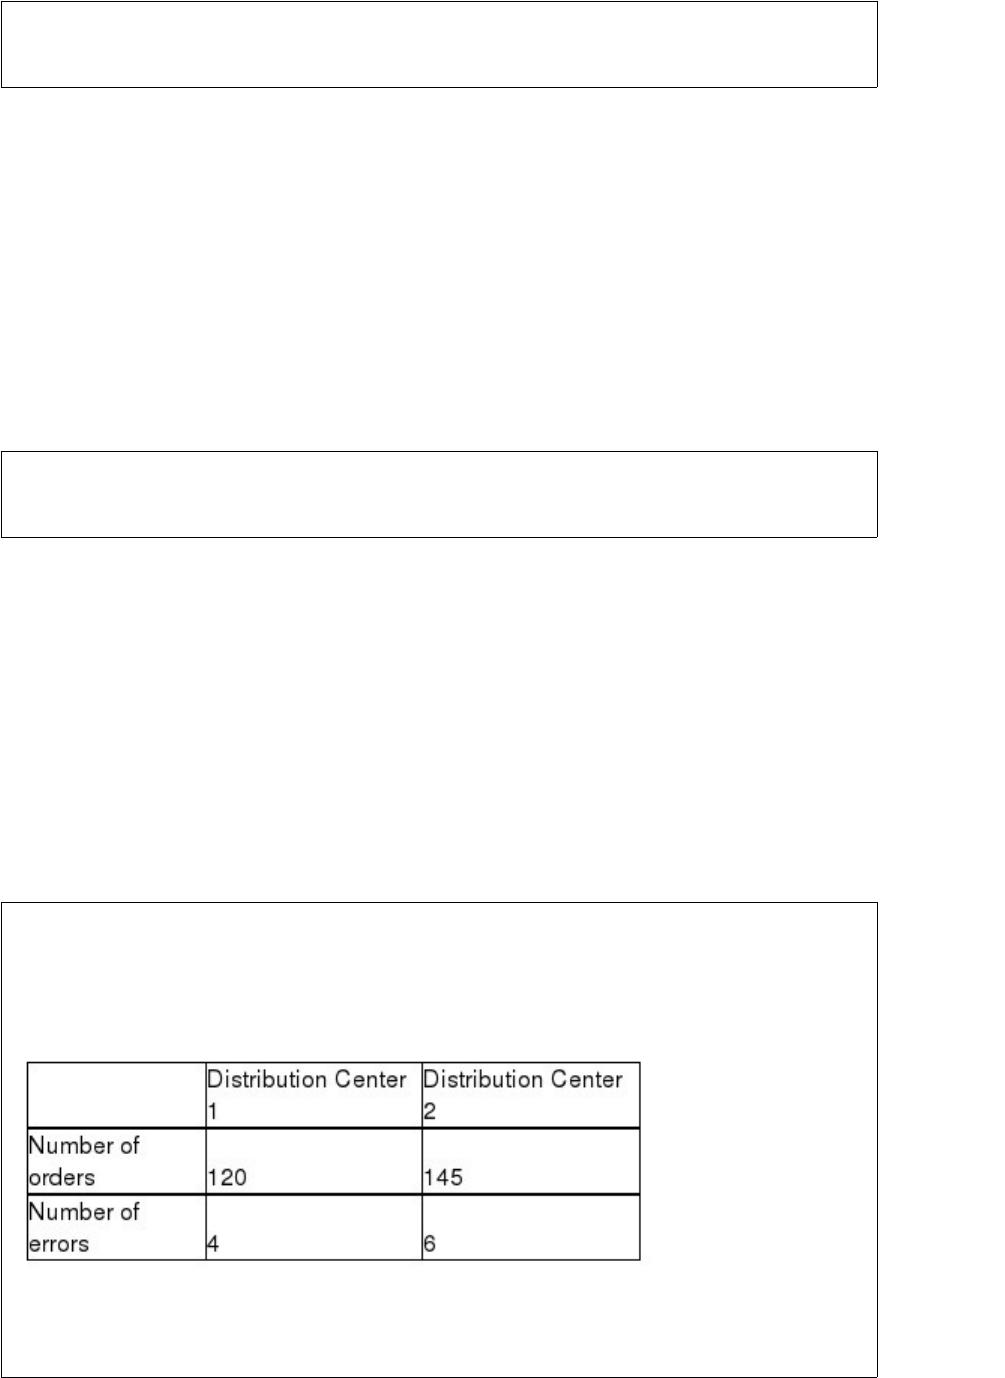
A direct retailer that sells clothing on the Internet has two distribution centers and wants
to determine if there is a difference between the proportion of customer order shipments
that contain errors (wrong color, wrong size, etc.). It takes a sample of orders from each
distribution center and obtain the following results:
Based on these data it can proceed with assuming the normal distribution for each of the
proportion sampling distributions.


In a forward selection stepwise regression process, the second variable to be selected
from the list of potential independent variables is always the one that has the second
highest correlation with the dependent variable.
It is possible for a set of data to have multiple modes as well as multiple medians, but
there can be only one mean.
A study at State University involved an analysis of students’ GPAs and the number of
hours that they work at jobs off-campus. An appropriate graph to display the
relationship between these two variables might be a scatter diagram.
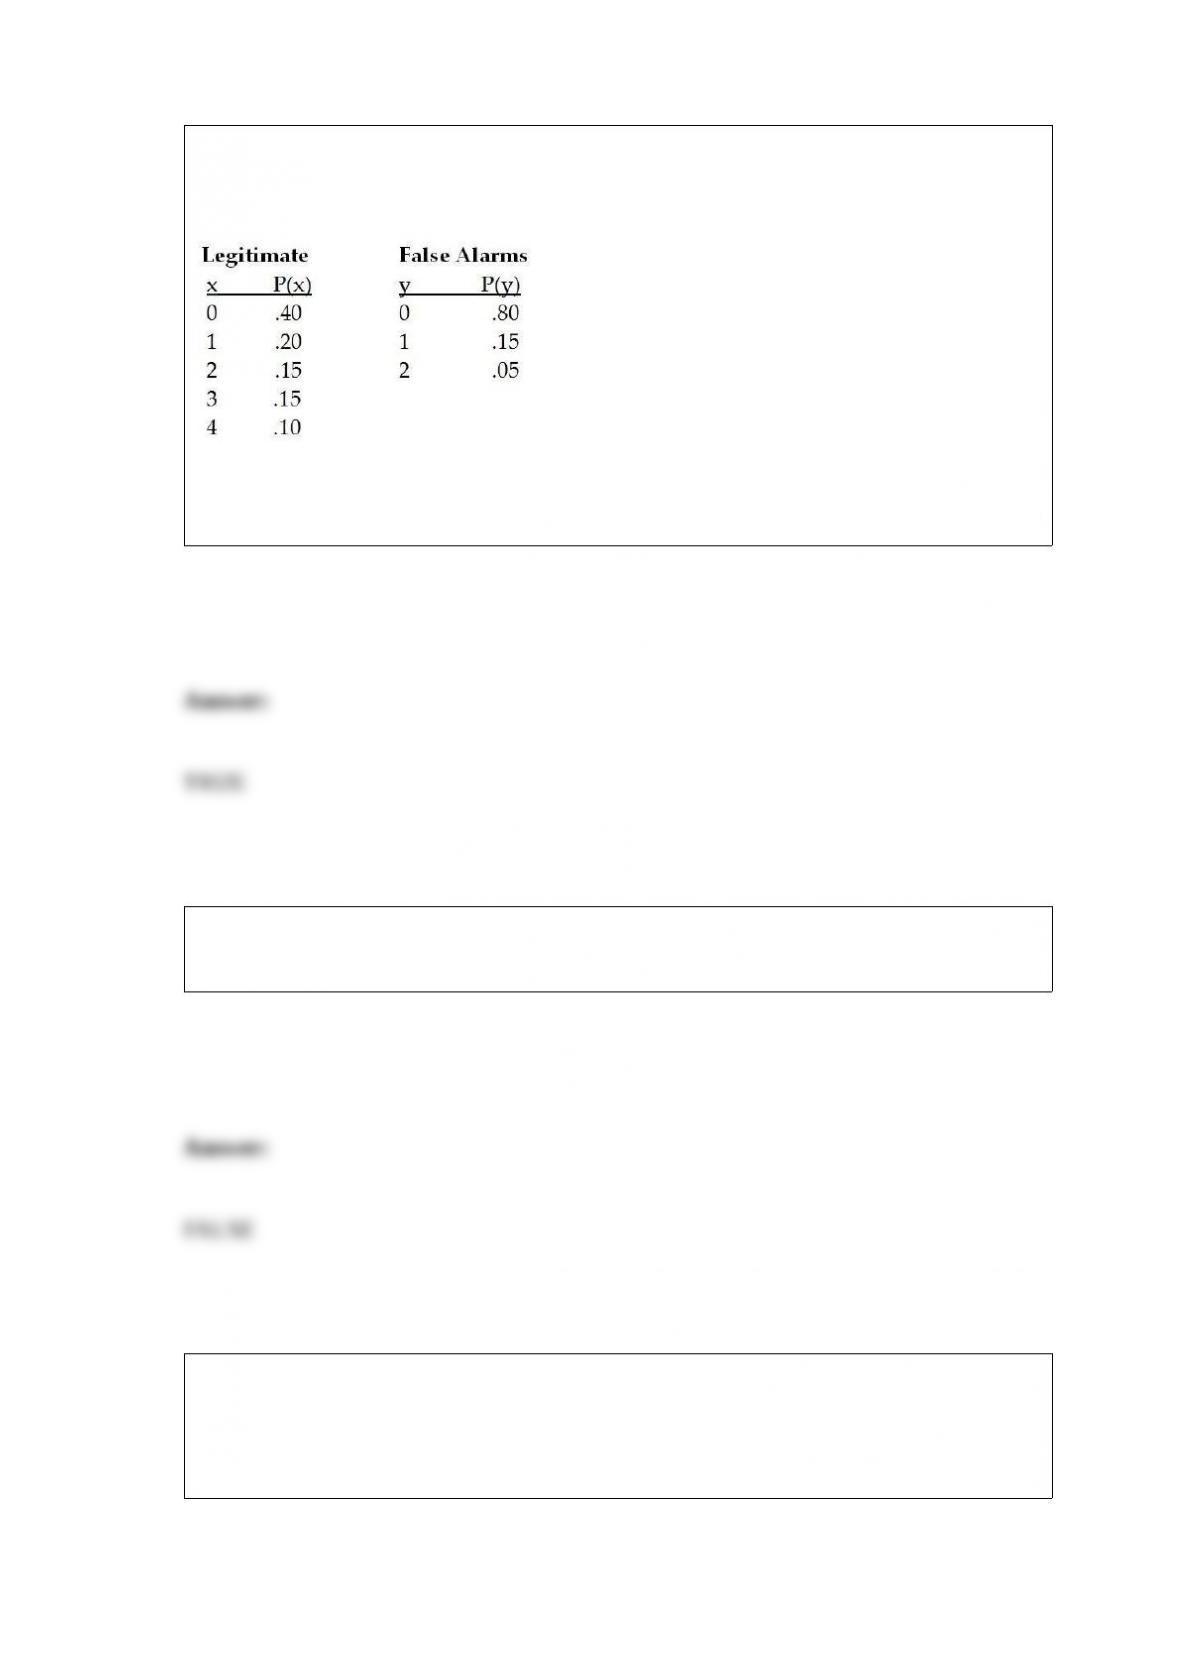
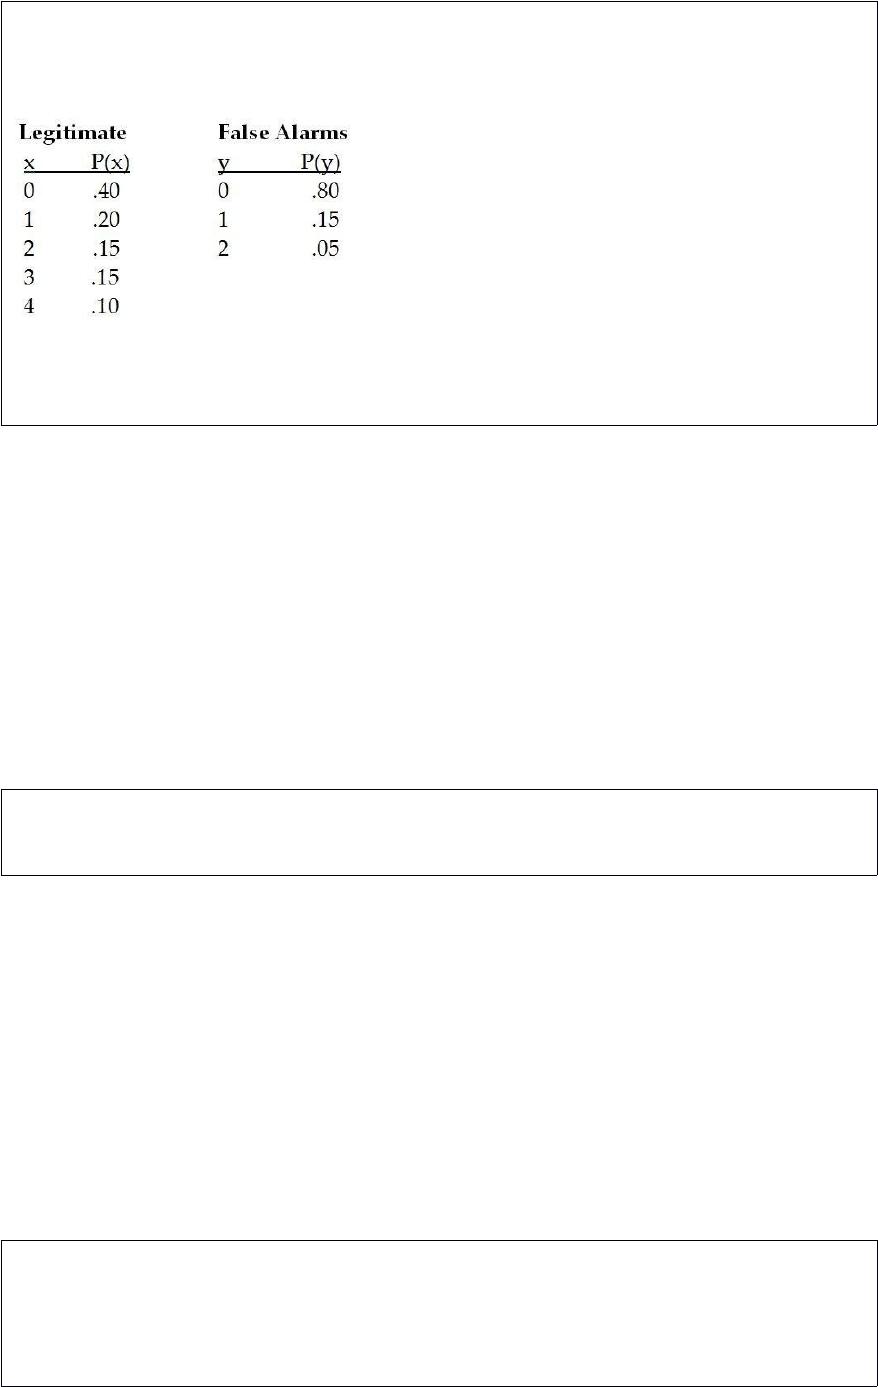
In a Florida town, the probability distribution for the number of legitimate emergency
calls per day for the Fire Department is given as follows. Also shown is the probability
distribution for the number of false alarms:
Given this information, the expected number of total calls to the fire department is 1.60
calls.
A 95 percent confidence interval estimate will have a margin of error that is
approximately 95 percent of the size of the population mean.
A local medical center has advertised that the mean wait for services will be less than
15 minutes. Given this claim, the hypothesis test for the population mean should be a
one-tailed test with the rejection region in the lower (left-hand) tail of the sampling
distribution.


The parameters of a normal distribution are the mean and the standard deviation.
A paired sample study has been conducted to determine whether two populations have
equal means. Twenty paired samples were obtained with the following sample results:
Based on these sample data and a significance level of 0.05, what conclusion should be
made about the population means?
A) Because t = 5.06 > 2.0930, reject the null hypothesis.
B) Because t = 3.41 > 2.0930, reject the null hypothesis.
C) Because t = 1.82 < 2.0930, do not reject the null hypothesis.
D) Because t = 2.02 < 2.0930, do not reject the null hypothesis.
A recent report in which a major pharmaceutical company released the results of testing
that had been done on the cholesterol reduction that people could expect if they use the
company’s new drug indicated that the Type II error probability for a given “true” mean
was 0.1250 based on the sample size of n = 64 subjects. Given this, what was the power
of the test under these same conditions? The alpha level used in the test was 0.05.
A) 0.95
B) 0.875
C) Essentially zero
D) Power would be undefined in this case since the hypothesis would be rejected.
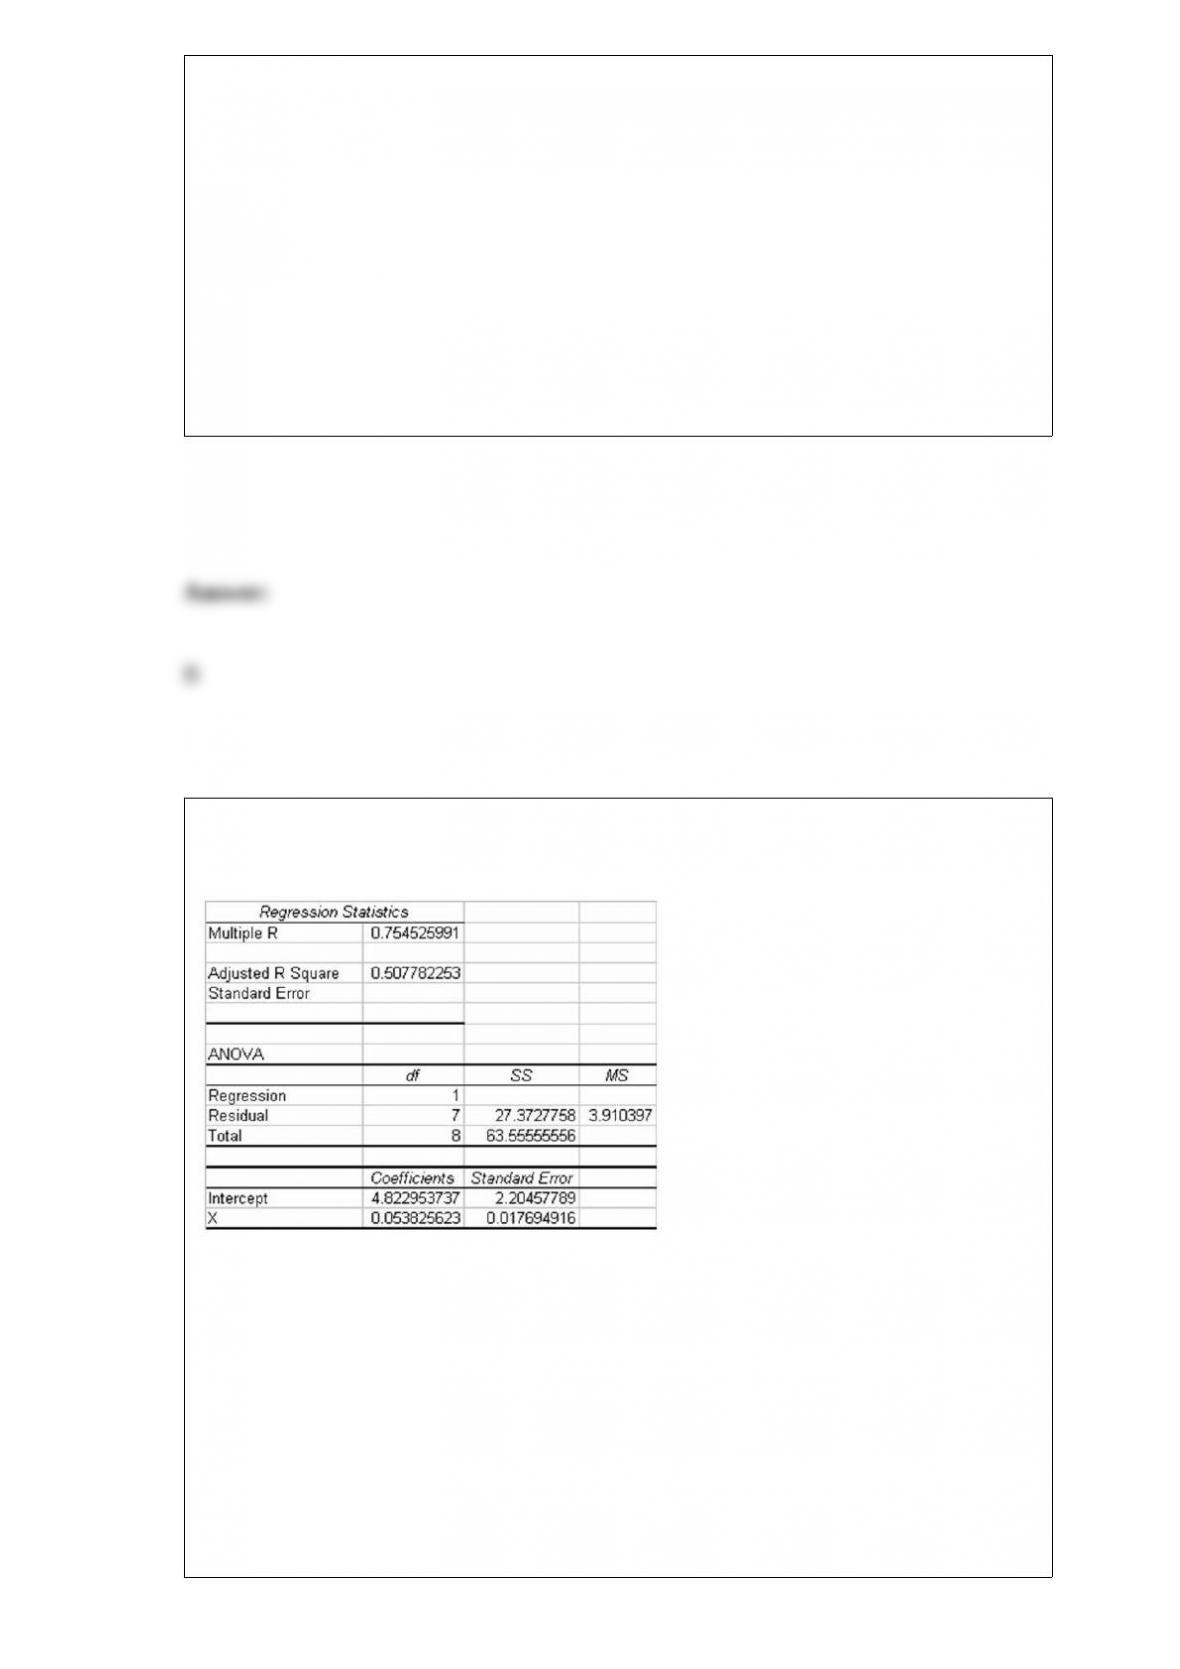
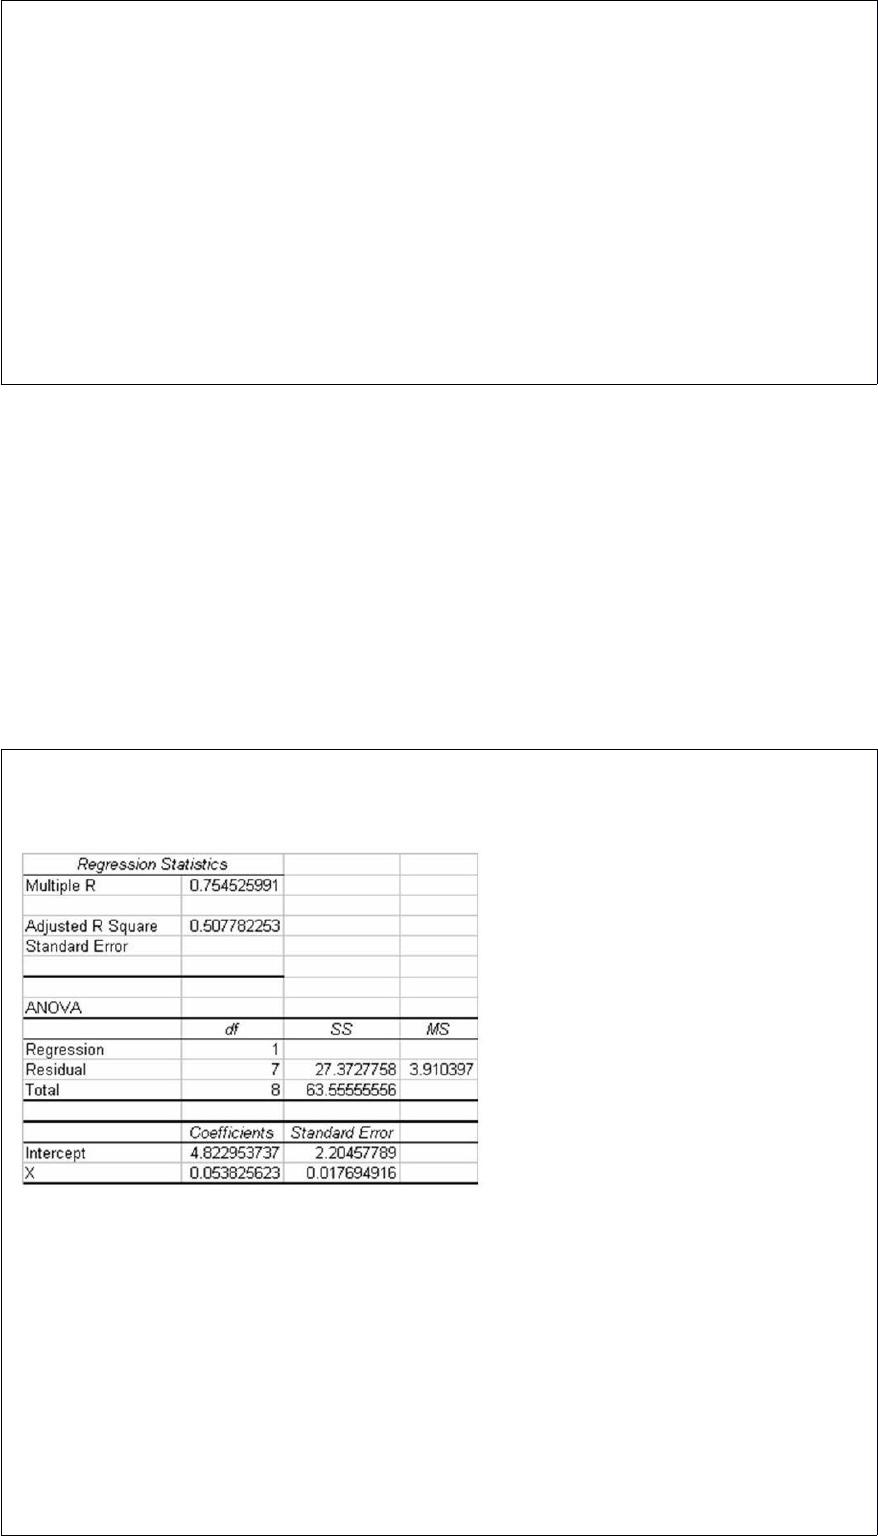
The following regression output is available. Notice that some of the values are
missing.
Given this information, what is the test statistic for testing whether the regression slope
coefficient is equal to zero?
A) Approximately t = 3.04
B) About t = 2.19
C) About t = 9.24
D) About t = 2.39

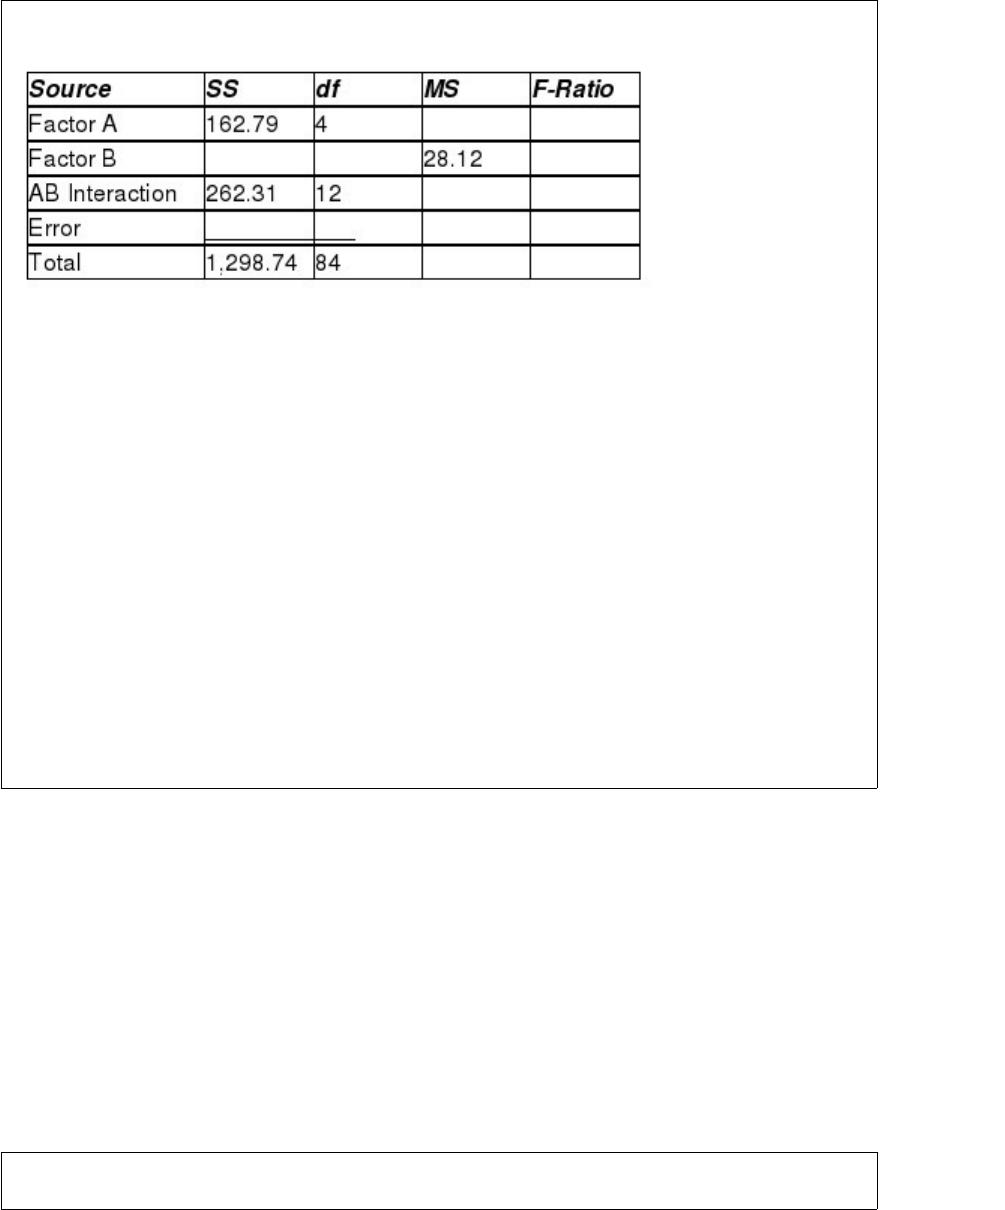
Examine the following two-factor analysis of variance table:
Does the ANOVA table indicate that the levels of factor B have equal means? Use a
significance level of 0.05.
A) Fail to reject H0. Conclude that there is not sufficient evidence to indicate that at
least two levels of Factor B have different mean responses.
B) Reject H0. Conclude that there is sufficient evidence to indicate that at least two
levels of Factor B have different mean responses.
C) Fail to reject H0. Conclude that there is sufficient evidence to indicate that at least
two levels of Factor B have different mean responses.
D) Reject H0. Conclude that there is not sufficient evidence to indicate that at least two
levels of Factor B have different mean responses.
Until the summer of 2006, the real estate market in Fresno, California, had been
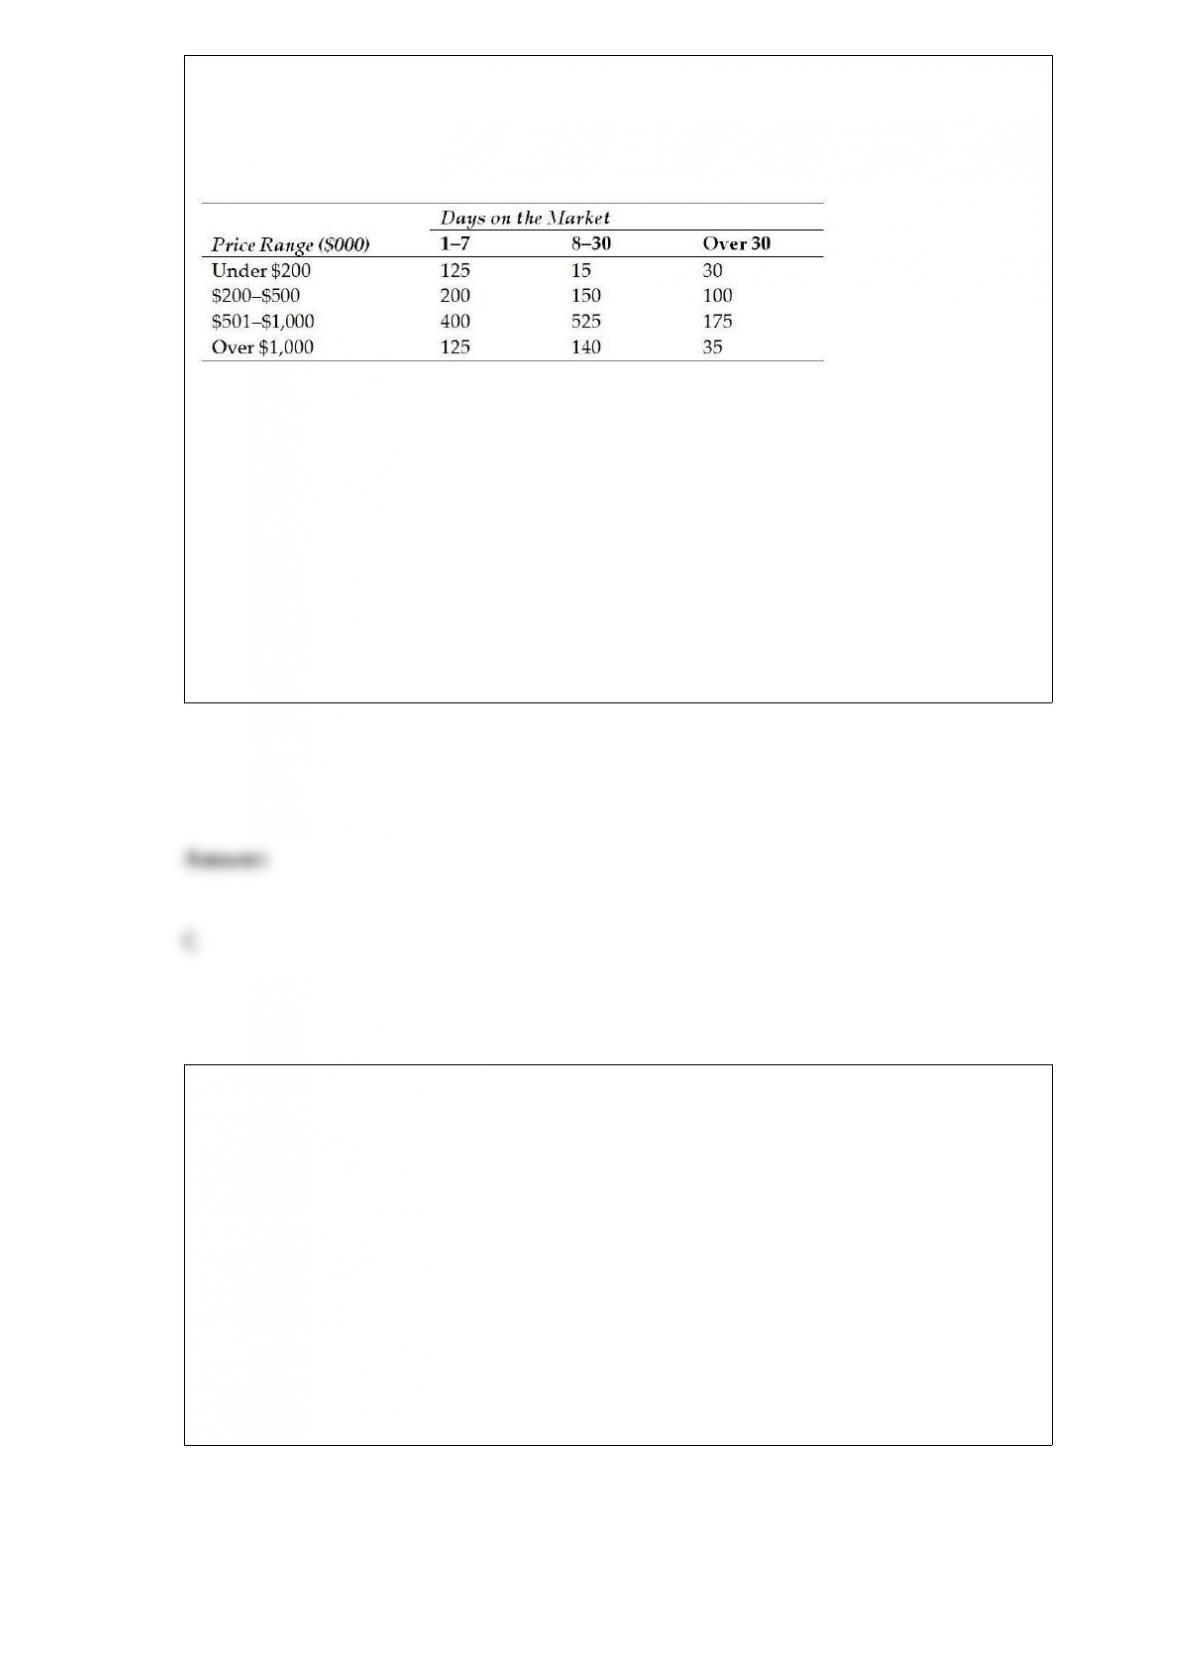
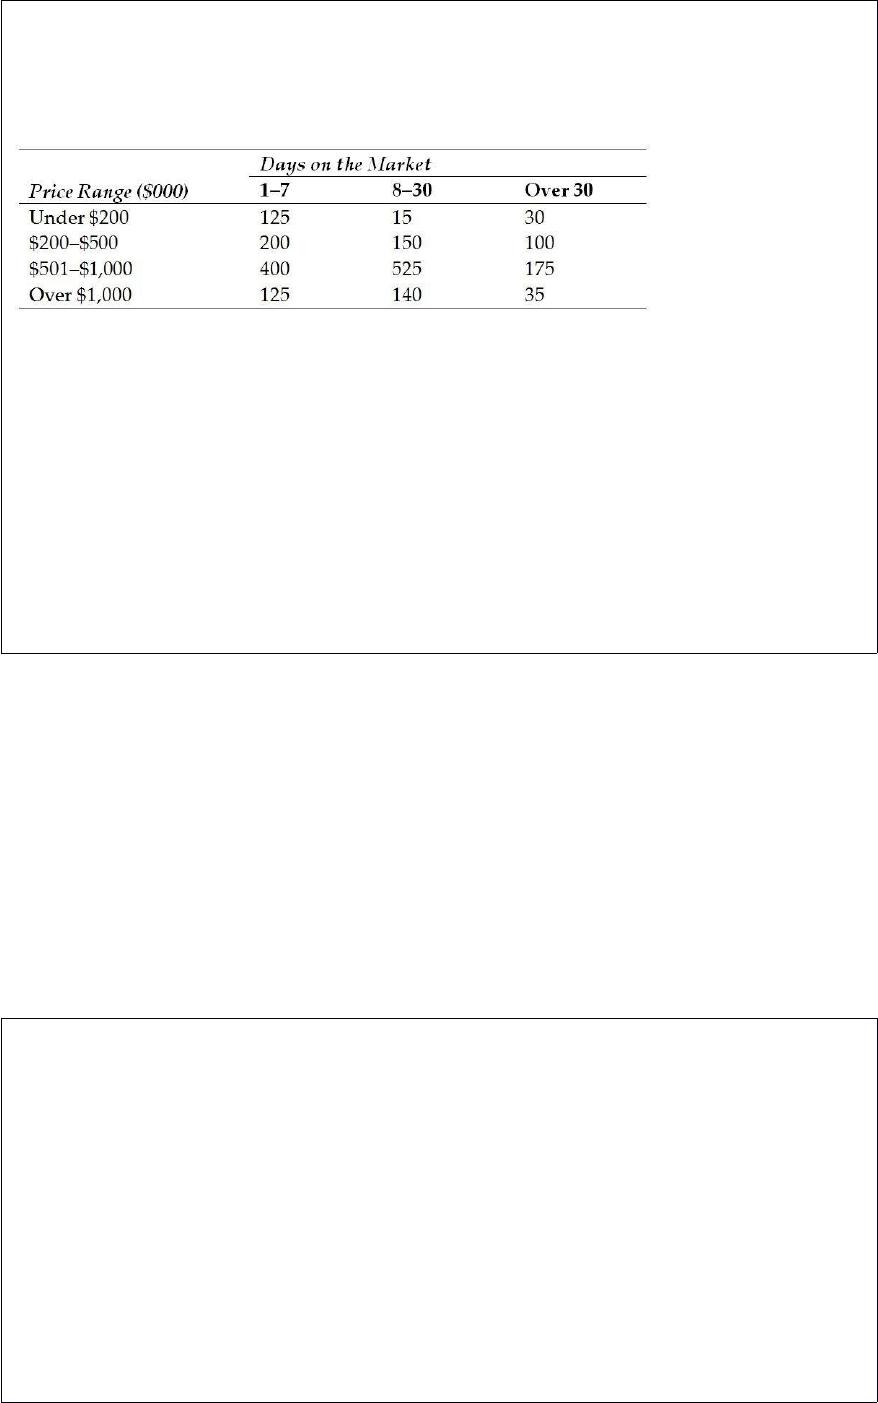
booming, with prices skyrocketing. Recently, a study showed the sales patterns in
Fresno for single-family homes. One chart presented in the commission’s report is
reproduced here. It shows the number of homes sold by price range and number of days
the home was on the market.
Using the relative frequency approach to probability assessment, what is the probability
that a house will be on the market more than 7 days?
A) 0.31
B) 0.099
C) 0.58
D) 0.48
The distribution of the actual weight of potato chips in a 16 ounce sack is thought to be
bell-shaped with a mean equal to 16 ounces and a standard deviation equal to 0.45
ounces. Based on this, between what two limits could we expect 95 percent of all sacks
to weigh?
A) 14 to 18 ounces
B) 15.10 to 16.90 ounces
C) 15.55 to 16.45 ounces
D) 14.65 to 17.35 ounces


Suppose a study estimated the population mean for a variable of interest using a 99%
confidence interval. If the width of the estimated confidence interval (the difference
between the upper limit and the lower limit) is 600 and the sample size used in
estimating the mean is 1,000, what is the population standard deviation?
A) 26711.14
B) 2451.23
C) 3684.21
D) 5125.11
A small business owner has two fast food restaurants. The owner wants to determine if
there is any difference in the variability of service times at the drive-thru window of
each restaurant. A sample of size n = 9 is taken from each restaurant’s drive-thru
window. To perform a hypothesis test using the 0.05 level of significance the critical
value is:
A) 3.438
B) 3.197
C) 4.026
D) 4.433

In conducting a Kruskal-Wallis one-way analysis of variance, the test statistic is
assumed to have approximately which distribution when the null hypothesis is true?
A) A t-distribution
B) An F-distribution
C) A normal distribution
D) A chi-square distribution
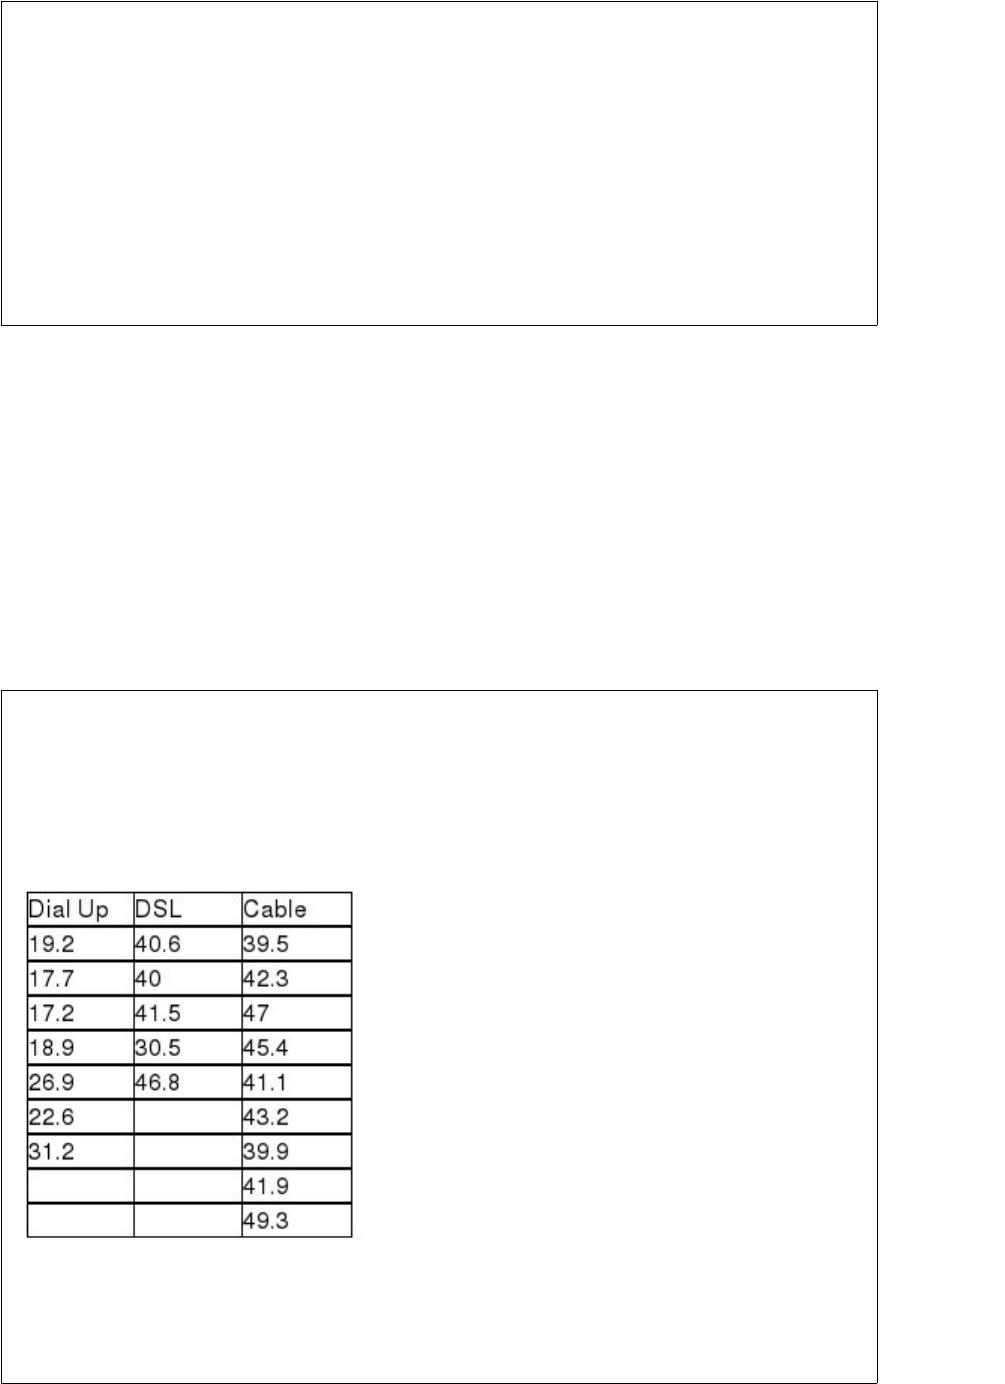
An Internet service provider is interested in testing to see if there is a difference in the
mean weekly connect time for users who come into the service through a dial-up line,
DSL, or cable Internet. To test this, the ISP has selected random samples from each
category of user and recorded the connect time during a week period. The following
data were collected:
Assuming that the test is to be conducted at a 0.01 level of significance, what would the
critical value be for this test?


A) F = 1.93
B) F = 3.555
C) t = 2.8784
D) F = 6.013
A traffic engineer plans to estimate the average number of cars that pass through an
intersection each day. Based on previous studies the standard deviation is believed to be
52 cars. She wants to estimate the mean to within 10 cars with 90 percent confidence.
The needed sample size for n is:
A) n = 104 days.
B) n = 74 days.
C) n = 10 days.
D) n = 9 days.
How can the degrees of freedom be found in a contingency table with cross-classified
data?
A) When df are equal to rows minus columns
B) When df are equal to rows multiplied by columns
C) When df are equal to rows minus 1 multiplied by columns minus 1
D) Total number of cell minus 1
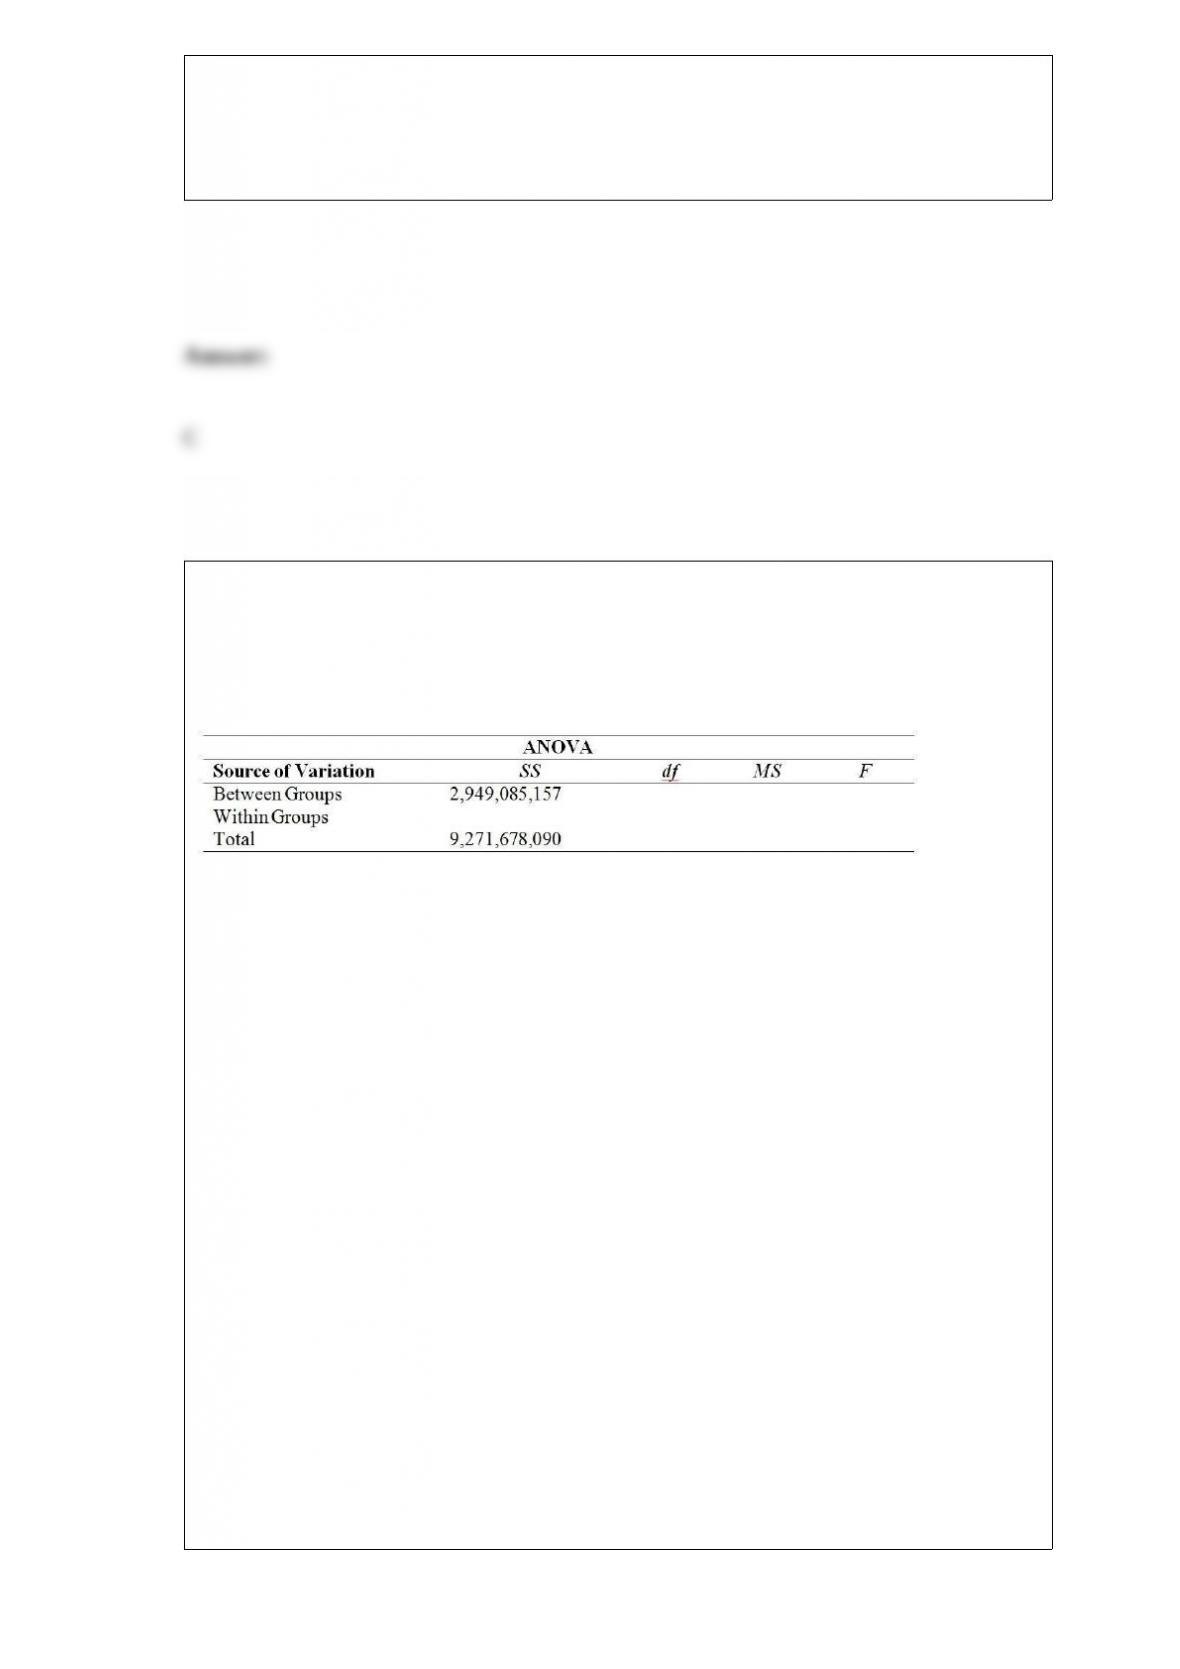
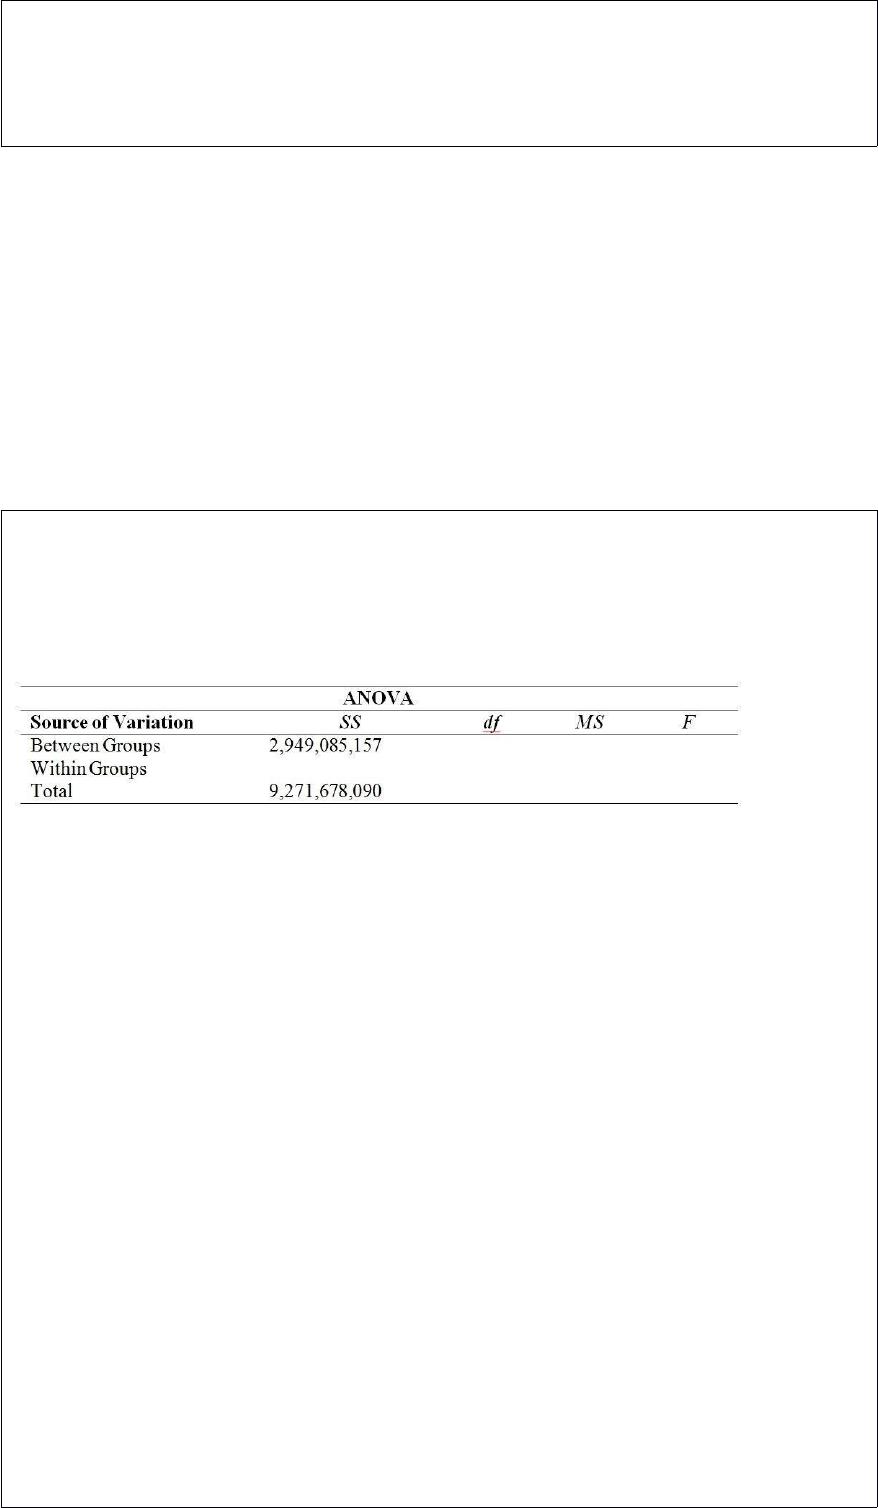
A start-up cell phone applications company is interested in determining whether
house-hold incomes are different for subscribers to three different service providers. A
random sample of 25 subscribers to each of the three service providers was taken, and
the annual household income for each subscriber was recorded. The partially completed
ANOVA table for the analysis is shown here:
Complete the ANOVA table by filling in the missing sums of squares, the degrees of
freedom for each source, the mean square, and the calculated F-test statistic.
A) Between Groups df = 2, Within Groups df = 74, SSW = 6,322,592,933, MSB =
1,474,542,579,
MSW = 87,813,791, F = 16.79
B) Between Groups df = 2, Within Groups df = 72, SSW = 6,322,592,933, MSB =
1,474,542,579,
MSW = 87,813,791, F = 16.79.
C) Between Groups df = 2, Within Groups df = 72, SSW = 6,322,592,933, MSB =
1,474,542,579,
MSW = 87,813,791, F = 9.73
D) Between Groups df = 2, Within Groups df = 72, SSW = 6,322,592,933, MSB =
87,813,791,
MSW = 87,813,791, F = 16.79
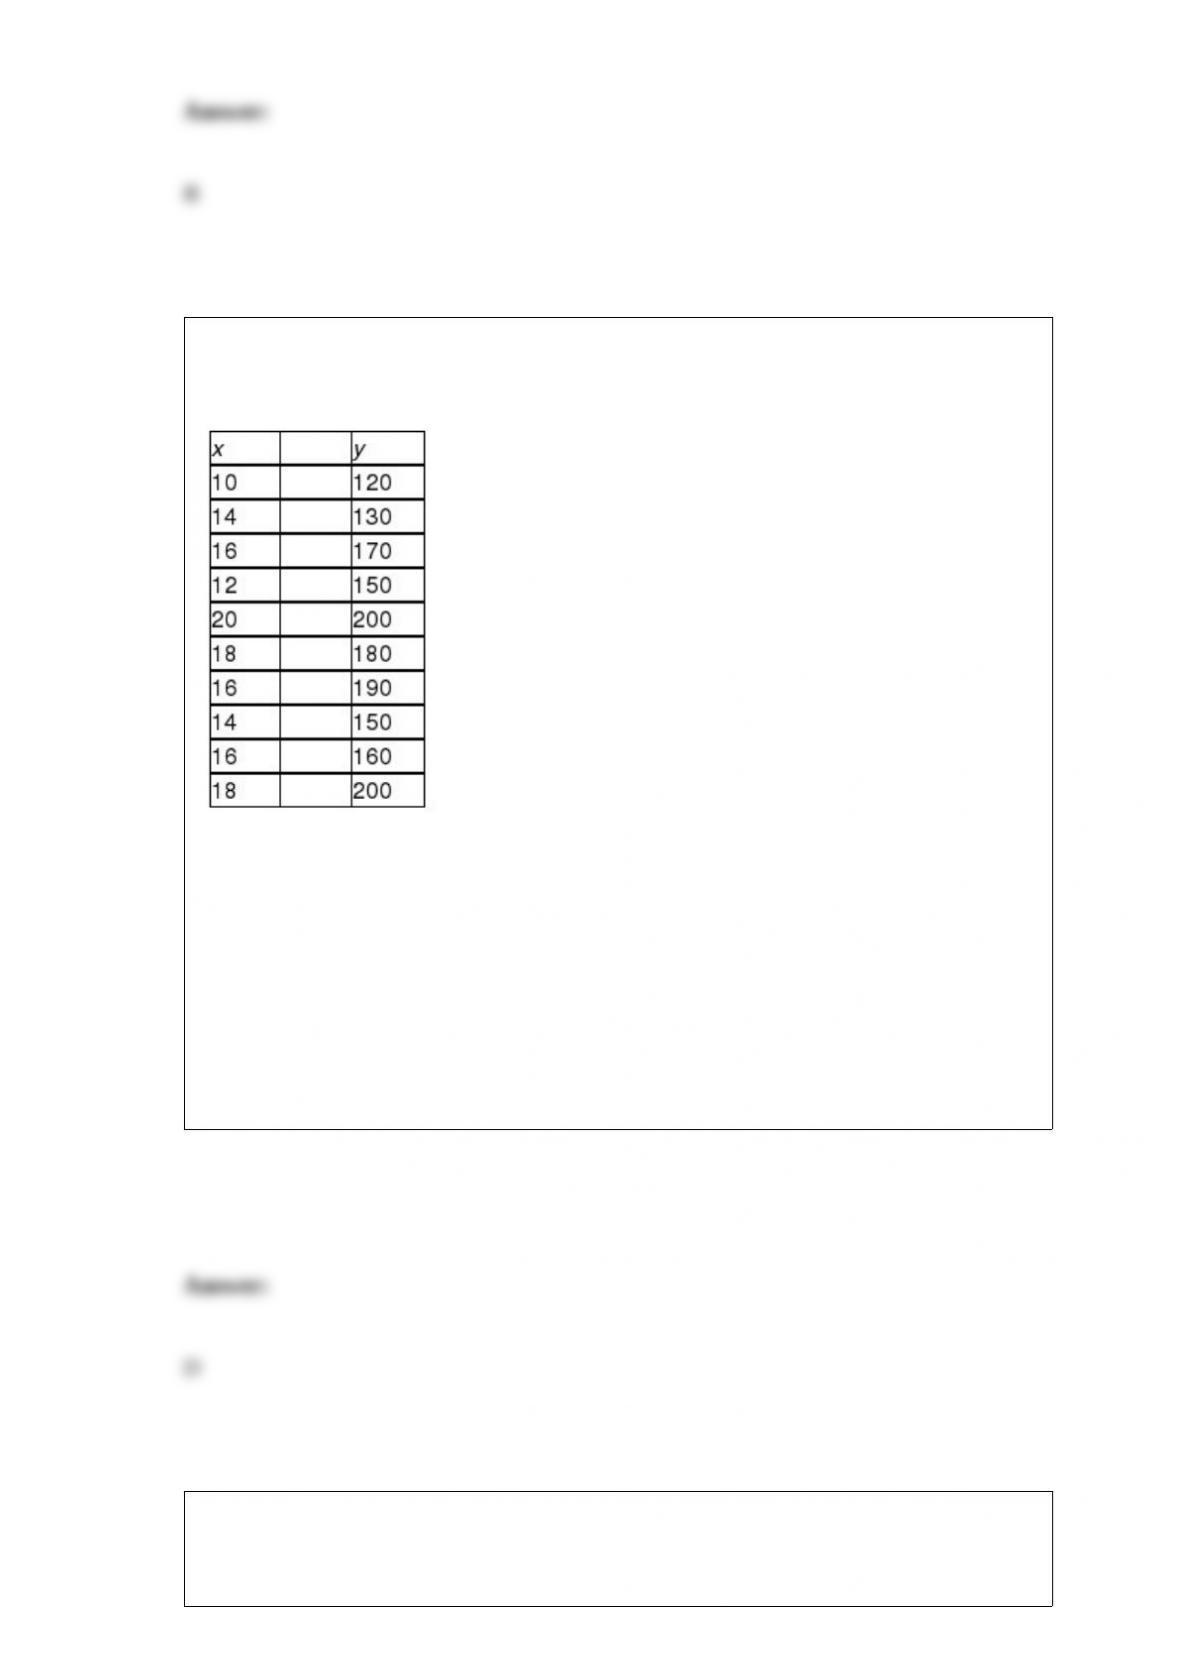
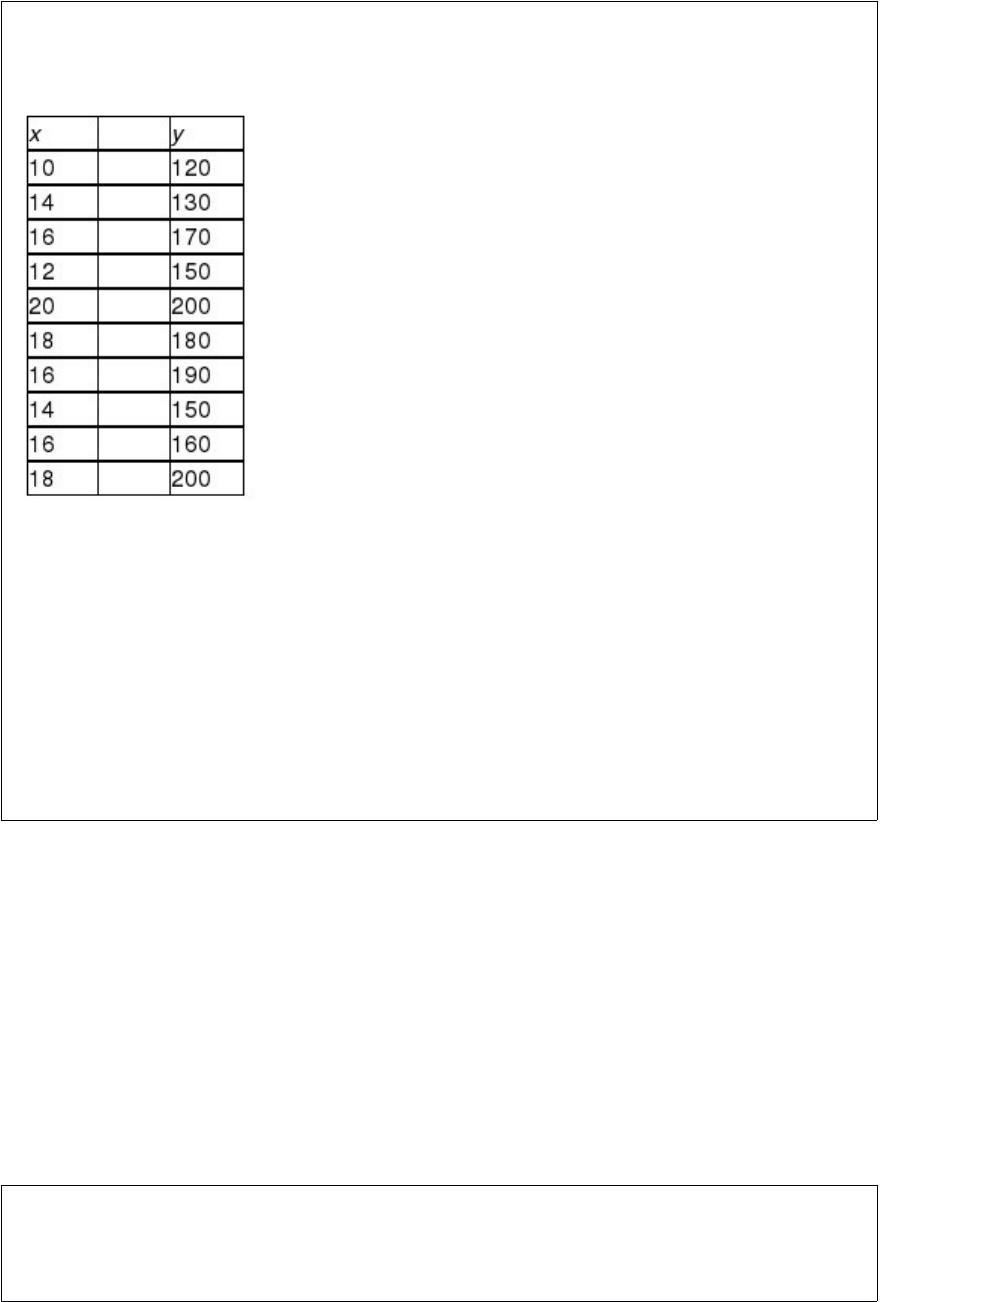
The following data for the dependent variable, y, and the independent variable, x, have
been collected using simple random sampling:
Compute the correlation coefficient.
A) 0.52
B) 0.71
C) 0.62
D) 0.89
Because of the complex nature of the U.S. income tax system, many people have
questions for the Internal Revenue Service (IRS). Yet, an article published by the
Detroit Free Press entitled “Assistance: IRS Help Centers Give the Wrong Information”
discusses the propensity of IRS staff employees to give incorrect tax information to
tax-payers who call with questions. Then IRS Inspector General Pamela Gardiner told a
Senate subcommittee that “the IRS employees at 400 taxpayer assistance centers
nationwide encountered 8.5 million taxpayers face-to-face last year. The problem:
When inspector general auditors posing as taxpayers asked them to answer tax
questions, the answers were right 69% of the time.”
Suppose an independent commission was formed to test whether the 0.69 accuracy rate
is correct or whether it is actually higher or lower. The commission has randomly
selected n = 180 tax returns that were completed by IRS assistance employees and
found that 105 of the returns were accurately completed.
State the appropriate null and alternative hypotheses.
A) H0: p = 0.69 Ha : p ≠ 0.69
B) H0 : p = 0.58 Ha : p ≠ 0.58
C) H0 : p > 0.69 Ha : p ≤ 0.69
D) H0 : p > 0.58 Ha : p ≤ 0.58
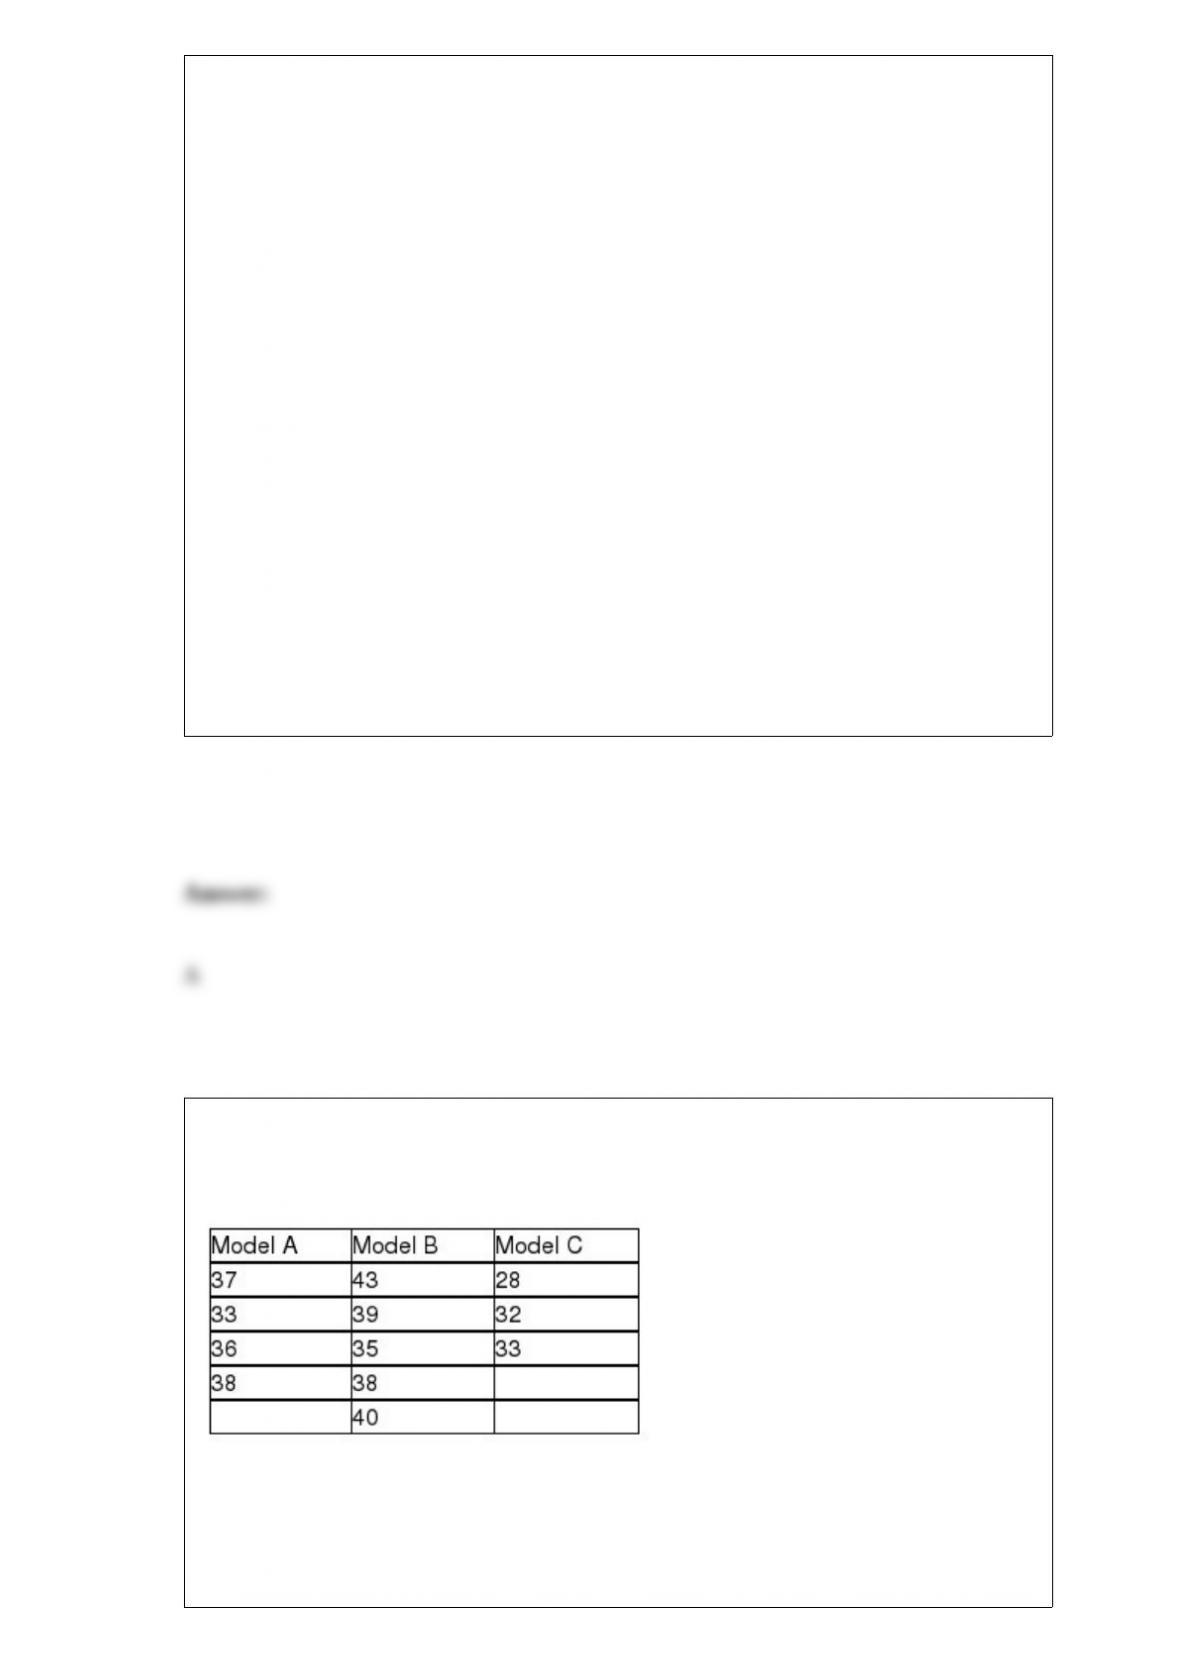
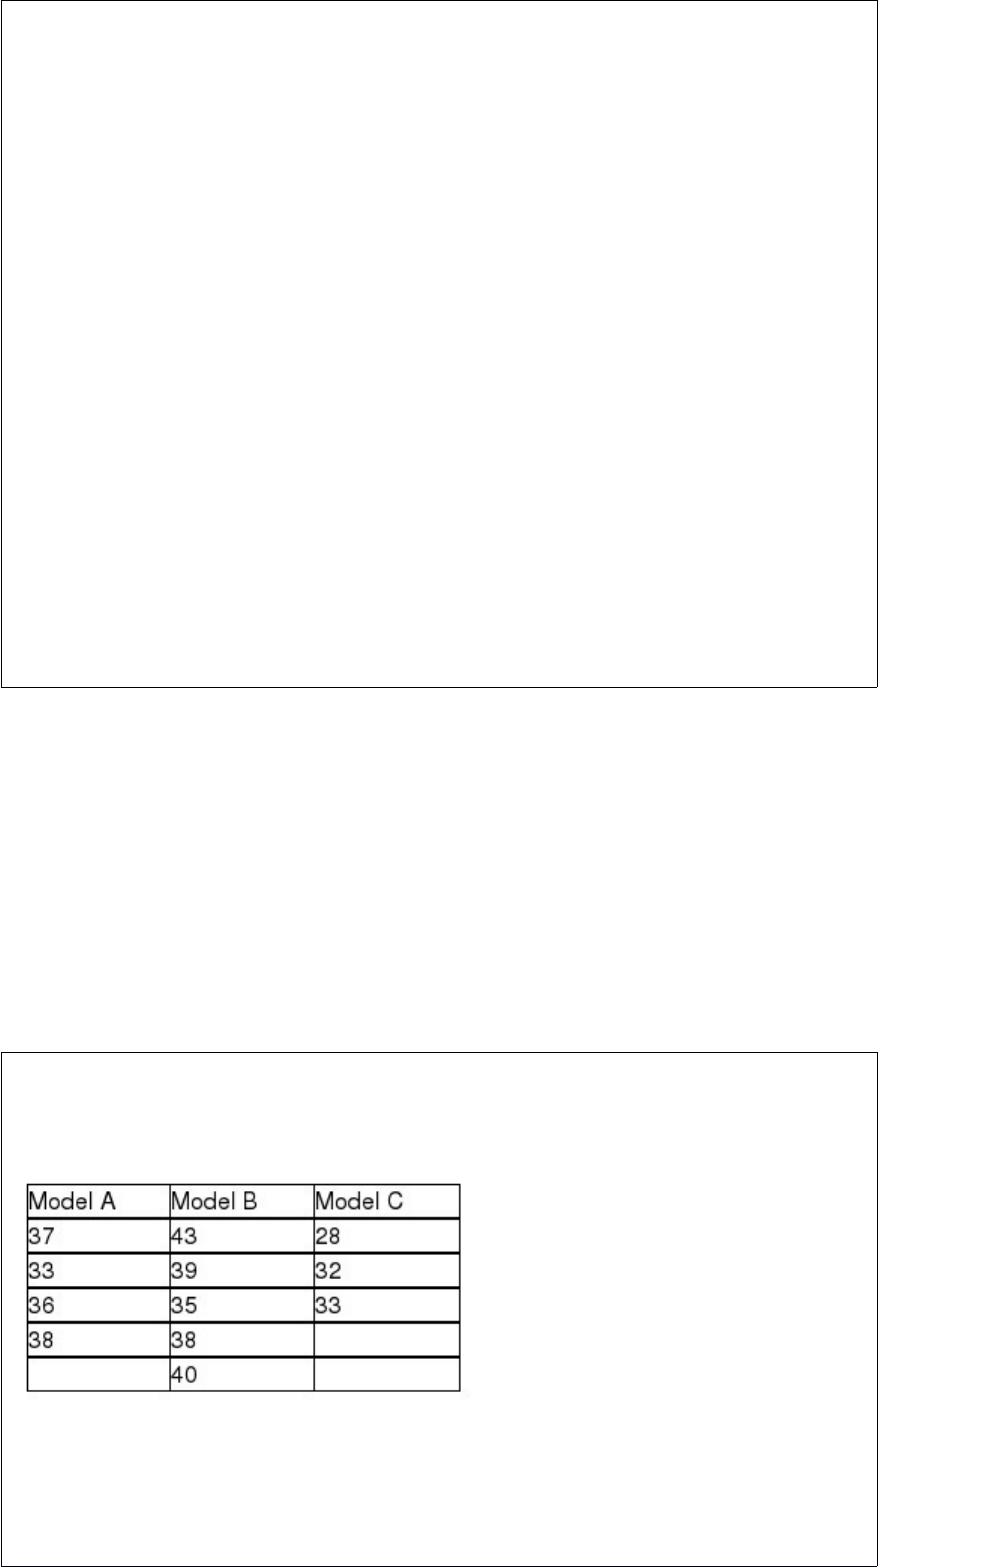
To test the mileage efficiency of three new car models, random samples of various
sample sizes were selected from each of the three cars and the mpg data obtained are
shown below.
Based on the sample date, one can conclude that
A) all three car models have the same mean mpg.


B) at least two car models have different mpgs.
C) Model C has a higher mpg than Model A.
D) None of the above
A hypothesis test is to be conducted using an alpha = .05 level. This means:
A) there is a 5 percent chance that the null hypothesis is true.
B) there is a 5 percent chance that the alternative hypothesis is true.
C) there is a maximum 5 percent chance that a true null hypothesis will be rejected.
D) there is a 5 percent chance that a Type II error has been committed.
A company that sells an online course aimed at helping high-school students improve
their SAT scores has claimed that SAT scores will improve by more than 90 points on
average if students successfully complete the course. To test this, a national school
counseling organization plans to select a random sample of n = 100 students who have
previously taken the SAT test. These students will take the company’s course and then
retake the SAT test. Assuming that the population standard deviation for improvement
in test scores is thought to be 30 points and the level of significance for the hypothesis
test is 0.05, find the critical value in terms of improvement in SAT points, which would
be needed prior to finding a beta.
A) Reject the null if SAT improvement is > 95 points.

B) Reject the null if SAT improvement is < 85.065 points.
C) Reject the null if SAT improvement is > 95.88 points.
D) Reject the null if SAT improvement is > 94.935 points.
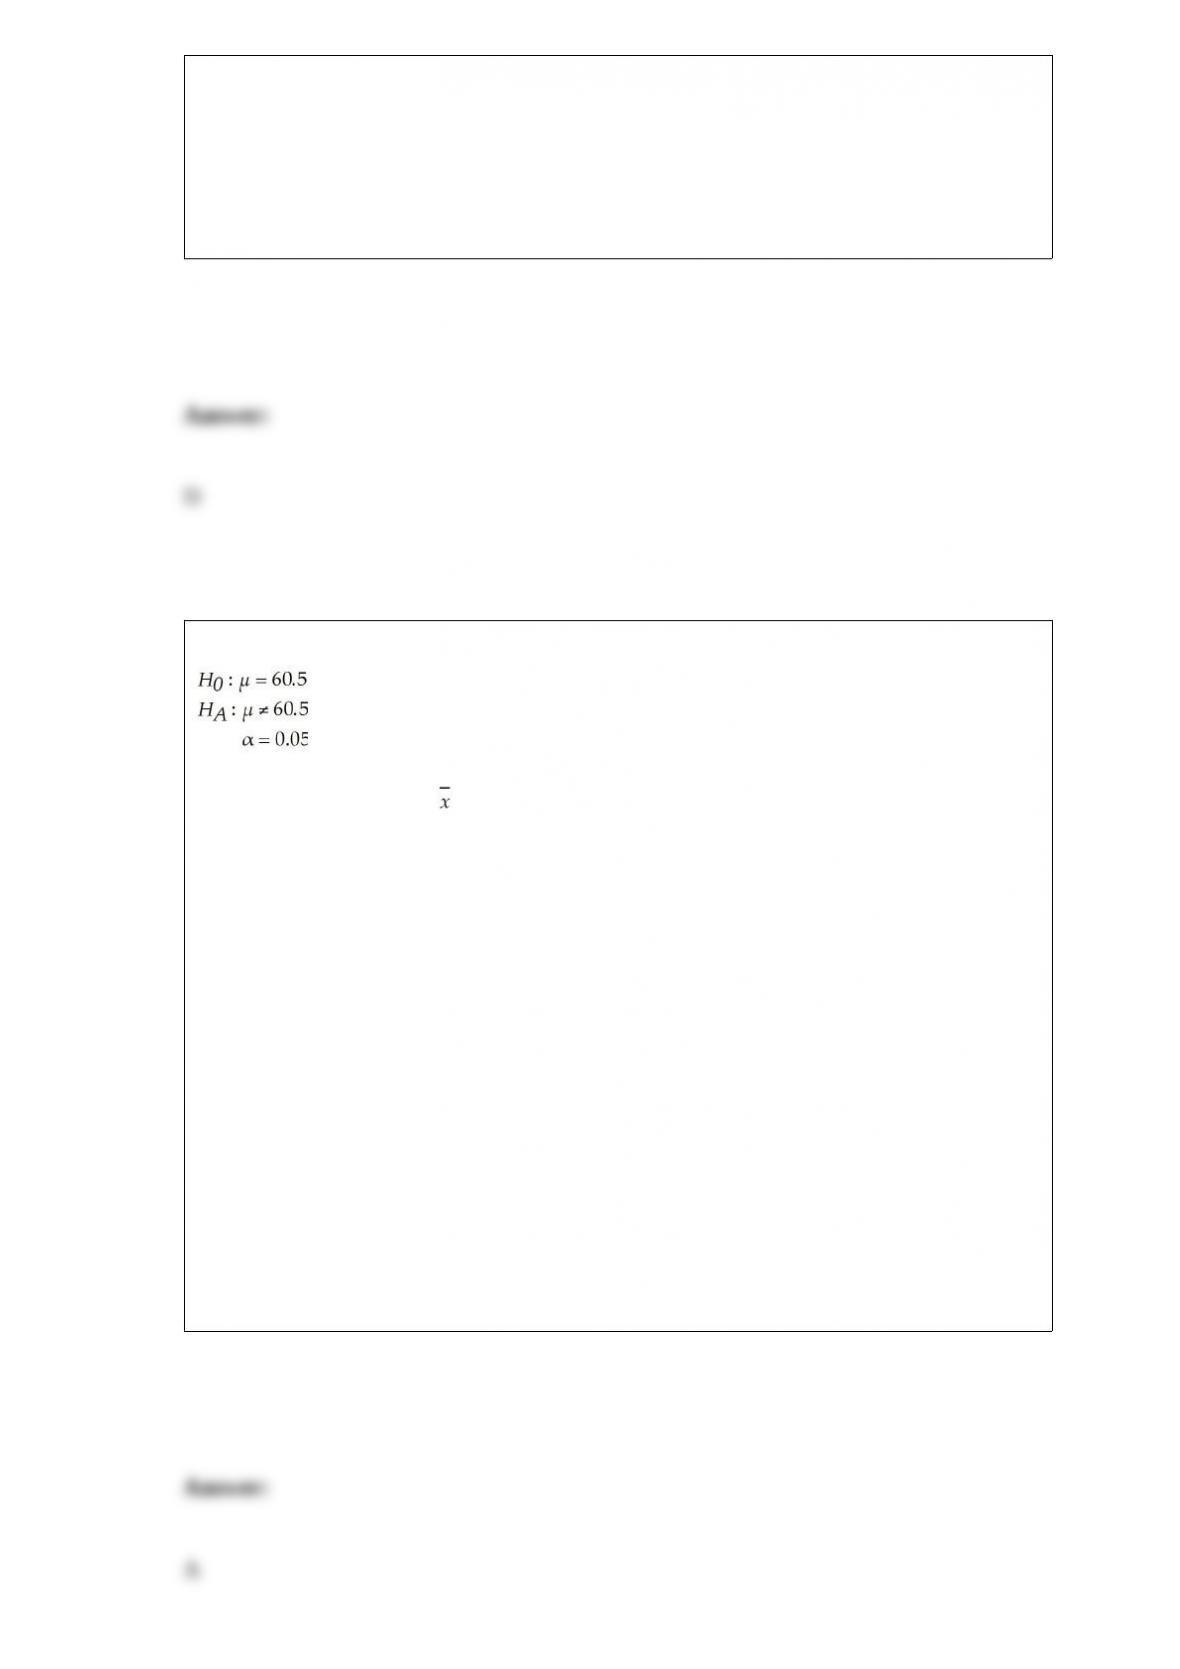
For the following hypothesis test:
With n = 15, s = 7.5, and = 62.2, state the decision rule in terms of the critical value of
the test statistic
A) This is a two-tailed test of the population mean with σ unknown. Therefore, the
decision rule is: reject the null hypothesis if the calculated value of the test statistic, t, is
less than -2.1448 or greater than 2.1448. Otherwise, do not reject.
B) This is a two-tailed test of the population mean with σ unknown. Therefore, the
decision rule is: accept the null hypothesis if the calculated value of the test statistic, t,
is less than -2.1448 or greater than 2.1448. Otherwise, do not accept.
C) This is a two-tailed test of the population mean with σ unknown. Therefore, the
decision rule is: reject the null hypothesis if the calculated value of the test statistic, t, is
less than -1.1828 or greater than 1.1828. Otherwise, do not reject.
D) This is a two-tailed test of the population mean with σ unknown. Therefore, the
decision rule is: reject the null hypothesis if the calculated value of the test statistic, t, is
less than -1.1828 or greater than 1.1828. Otherwise, do not accept.


Which of the following CANNOT be shown effectively with a histogram?
A) A frequency distribution
B) A joint frequency distribution
C) A relative frequency distribution
D) The center, shape and spread of a distribution
Two airlines are being compared with respect to the time it takes them to turn a plane
around from the time it lands until it takes off again. The study is interested in
determining whether there is a difference in the variability between the two airlines.
They wish to conduct the hypothesis test using an alpha = 0.02. If random samples of
20 flights are selected from each airline, what is the appropriate F critical value?
A) 3.027
B) 2.938
C) 2.168
D) 2.124
Which of the following statements applies to a point estimate?


A) The point estimate is a parameter.
B) The point estimate will tend to be accurate if the sample size exceeds 30 for
non-normal populations.
C) The point estimate is subject to sampling error and will almost always be different
from the population value.
D) The point estimate is needed to determine the required sample size when estimating
the population mean.
Suppose the mean of dogs a pet shop grooms each day is know to be 14.2 dogs. If a
sample of n = 12 days is chosen and a total of 178 dogs are groomed during those 12
days, then the sampling error is:
A) 163.8.
B) about 0.63.
C) about -0.63.
D) -163.8.
A study published in the American Journal of Public Health was conducted to
determine whether the use of seat belts in motor vehicles depends on ethnic status in
San Diego County. A sample of 792 children treated for injuries sustained from motor

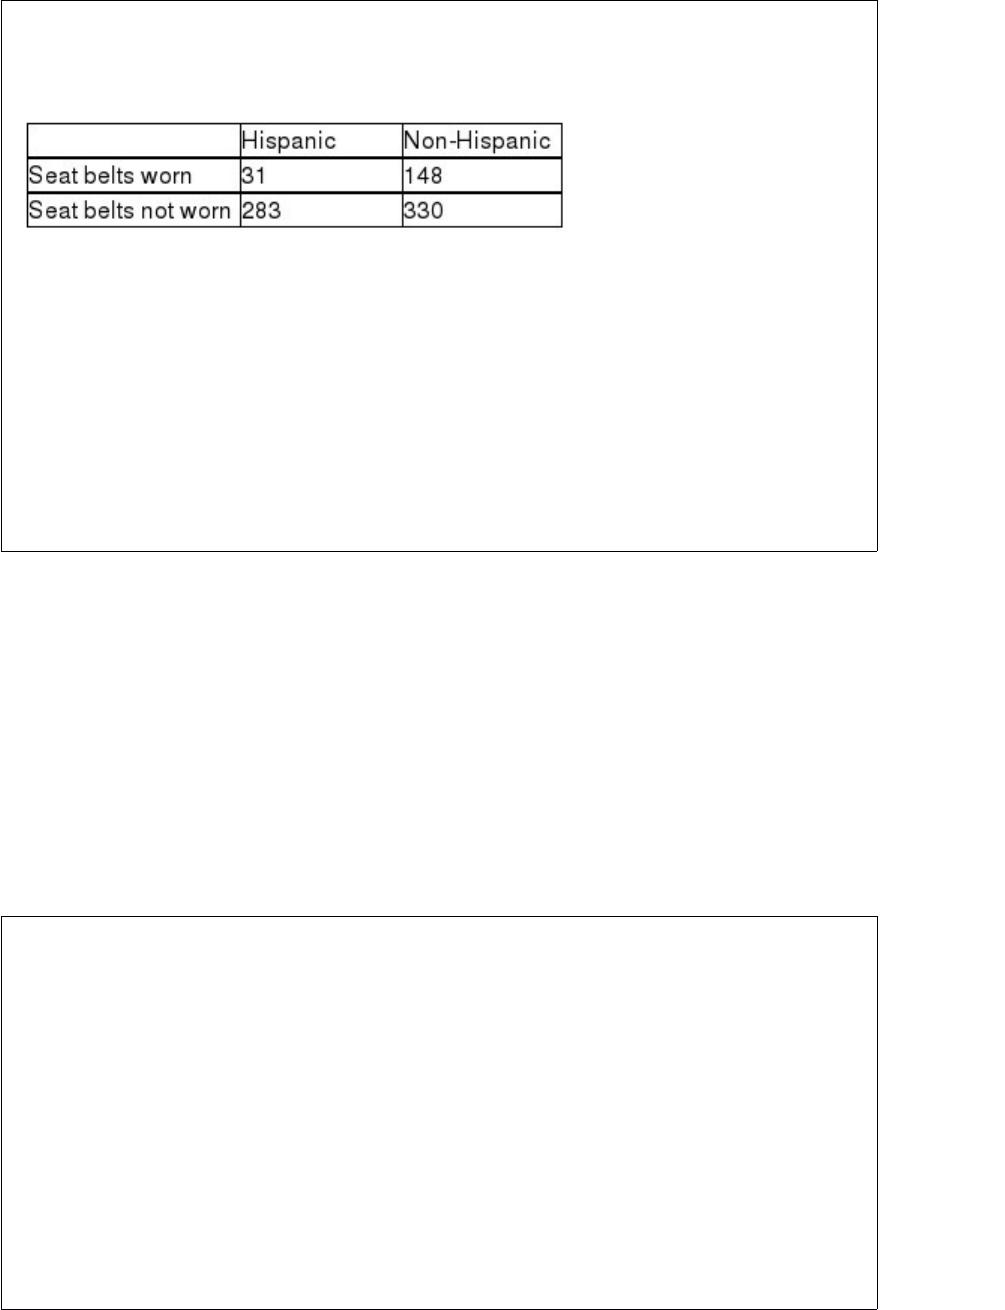
vehicle accidents was obtained, and each child was classified according to (1) ethnic
status (Hispanic or non-Hispanic) and (2) seat belt usage (worn or not worn) during the
accident. The number of children in each category is given in the table below.
Referring to these data, the calculated test statistic is:
A) approximately -0.9991
B) nearly -0.1368
C) about 48.1849
D) approximately 72.8063
A decision maker has five potential independent variables with which to build a
regression model to explain the variation in the dependent variable. At step 1, variable
x3 enters the regression model. Which of the following indicates which of the four
remaining independent variables will be next to enter the model?
A) The variable that has the next highest correlation with the dependent variable
B) The variable that will provide the next largest value for the slope coefficient
C) The variable with the highest coefficient of partial determination
D) Can’t be determined without seeing the correlation matrix.

Assuming that the change in daily closing prices for stocks on the New York Stock
Exchange is a random variable that is normally distributed with a mean of $0.35 and a
standard deviation of $0.33. Based on this information, what is the probability that a
randomly selected stock will be lower by $0.40 or more?
A) 2.27
B) 0.4884
C) 0.0116
D) 0.9884
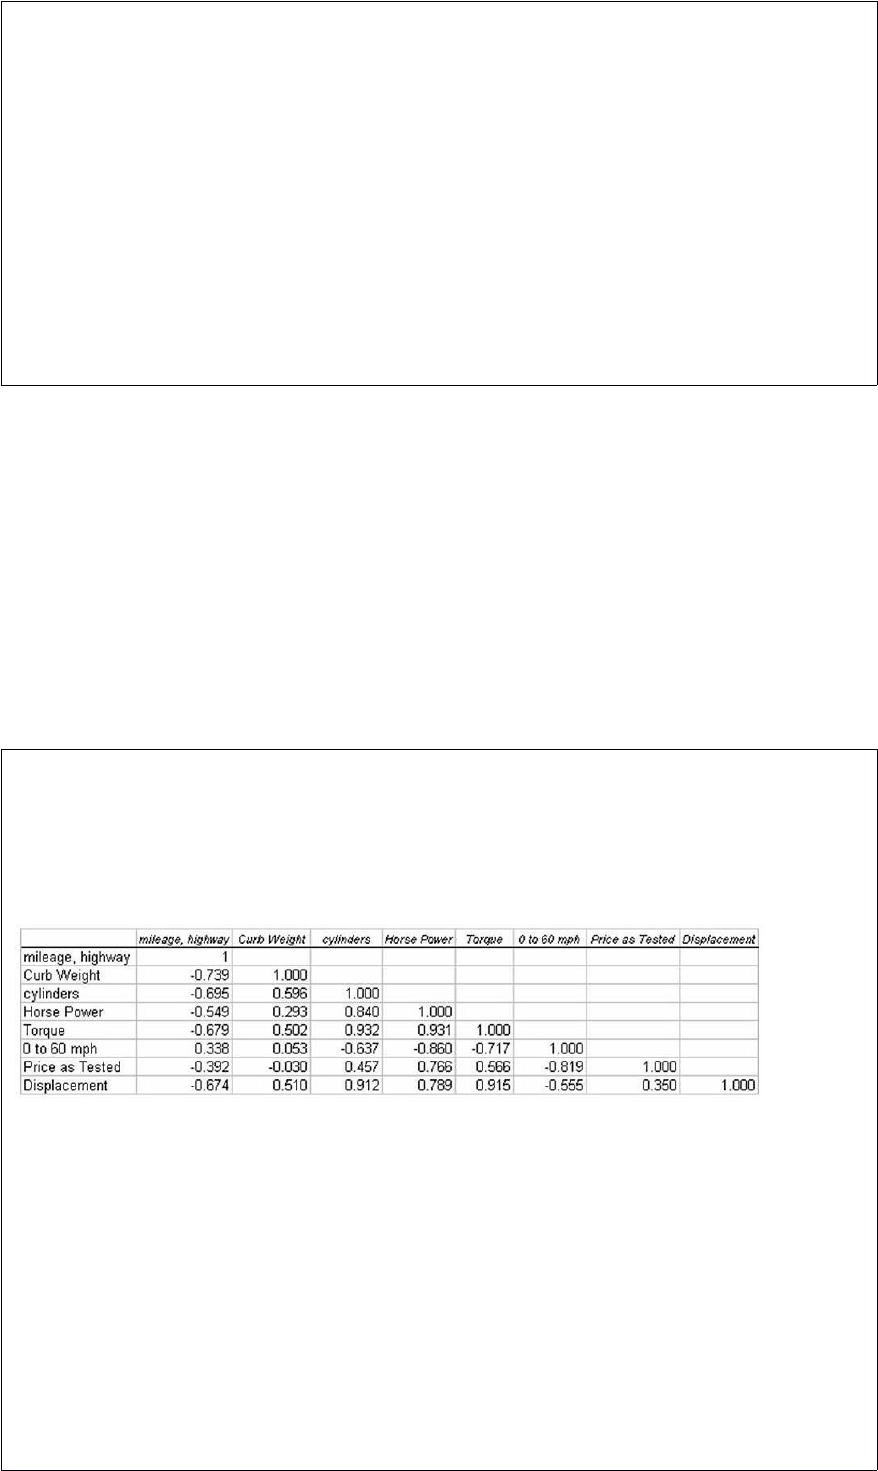
The editors of a national automotive magazine recently studied 30 different automobiles
sold in the United States with the intent of seeing whether they could develop a multiple
regression model to explain the variation in highway mileage per gallon. A number of
different independent variables were collected. The following correlation matrix was
developed:
If only one variable were to be brought into the model, which variable should it be if
the goal is to explain the highest possible percentage of variation in the dependent
variable?
A) 0 to 60 mph
B) Horsepower
C) Curb weight
D) Displacement


For a standardized normal distribution, determine a value, say z0, so that P(0 < z < z0) =
0.4772.
A) 2.00
B) 2.33
C) 1.85
D) 1.66
The URS construction company has submitted two bids, one to build a large hotel in
London and the other to build a commercial office building in New York City. The
company believes it has a 40% chance of winning the hotel bid and a 25% chance of
winning the office building bid. The company also believes that winning the hotel bid is
independent of winning the office building bid.
What is the probability the company will win both contracts?
A) 0.55
B) 0.44
C) 0.10
D) 0.75


An Internet service provider wants to determine its level of customer satisfaction. The
best data collection method to obtain the results most quickly is:
A) experiment.
B) telephone survey.
C) mailed survey.
D) personal interview.
In performing a one-tailed test for the difference between two population variances,
which of the following statements is true?
A) The level of alpha needs to be doubled before finding the F-critical value in the
table.
B) The sample variance that is predicted to be larger in the alternative hypothesis goes
in the numerator when forming the F-test statistic.
C) You always place the larger of the two sample variances in the numerator.
D) The alternative hypothesis must contain the equality.