When the sample size is more than 30 and sigma is known, the population must be
normally distributed to calculate a confidence interval.
Forecasting errors for a time-series technique must always be non-negative (i.e., zero or
positive values).
The maximax criterion is the alternative associated with the highest payoff in the
decision table.
An Internet poll, where individuals may respond to a survey as many times as they
choose to, is an example of a nonprobability sample.
The complement to Event A is defined as all of the outcomes in the sample space that
are not part of Event A.
The Wilcoxon signed-rank test is a nonparametric procedure that can be used to
compare two independent samples.
The sampling distribution for the difference in means is the result of subtracting the
sampling distribution for the mean of one sample from the sampling distribution for the
mean of a second sample.
In a discrete probability distribution, the value of the random variable can fall into more
than one of the frequency distribution classes.
The correlation coefficient is a measure of the slope of the scatter plot for the
independent and dependent variables.
If the Spearman rank-order correlation coefficient is greater than the critical value for
the correlation coefficient when performing a one-tail test of significance, the null
hypothesis is rejected.
Interval data deals strictly with qualitative data assigned to predetermined categories.
Sampling error is the difference between a sample statistic and a population parameter.
Events A and B are considered to be dependent events if the probability of Event A
given the occurrence of Event B is equal to the probability of Event A occurring.
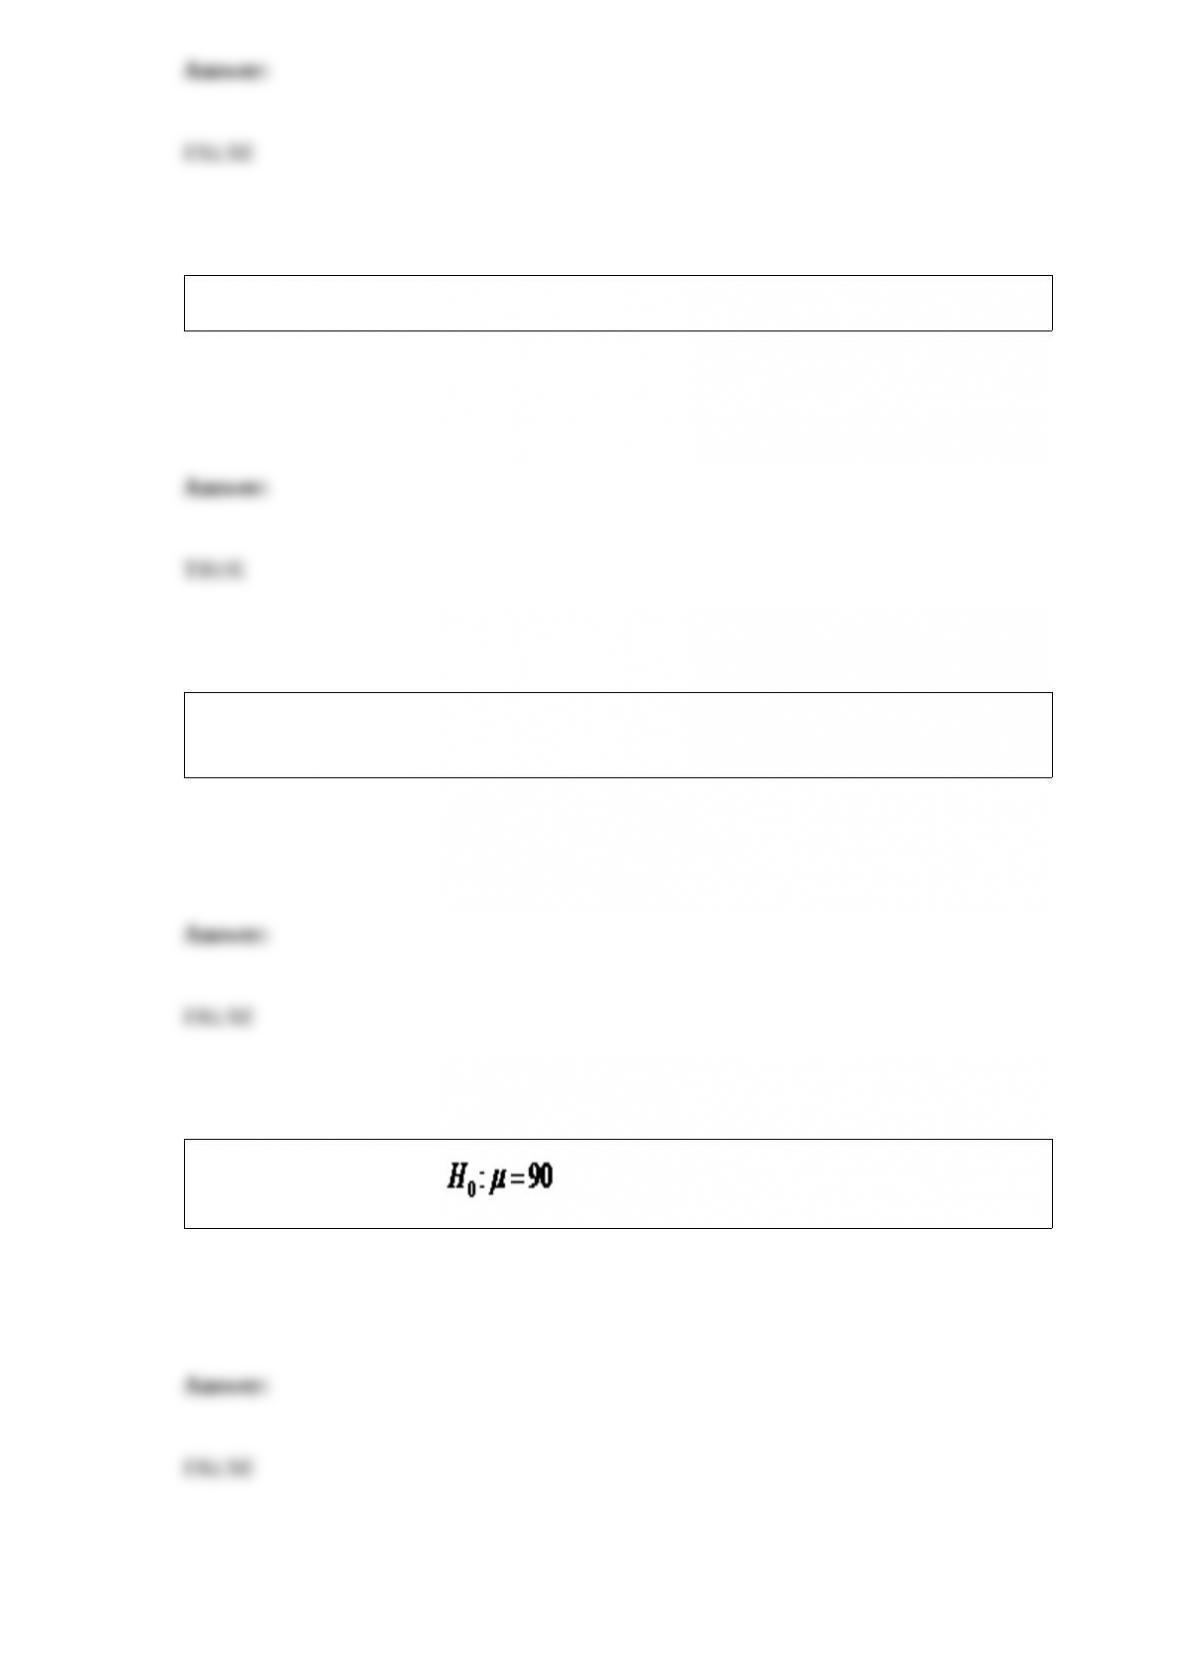
The hypothesis statement is an example of a one-tail hypothesis test.
The presence of autocorrelation in a time series could result in concluding that the
regression coefficient for the trend line is statistically significant when, in reality, it is
not.
If the class sizes are not equal for a frequency distribution using grouped quantitative
data, patterns in the distribution could be misleading.
When testing for the population mean when sigma is known and a sample size is greater
than 30, the population must be normally distributed in order for the conclusions to be
reliable.
The only way to reduce both α and β simultaneously in a hypothesis test is to increase
the sample size.
When the p-value is greater than alpha, the conclusion for the hypothesis test is to reject
the null hypothesis.
A population mean is an example of a statistic.
The level of significance represents the probability of making a Type I error.
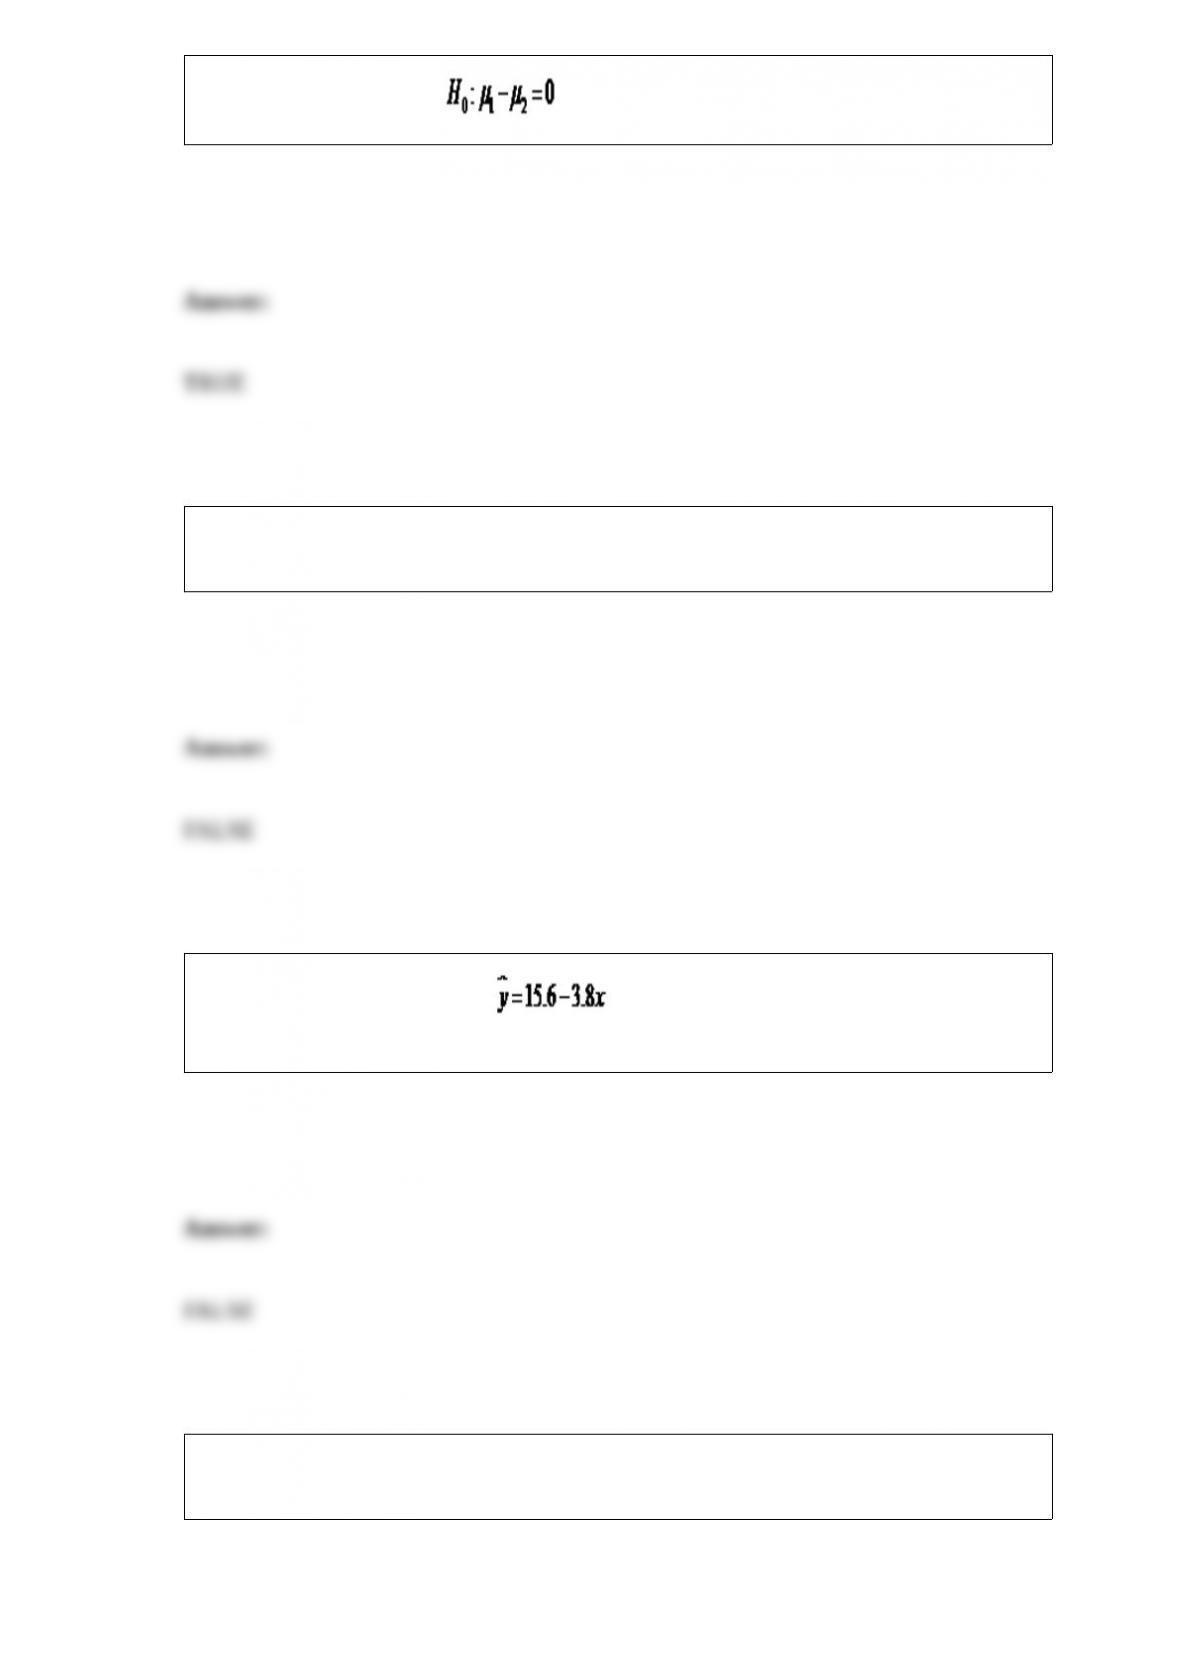
The hypothesis statement is an example of a two-tail hypothesis test.
The mean square error is found by dividing the sum of squares error by the total
number of observations minus one (n ” 1).
Given a regression equation of , a one-unit increase in the independent
variable would result in an average increase of 3.8 for the dependent variable.
Smoothing forecasting techniques work best with data that is fairly consistent over
timedata that is without significant trend, seasonal, or cyclical components.
The observed level of significance is also known as alpha in a hypothesis test.
Consider the relationship between the following variables:
∙ Monthly electricity bill for a household during the summer
∙ Average high ambient temperature during the summer months
Average high ambient temperature during the summer months would be considered the
dependent variable.
For a one-tail (lower) hypothesis test, if the z- or t-test statistic exceeds the critical
value, we do not reject the null hypothesis.
The chi-square goodness-of-fit test is used to determine if two categorical variables are
independent of one another.
The mean square within (MSW) provides a good estimate of the population variance
only if the null hypothesis is true.
When the slope of a population regression line equals zero, we conclude that there is a
linear relationship between the dependent and independent variables.
When performing a hypothesis test that compares the variances of two populations,
always assign the smaller sample variance to Population 1 and the larger sample
variance to Population 2.
A benefit of point estimates is that they provide information about their accuracy.
A coefficient of determination equal to zero indicates that there is no relationship
between the independent and dependent variables.
The sum of all the probabilities for the simple events in the sample space must be equal
to 1.
The MODE.SNGL function in Excel will correctly identify more than one mode in a
data set.
A dependent variable, x, explains the variation in another variable, which is called the
independent variable, y.
If adding an independent variable results in a reduction in the adjusted , we
have evidence that the new variable might not be contributing enough explanation of
the dependent variable to remain in the model.
If the seasonal component of a time series consists of five seasonal categories (i.e.,
Monday, Tuesday, Wednesday, Thursday, and Friday), five dummy variables are needed
for the forecasting regression model.
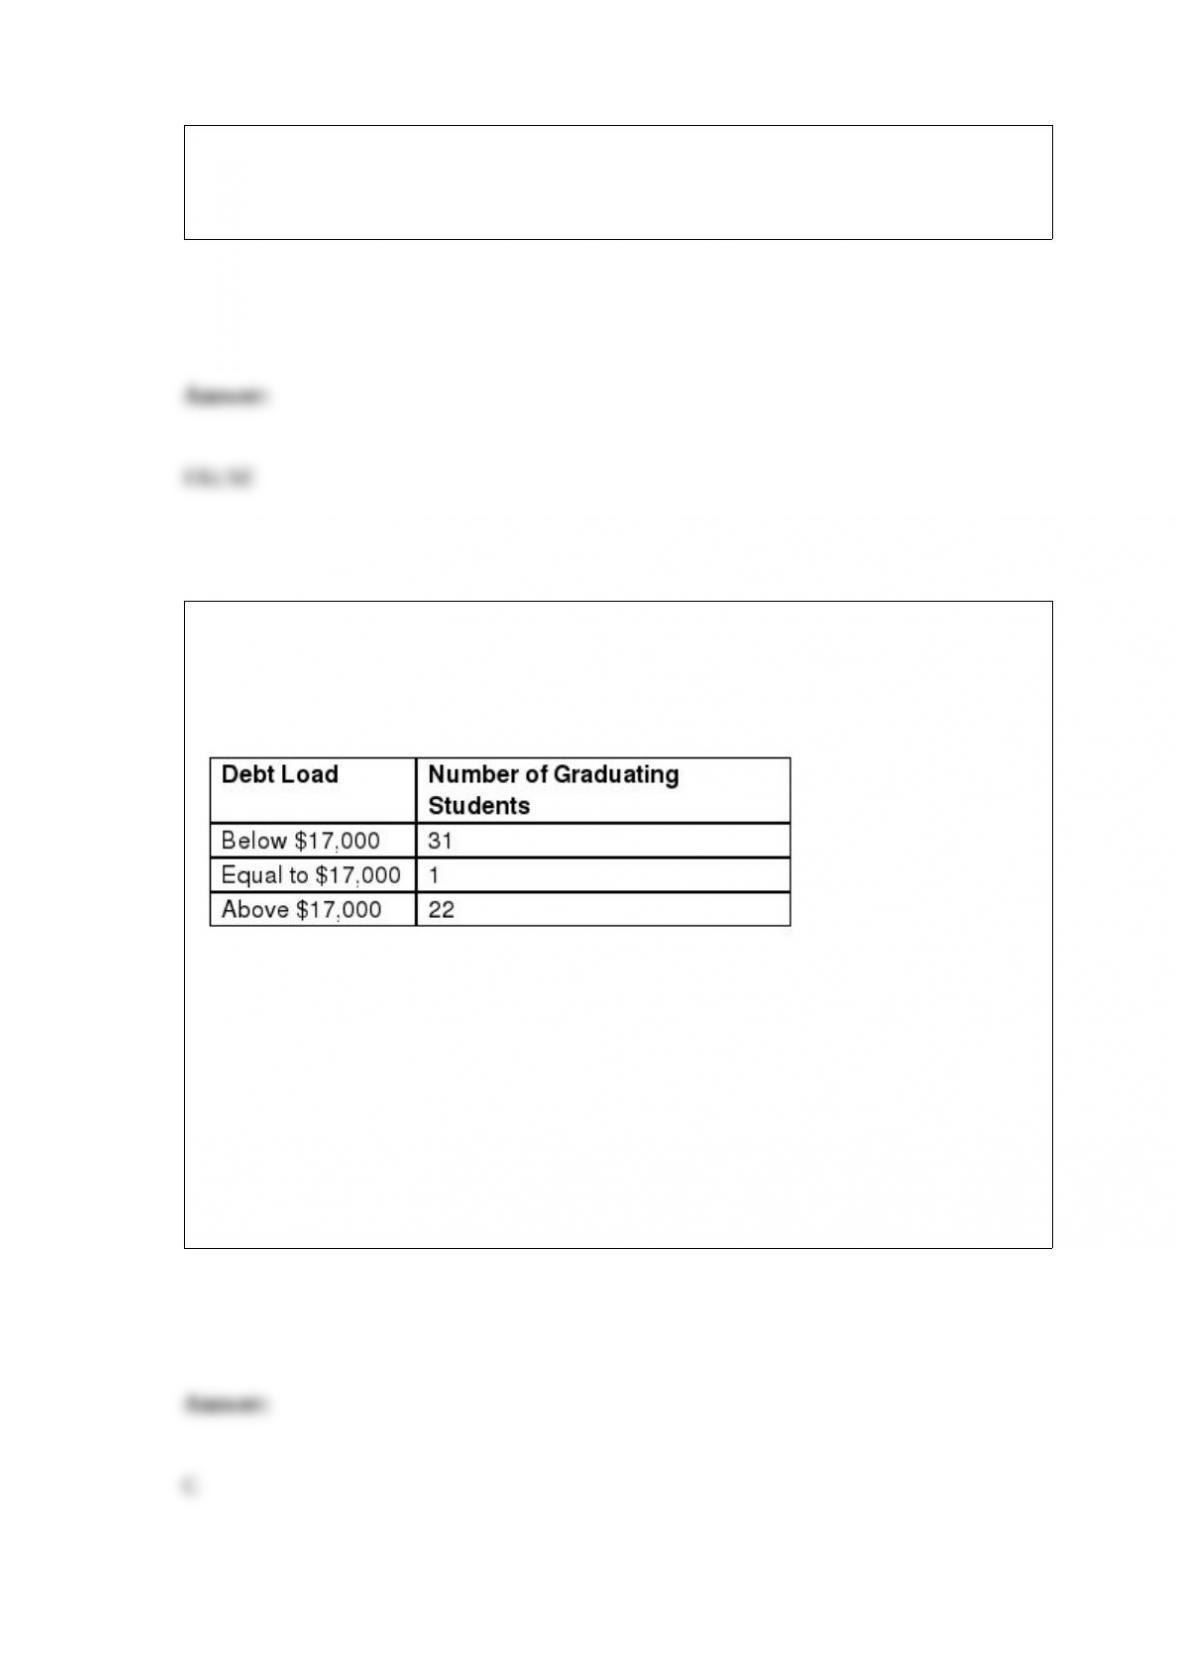
The Department of Education would like to test the hypothesis that the median debt
load of graduating students with a Bachelor’s degree is equal to $17,000. The following
table summarizes the debt load of a random sample of graduating students with a
Bachelor’s degree.
The sample size, n, for this hypothesis test is ________.
A) 22
B) 31
C) 53
D) 54
Use the information below to answer the following question(s).
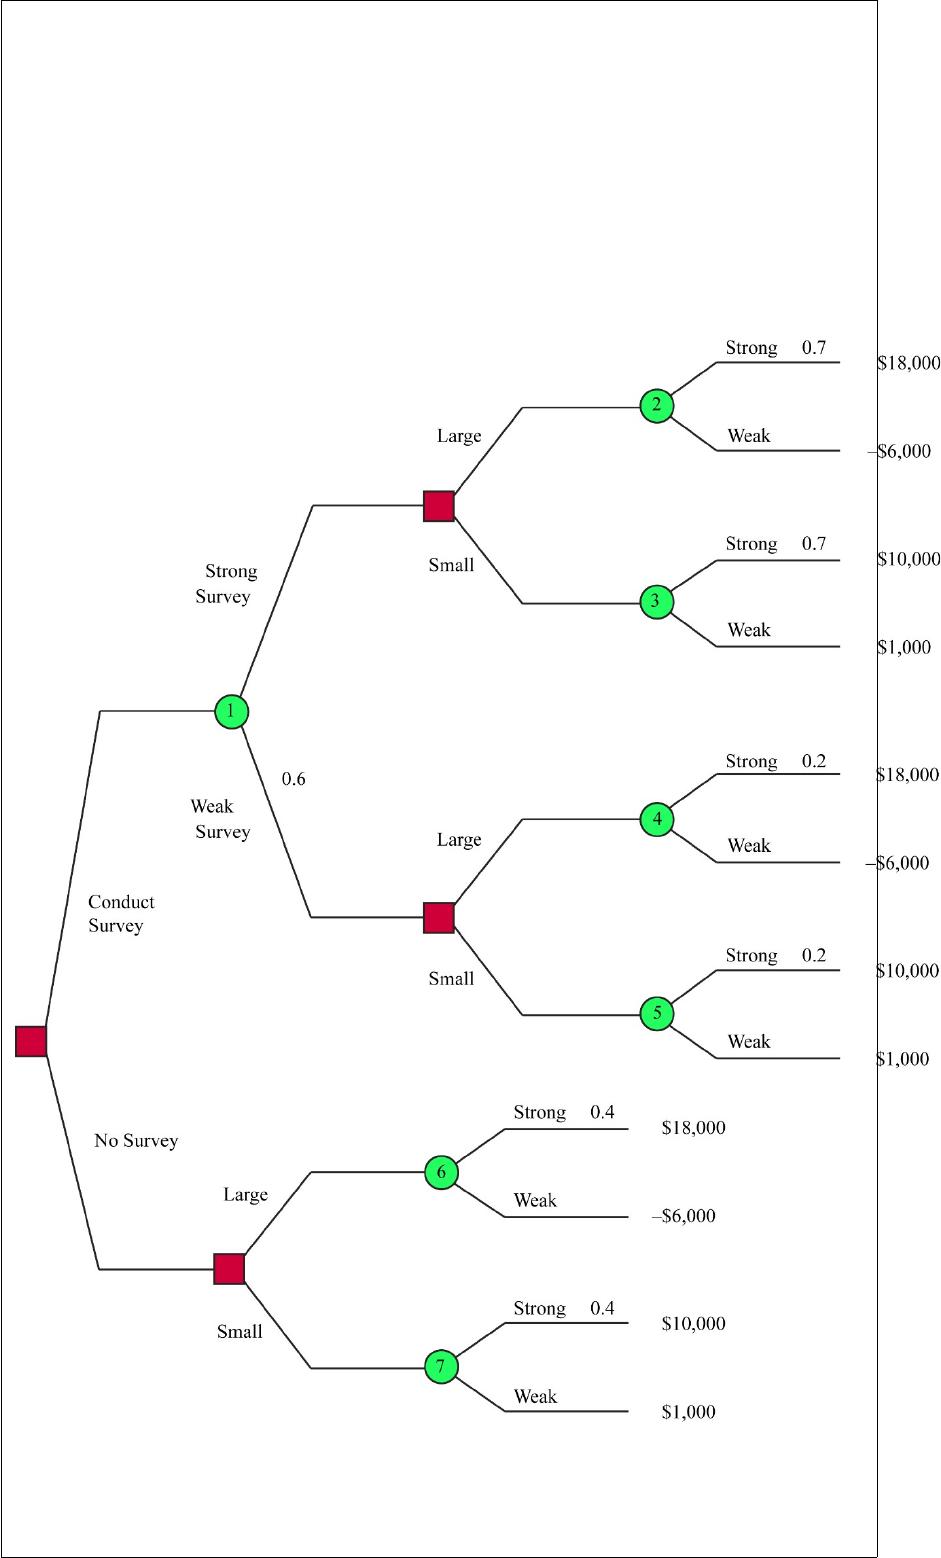
The following decision tree is partially completed for a company that is deciding to
build a large or small facility for a new product that will face demand that is strong or
weak. The company has an option to perform a market survey that will cost $4,000 that
will predict a strong or weak market. The payoffs for each combination of facility size
and demand are also shown.
The expected value of sample information, in thousands of dollars is _________.
A) $1,000

B) $1,400
C) $1,900
D) $2,200
The test statistic for a hypothesis test
_________________________________________.
A) determines the observed level of significance
B) is based on the significance level and determines the boundary for the rejection
region
C) represents the number of standard deviations between the sample mean and the
population mean according to the alternative hypothesis
D) represents the number of standard deviations between the sample mean and the
population mean according to the null hypothesis
According to the Mortgage Bankers Association, 11% of U.S. mortgages were
delinquent last year. A delinquent mortgage is one that has missed at least one payment
but has not yet gone to foreclosure. A random sample of six mortgages was selected.
What is the mean of this distribution?
A) 0.31
B) 0.66
C) 0.74
D) 0.93
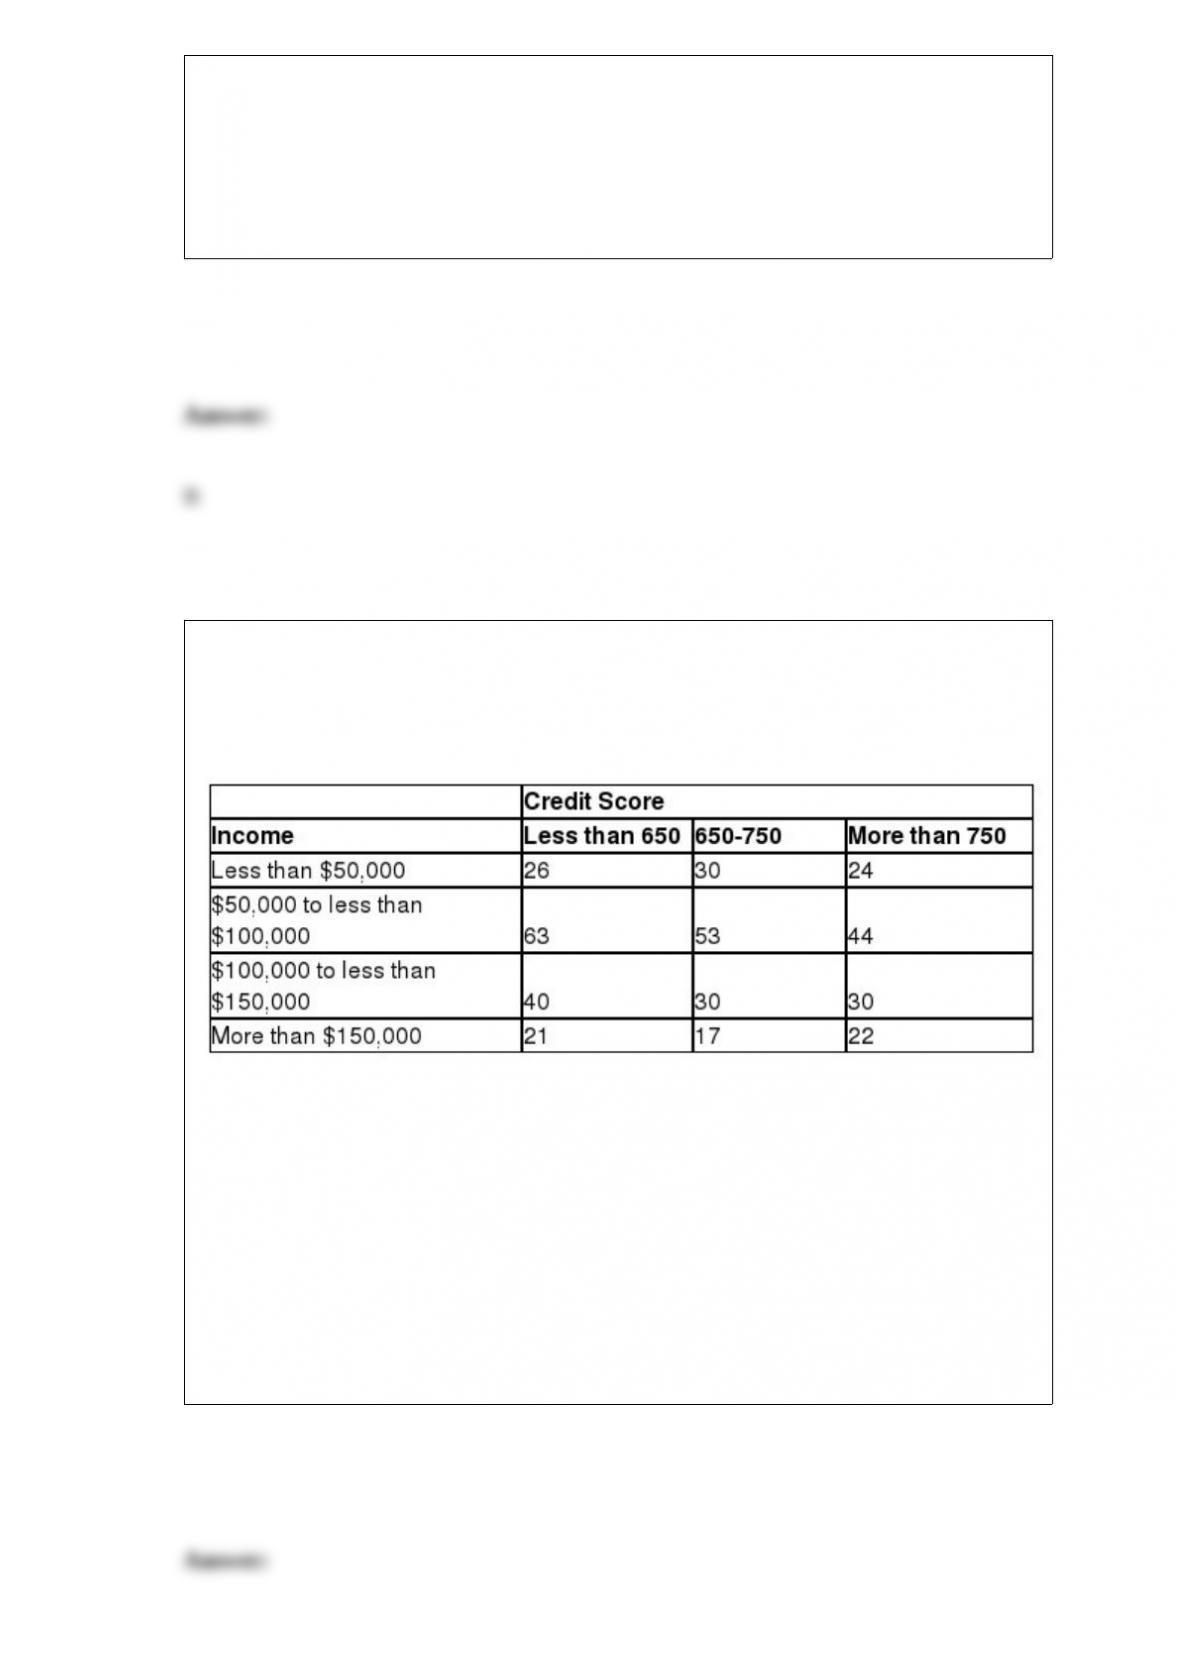
Suppose Bank of America (B of A) would like to investigate if credit score and income
level of an individual are independent of one another. B of A selected a random sample
of 400 adults and asked them to report their credit score range and their income range.
The following contingency table presents these results.
The expected number of individuals with income more than $150,000 and a credit score
more than 750 is ________.
A) 18.0
B) 24.0
C) 37.5
D) 48.0
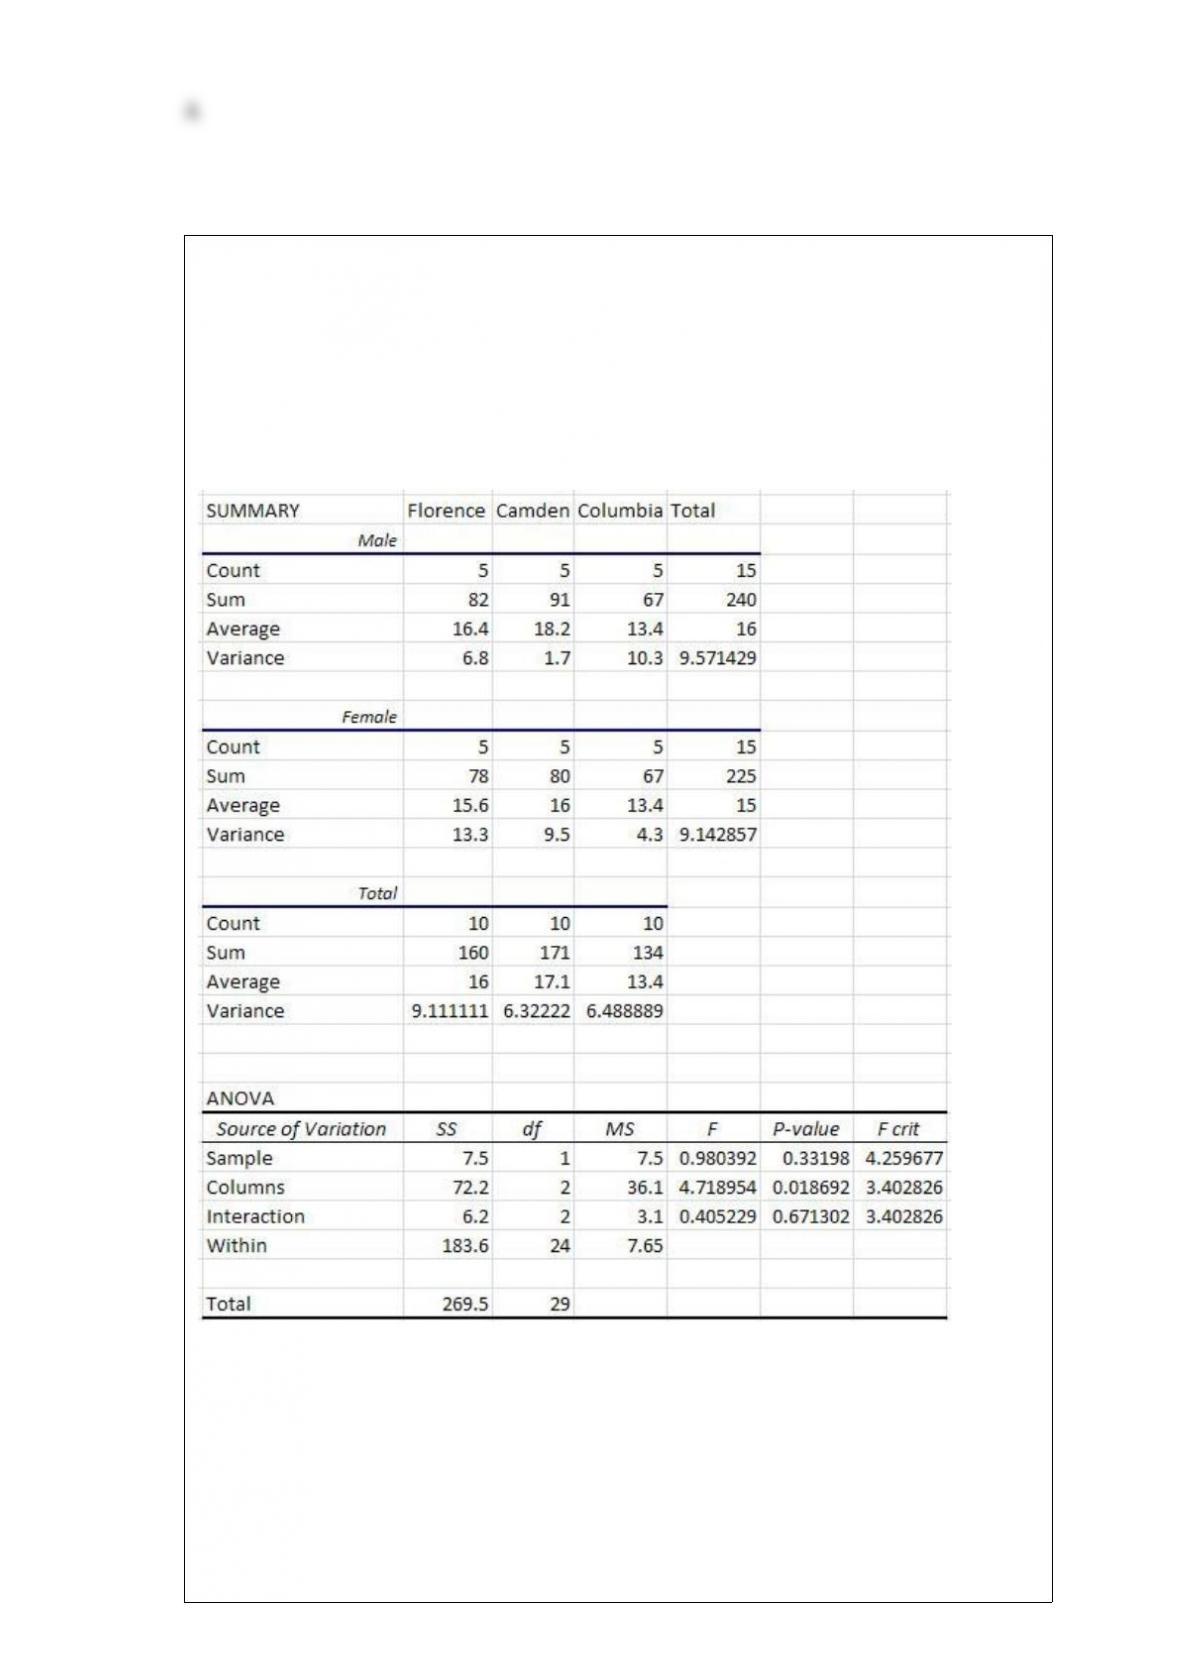
Sara is a regional manager for a restaurant chain that has locations in the towns of
Florence, Camden, and Columbia. A random sample of customers at all three locations
were asked to rate their satisfaction level on a scale of 1 to 20. A two-way ANOVA
procedure was performed on this data using α = 0.05 with Factor A representing each
location and Factor B representing the customer ‘s gender. The results are summarized
below in the ANOVA table.
The Tukey-Kramer critical range for Factor A using α = 0.05 is ________.
A) 0.83
B) 1.06
C) 3.09
D) 4.60
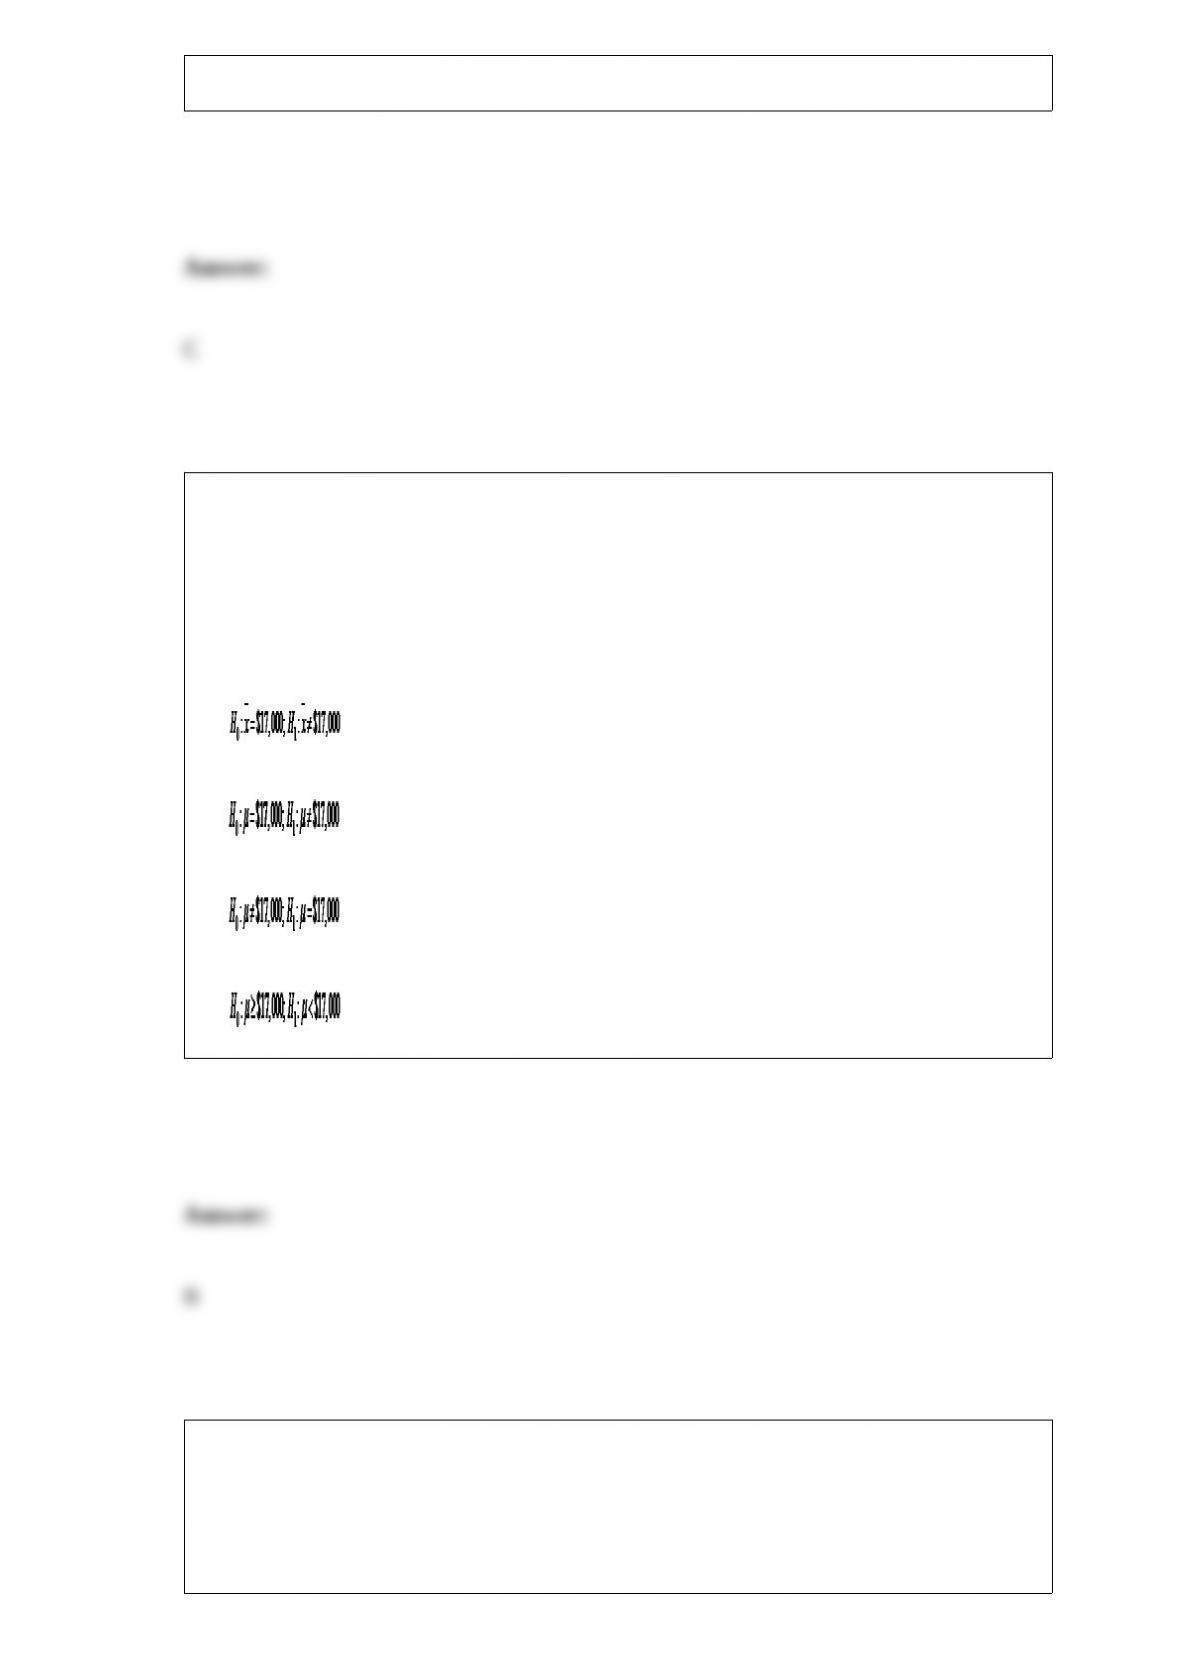
The Department of Education would like to test the hypothesis that the average debt
load of graduating students with a Bachelor’s degree is equal to $17,000. A random
sample of 34 students had an average debt load of $18,200. It is believed that the
population standard deviation for student debt load is $4,200. The Department of
Education would like to set α = 0.05. The correct hypothesis statement for this
hypothesis test would be _________________.
A)
B)
C)
D)
Use the following information to answer the question(s) below.
A home appraisal company would like to develop a regression model that would predict
the selling price of a house based on the age of the house in years (Age), the living area
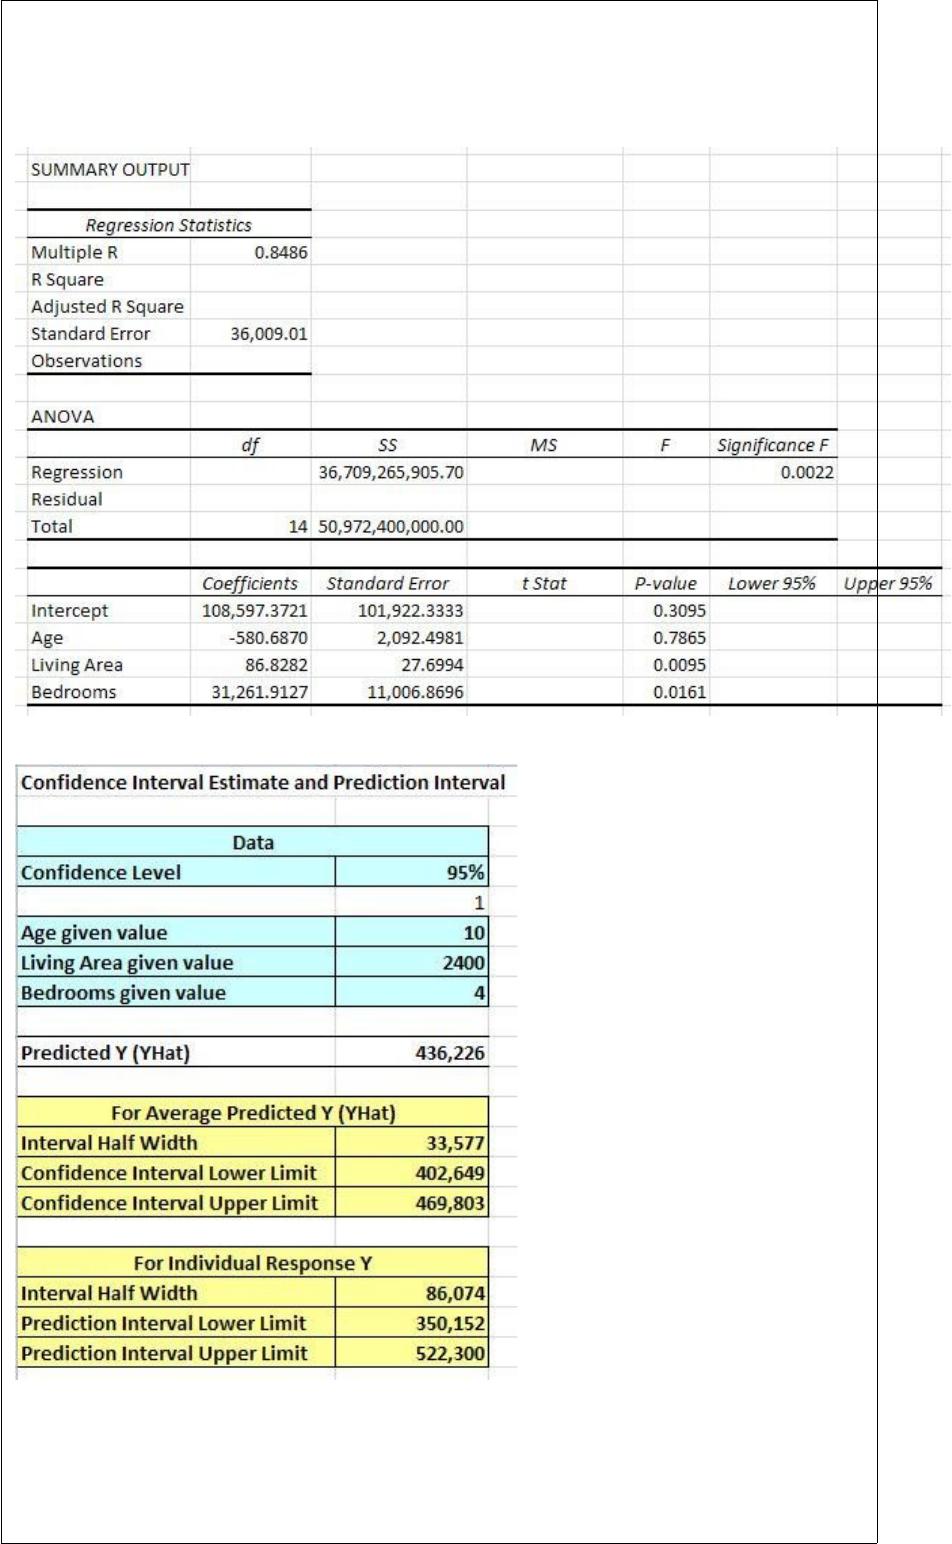
of the house in square feet (Living Area) and the number of bedrooms (Bedrooms). The
following Excel output shows the partially completed regression output from a random
sample of homes that have recently sold.
The test statistic for testing the significance of the Living Area variable is ________.
A) 3.135
B) 3.857
C) 4.690
D) 5.028
Use the following information to answer the question(s) below.
Ford would like to develop a regression model that would predict the number of cars
sold per month by a dealership employee based on the employee’s number of years of
sales experience (Exp), the employee’s weekly base salary before commissions (Salary),
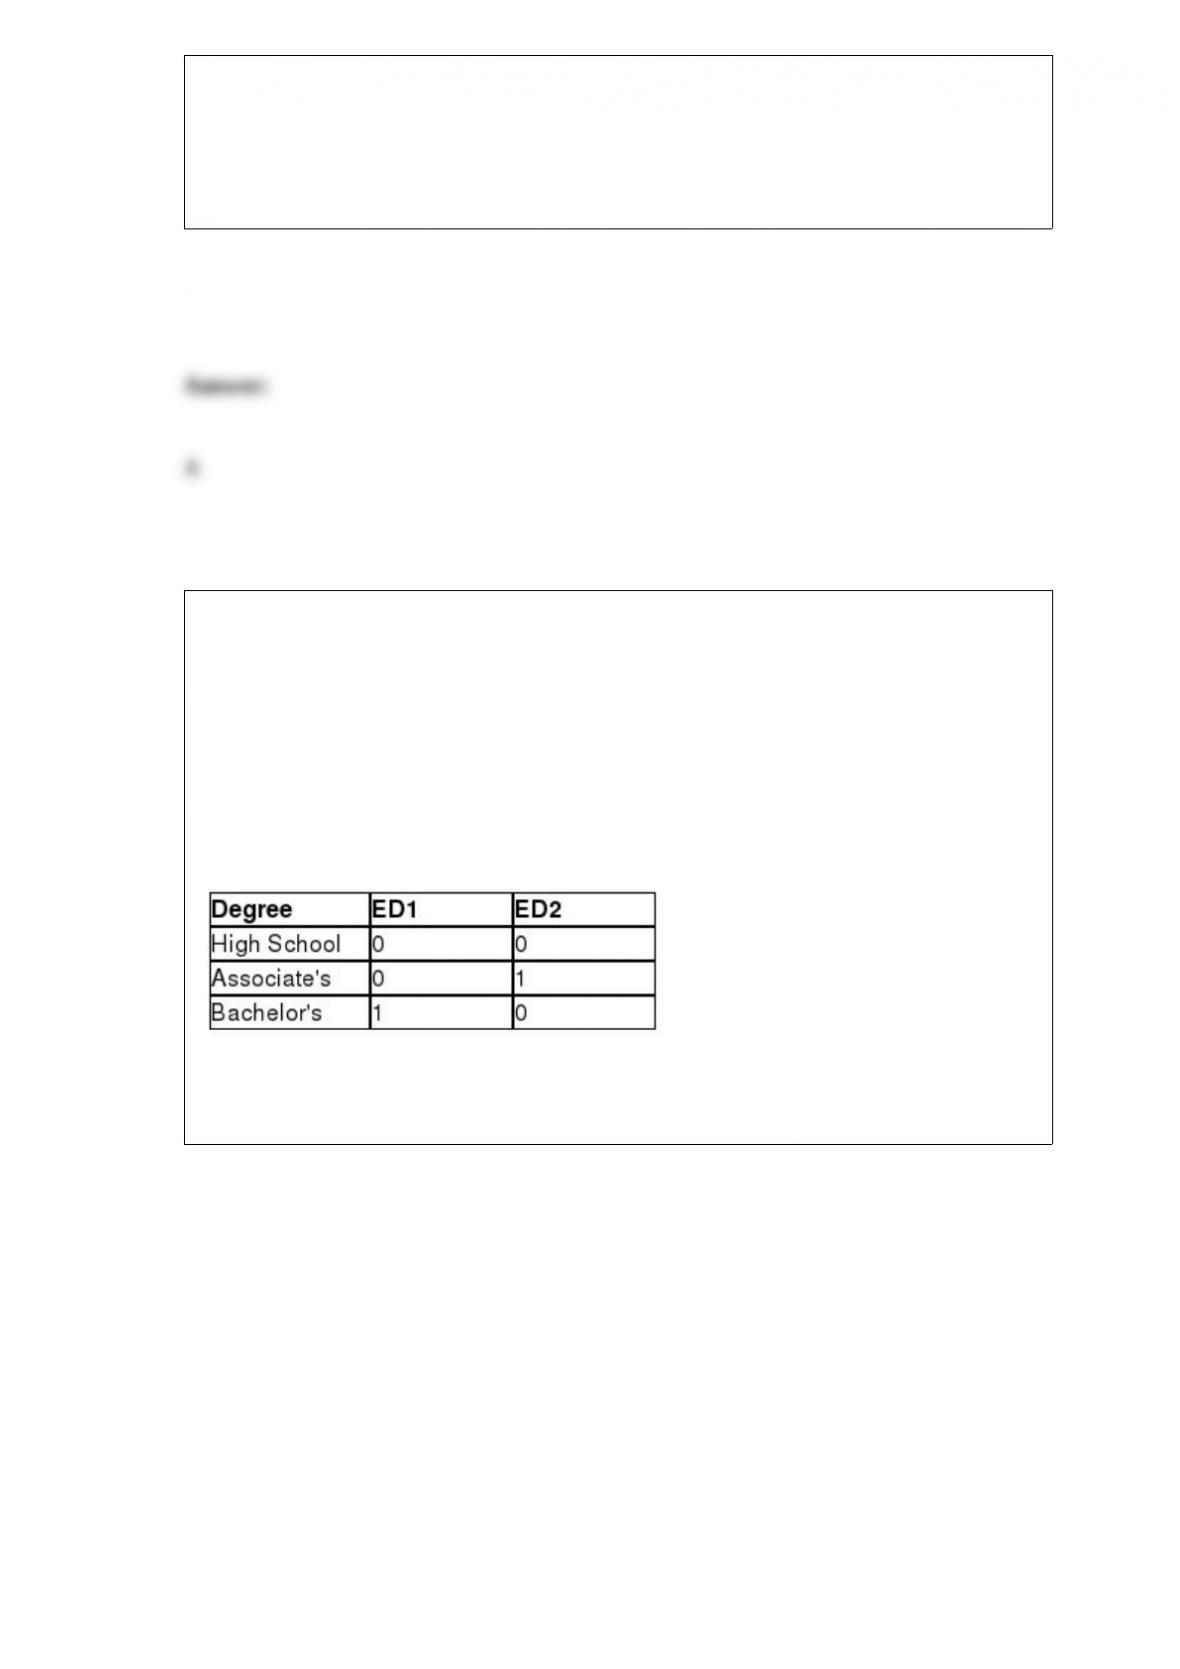
and the education level of the employee. There are three levels of education in the sales
forcehigh school degree, associate’s degree, and bachelor’s degree. The following
dummy variables have been defined.
The following Excel output shows the partially completed regression output from a
random sample of employees from the previous month.
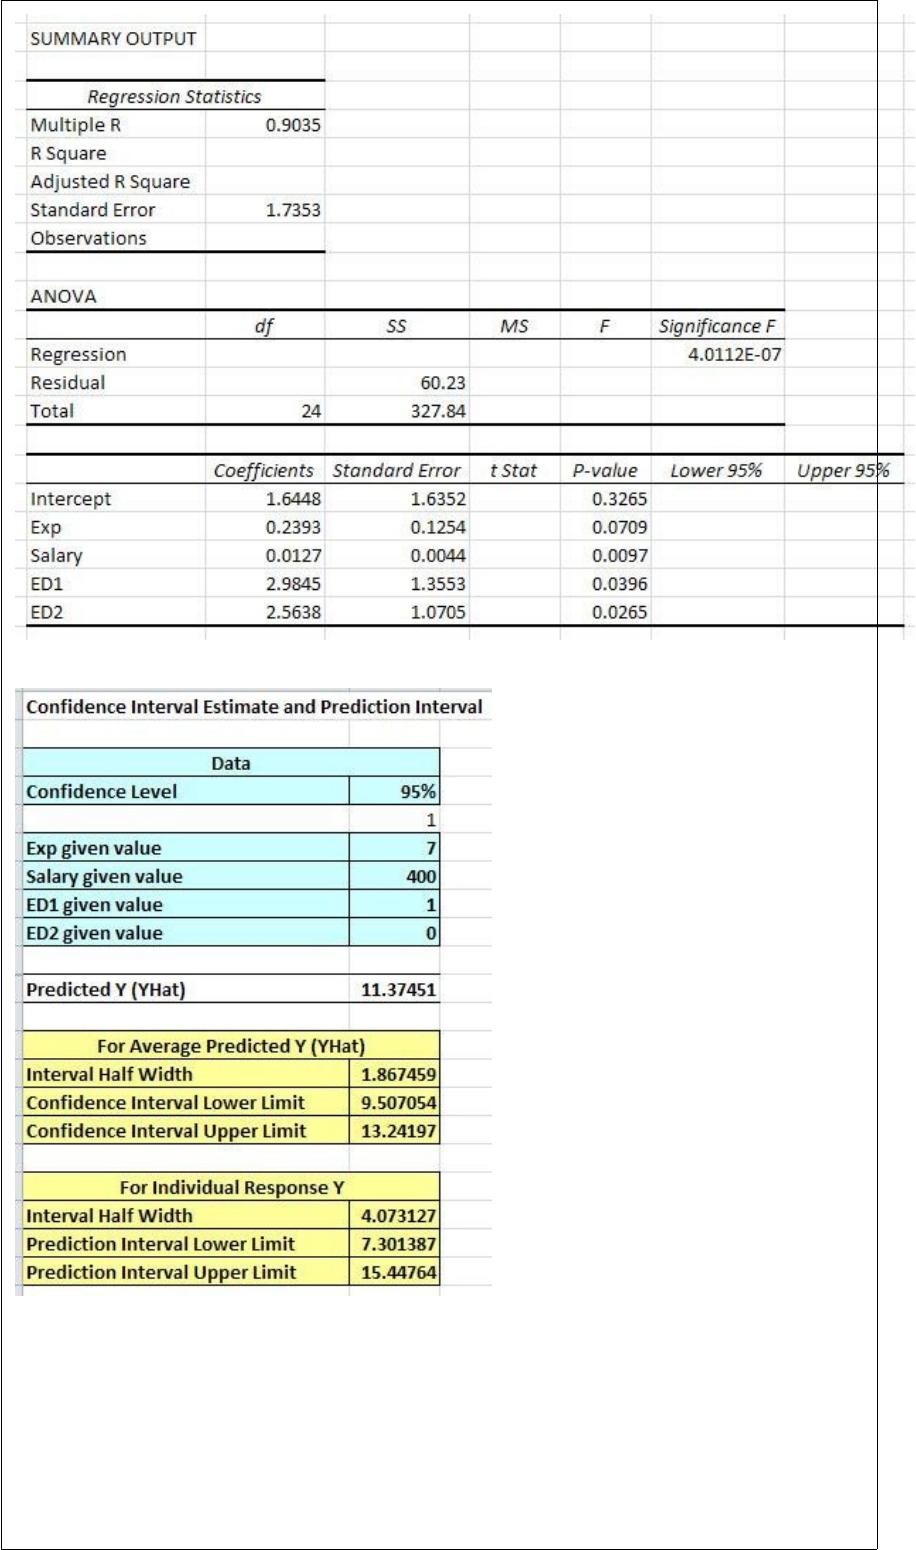
The 95% confidence interval for the regression coefficient for the Salary variable is
________.
A) (-0.247, 0.273)
B) (-0.178, 0.203)

C) (-0.09, 0.113)
D) (0.004, 0.022)
According to the Entertainment Software Association, the average age of “gamers”
(those that routinely play video games) is 30 years old. A random sample of 33 gamers
people had an average age of 32.7 years old. Assume that the population standard
deviation for the age of gamers is 4.6 years. Use a 90% confidence interval to test the
validity of this report and choose the one statement that is correct.
A) Because this confidence interval does not include 30 years, the report by the
Entertainment Software Association is not validated.
B) Because this confidence interval does not include 30 years, the report by the
Entertainment Software Association is validated.
C) Because this confidence interval does include 30 years, the report by the
Entertainment Software Association is validated.
D) Because this confidence interval does include 30 years, the report by the
Entertainment Software Association is not validated.
The sum of squares within (SSW) measures the variation between each data value of the
grand mean for all of the data.
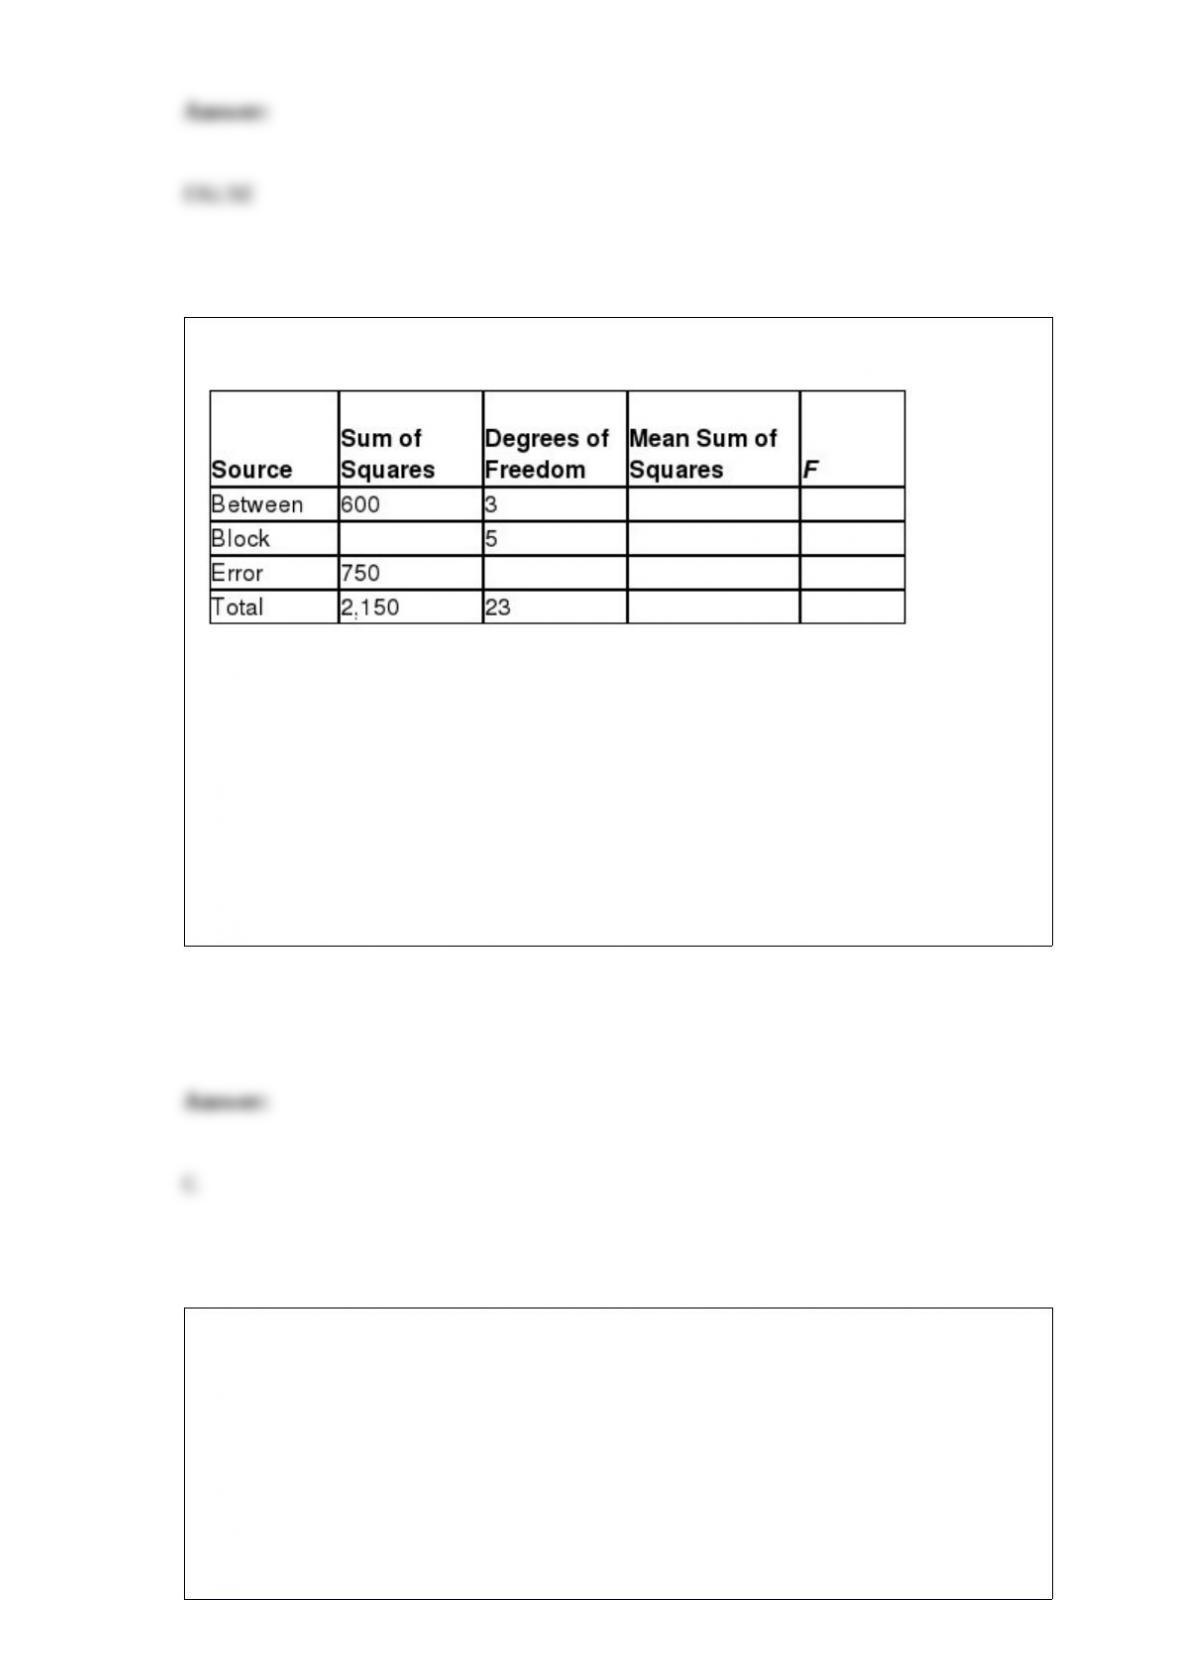
Consider the partially completed randomized block ANOVA summary table.
The mean square between for this ANOVA procedure is _______.
A) 50
B) 160
C) 200
D) 410
Suppose the round-trip airfare between Philadelphia and Los Angeles a month before
the departure date follows the normal probability distribution with a mean of $387.20
and a standard deviation of $68.50. The interval around the mean that contains 95% of
the airfares is ________.
A) $352.95, $421.45
B) $318.70, $455.70
C) $284.45, $489.95
D) $250.20, $524.20
John’s commute time to work during the week follows the normal probability
distribution with a mean time of 26.7 minutes and a standard deviation of 5.1 minutes.
What is the probability that the commute time for a randomly selected day will be more
than 30 minutes?
A) 0.0401
B) 0.0885
C) 0.1977
D) 0.2578
The following data represent the number of refrigerators sold for each of the past five
months for Templeton Appliances.

Using an exponential smoothing technique with alpha equal to 0.8, the forecasting error
for Month 5 is ________.
A) 6.5
B) -5.2
C) -7.4
D) 10.0
The ________ confidence interval is a “workhorse” in the field of statistics and is seen
far more than any other confidence level.
A) 90%
B) 95%
C) 99%
D) 100%
Costco sells paperback books in their retail stores and wanted to examine the
relationship between price and demand. The price of a particular novel was adjusted
each week and the weekly sales were recorded in the table below.
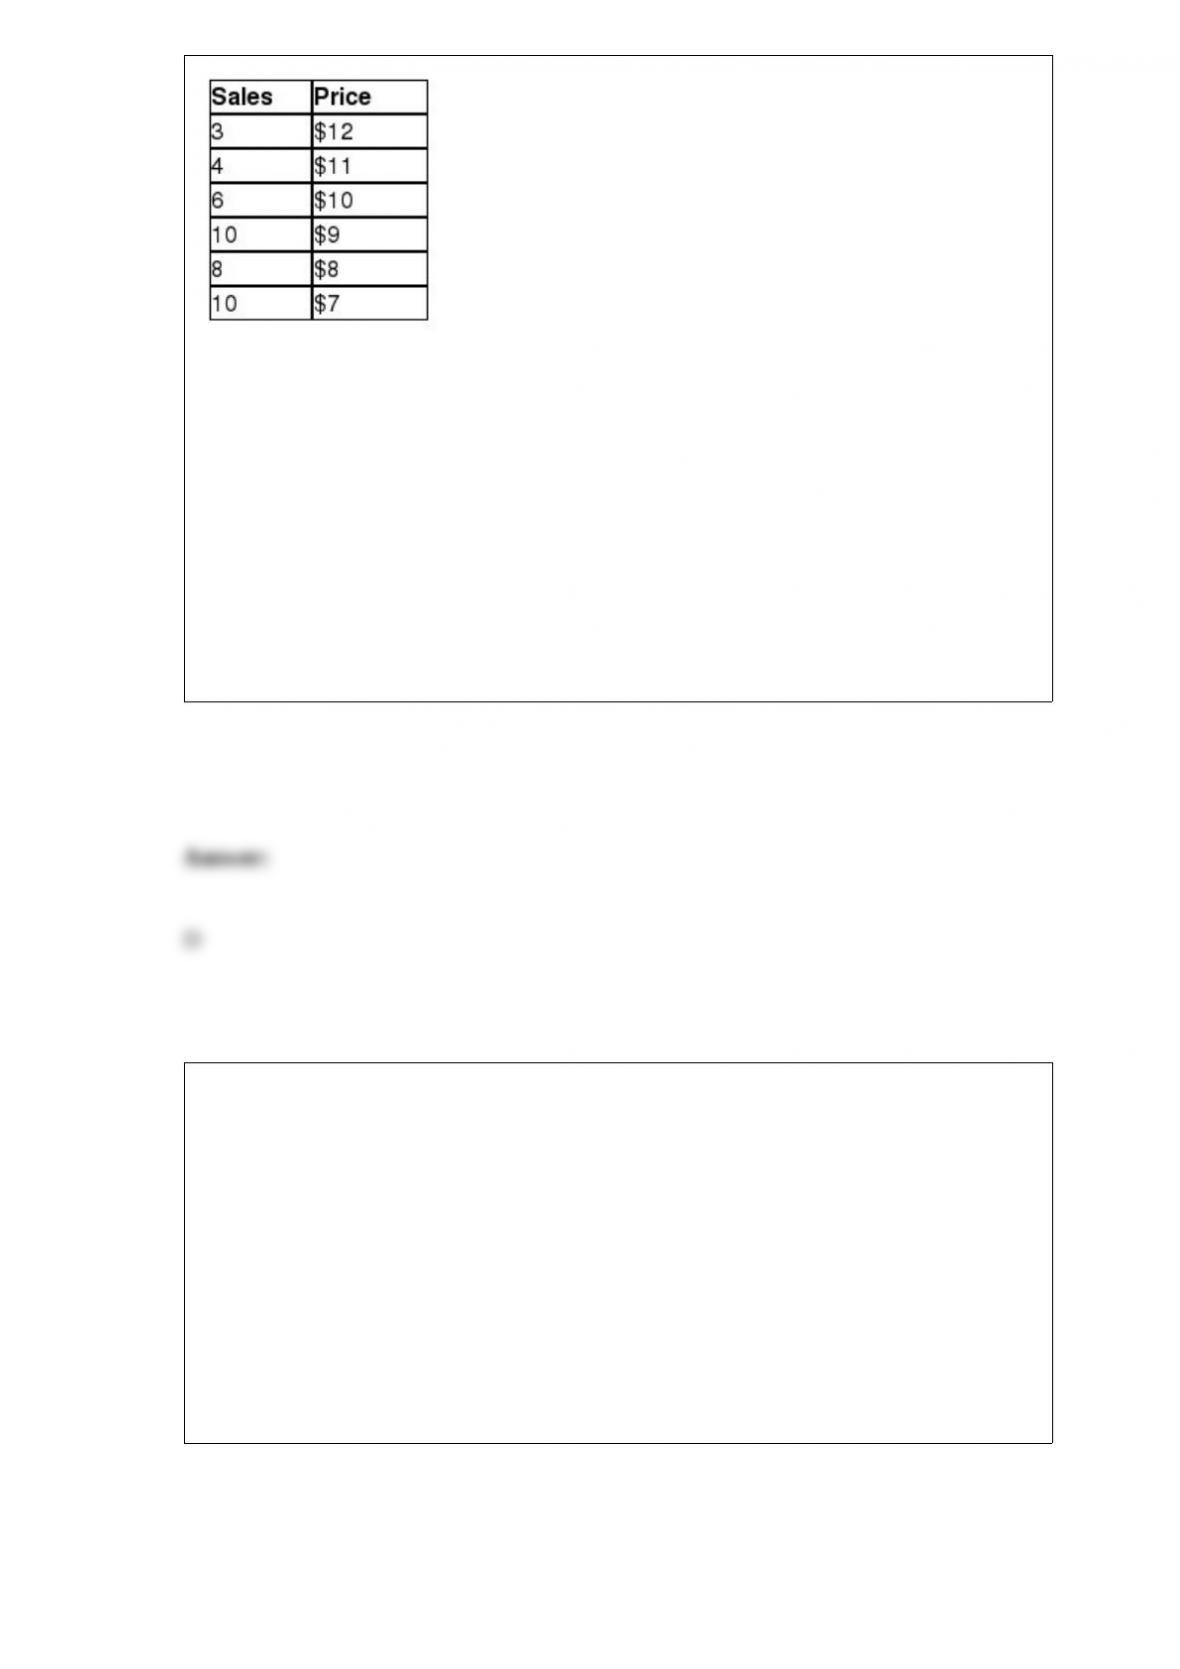
Management would like to use simple regression analysis to estimate weekly demand
for this novel using the price of the novel. The test statistic for testing the hypothesis
that the population coefficient of determination is greater than zero is ________.
A) 5.60
B) 8.66
C) 12.18
D) 19.50
Bananas are sold in bunches at a grocery store and typically consist of 4-8 bananas per
bunch. Suppose the weight of these bunches follows a normal distribution with a mean
of 3.54 pounds and a standard deviation of 0.63 pounds. What is the probability that a
randomly selected bunch of bananas will weigh between 3.6 and 4.2 pounds?
A) 0.2676
B) 0.3133
C) 0.4090
D) 0.4641

Nationwide Insurance would like to perform a chi-square test to investigate whether a
difference exists in the proportion of male and female teenagers who text while they
drive. A random sample of 80 male teenagers found that 50 indicated they texted while
driving. A random sample of 120 female teenagers found that 65 indicated they texted
while driving. The chi-square test statistic for this sample is ________.
A) 1.36
B) 2.98
C) 4.05
D) 4.22
A random sample of 25 roundtrip flights between Philadelphia and Dallas has an
average airfare of $393.50 with a sample standard deviation of $50.30. The margin of
error for a 90% confidence interval around this sample mean is ________.
A) 10.6
B) 14.1
C) 17.2
D) 22.9

Use the following information to answer the question(s) below.
The National Football League has developed a regression model to predict the number
of wins during a season for a team using the following independent variables:
•Average points per game during the season (PPG)
•Average number of penalties committed per game during the season (PEN)
•Turnover differential during the season (TO)
Turnover differential is defined as the number of times the team took the ball away from
their opponent with a turnover minus the number of times the team gave the ball away to
their opponent with a turnover. For example, if TO = +5, the team had five more
takeaways than giveaways. If TO = “7, the team had seven more giveaways than
takeaways during the season.
The following Excel output shows the partially completed regression output from a
random season.
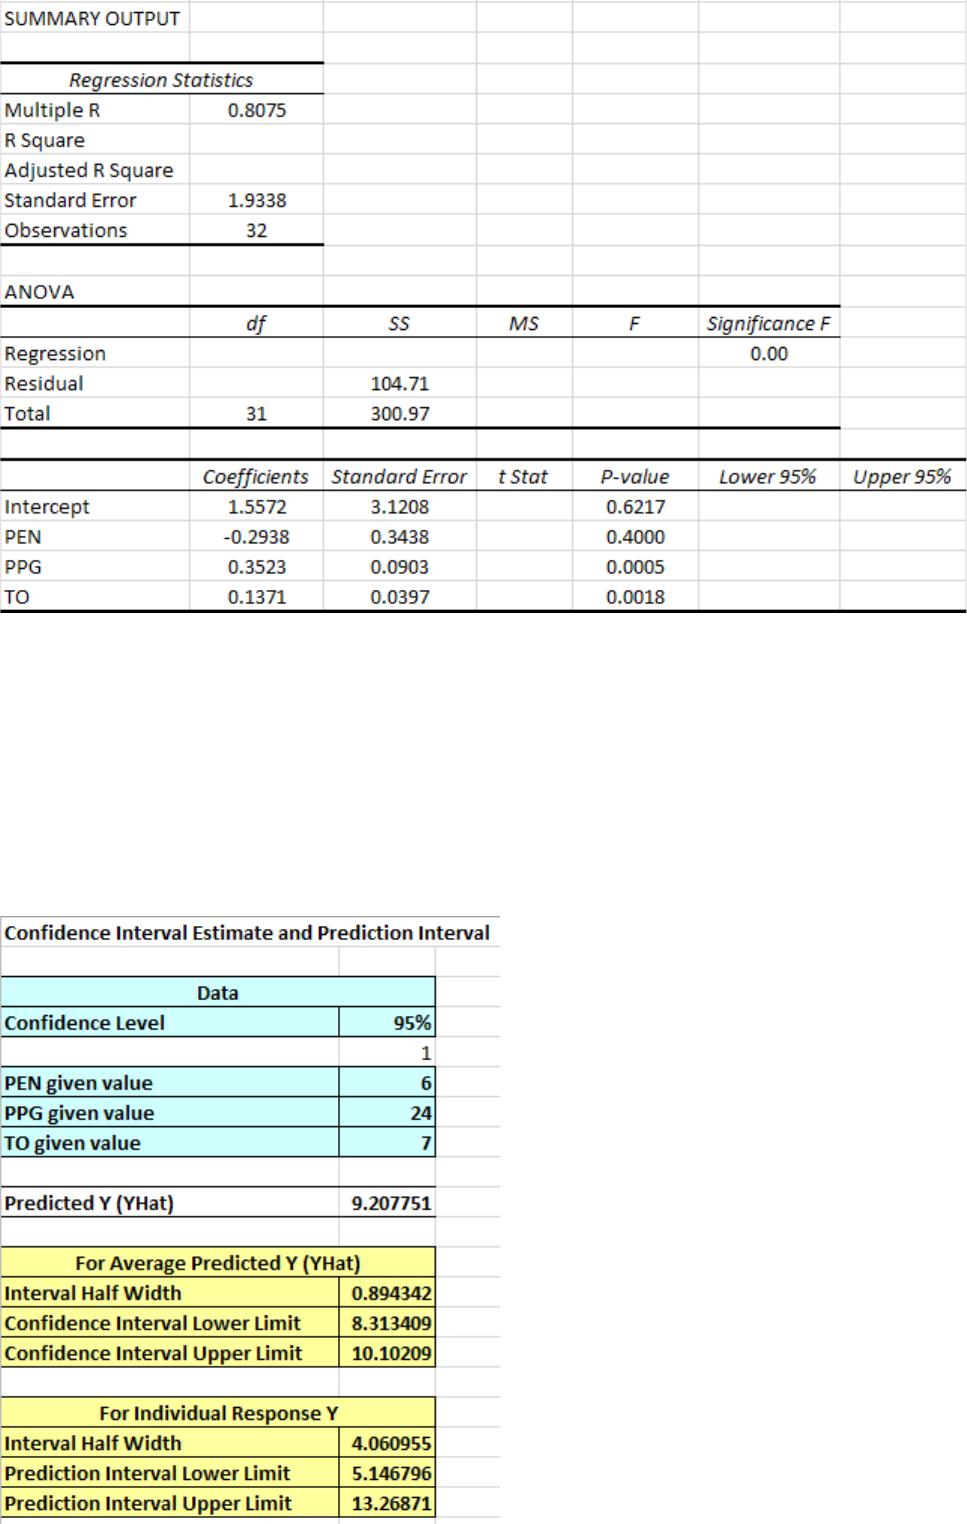
The critical value to test the significance of the regression coefficients using α = 0.05 is
________.
A) 1.831
B) 1.945
C) 2.048
D) 2.201
________data are values that correspond to specific measurements taken over a range
of time periods.
A) Cross-sectional
B) Ordinal
C) Time series
D) Ratio
According to the MIT Airline Data Project, American Airlines controlled 15.5% of the
domestic market during a recent year. A random sample of 125 domestic passengers

that year was selected. Using the normal approximation to the binomial distribution,
what is the probability that more than 12 passengers from this sample were on
American Airline flights?
A) 0.6368
B) 0.7995
C) 0.9207
D) 0.9554
The chi-square test requires that each expected frequency be equal to or greater than
________.
A) 5
B) 10
C) 20
D) 30
A random sample of 16 roundtrip flights between Philadelphia and Dallas has an
average airfare of $422.10 with a sample standard deviation of $56.30. The 98%
confidence interval around this sample mean is ________.
A) ($415.06, $429.14)
B) ($400.99, $443.21)
C) ($365.80, $478.40)
D) ($385.48, $458.72)
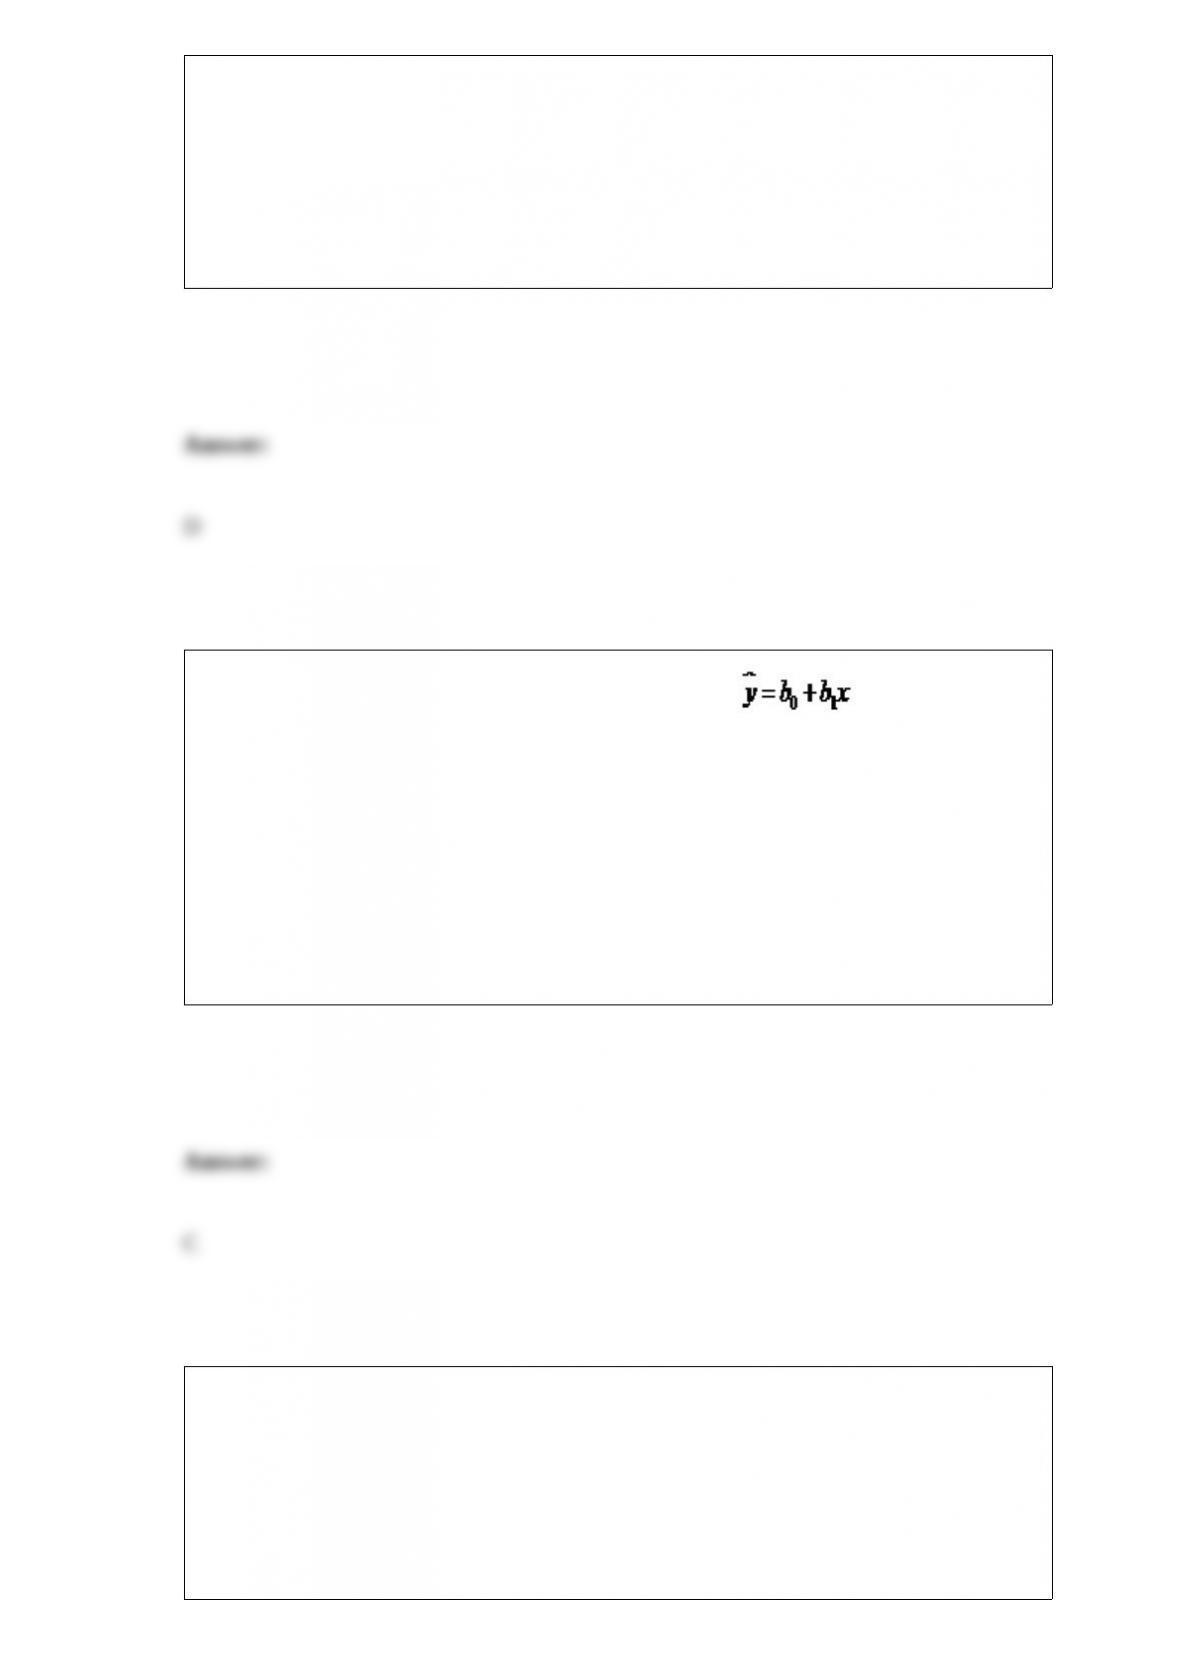
The formula for the equation describing a straight line is . The value for a in
this equation represents the ________________________________.
A) predicted value of y given a value of x
B) independent variable
C) y-intercept of the straight line
D) slope of the straight line
________ regression brings one independent variable into the model at a time and does
not allow any variables to leave once they have entered.
A) Best subsets
B) General stepwise

C) Backward elimination
D) Forward selection
According to the Centers for Medicare & Medicaid Services, 21% of nursing homes in
the United States received five stars in overall ratings on a scale of 1 to 5. A random
sample of seven nursing homes was selected. What is the standard deviation of this
distribution?
A) 1.078
B) 1.338
C) 1.535
D) 1.928
Costco sells paperback books in their retail stores and wanted to examine the
relationship between price and demand. The price of a particular novel was adjusted
each week and the weekly sales were recorded in the table below.
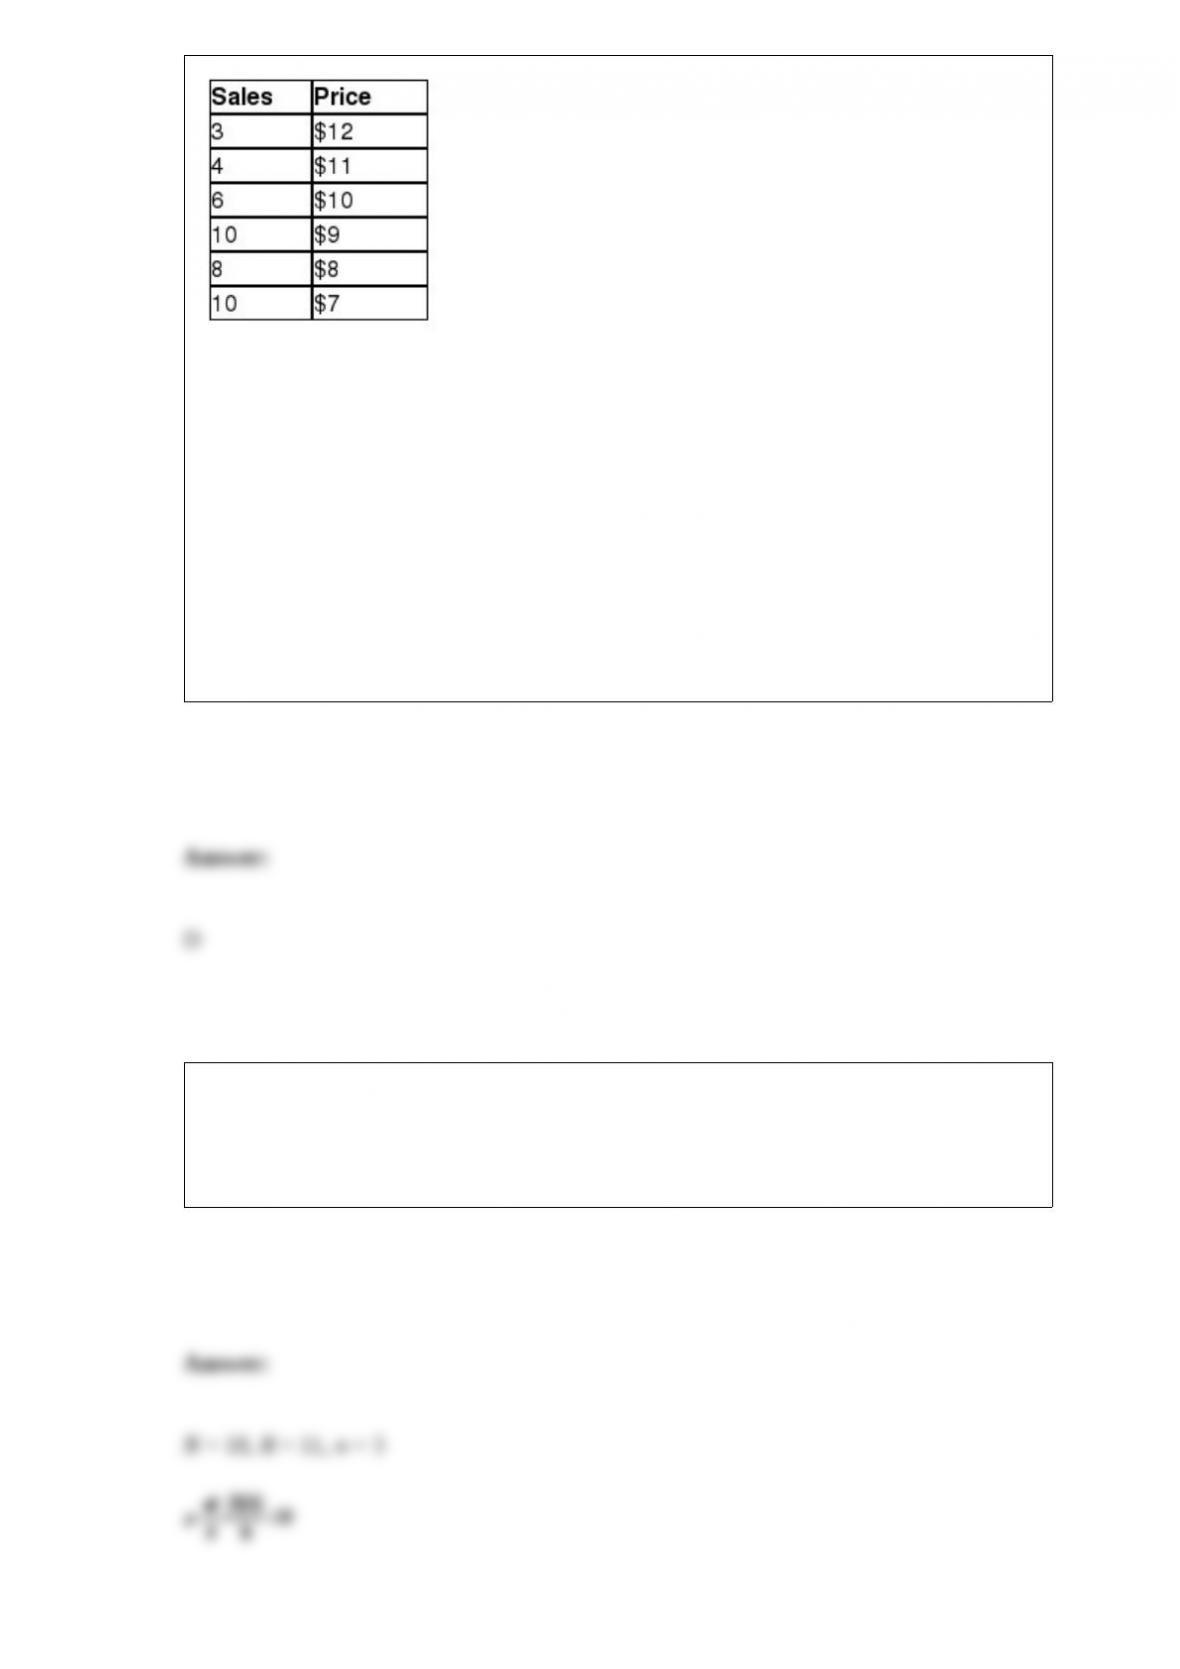
Management would like to use simple regression analysis to estimate weekly demand
for this novel using the price of the novel. The slope for the regression equation is
________.
A) “0.584
B) “0.675
C) “0.920
D) “1.457
A local grocery store receives strawberries from suppliers in Florida and California.
Currently there are 18 strawberry containers on the shelf and 11 of them are from
Florida. A shopper selects three containers to purchase. What is the mean of this
distribution?
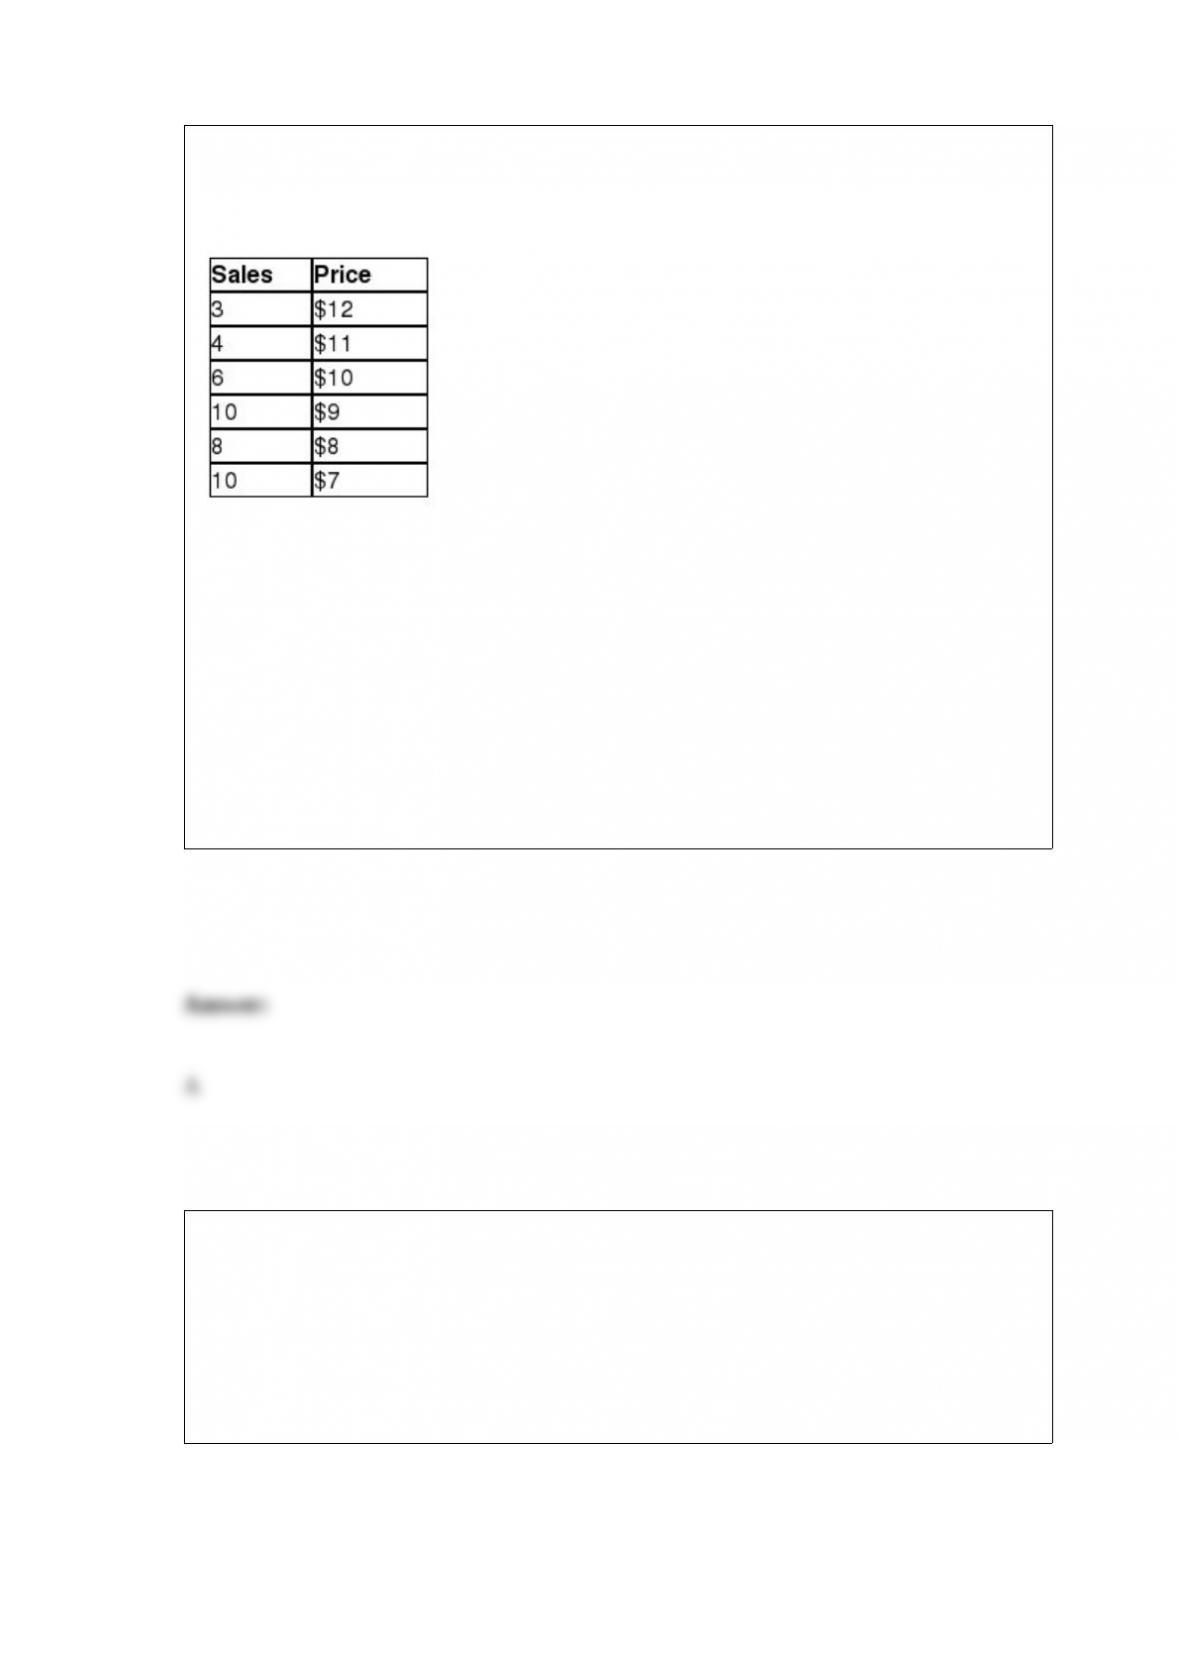
Costco sells paperback books in their retail stores and wanted to examine the
relationship between price and demand. The price of a particular novel was adjusted
each week and the weekly sales were recorded in the table below.
Management would like to use simple regression analysis to estimate weekly demand
for this novel using the price of the novel. The standard error of the slope is ________.
A) 0.3299
B) 0.5817
C) 0.6810
D) 0.8122
Wells Fargo Bank would like to determine if a difference exists in the average credit
score between residents of the states of Texas, Alaska, and Iowa and also investigate if
age plays a role in credit score. The credit scores from a random sample of residents
from each state was recorded and residents were categorized as being under 40 years
old or 40 years and older. A two-way ANOVA was conducted using α = 0.05 with
Factor A assigned the state residence and Factor B assigned the age group. The results
are shown below.
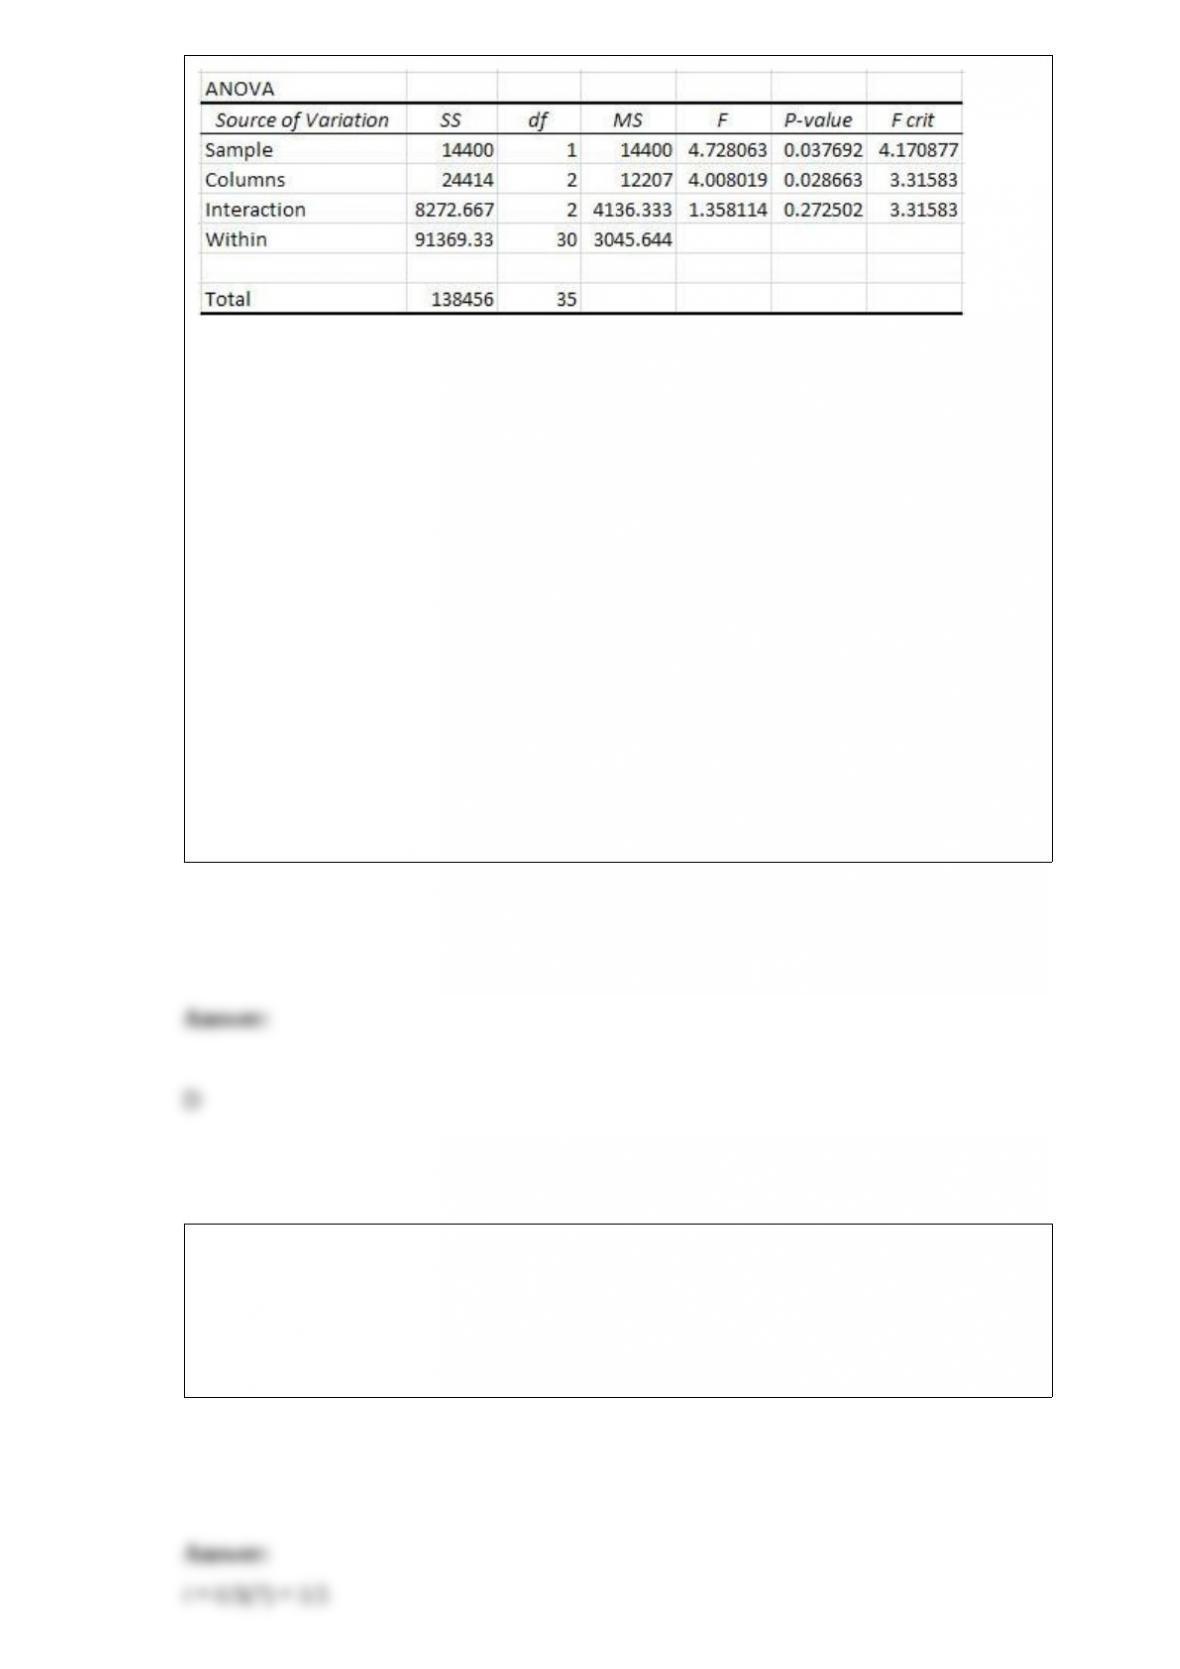
A conclusion for this ANOVA procedure would be that because the Factor B test
statistic is
______________________________________________________________________
_____.
A) less than the critical value, we can reject the null hypothesis and conclude that there
is a difference in the average credit score between these two age groups
B) less than the critical value, we cannot reject the null hypothesis and cannot conclude
that there is a difference in the average credit score between these two age groups
C) more than the critical value, we cannot reject the null hypothesis and can conclude
that there is a difference in the average credit score between these two age groups
D) more than the critical value, we can reject the null hypothesis and can conclude that
there is a difference in the average credit score between these two age groups
There are currently seven statistics classes being taught this semester at Wilmington
College. The following data represent the number of students in each class.
20 25 18 32 22 30 28
Calculate the median of this population.
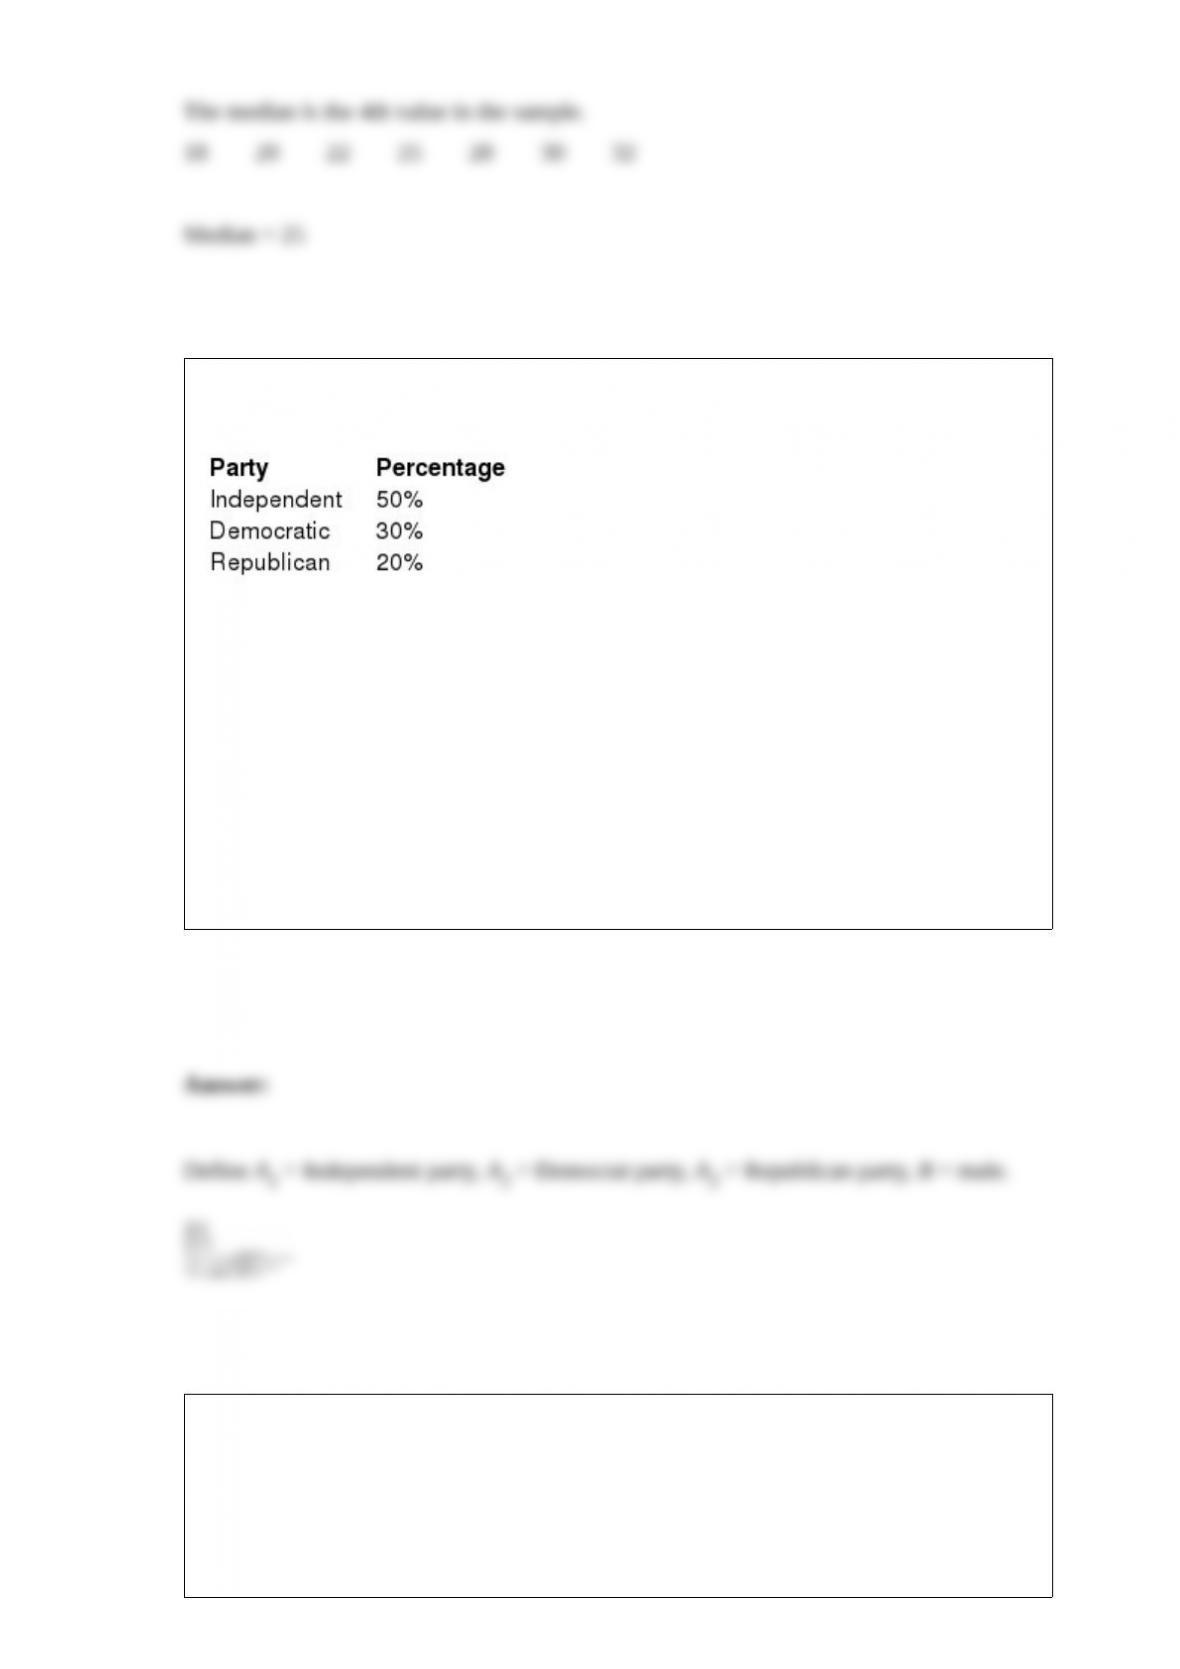
A survey of Americans ages 18-24 years old found the following political party
affiliations.
Consider the following information:
” Of those affiliated with the Independent party, 56% were male.
” Of those affiliated with the Democratic party, 40% were male.
” Of those affiliated with the Republican party, 35% were male.
Use Bayes’ Theorem to determine the probability that a person who is male is affiliated
with the Independent party.
Note: The problems below are based on the following information:
The following data show the download speed in megabytes per second for a random
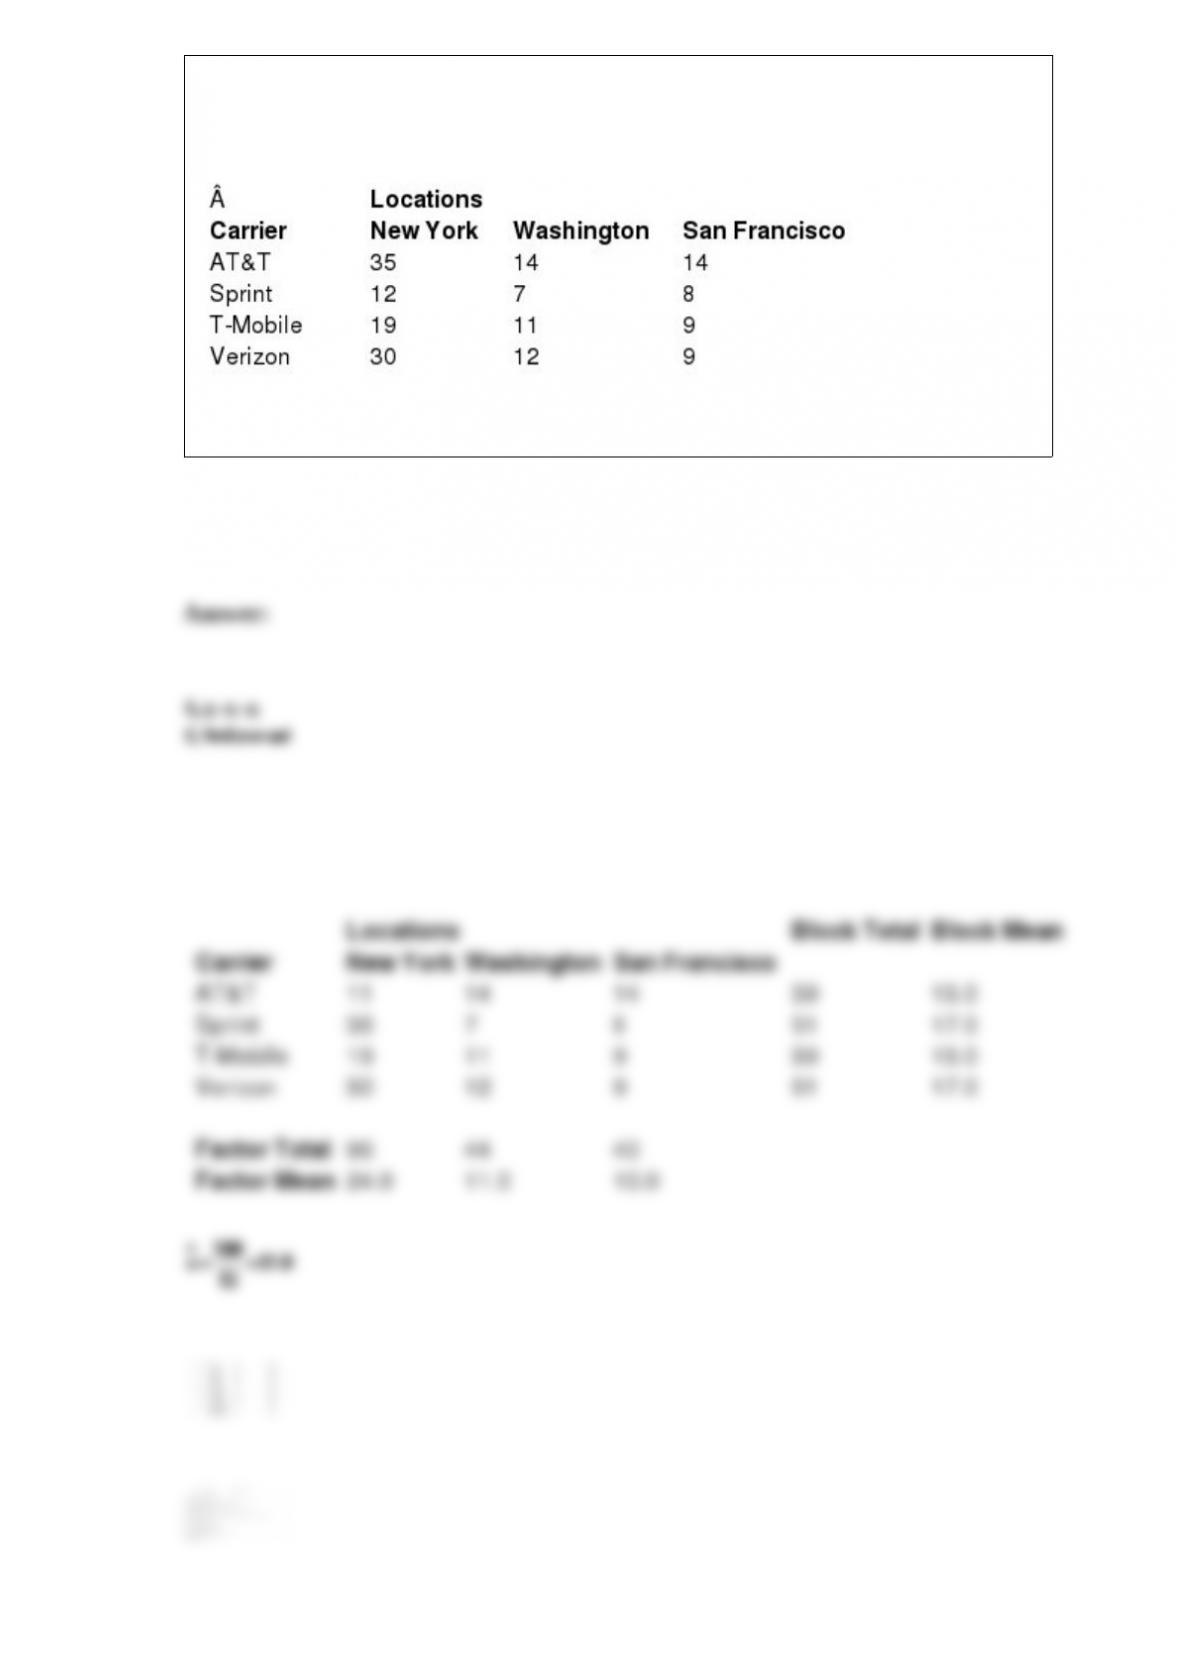
sample of smartphone users in three cities using four different networks.
Perform a randomized block ANOVA using α = 0.05 to test if a difference exists in
average download speed between these three cities.
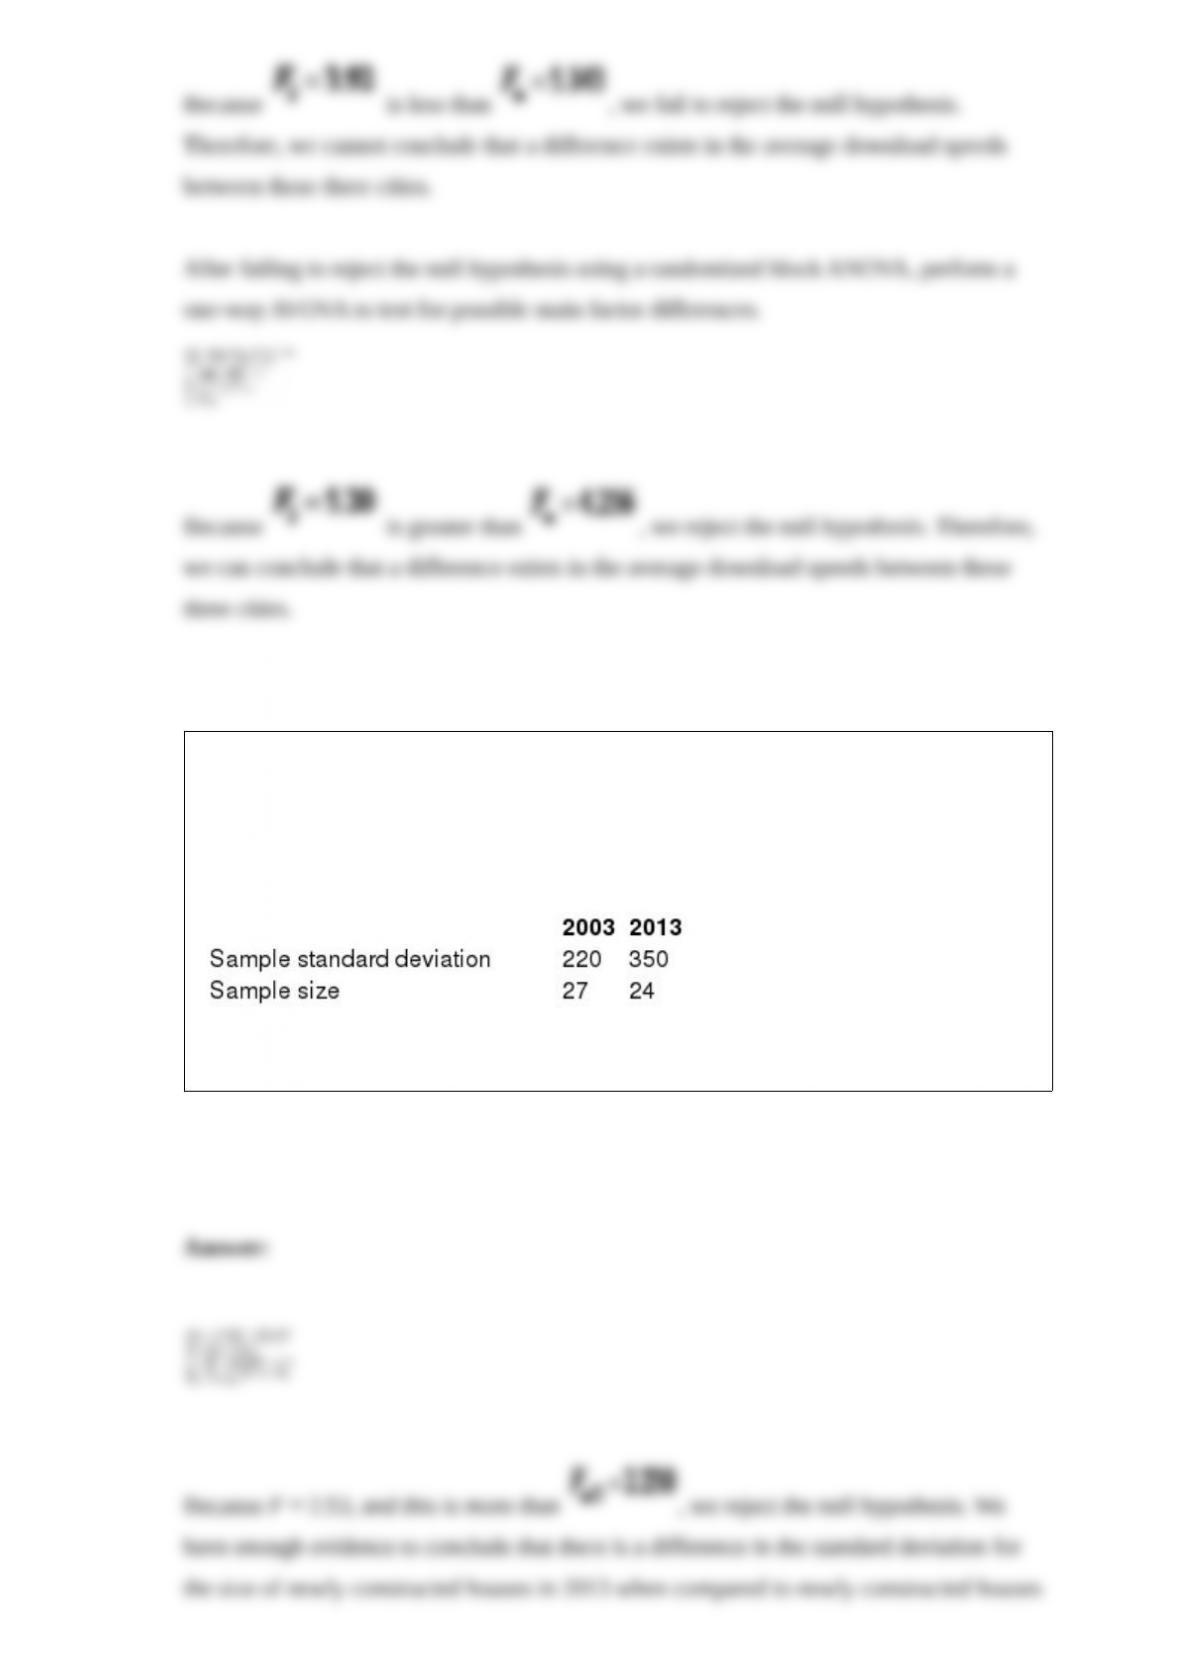
The Department of Housing and Urban Development (HUD) would like to test the
hypothesis that there is a difference in the standard deviation for the size of newly
constructed houses in 2013 when compared to newly constructed houses in 2003. The
following data summarizes the sample statistics for house sizes, in square feet, for both
years.
Test the hypothesis using α = 0.05.
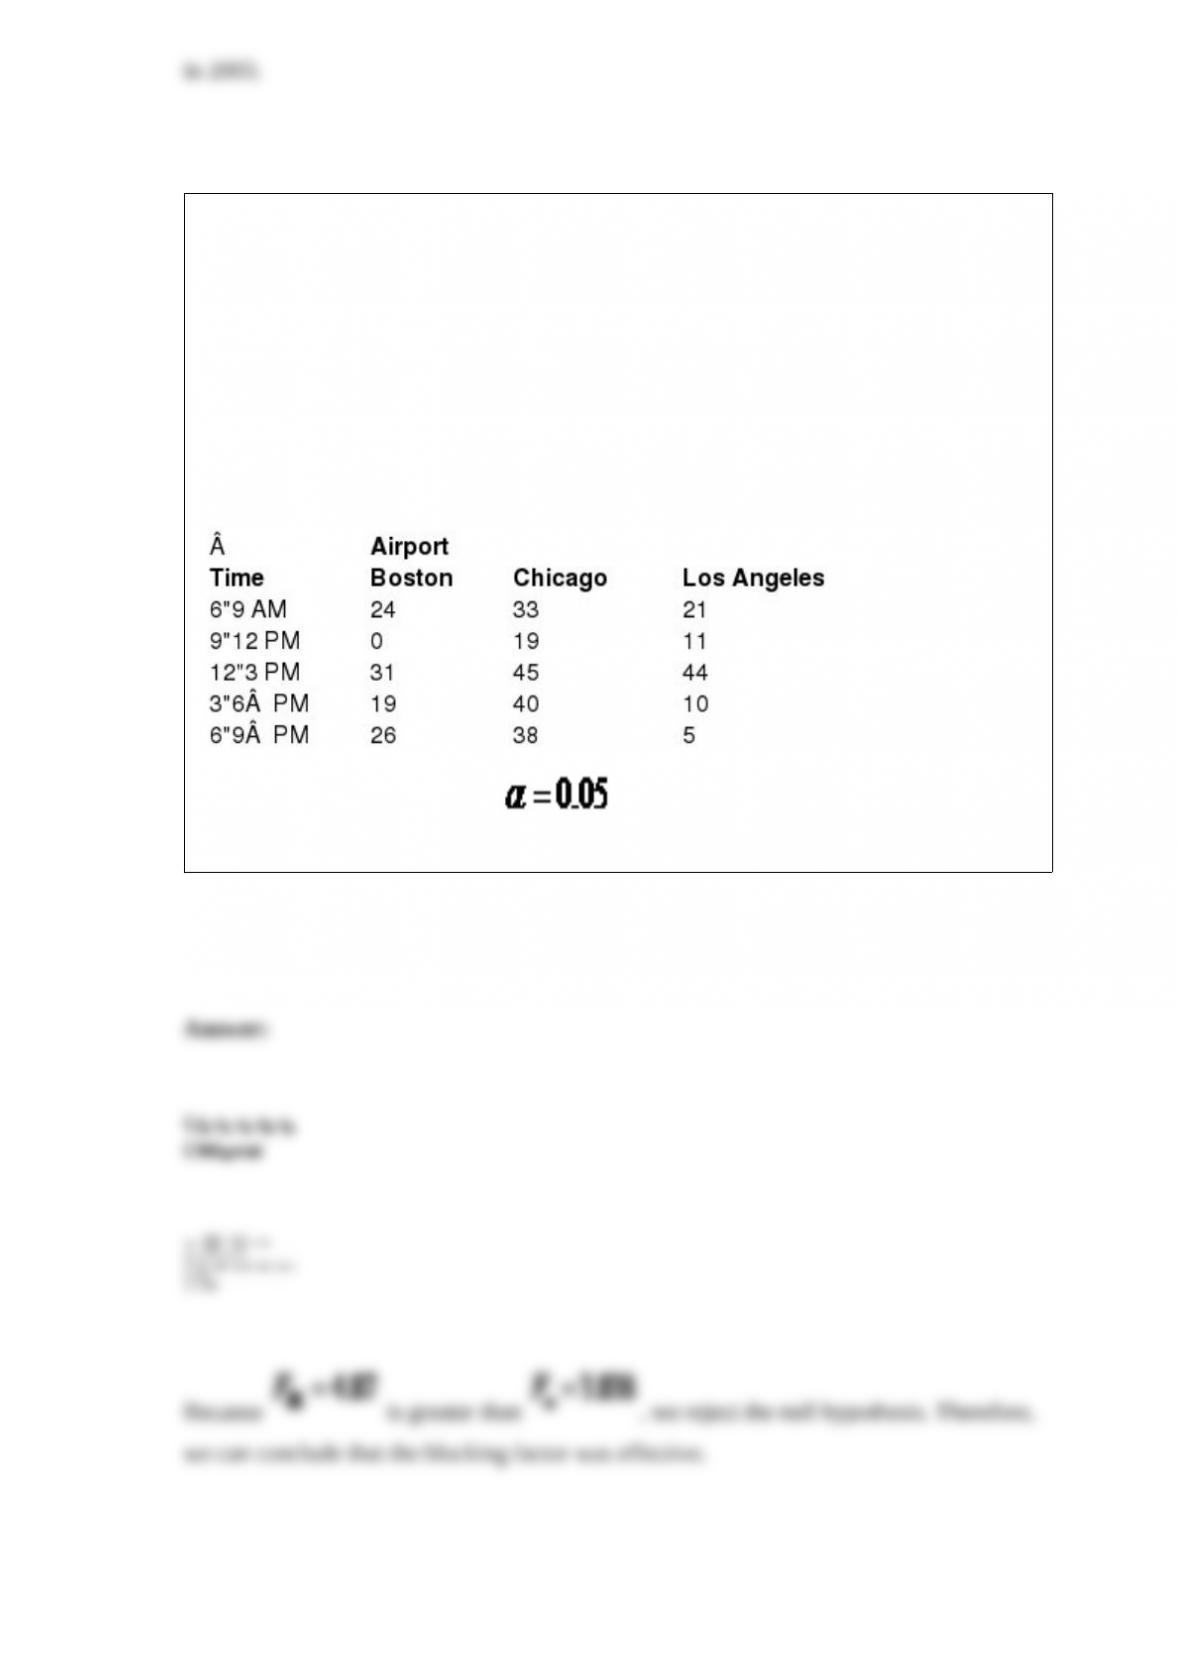
Note: The problems below are based on the following information:
The following data show the minutes that randomly selected flights were delayed from
their scheduled departure at three different airports throughout different time intervals
during the day.
Perform a hypothesis test using to determine if the blocking factor was
effective.
Sam’s Deli sells take-out baguette sandwiches for the lunchtime customers that sell for
$7.50 and cost Sam $4.75 to make. Any leftover sandwiches can be sold for $1.75 the
next day. Assume daily demand will be 50, 75, or 100 sandwiches. Sam needs to decide
to make 50, 75, or 100 sandwiches each morning. Construct a decision table for each
combination of quantity made and demand level.
Use the following information to answer the question(s) below.
Delmarva Power is a utility company that would like to predict the monthly heating bill
for a household in Kent County during the month of January. A random sample of 18
households in the county were selected and their January heating bill recorded. This
data is shown in the table below along with the square footage of the house (SF), the
age of the heating system in years (Age,) and the type of heating system (heat pump = 1
or natural gas = 0).
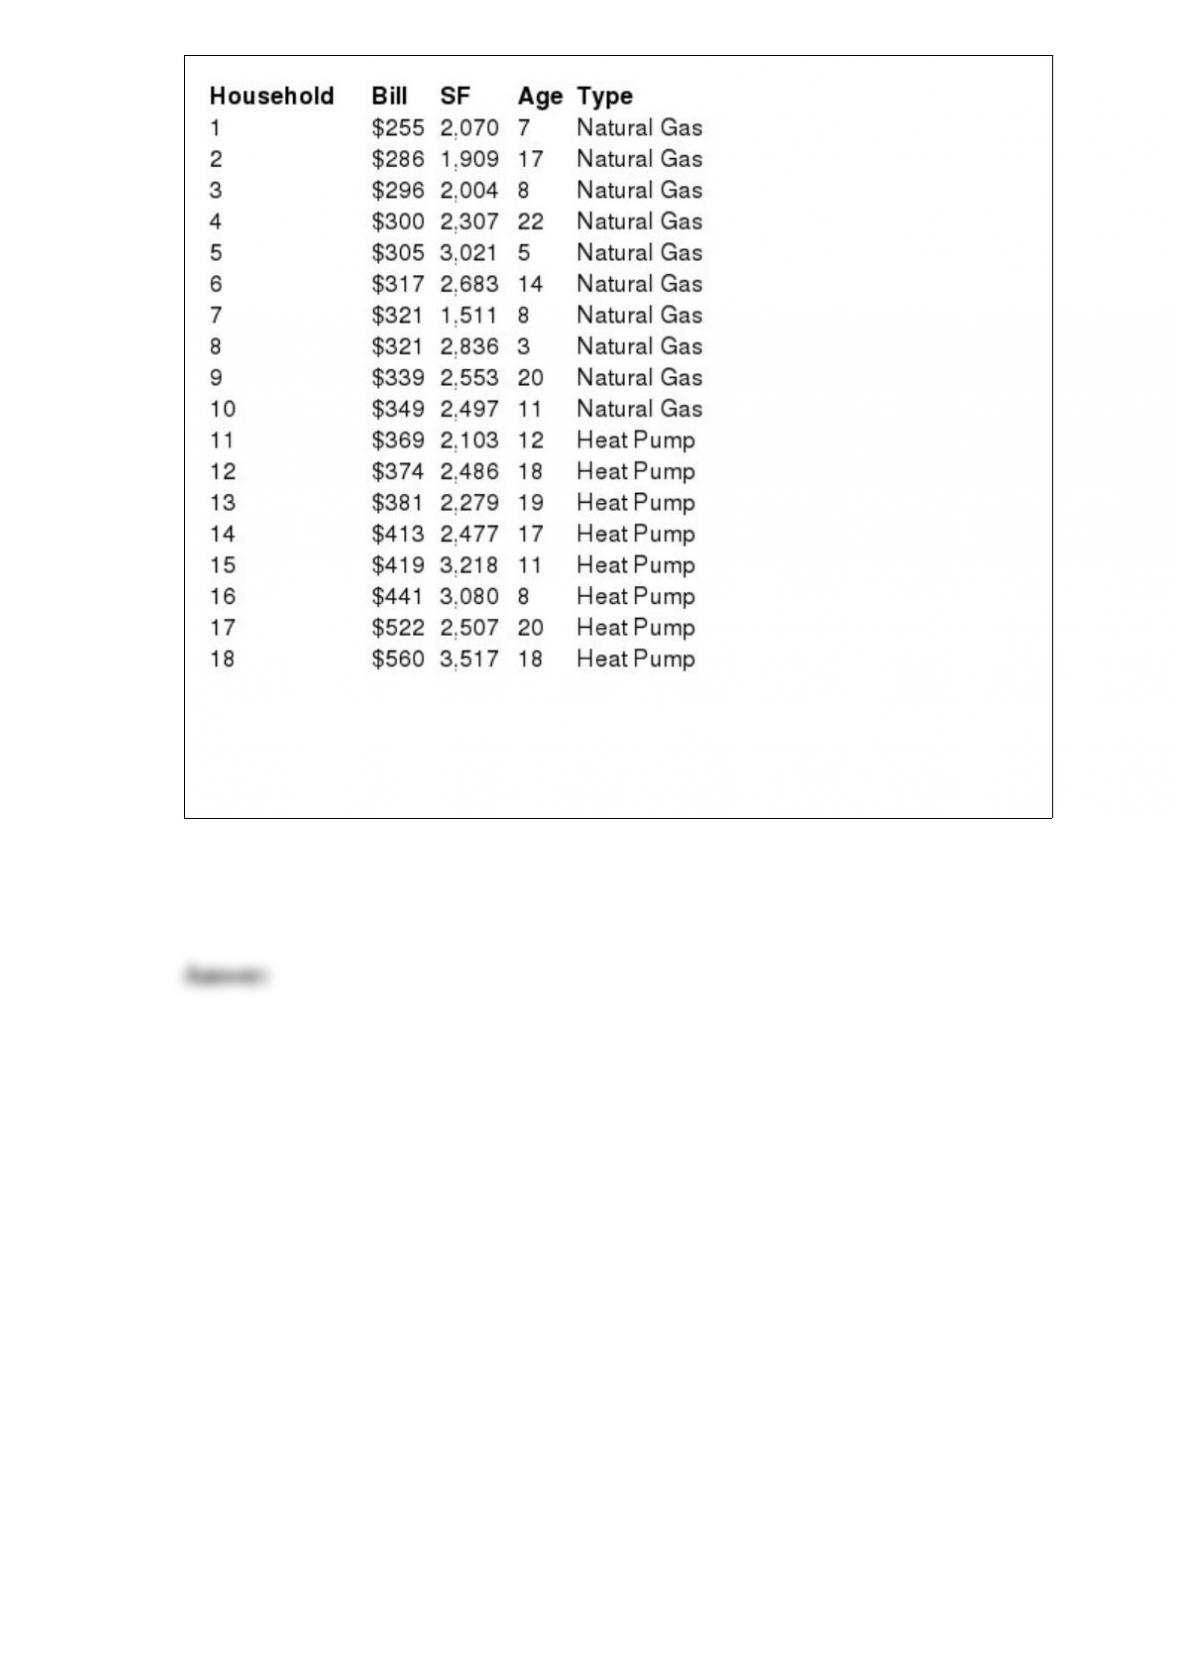
Develop a regression equation that will predict the monthly heating bill for a household
in Kent County during the month of January based on the square footage of the house,
the age of the heating system, and the type of heating system.
The Syracuse University men’s NCAA basketball team needs to decide how many
programs to have available for their upcoming game at the Carrier Dome. Each
program sells for $5.00 and costs the school $1.25 to print. Leftover programs have no
monetary value. The school would like to order 6,000, 8,000, or 10,000 programs for
this game while considering demand levels of 6,000, 8,000, or 10,000 programs.
Construct a decision table for each combination of order quantity and demand level.
John is considering investing in a Subway Sandwich franchise and would like to test the
hypothesis that the average weekly sales exceeds $7,000. A random sample of 26
Subway stores had average weekly sales of $7,640 with a sample standard deviation of
$2,410. Use the critical value approach to test this hypothesis using α = 0.05.