Unlock document.
This document is partially blurred.
Unlock all pages and 1 million more documents.
Get Access

If a simple least squares regression model is developed based on a sample where the
two variables are known to be positively correlated, the sum of the residuals will be
positive.
One of the assumptions of the Mann-Whitney U test is that the population distributions
are the same for shape and spread.
In conducting a test of independence for a contingency table that has 4 rows and 3
columns, the number of degrees of freedom is 11.
In a study of 30 customers' utility bills in which the monthly bill was the dependent
variable and the number of square feet in the house is the independent variable, the
resulting regression model is = 23.40 + 0.04x. Given this model, for a customer with a
2,000 square foot house and a monthly utility bill equal to $100.00, the residual from
the regression model is approximately -$3.40.

Stratified random sampling is the same thing as simple random sampling.
Type II error is failing to reject the null hypothesis when the null is actually false.
A study has recently been conducted by a major computer magazine publisher in which
the objective was to develop a multiple regression model to explain the variation in
price of personal computers. Three independent variables were used. The following
computer printout shows the final output. However, several values are omitted from the
printout.

Given this information, using an alpha = .05 level, you can conclude that the overall
regression model is statistically significant.
The right and left edges of the box in a box and whisker plot represent the 3rd and 1st
quartiles, respectively.
Of the two types of statistical errors, the one that decision makers have most control
over is Type I error.
In conducting multiple regression analysis, t-tests should be conducted prior to
conducting the F-test.
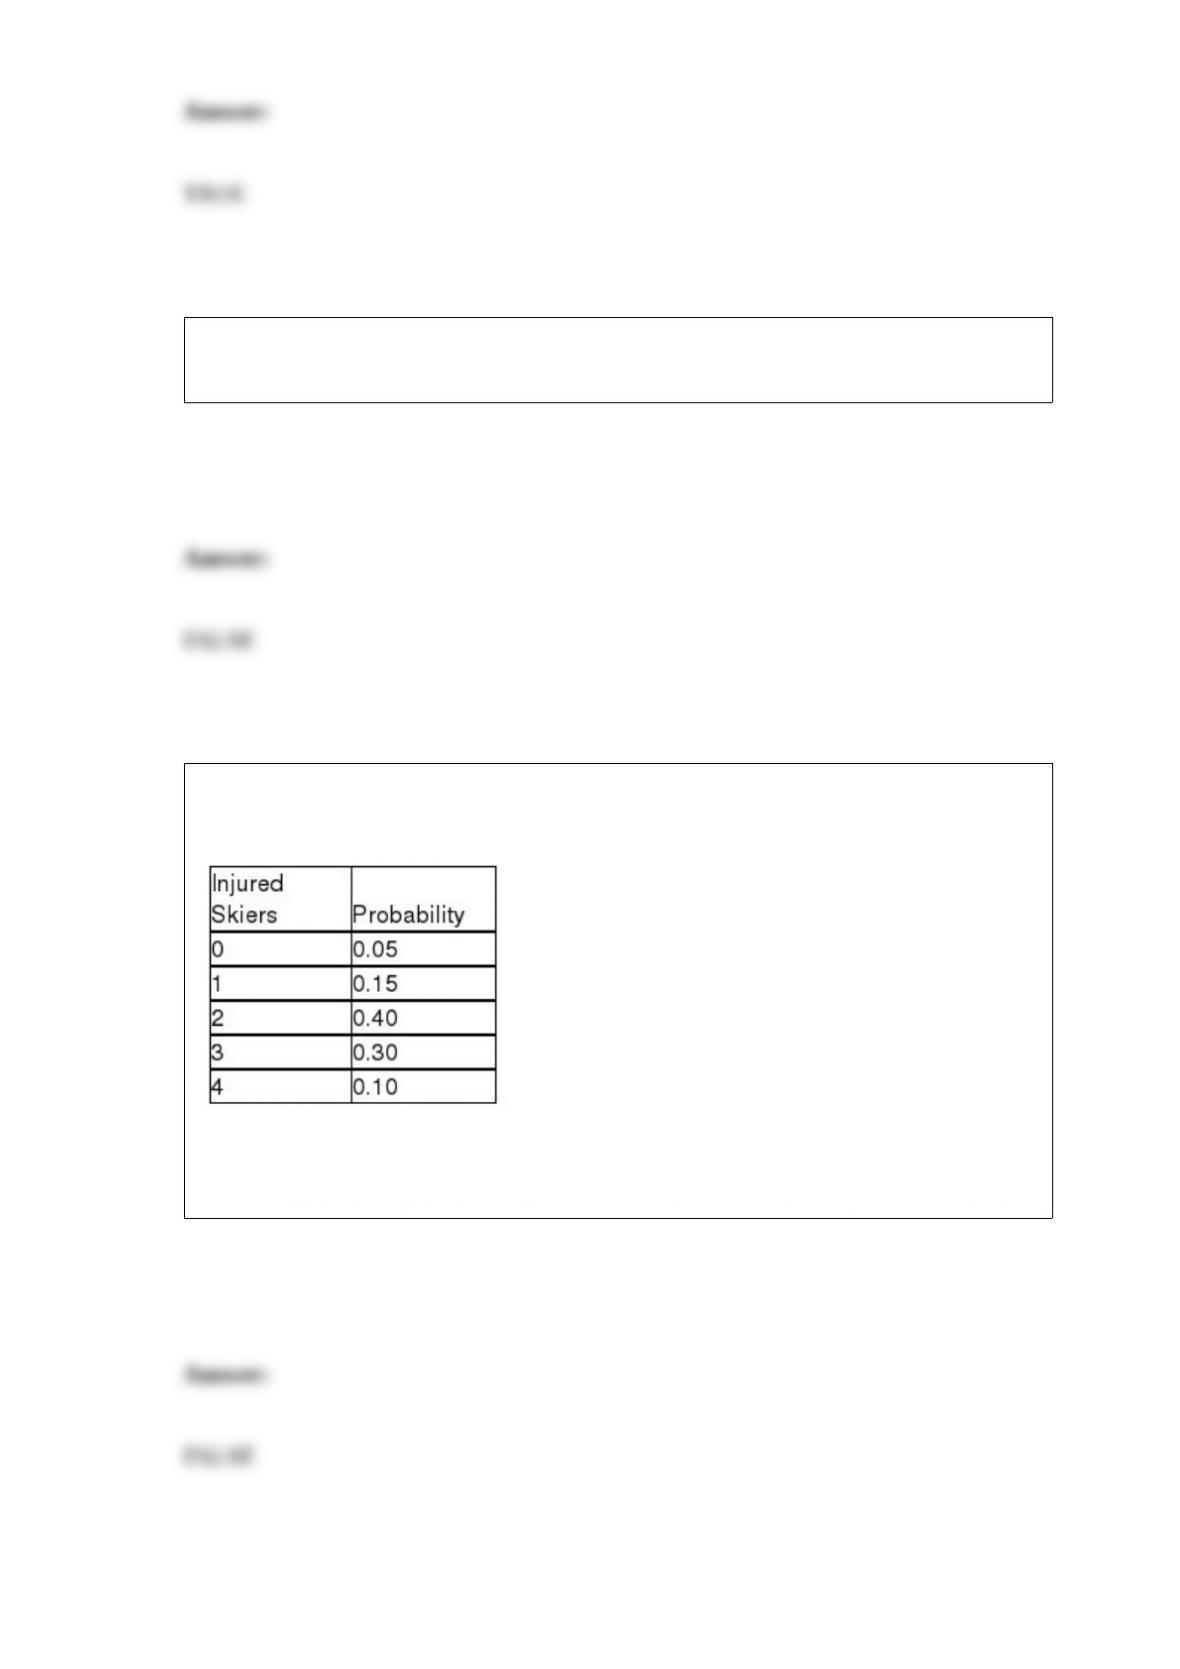
The Ski Patrol at Criner Mountain Ski Resort has determined the following probability
distribution for the number of skiers that are injured each weekend:
Based on this information, the standard deviation for the number of injuries per
weekend is 2.25.

When using the multiplicative time-series model to determine the seasonal indexes, the
first step is to isolate the seasonal and random components from the cyclical and trend
components.
When constructing a scatter plot, the dependent variable is placed on the vertical axis
and the independent variable is placed on the horizontal axis.
The makers of Crustfree Bread in Boston have a quality standard that allows for no
more than 3 burned loaves per batch on average. Assuming that the average of 3 per
batch is being met, the standard deviation for the number of burned loaves in 4 batches
is approximately 1.73 loaves.
An ogive is a graph that shows cumulative relative frequency.

A study was recently conducted to see whether the mean starting salaries for graduates
of engineering, business, healthcare, and computer information systems majors differ. A
random sample of 8 graduates was selected from each major. If the test is to be
conducted using an alpha = 0.05 level, the critical value will be F = 3.838.
In a two-factor ANOVA design with replication, the null hypothesis for testing whether
interaction exists is that no interaction exists. The alternative hypothesis is that
interaction does exist.
One of the characteristics of the binomial distribution is that the probability of success
for each trial depends on whether the previous trial was a success or not.

The appropriate number of classes should generally be between 5 and 20.
The number of calls to an Internet service provider during the hour between 6:00 and
7:00 p.m. is described by a Poisson distribution with mean equal to 15. Given this
information, the expected number of calls in the first 30 minutes is 7.5 calls.
The makers of furnace filters recently conducted a test to determine whether the median
number of particulates that would pass through their four leading filters was the same. A
random sample of 6 of each type of filter was used with the following data being
recorded:
If the Kruskal-Wallis test is used with an alpha = .01, the null hypothesis should be
rejected and the managers should conclude that the four filters do not allow an equal

median number of particulates.
When using a 95 percent confidence interval for a mean, the area in the upper tail of the
distribution that is outside the interval is 5 percent.
Lube-Tech is a major chain whose primary business is performing lube and oil changes
for passenger vehicles. The national operations manager has stated in an industry
newsletter that the mean number of miles between oil changes for all passenger cars
exceeds 4,200 miles. To test this, an industry group has selected a random sample of
100 vehicles that have come into a lube shop and determined the number of miles since
the last oil change and lube. The sample mean was 4,278 and the standard deviation
was known to be 780 miles. Based on a significance level of 0.10, the critical value for
the test is approximately z = 1.28.
Contingency analysis helps to make decisions when multiple proportions are involved.

The Dilmart Company has 8,000 parts in inventory. The mean dollar value of these
parts is $10.79 with a standard deviation equal to $3.34. Suppose the inventory manager
selected a random sample of n = 64 parts from the inventory and found a sample mean
equal to $11.27. The probability of getting a sample mean at least as large as $11.27 is
approximately 0.444.
In measuring forecast errors, the MAD and the square root of the MSE will provide
similar (but not identical) values, in that both provide a measure of the "typical" amount
of error in forecasts.
In developing a scatter plot, the decision maker has the option of connecting the points
or not.

Interaction is the term that is used in a two-factor ANOVA design when the two factors
have different means.
In conducting a hypothesis test on the correlation between a pair of variables, we
assume that each variable is normally and independently distributed.
The population of soft drink cans filled by a particular machine is known to be normally
distributed with a mean equal to 12 ounces and a standard deviation equal to .25 ounce.
Given this information, the sampling distribution for a random sample of n = 25 cans
will also be normally distributed with a mean equal to 12 ounces and a standard
deviation equal to .05 ounce.
Assuming that you are planning to collect data using an experiment, it will be very
important to establish an appropriate survey design.
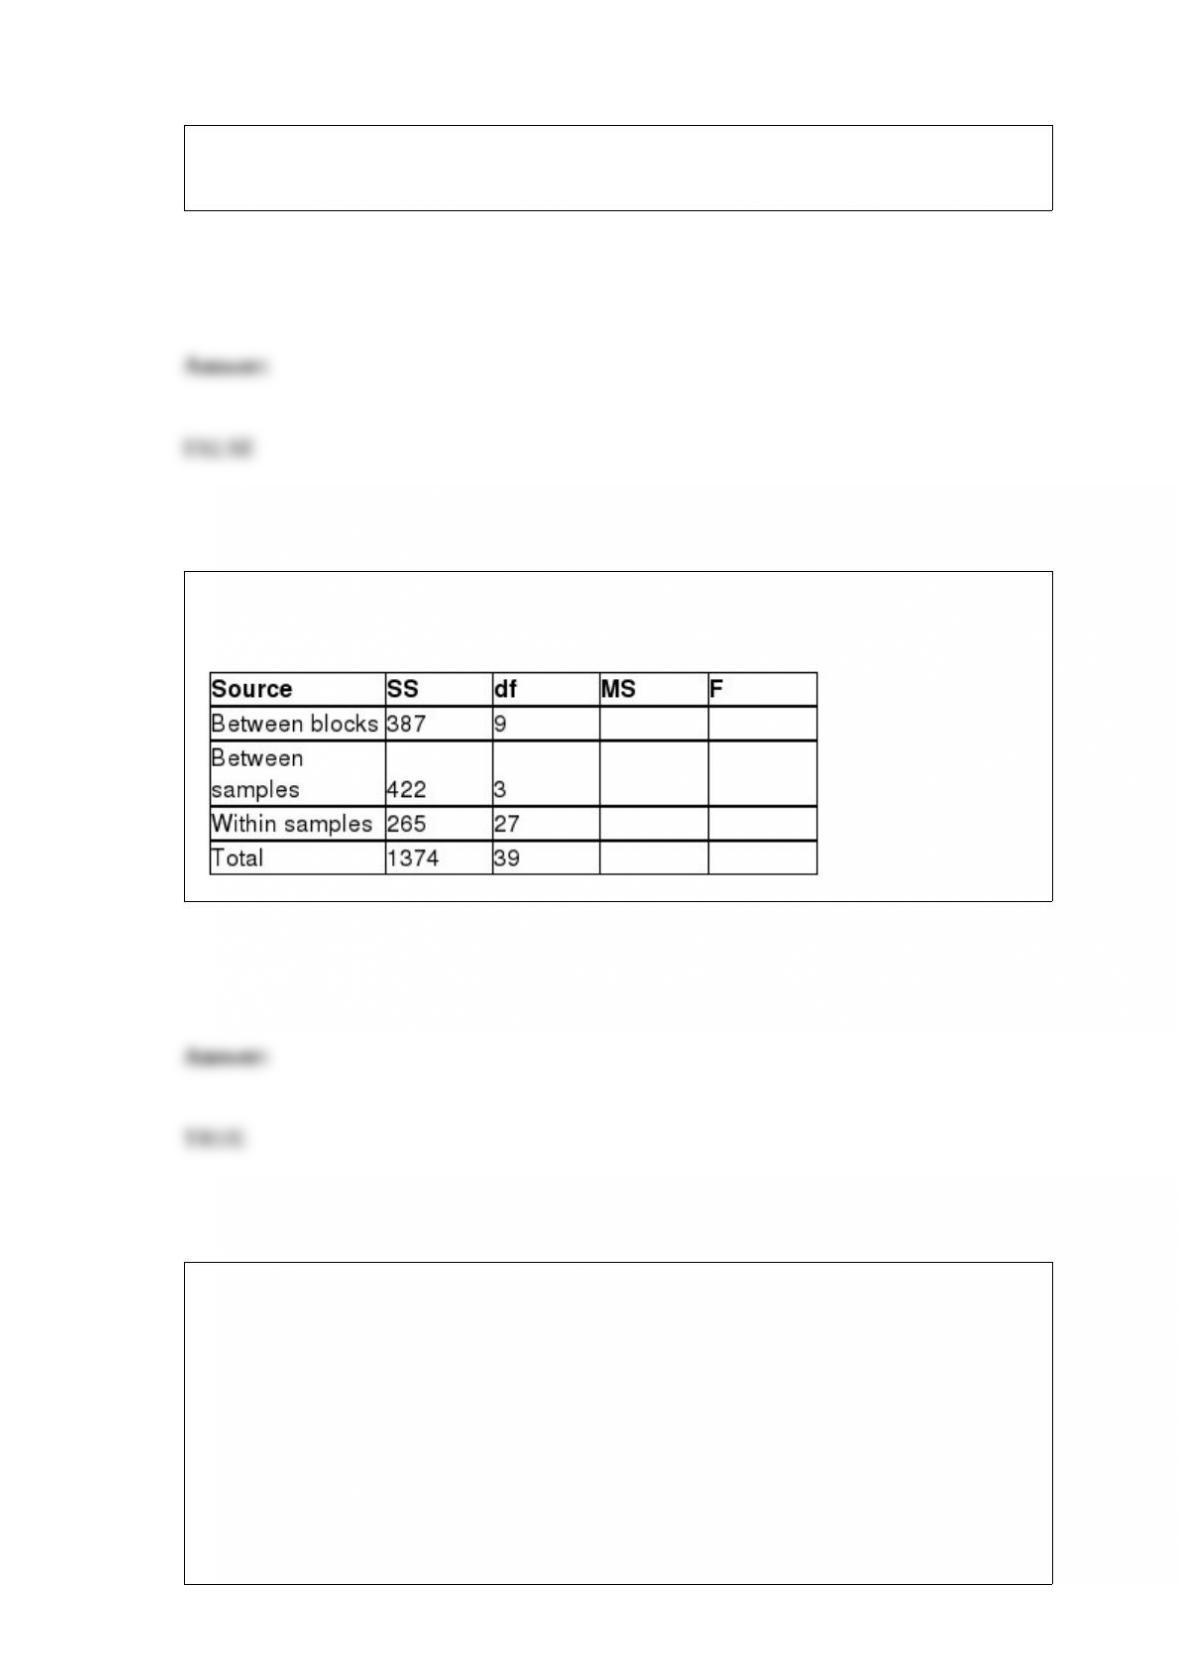
Given the partially completed ANOVA table below, the test statistic for determining if
there is any blocking effect is F = 4.38.
Most companies that make golf balls and golf clubs use a one-armed robot named "Iron
Byron" to test their balls for length and accuracy, but because of swing variations by
real golfers, these test robots don't always indicate how the clubs will perform in actual
use. One company in the golfing industry is interested in testing its new driver to see
how it compares with the best-selling driver. To do this, it has selected a group of
golfers of differing abilities and ages. Its plan is to have each player use each of the two
clubs and hit five balls. It will record the average length of the drives with each club for
each player. Given this description of the planned test, which of the following
statements is true?
A) The test won't be meaningful if only five balls are hit by each player with each club.
B) The samples in this case are called paired samples since the same players are hitting
both golf clubs.
C) The test will be invalid unless different players are used to hit each club so that the
samples will be independent.
D) The samples are independent because each player is independent of the other
players.
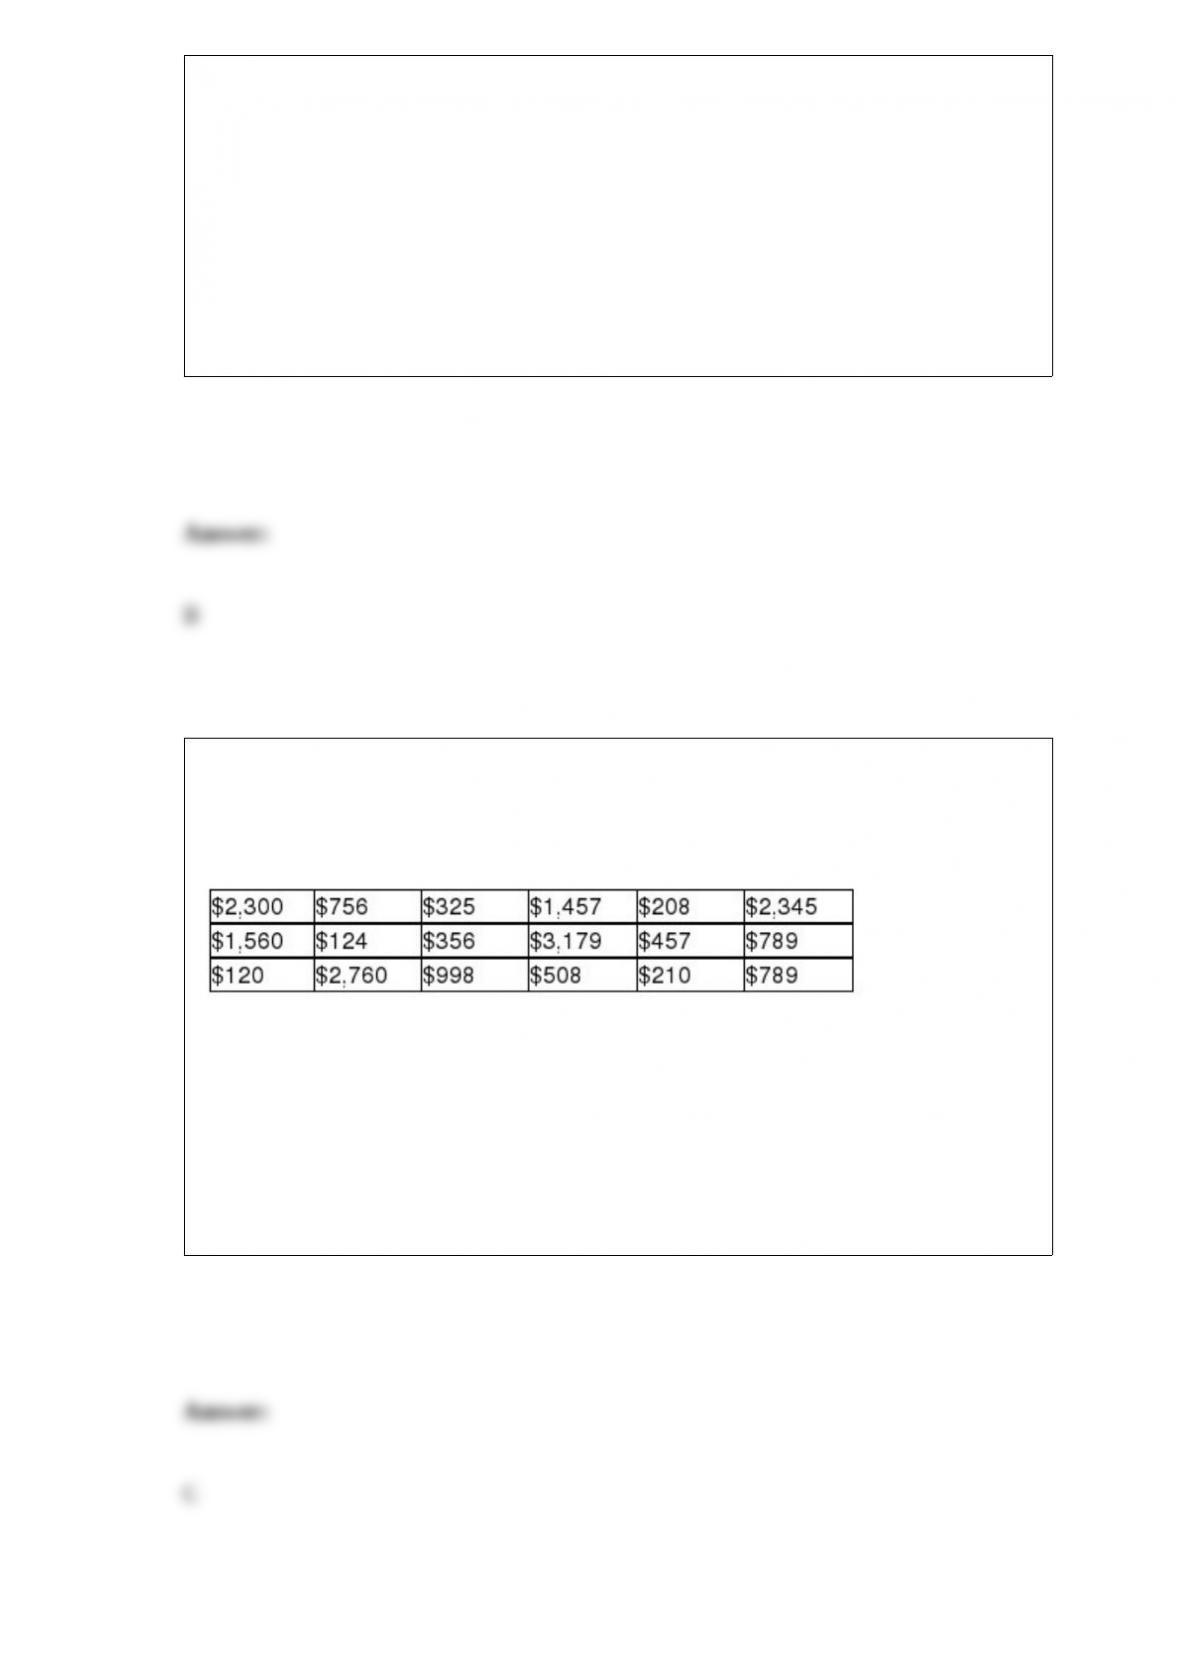
The following data represent a random sample of bank balances for a population of
checking account customers at a large eastern bank. Based on these data, what is the
critical value for a 95 percent confidence interval estimate for the true population
mean?
A) 1.96
B) 2.1009
C) 2.1098
D) None of the above

For the following hypothesis test:
With n= 0.42 and p = 0.42, state the conclusion
A) Because the calculated value of the test statistic, t=0.4122, is neither greater than
2.013 nor less than -2.013, do not reject the null hypothesis and conclude that the
population proportion is not different from 0.40.
B) Because the calculated value of the test statistic, t=1.7291, is neither greater than
2.013 nor less than -2.013, do not reject the null hypothesis and conclude that the
population proportion is not different from 0.40.
C) Because the calculated value of the test statistic, z = 1.2412, is neither greater than
2.575 nor less than -2.575, do not reject the null hypothesis and conclude that the
population proportion is not different from 0.40.
D) Because the calculated value of the test statistic, z = 0.3266, is neither greater than
2.575 nor less than -2.575, do not reject the null hypothesis and conclude that the
population proportion is not different from 0.40.
One of the major challenges for developing a good written questionnaire or telephone
survey instrument is that:
A) nonresponses are too high.
B) there will always be missed data.
C) bias cannot be controlled.
D) wording can influence responses.

Madam Helga claims to be psychic. A national TV talk personality plans to test her in a
live TV broadcast. The process will entail asking Madam Helga a series of 20
independent questions with yes/no answers. The questions would be of the nature that
she could not have any way of knowing the answer from prior knowledge. Suppose that
Madam Helga correctly answered 15 of the 20 questions, which of the following would
be a viable conclusion to reach?
A) Because the probability of guessing 15 or more correctly is 0.0207, it is unlikely that
she is guessing at the questions and may, in fact, have some special ability.
B) Because the probability of getting 15 or more correct is 0.0207, it is likely that she is
just guessing at the questions.
C) If she were guessing, 15 is within one standard deviation of the mean and therefore
she must not have any special psychic abilities.
D) Because the probability of guessing exactly 15 correct is 0.0148, she must just be
guessing.
Which of the following is true about index numbers? Index numbers are:
A) used to measure the trend component.
B) used to measure the seasonal component.
C) used to measure the cyclical component.
D) used to make a relative comparison of different time periods.

A study published in the American Journal of Public Health was conducted to
determine whether the use of seat belts in motor vehicles depends on ethnic status in
San Diego County. A sample of 792 children treated for injuries sustained from motor
vehicle accidents was obtained, and each child was classified according to (1) ethnic
status (Hispanic or non-Hispanic) and (2) seat belt usage (worn or not worn) during the
accident. The number of children in each category is given in the table below.
Referring to these data, which of the following conclusions should be reached if the
appropriate hypothesis is conducted using an alpha = .05 level?
A) The mean value for Hispanics is the same as for Non-Hispanics.
B) There is no relationship between whether someone is Hispanic and whether they
wear a seat belt.
C) The use of seat belts and whether a person is Hispanic or not is statistically related.
D) None of the above
The main process change that can be detected with a process control chart is:
A) the process average has shifted up or down from normal.
B) the process average is trending up or down from normal.
C) the process is behaving in such a manner that the existing variation is not random in
nature.

D) All of the above
Which of the following tests would not be an example of nonparametric method?
A) Wilcoxon signed-rank test
B) Mann-Whitney U-Test
C) Kruskal-Wallis One-Way Analysis of Variance
D) χ2 test
When a survey uses the responses strongly disagree, disagree, neutral, agree, strongly
agree, this is an example of:
A) nominal data.
B) ordinal data.
C) interval data.
D) ratio data.

In a one-way design, which of the following is true?
A) The populations must have equal means.
B) The sample sizes must be equal.
C) The mean squares between will be larger than the mean squares within if the null
hypothesis is rejected.
D) The sample sizes must all differ.
According to an industry report, 26 percent of all households have at least one cell
phone. Further, of those that do have a cell phone, the mean monthly bill is $55.90 with
a standard deviation equal to $9.60. Recently, a random sample of 400 households was
selected. Of these households, 88 indicated that they had cell phones. The mean bill for
these 88 households was $57.00. What is the probability of getting 88 or fewer
households with cell phones if the numbers provided by the industry report are correct?
A) Approximately 0.0344
B) Nearly 0.4656
C) About 0.1345
D) Can't be determined without knowing the standard deviation
The number of visible defects on a product container is thought to be Poisson
distributed with a mean equal to 3.5. Based on this, the probability that 2 containers will
contain a total of less than 2 defects is:
A) 0.0223
B) 0.1359
C) 0.0073
D) 0.1850
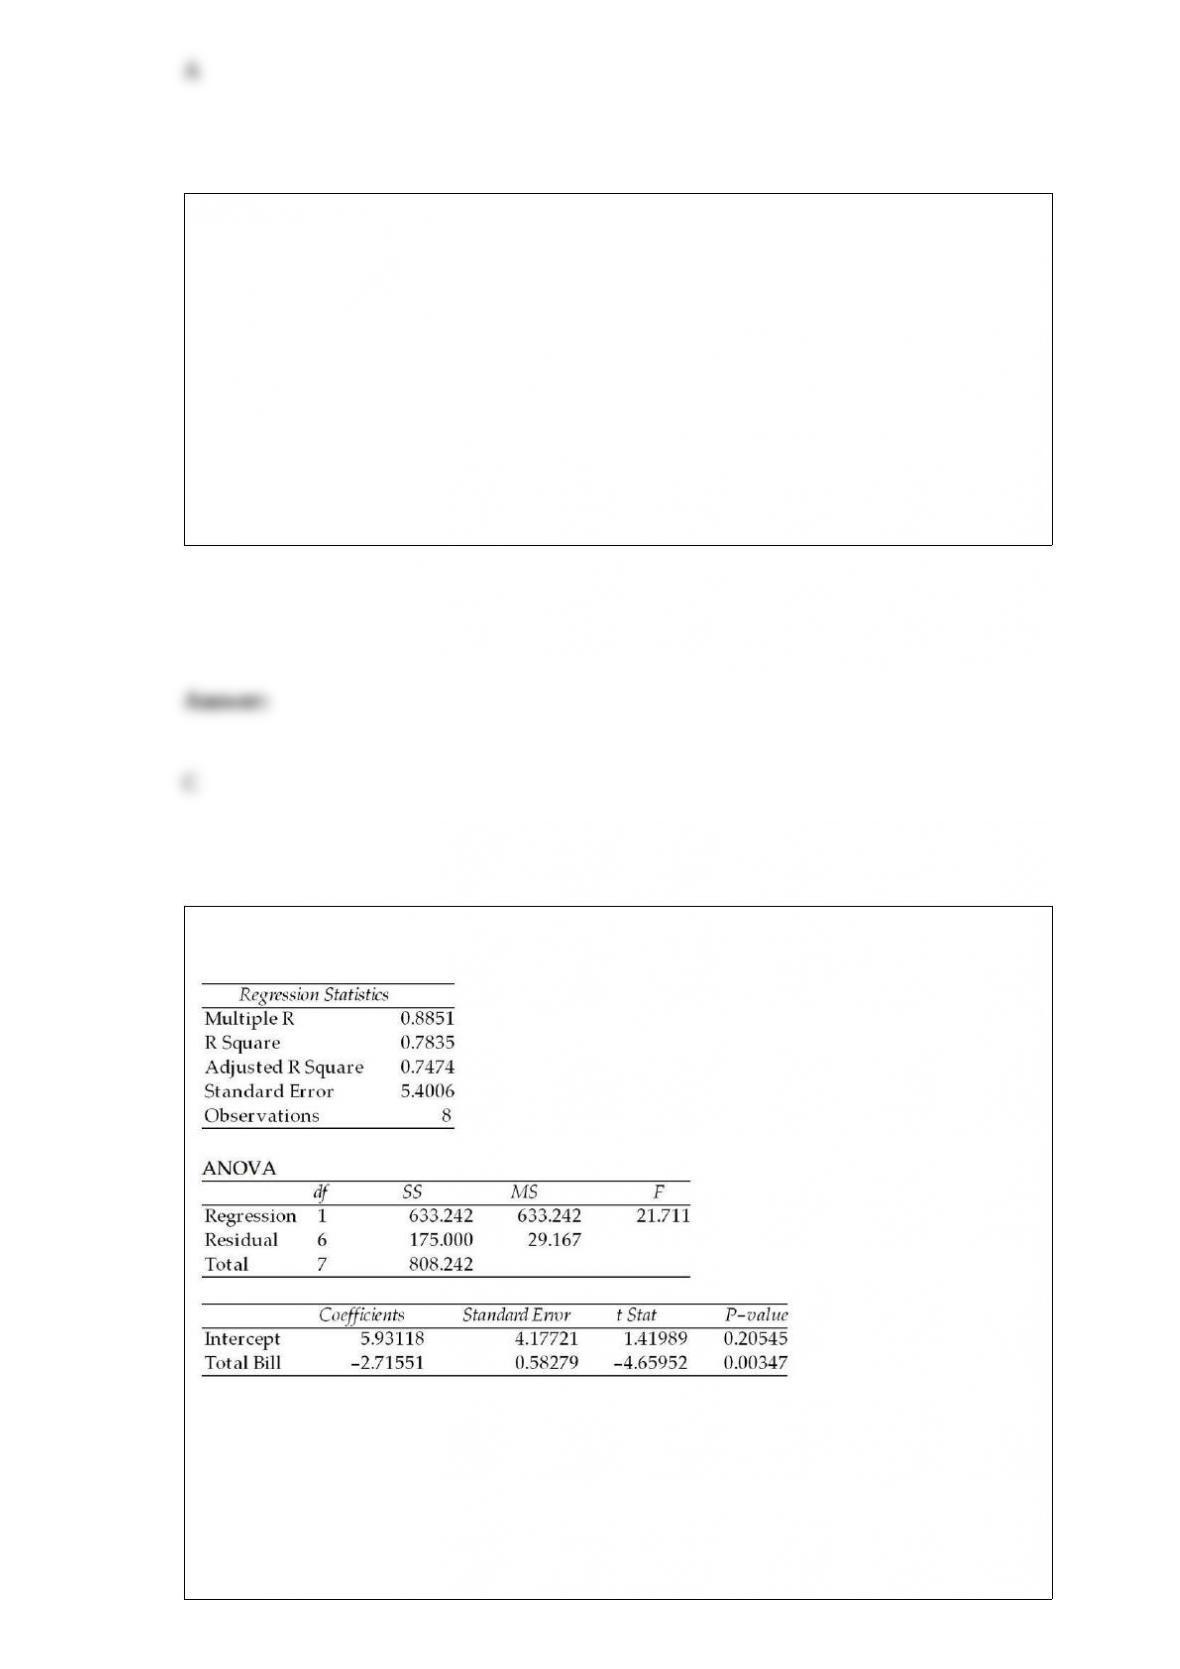
Use the following regression results to answer the question below.
Which of the following is true?
A) x explains about 88.5 percent of the variation in y.
B) y explains about 88.5 percent of the variation in x.

C) x explains about 78.4 percent of the variation in y.
D) y explains about 78.4 percent of the variation in x.
Students who live on campus and purchase a meal plan are randomly assigned to one of
three dining halls: the Commons, Northeast, and Frazier. What is the probability that the
next student to purchase a meal plan will be assigned to the Commons?
A) 0.66
B) 0.5
C) 0.25
D) 0.33
A population has a proportion equal to 0.30. Calculate the following probabilities with
n = 100. Find P(0.25 < ≤ 0.40).
A) 0.8121
B) 0.7415
C) 0.8475
D) 0.5612

The American College Health Association produced the National College Health
Assessment (Andy Gardiner, "Surfacing from Depression," February 6, 2006). The
assessment indicates that the percentage of U.S. college students who report having
been diagnosed with depression has risen from 2000. The assessment surveyed 47,202
students at 74 campuses. It discovered that 10.3% and 14.9% of students indicated that
they had been diagnosed with depression in 2000 and 2004, respectively. Assume that
half of the students surveyed were surveyed in 2004.
Conduct a hypothesis test to determine if there has been more than a 0.04 increase in
the proportion of students who indicated they have been diagnosed with depression.
Use a significance level of 0.05 and a p-value approach to this test.
A) Since p-value = 0.065 > 0.05, do not reject H0. There is not sufficient evidence to
conclude that there has been more than a 0.04 increase in the proportion of students that
indicate they have been diagnosed with depression.
B) Since p-value = 0.025 < 0.05, reject H0. There is sufficient evidence to conclude that
there has been more than a 0.04 increase in the proportion of students that indicate they
have been diagnosed with depression.
C) Since p-value = 0.072 < 0.05, reject H0. There is sufficient evidence to conclude that
there has been more than a 0.04 increase in the proportion of students that indicate they
have been diagnosed with depression.
D) Since p-value = 0.071 > 0.05, do not reject H0. There is not sufficient evidence to
conclude that there has been more than a 0.04 increase in the proportion of students that
indicate they have been diagnosed with depression.
The company that makes a new weight loss pill claims that people who use this pill
according to instructions will lose an average of 20 pounds during a four-month period.
They say the claim is based on a study of 300 people. Which of the following statistical
methods was most likely used to arrive at the company's conclusion?
A) Estimation
B) Hypothesis testing
C) Histograms
D) Bar charts
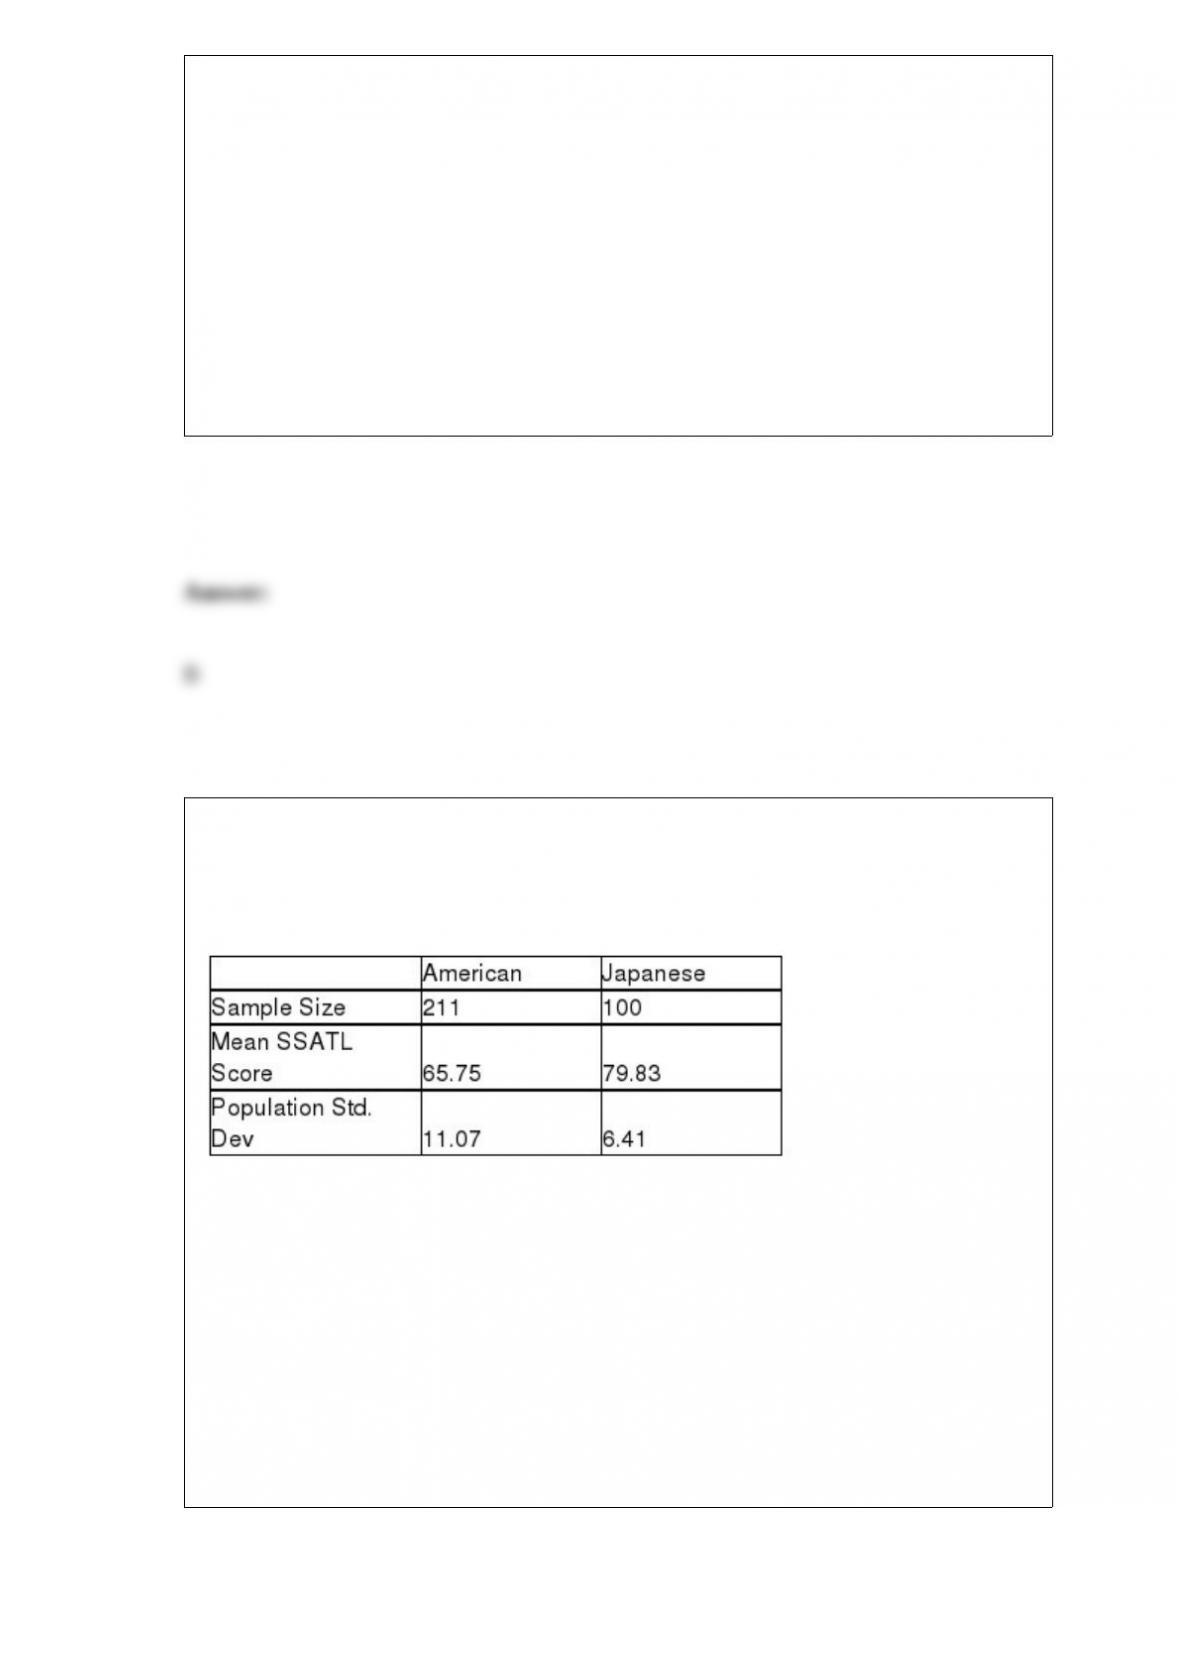
A recent study posed the question about whether Japanese managers are more
motivated than American managers. A randomly selected sample of each was
administered the Sarnoff Survey of Attitudes Toward Life (SSATL), which measures
motivation for upward mobility. The SSATL scores are summarized below.
Judging from the way the data were collected, which test would likely be most
appropriate?
A) Related samples t-test for mean difference
B) Pooled-variance t-test for the difference in means
C) Independent samples Z-test for the difference in means
D) Related samples Z-test for mean difference

Assume that you are conducting a small sample Mann-Whitney U test where n1 = 14
and n2 = 16 and that U1 = 98. Assuming that U1 has been found correctly, what is the
value of U2?
A) 112
B) 126
C) 224
D) Insufficient information to determine U2.
Because of bad weather, the number of days next week that the captain of a charter
fishing boat can leave port is uncertain. Let x = number of days that the boat is able to
leave port per week. The following probability distribution for the variable, x, was
determined based on historical data when the weather was poor:

Based on the probability distribution, what is the expected number of days per week the
captain can leave port?
A) 3.7
B) 4.5
C) 2.8
D) 1.7
A company has recorded the 12 months of sales data for the past year. It wishes to use
the regression approach to develop a trend-based approach for forecasting future
months. The following data are provided:
Based on this information, which of the following is forecast for month 15?
A) Approximately 692
B) About 596

C) Just over 825
D) None of the above
Which of the following is an advantage of using stepwise regression compared to just
entering all the independent variables at one time?
A) Stepwise will generally produce a model with a larger R-square value.
B) The standard error of the estimate for a model constructed with stepwise regression
will be larger than the one generated when all variables are entered at the same time.
C) The stepwise regression allows the decision maker to observe the effects of
multicollinearity more easily than when all the variables are entered at one time.
D) There are no advantages of using stepwise regression over entering all variables at
one time.
Because of the complex nature of the U.S. income tax system, many people have
questions for the Internal Revenue Service (IRS). Yet, an article published by the
Detroit Free Press entitled "Assistance: IRS Help Centers Give the Wrong Information"
discusses the propensity of IRS staff employees to give incorrect tax information to
tax-payers who call with questions. Then IRS Inspector General Pamela Gardiner told a
Senate subcommittee that "the IRS employees at 400 taxpayer assistance centers
nationwide encountered 8.5 million taxpayers face-to-face last year. The problem:
When inspector general auditors posing as taxpayers asked them to answer tax
questions, the answers were right 69% of the time."

Suppose an independent commission was formed to test whether the 0.69 accuracy rate
is correct or whether it is actually higher or lower. The commission has randomly
selected n = 180 tax returns that were completed by IRS assistance employees and
found that 105 of the returns were accurately completed.
Using an α= 0.05 level, based on the sample data, what conclusion should be reached
about the IRS rate of correct tax returns?
A) The z-critical values from the standard normal table for a two-tailed test with alpha
= 0.05 are and z = -1.96. Since z = -0.96 > -1.96, we do not reject the null
hypothesis. Thus, based on these sample data, we believe that the accuracy rate is
actually higher than the 0.69 rate quoted in the Detroit Free Press article
B) The z-critical values from the standard normal table for a two-tailed test with alpha =
0.05 are and z = -1.96. Since z = -0.96 > -1.96, we do not reject the null
hypothesis. Thus, based on these sample data, we believe that the accuracy rate is
actually higher than the 0.58 rate quoted in the Detroit Free Press article
C) The z-critical values from the standard normal table for a two-tailed test with alpha =
0.05 are and z = -1.96. Since z= -3.19 < -1.96, we reject the null hypothesis.
Thus, based on these sample data, we believe that the accuracy rate is actually lower
than the 0.69 rate quoted in the Detroit Free Press article.
D) The z-critical values from the standard normal table for a two-tailed test with alpha =
0.05 are and z = -1.96. Since z = -3.19 < -1.96, we reject the null hypothesis.
Thus, based on these sample data, we believe that the accuracy rate is actually lower
than the 0.58 rate quoted in the Detroit Free Press article.
Data collected at a fixed point in time are:
A) time-series data.
B) approximate time-series data.
C) cross-sectional data.
D) panel data.

In order to determine a parameter (such as a mean) of a population you would need to
conduct a:
A) population.
B) random sample.
C) census.
D) statistic.
The editors of a national automotive magazine recently studied 30 different automobiles
sold in the United States with the intent of seeing whether they could develop a multiple
regression model to explain the variation in highway miles per gallon. A number of
different independent variables were collected. The following regression output is the
result of using a forward selection stepwise regression approach.

Based on the regression output, which of the following statements is true?
A) There is a multicollinearity problem since the standard error of the estimate actually
increased when the second variable, "Price as Tested," entered the model.
B) The R-square value increased when the second variable entered the model.
C) Neither variable in the model is statistically significant at the alpha = 0.05 level.
D) The reason that only two variables entered the model is due to the small sample size
used in this study.
The Chamber of Commerce in a large Midwestern city has stated that 70 percent of all
business owners in the city favor increasing the downtown parking fees. The city
council has commissioned a random sample of n = 100 business owners. Of these, 63
said that they favor increasing the parking fees. What is the probability of 63 or fewer
favoring the idea if the Chamber's claim is correct?
A) Approximately 0.0630

B) About 0.4370
C) Nearly 0.20
D) About 0.9370
Which of the following statements is true with respect to a Poisson distribution?
A) The Poisson distribution is symmetrical when the mean is close to 5.
B) The Poisson distribution is more right-skewed for smaller values of the mean.
C) The variance of the Poisson distribution is equal to the square root of the expected
value.
D) The Poisson distribution is an example of a continuous probability distribution.
The following probability distribution has been assessed for the number of accidents
that occur in a Midwestern city each day:

This distribution is an example of:
A) a uniform distribution.
B) a continuous probability distribution.
C) a discrete probability distribution.
D) an expected value distribution.
Which of the following would best describe the situation that a second-degree
polynomial regression equation would be used to model?
A) An exponential growth trend
B) A cosine function
C) A parabola
D) It depends on the number of independent variables.
The manager of a fast food store realizes that his staffing problems are a result of the
variation in the number of customers that arrive at the store. If the same number of
customers came each hour, she would know exactly how many servers to have working.
It turns out that the Poisson distribution works well to describe the arrivals of customers
in any given hour. Explain why the manager has more trouble staffing the store during
those hours when the average arrival rate is higher.
Explain how the empirical rule can be used to help describe data in a population or a
sample.
A major U.S. oil company has developed two blends of gasoline. Managers are
interested in estimating the difference in mean gasoline mileage that will be obtained
from using the two blends. As part of their study, they have decided to run a test using
the Chevrolet Impala automobile with automatic transmissions. They selected a random
sample of 100 Impalas using Blend 1 and another 100 Impalas using Blend 2. Each car
was first emptied of all the gasoline in its tank and then filled with the designated blend
of the new gasoline. The car was then driven 200 miles on a specified route involving
both city and highway roads. The cars were then filled and the actual miles per gallon
were recorded. The following summary data were recorded:
Blend 1 Blend 2
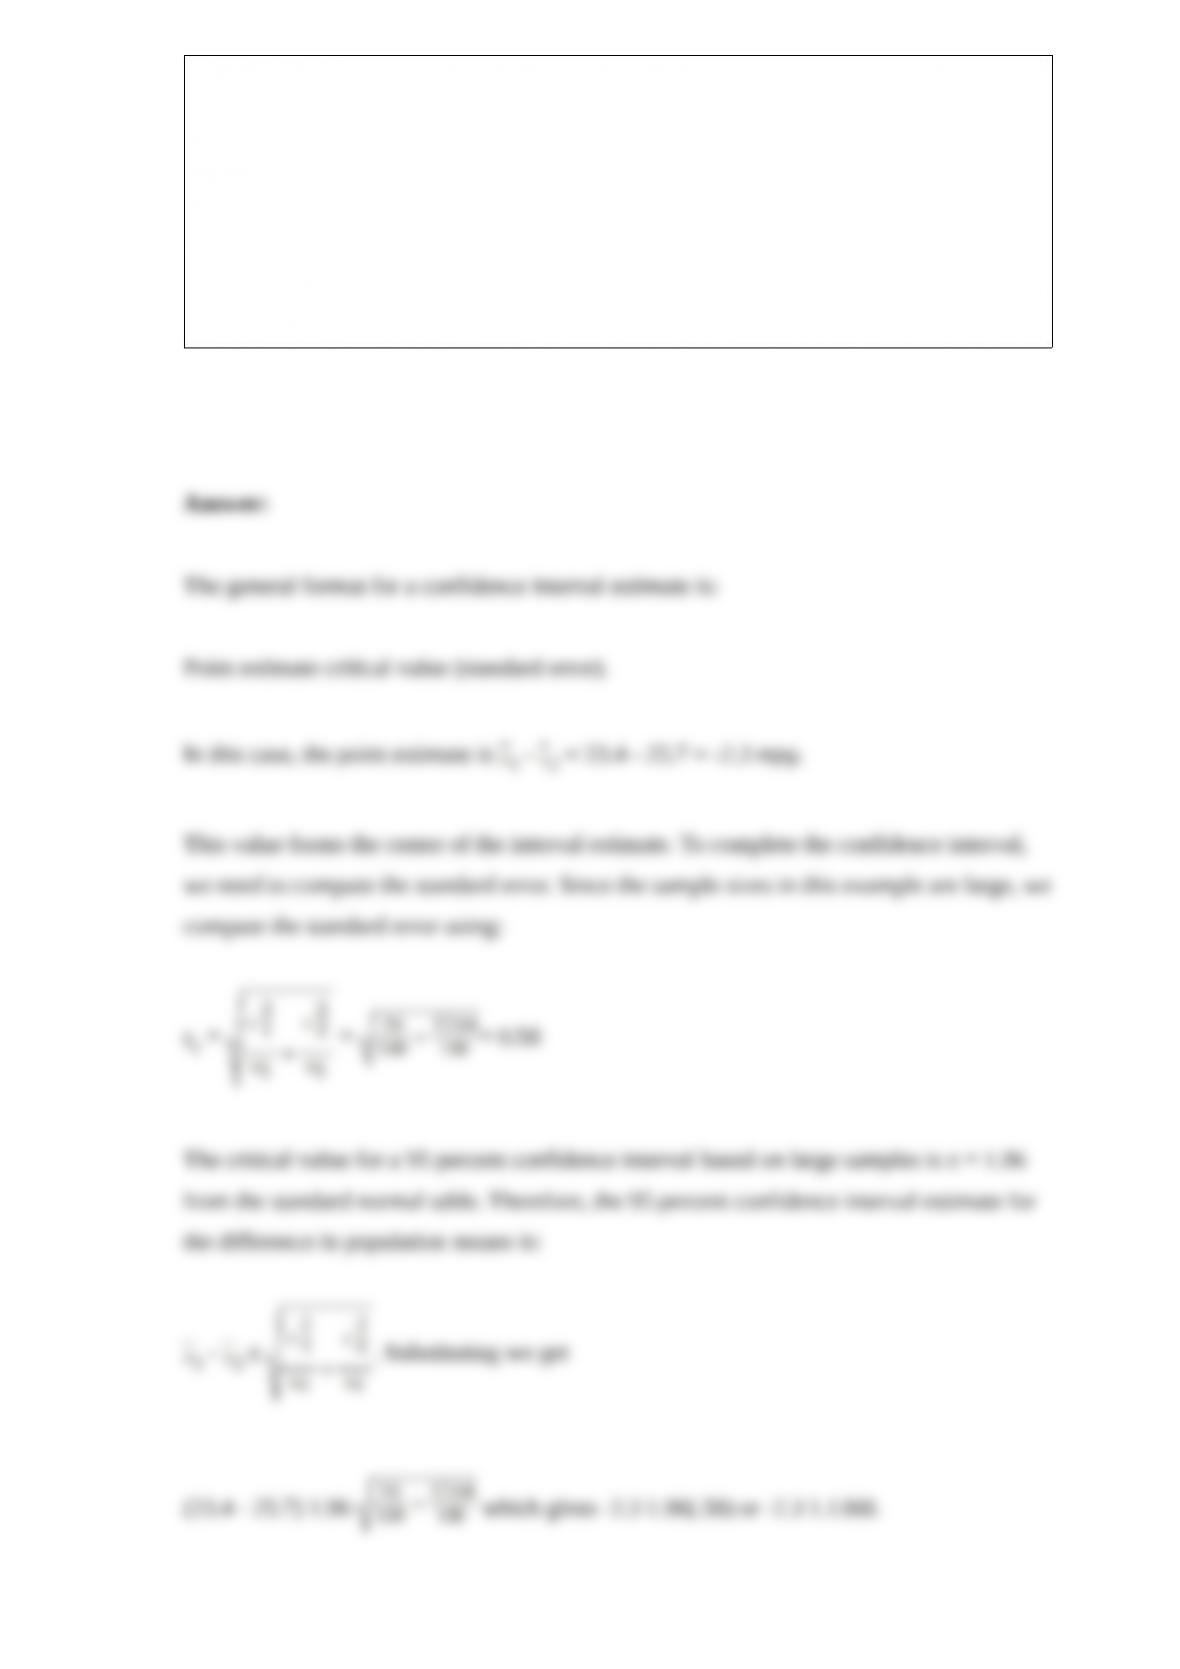
Sample Size 100 100
Sample Mean 23.4 mpg 25.7 mpg
Sample St. Dev. 4.0 mpg 4.2 mpg
Based on these sample data, compute and interpret the 95 percent confidence interval
estimate for the difference in mean mpg for the two blends.
Why is it that when we find the sample standard deviation, we divide by n-1 but when
we find the population standard deviation we divide by n?
The Swanson Auto Body business repaints cars that have been in an accident or which
are in need of a new paint job. Its quality standards call for an average of 1.2 paint
defects per door panel. Explain why there is a difference between the probability of
finding exactly 1 defect when 1 door panel is inspected and finding exactly 2 defects
when 2 doors are inspected.
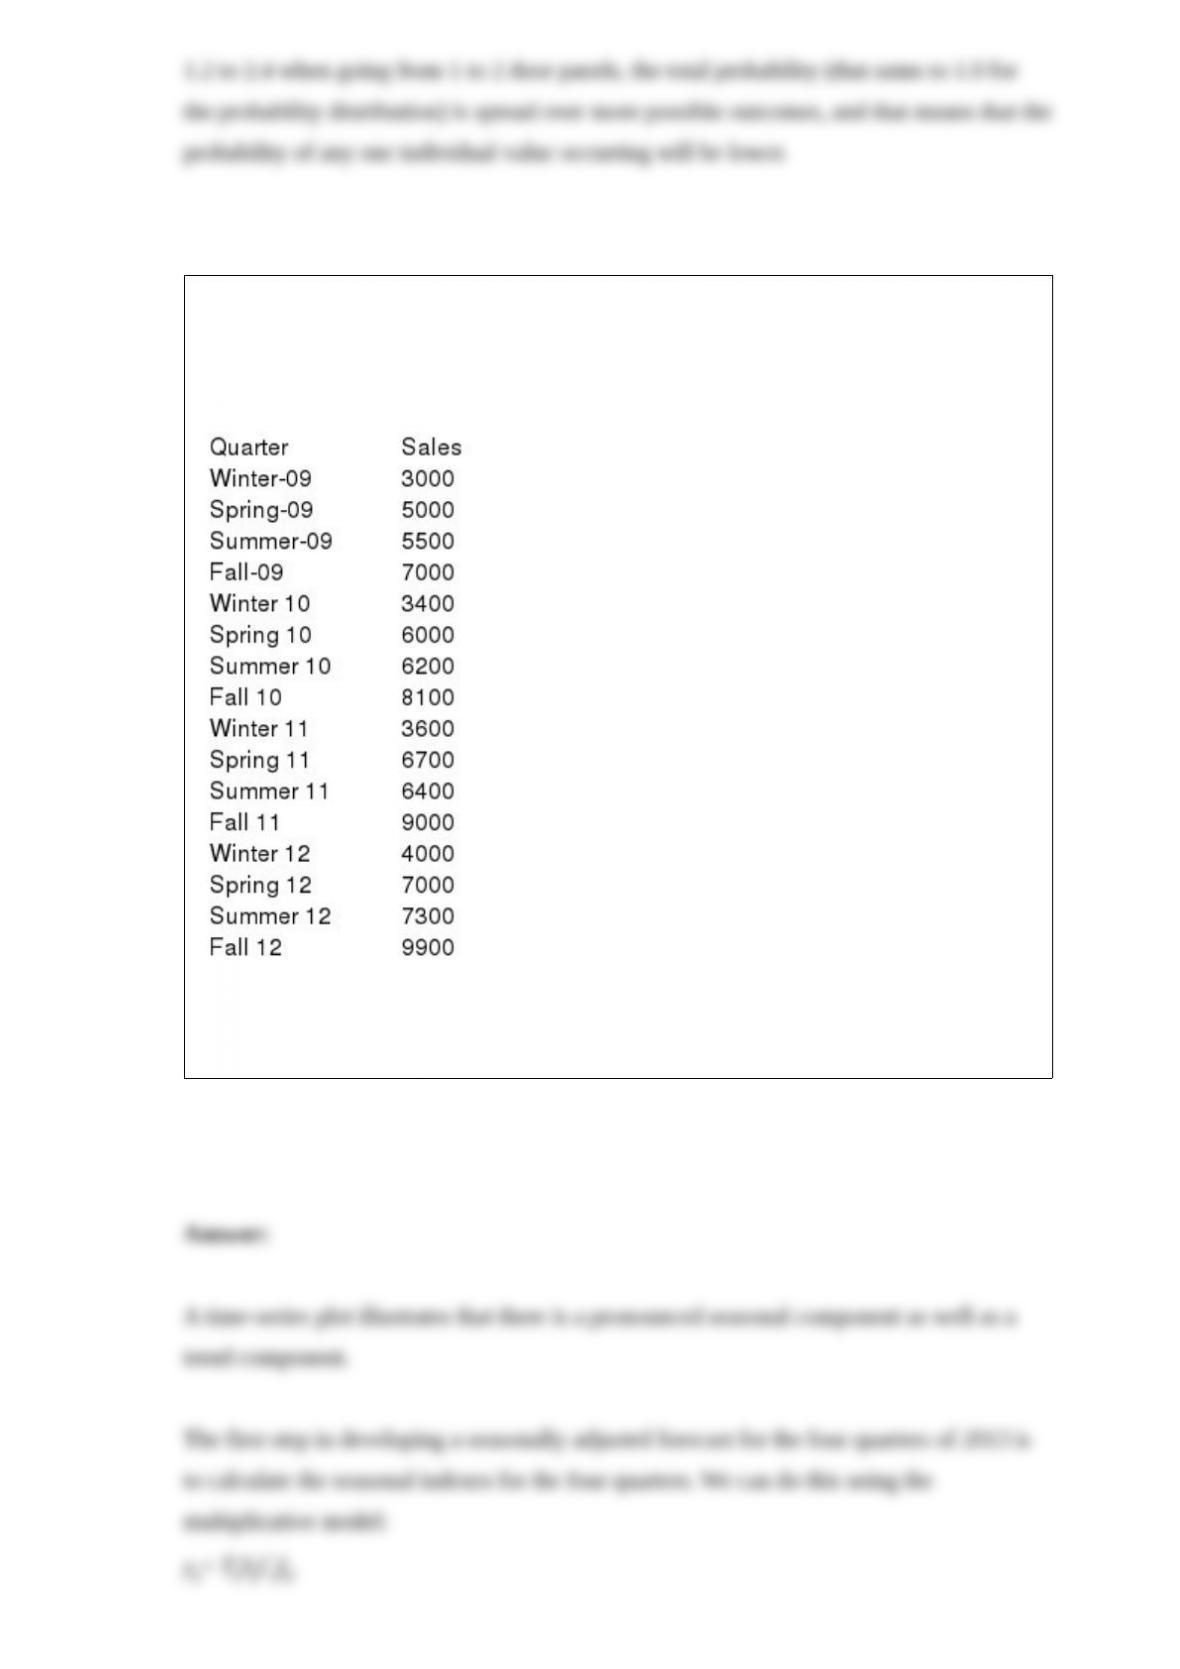
The All American Toy Company has a very seasonal sales pattern. Sales are high during
the fall quarter, drop off substantially in the winter quarter and are more typical during
spring and summer quarters. The following historical data exist for the past 16 quarters.
Based on these data, develop a seasonally adjusted forecast for the four quarters of 2013
using a linear trend regression model.

A small city has 2 ambulances. Emergency calls for ambulances arrive randomly with
an average of 0.2 calls per hour. They are concerned about the possibility of both
ambulances being busy when an additional call comes in. What is the probability of
more than 2 calls in a 1-hour period? Determine the correct distribution, explain why it
is the best distribution to use, and find the probability.
Explain the impact of the size of the sample on the shape of the sampling distribution.
The accountant for a large U.S. company is interested in finding the probability that an
account will have an incorrect balance due to being overstated or being understated. To
find this probability, which probability rule is she likely to use?
What is the underlying common element of all statistical sampling techniques?
What is meant by the term balanced design in an analysis of variance application?
When estimating the difference between two population means, when should the
normal distribution be used and when should the t-distribution be used?
At the West-Side Drive-Inn, customers arrive at the rate of 10 every 30 minutes. The
time between arrivals is exponentially distributed. Given this, what is the mean time
between arrivals?
The AMI Company has two assembly lines in its Kansas City plant. Line A produces an
average of 335 units per day with a standard deviation equal to 11 units. Line B
produces an average of 145 units per day with a standard deviation equal to 8 units.
Based on this information, which line is relatively more consistent?
The sampling distribution for a proportion has a formula for that standard error that
involves using p. Yet when a confidence interval is calculated for a proportion, the
standard error formula uses the sample proportion. Why do they differ?
The fares received by taxi drivers working for the City Taxi line are normally
distributed with a mean of $12.50 and a standard deviation of $3.25. Based on this
information, what is the probability that a specific fare will exceed $15.00?
Open the data file provided with the text called AirlinePassengers. Indicate the level of
data measurement for each variable in the data set.


