Unlock document.
This document is partially blurred.
Unlock all pages and 1 million more documents.
Get Access

The regression equation is used to estimate a value of the dependent variable Y based on
a selected value of the independent variable X.
A p-value is the same as a stated significance level.
To convert a frequency distribution to a relative frequency distribution, divide each
class frequency by the number of classes.

An economist is interested in predicting the unemployment rate based on gross
domestic product. Since the economist is interested in predicting unemployment, the
independent variable is gross domestic product.
One characteristic of the F distribution is that the computed F can only range between
-1 and +1.
A probability distribution is a mutually exclusive and collectively exhaustive listing of
experimental outcomes that can occur by chance, and their corresponding probabilities.
The binomial probability distribution is always negatively skewed.

The 95% confidence interval states that 95% of the sample means of a specified sample
size selected from a population will lie within plus and minus 1.96 standard deviations
of the hypothesized population mean.
The mean of a binomial distribution is the product of n and π.
A set of ordinal-, interval-, or ratio-level data may only have one mode.

To summarize the gender of students attending a college, the number of classes in a
frequency distribution depends on the number of students.
Statistics is defined as a body of techniques used to facilitate the collection,
organization, presentation, analysis, and interpretation of information for the purpose of
making better decisions.
The coefficient of skewness is the standard deviation divided by the mean.

When using the t distribution to calculate a confidence interval, we assume that the
population of interest is normal or nearly normal.
A confidence interval can be determined for the mean value of Y for a given value of X.
The standard deviation is the positive square root of the variance.

An illustration of an experiment is turning the ignition key of an automobile as it comes
off the assembly line to determine whether or not the engine will start.
When dependent samples are used to test for differences in the means, we compute
paired differences.
The mean of a probability distribution is called its expected value.

In a multiple regression analysis, if the regression coefficient of a dummy variable is
significant and has a sample value of 100, then the dummy variable's effect on the
dependent variable is an increase of 100.
The probability of rolling a 3 or 2 on a single die is an example of mutually exclusive
events.
To determine the value of the standard error of the mean, the standard deviation is
divided by the sample size.
If we select 100 persons from 25,000 registered voters and question them about

candidates and issues, the 100 persons are referred to as the population.
The least squares technique minimizes the sum of the squares of the vertical distances
between the actual Y values and the predicted values of Y.
The multiple coefficient of determination, R2, reports the proportion of the variation in
Y that is not explained by the variation in the set of independent variables.

The sum of the deviations from the mean for the set of numbers 4, 9, and 5 will equal
zero.
If we are testing the difference between two population proportions, it is assumed that
the two populations are approximately normal and have equal variances.
The average number of passengers on commercial flights between Chicago and New
York City is an example of a statistic.

A sampling distribution of the means is a probability distribution consisting of all
possible sample means of a given sample size selected from a population.
To determine the size of a sample, the standard deviation of the population must be
estimated by either taking a pilot survey or by approximating it based on knowledge of
the population.
To construct a binomial probability distribution, the mean must be known.
A pie chart shows the relative frequency in each class.

A sample of 100 production workers is obtained. The workers are classified by gender
(male, female) and by age (under 20, 20-29, 30-39, and 40 or over). How many degrees
of freedom are there?
A. 0
B. 3
C. 6
D. 5
Which of the following is the standard error of the mean?
A. σ
B. x/n
C.
D. s

The Office of Student Services at a large western state university maintains information
on the study habits of its full-time students. Their studies indicate that the mean amount
of time undergraduate students study per week is 20 hours. The hours studied follows
the normal distribution with a standard deviation of six hours. Suppose we select a
random sample of 144 current students. What is the probability that the mean of this
sample is between 19.25 hours and 21.0 hours?
A. 0.9544
B. 0.0160
C. 0.0986
D. 0.9104
Which shape describes a Poisson distribution?
A. Positively skewed
B. Negatively skewed
C. Symmetrical

D. All apply
For a data set with an odd number of observations that have been sorted from smallest
to largest values, where is the median located?
A. n
B. n/2
C. (n + 1)/2
D. n +
The mean number of travel days per year for salespeople employed by three hardware
distributors needs to be estimated with a 0.90 degree of confidence. For a small pilot
study, the mean was 150 days and the standard deviation was 14 days. If the population
mean is estimated within two days, how many salespeople should be sampled?
A. 133

B. 452
C. 511
D. 2,100
When a confidence interval for a population mean is constructed from sample data,
__________.
A. We can conclude that the population mean is in the interval
B. We can conclude that the population mean is not in the interval
C. We can conclude, for an infinite number of samples and corresponding confidence
intervals, that the population mean is in a stated percentage of the intervals
D. We cannot make any inferences
Which is true for a binomial distribution?
A. There are ten or more possible outcomes.

B. The probability of success remains the same from trial to trial.
C. The value of π is equal to 1.50.
D. It approximates the Poisson distribution.
For populations scattered in a wide area, the preferred technique for sampling is
___________.
The Office of Student Services at a large western state university maintains information
on the study habits of its full-time students. Their studies indicate that the mean amount
of time undergraduate students study per week is 20 hours. The hours studied follows
the normal distribution with a standard deviation of six hours. Suppose we select a
random sample of 144 current students. What is the standard error of the mean?
A. 0.50
B. 6.00
C. 0.25

D. 2.00
Which of the following assumptions is necessary to apply a goodness-of-fit test?
A. The population must be normally distributed.
B. The data are measured with a nominal or ordinal scale.
C. The population variance must be known.
D. The population mean must be known.
What happens as the scatter of data values about the regression plane increases?
A. The standard error of estimate increases.
B. R2 increases.
C. (1 - R2) decreases.

D. The error sum of squares decreases.
The Intelligence Quotient (IQ) test scores for adults are normally distributed with a
mean of 100 and a standard deviation of 15. What is the probability we could select a
sample of 50 adults and find that the mean of this sample exceeds 104?
A. 0.0294
B. 0.9412
C. Approximately one
D. 0.9706
If the correlation between two variables is close to one, the association between the
variables is ___________.
A. Strong
B. Moderate

C. Weak
D. Zero
A sample standard deviation is the best point estimate of the ___________.
A. Population range
B. Population skewness
C. Population mode
D. Population standard deviation
Refer to the following distribution of ages:

What is the class interval?
A. 9
B. 10
C. 10.5
D. 11
What does the multiple standard error of estimate measure?
A. The change in for a change in X1
B. The variability of the residuals
C. The regression mean square error in the ANOVA table
D. The amount of explained variation
If r = 0.65, what does the coefficient of determination equal?

A. 0.1945
B. 0.4225
C. 0.5778
D. 0.8061
To conduct a test of hypothesis with a small sample, we make an assumption that
__________.
A. A larger computed value of t will be needed to reject the null hypothesis
B. The region of acceptance will be wider than for large samples
C. The confidence interval will be wider than for large samples
D. The population is normally distributed
A random sample of 400 families who planned to buy a vacation residence revealed that

228 families want to buy a condominium in Florida. What is the test statistic to evaluate
the statement that 55% of those families who plan to purchase a vacation residence in
Florida want a condominium?
Three new colors have been proposed for the Jeep Grand Cherokee vehicle. They are
silvered-blue, almond, and willow green. The null hypothesis for a goodness-of-fit test
would be _______________.
A. That willow green is preferred over the other colors
B. That there is no preference between the colors
C. That any one color is preferred over the other colors
D. Impossible to determine
The production department has installed a new spray machine to paint automobile
doors. As is common with most spray guns, unsightly blemishes often appear because
of improper mixture or other problems. A worker counted the number of blemishes on
each door. Most doors had no blemishes; a few had one; a very few had two; and so on.
The average number was 0.5 per door. The distribution of blemishes followed the
Poisson distribution. Out of 10,000 doors painted, about how many would have no
blemishes?
A. About 6,065
B. About 3,935
C. About 5,000
D. About 500
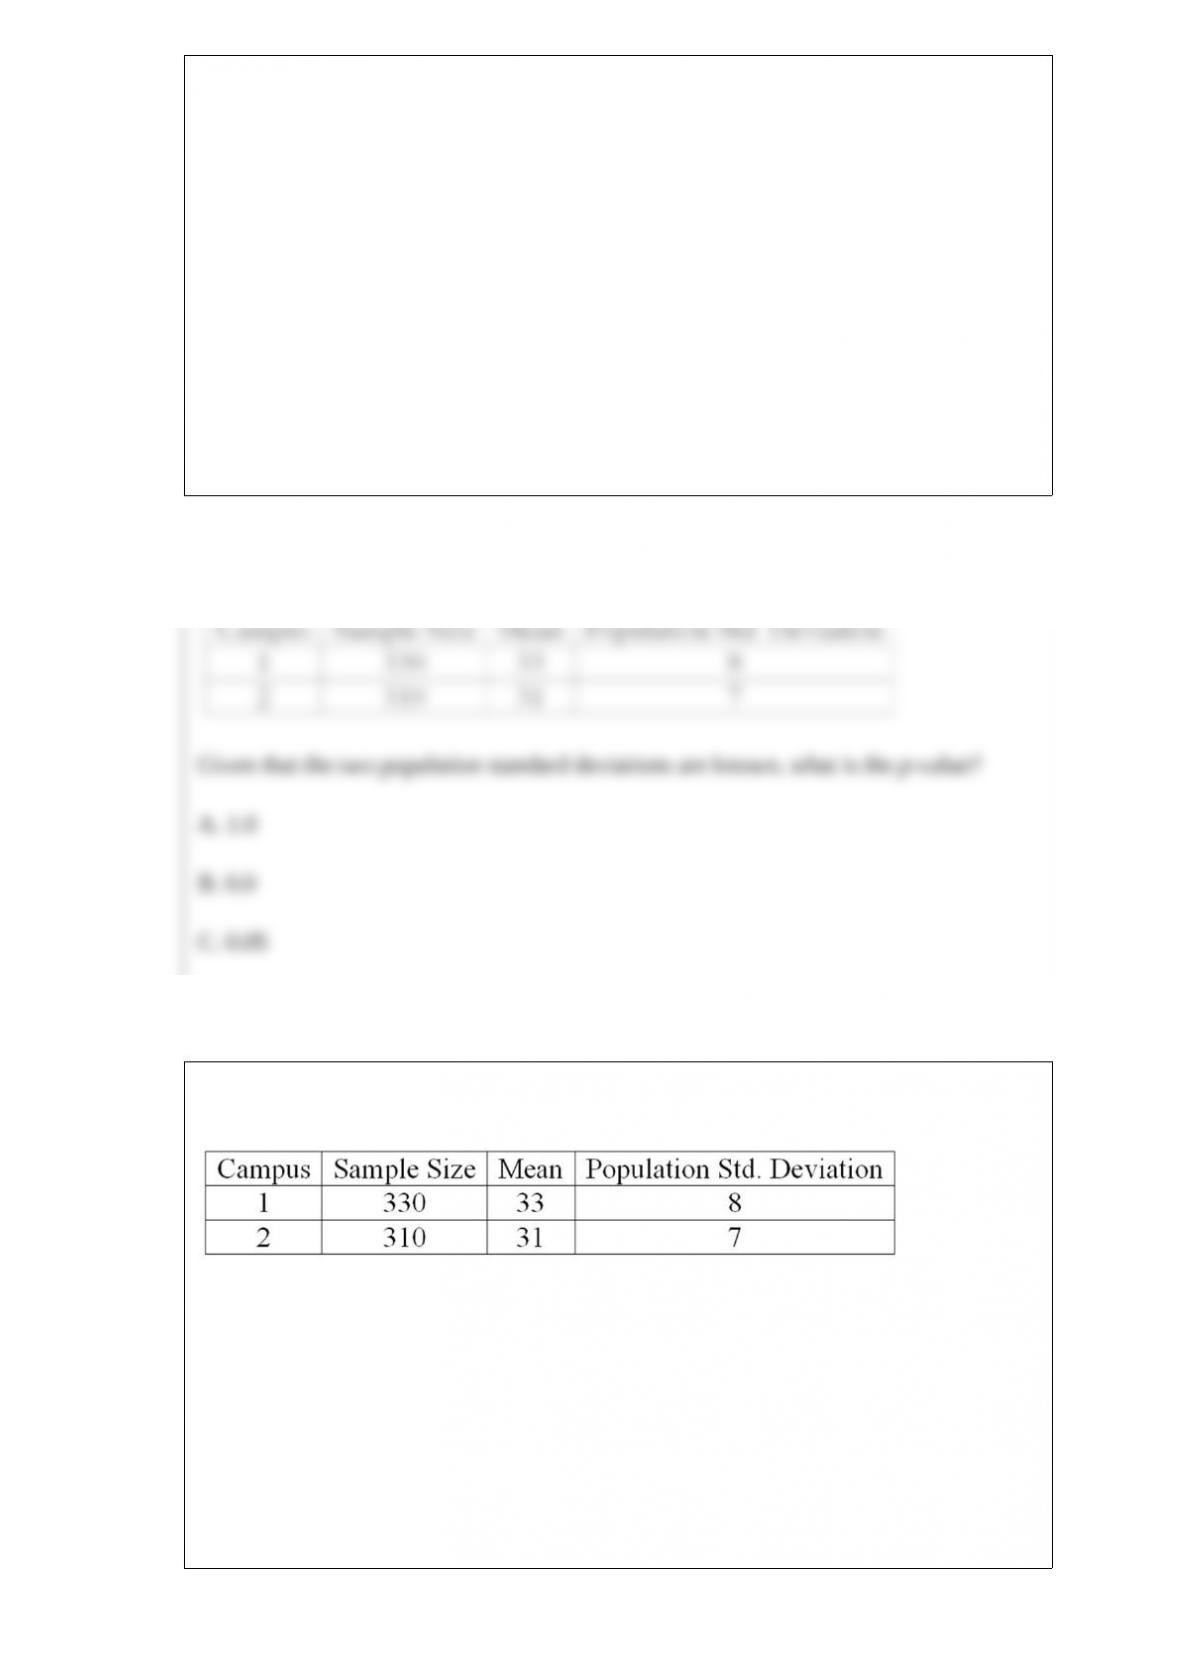
The results of a mathematics placement exam at two different campuses of Mercy
College follow:
Given that the two population standard deviations are known, what is the p-value?
A. 1.0
B. 0.0
C. 0.05
D. 0.95

David's gasoline station offers 4 cents off per gallon if the customer pays in cash and
does not use a credit card. Past evidence indicates that 40% of all customers pay in
cash. During a one-hour period, 15 customers buy gasoline at this station. This situation
is an example of what type of discrete probability distribution?
A. Continuous probability distribution
B. Poisson probability distribution
C. Binomial probability distribution
D. Hypergeometric probability distribution
The claim that "40% of those persons who retired from an industrial job before the age
of 60 would return to work if a suitable job was available" is to be investigated at the

0.02 significance level. If 74 out of the 200 workers sampled said they would return to
work, what is our decision?
A. Do not reject the null hypothesis because -0.879 lies in the region between +2.326
and -2.326.
B. Do not reject the null hypothesis because -0.879 lies in the region between +2.5760
and -2.576.
C. Reject the null hypothesis because 37% is less than 40%.
D. Do not reject the null hypothesis because 37% lies in the area between 0% and 40%.
The average score of 100 students taking a statistics final was 70 with a standard
deviation of 7. Assuming a normal distribution, what test score separates the top 25% of
the students from the lower 75% of students?
A. 70.00
B. 74.69
C. 65.31
D. 75.25

A sales manager for an advertising agency believes there is a relationship between the
number of contacts that a salesperson makes and the amount of sales dollars earned.
A regression analysis shows the following results:
= 33.4. = 2814.4. Rounding to one decimal place, the 95% confidence
interval for 30 calls is ___________.
A. 55.8, 51.5
B. 51.4, 55.9
C. 46.7, 60.6
D. 31.1, 76.2

On a finance exam, 15 accounting majors had an average grade of 90. On the same
exam, 7 marketing majors averaged 85, and 10 finance majors averaged 93. What is the
weighted mean for all 32 students taking the exam?
A. 89.84
B. 89.33
C. 89.48
D. 10.67
Which statistic is used to test hypotheses about individual regression coefficients?
A. t-statistic
B. z-statistic

C. Χ2 (chi-square statistic)
D. F
In a market test of a new chocolate raspberry coffee, a poll of 400 people (sample 1)
from Dobbs Ferry showed 250 preferred the new coffee. In Irvington, 170 out of 350
people (sample 2) preferred the new coffee. To test the hypothesis that a higher
proportion of people in Dobbs Ferry prefer the new coffee, what is the alternate
hypothesis?
A. H1: π1 < π2
B. H1: π1 > π2
C. H1: π1 = π2
D. H1: π1 ≠ π2

The first three class marks for a frequency distribution of "weights of college men"
recorded to the nearest pound are 105, 115, and 125.
What is the lower limit for the third class?
What are the two population parameters that specify the location and dispersion for a
normal distribution?
A company set up a kiosk in the Mall of America for several hours and asked randomly
selected people which color cell phone was their favorite. The results follow:
What is the probability that a person would select orange or lime as their favorite color?

What is the purpose of measuring correlation?
If the coefficient of determination is 0.81, the coefficient of correlation is _____.
A company is studying the number of daily debit card purchases. There were 20
purchases and the probability of a debit card purchase is 0.5. Of the 20 purchases, what
is the expected value of the number of debit card purchases?

A company wants to study the effect of an employee's length of employment on their
number of workdays absent. The company collected the following information on a
random sample of seven employees.
What is the independent variable (X)?
The waiting time for patients at a local walk-in health clinic follows a normal
distribution with a mean of 15 minutes and a population standard deviation of 5
minutes. The quality-assurance department sampled 50 patients and found that the mean
waiting time was 14.25 minutes. At the 0.025 significance level, decide if the sample
data support the claim that the mean waiting time is less than 15 minutes. State your
decision in terms of the null hypothesis.

For a given confidence level, the value of t ___________ as the sample size increases.
In a cumulative frequency distribution, the percent of the total frequencies that would
fall below the upper limit of the highest class would be _________.

For any probability distribution, the standard deviation is the ______________.
The probability that a one, two, or six will appear face up on the throw of one die is
_____.
For the following probability distribution:
The standard deviation is _____________.

For hypothesis tests using a chi-square statistic, the rejection region is in the
_____________ tail of the chi-square distribution.
In a departmental review of employee performance, three employees were scored a 4
(excellent performance), five employees were scored a 3 (average performance), and
one employee was scored a 1 (below average performance). To compute a weighted
mean, the weights would be ___________________.
A university has 1,000 computers available for students to use. Each computer has a
250-gigabyte hard drive. The university wants to estimate the space occupied on the
hard drives. A random sample of 100 computers showed a mean of 115 gigabytes used
with a standard deviation of 20 gigabytes. What is the probability that a sample mean is

greater than 120 gigabytes?
If samples taken from two populations are dependent, then a test of ______ differences
is applied.
Using the following regression analysis:
What is the F-statistic for the ANOVA?


