In a multiple regression model, each regression slope coefficient measures the average
change in the dependent variable for a one-unit change in the independent variable, all
other variables held constant.
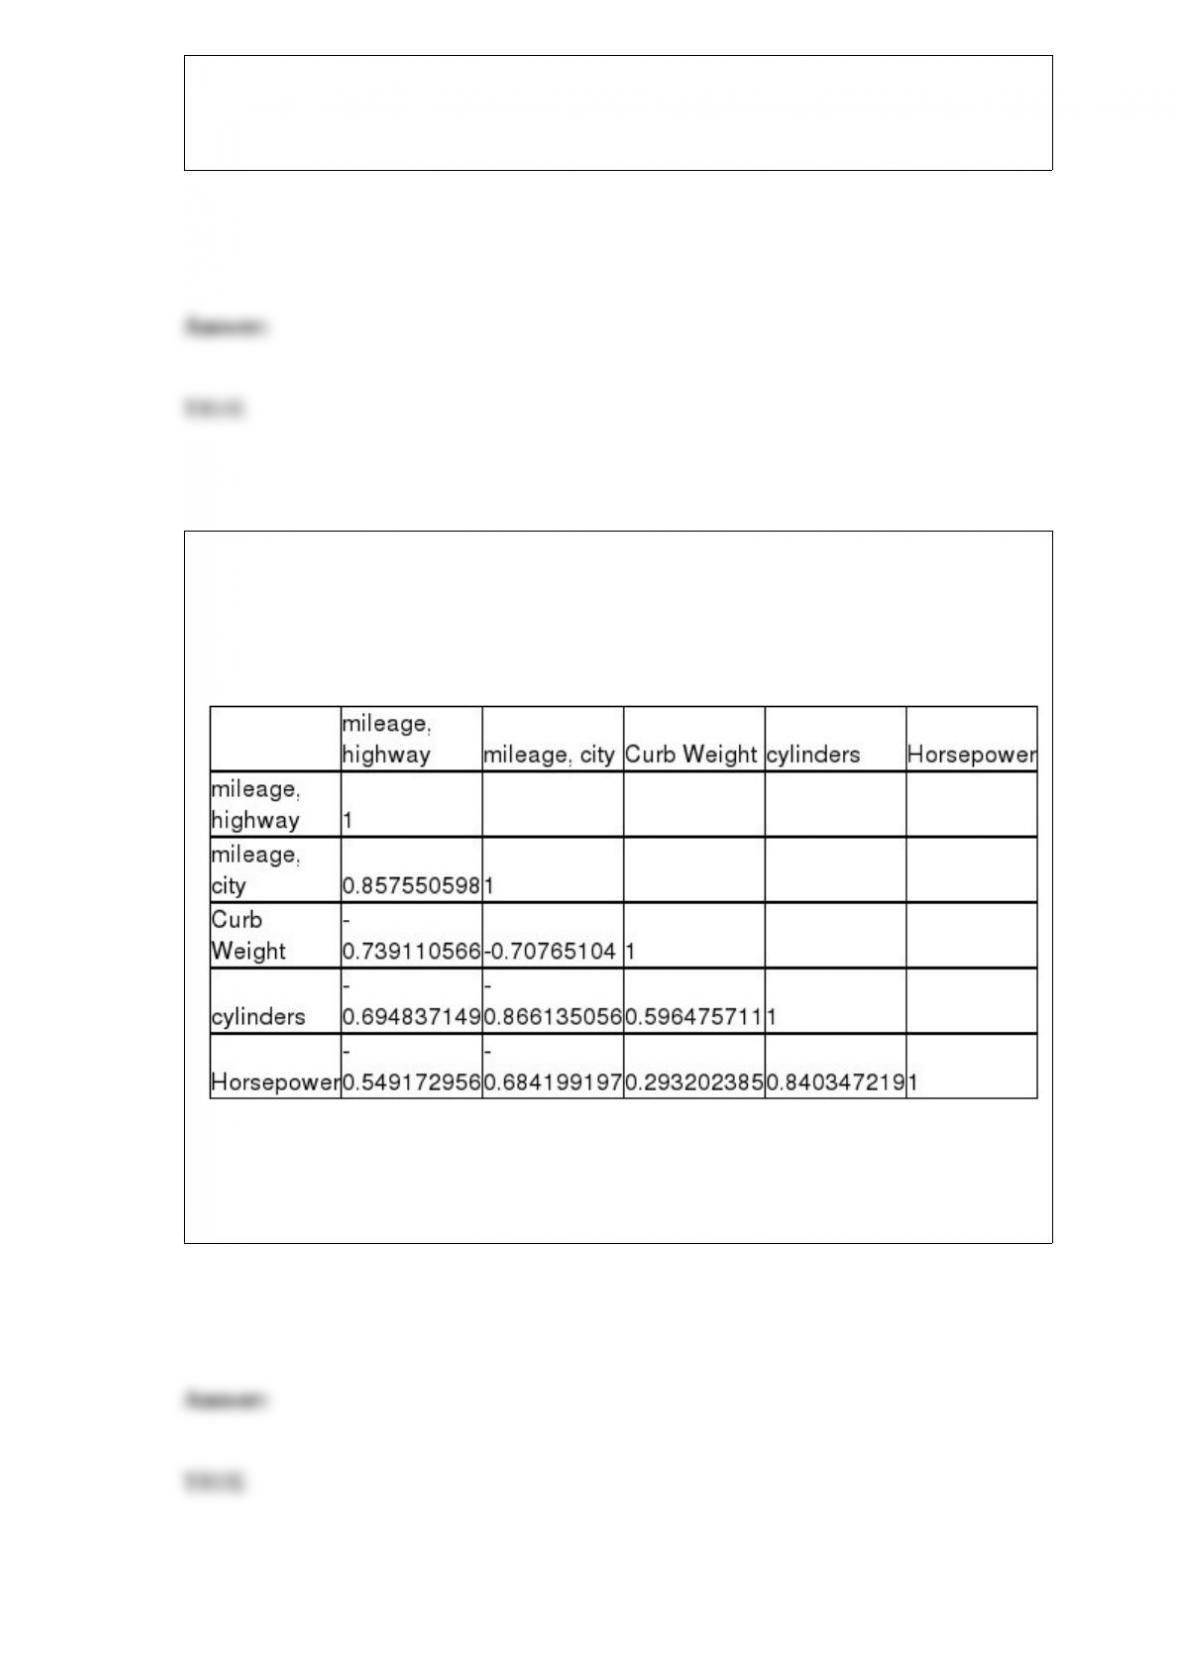
A major car magazine has recently collected data on 30 leading cars in the U.S. market.
It is interested in building a multiple regression model to explain the variation in
highway miles. The following correlation matrix has been computed from the data
collected:
If the independent variables, curb weight, cylinders, and horsepower are used together
in a multiple regression model, there may be a potential problem with multicollinearity
since horsepower and cylinders are highly correlated.
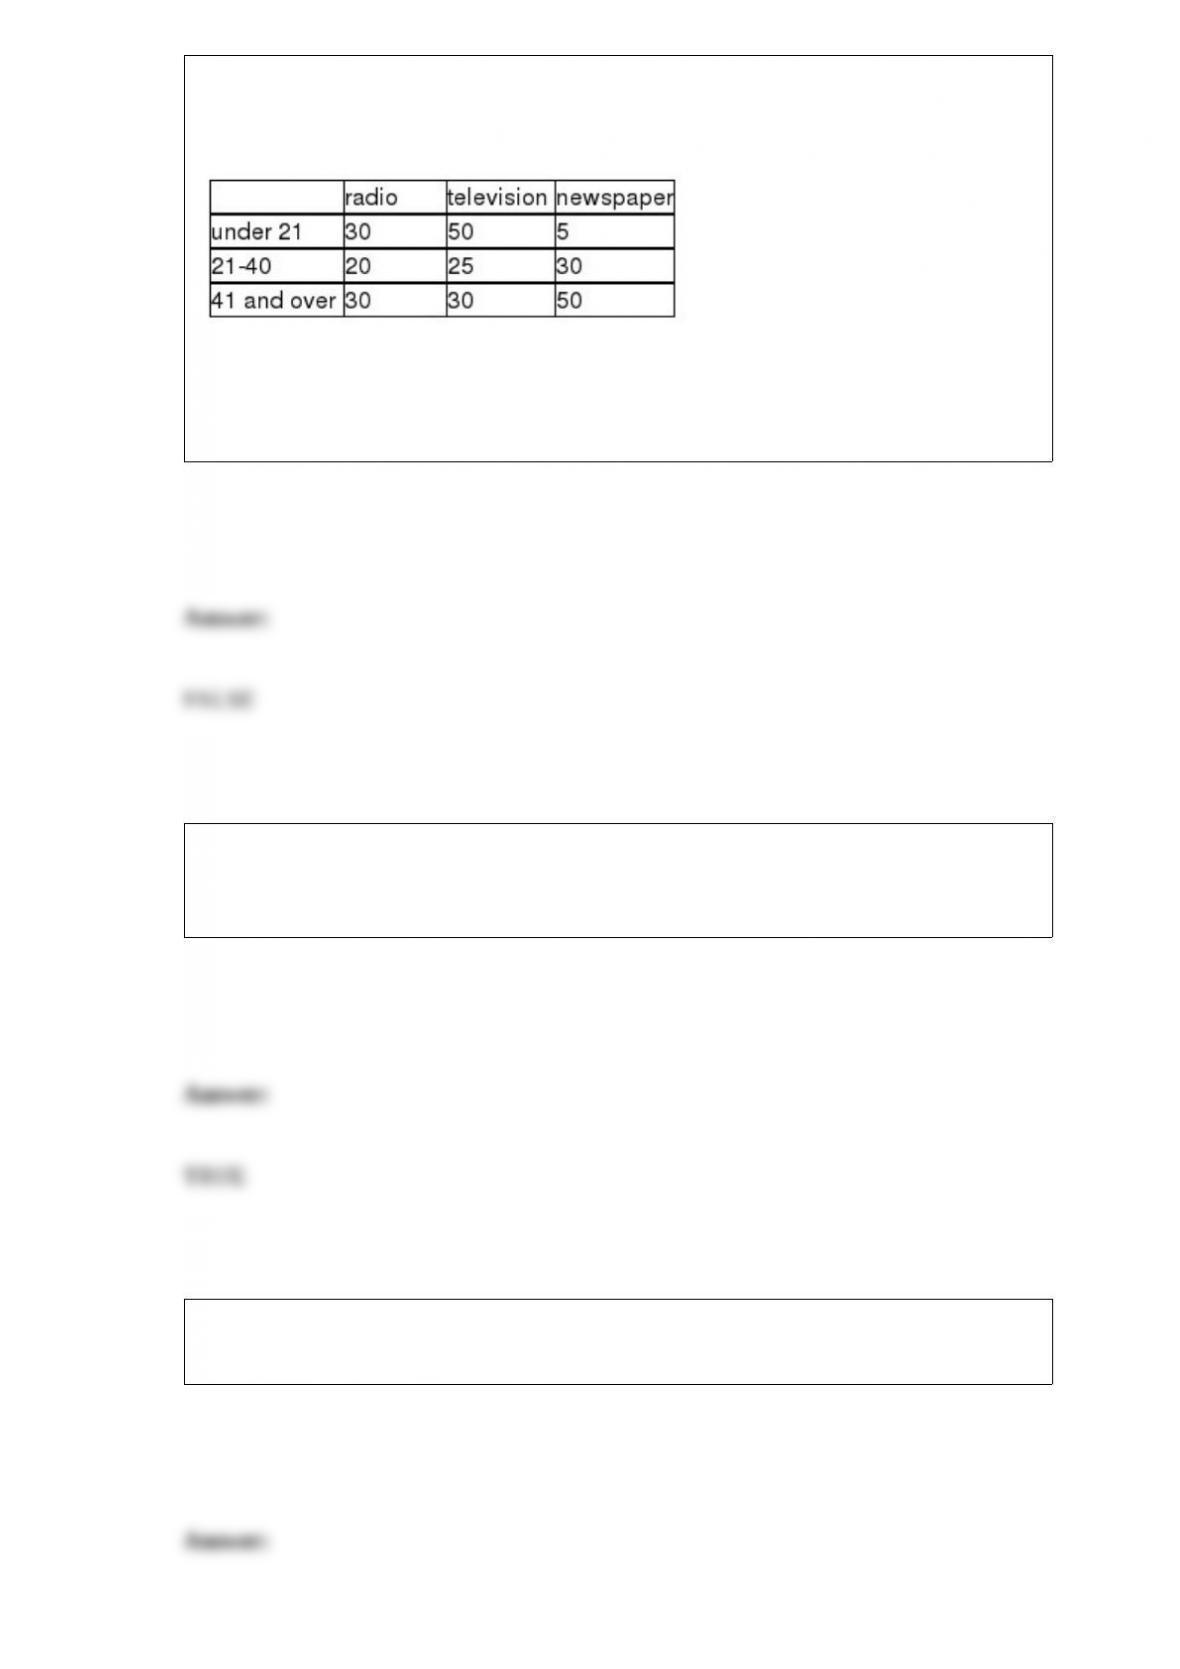
A study was recently conducted in which people were asked to indicate which news
medium was their preferred choice for national news. The following data were
observed:
Given this data, if we wish to test whether the preferred news source is independent of
age with an alpha equal to .05, the critical value will be a chi-square value with 9
degrees of freedom.
The number of customers who arrive at a fast food business during a one-hour period is
known to be Poisson distributed with a mean equal to 8.60. The probability that exactly
8 customers will arrive in a one-hour period is 0.1366.
A census is an enumeration of the entire sample of items selected from the population
of interest.
The Varden Packaging Company has a contract to fill 50 gallon barrels with gasoline
for use by the U.S. Army. The machine that Varden uses has an adjustable device that
allows the average fill per barrel to be adjusted as desired. However, the actual
distribution of fill volume from the machine is known to be normally distributed with a
standard deviation equal to 0.5 gallons. The contract that Varden has with the military
calls for no more than 2 percent of all barrels to contain less than 49.2 gallons of
gasoline. In order to meet this requirement, Varden should set the mean fill to
approximately 49.92 gallons.
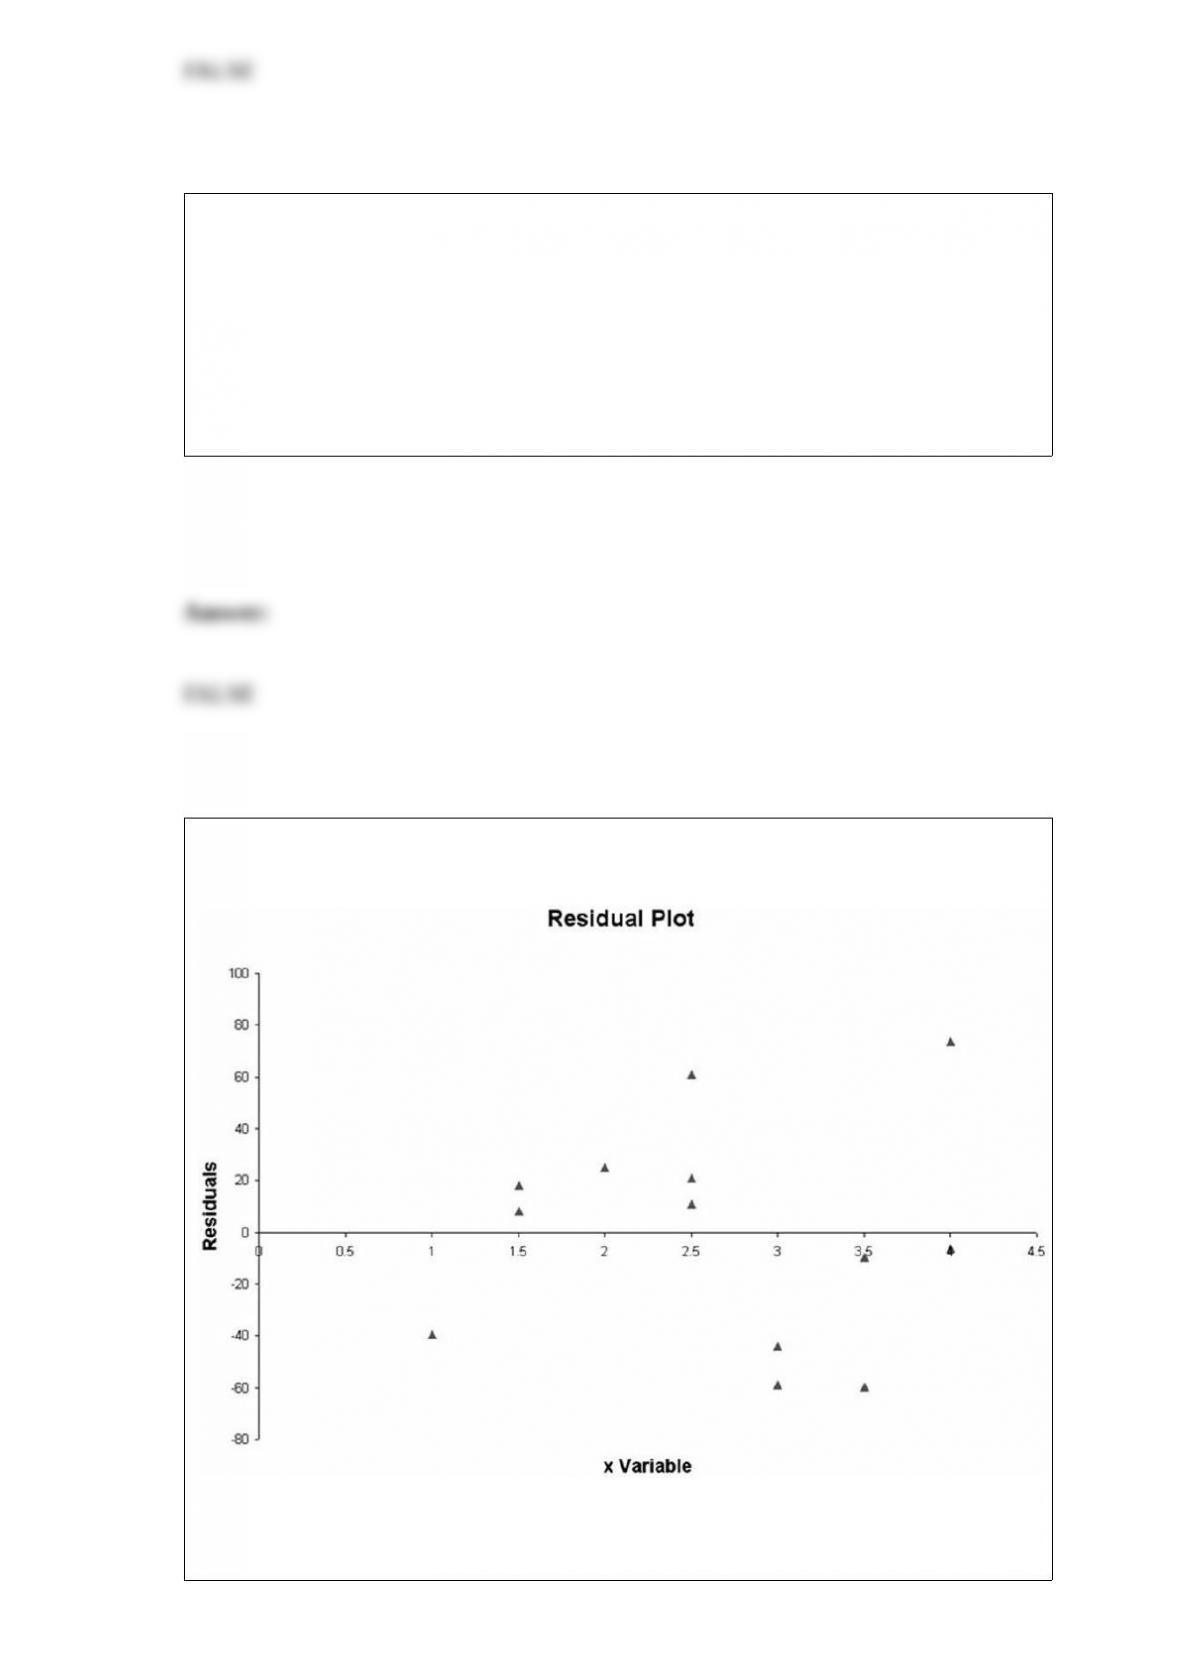
The following residual plot is an output of a regression model.
Based on this residual plot, there is evidence to suggest that the underlying relationship
between the y variable and the x variable is nonlinear.
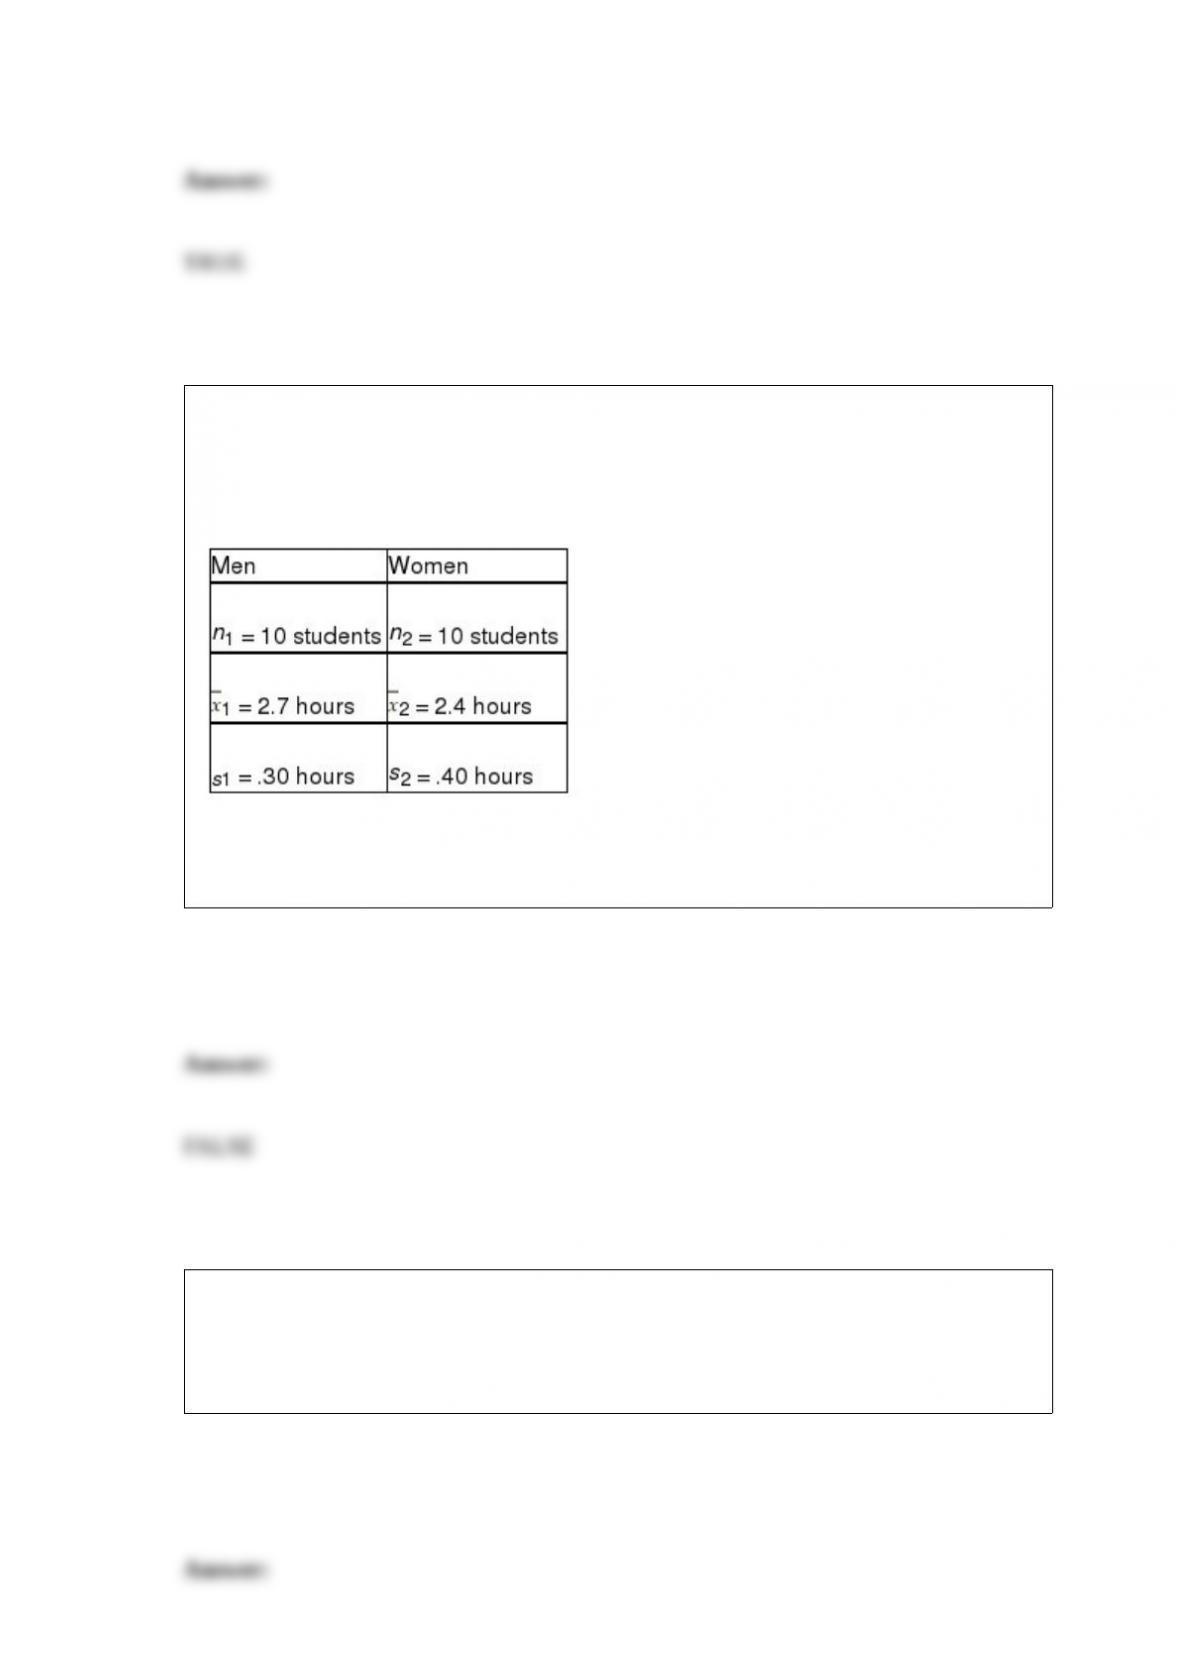
The NCAA is interested in estimating the difference in mean number of daily training
hours for men and women athletes on college campuses. It wants 95 percent confidence
and will select a sample of 10 men and 10 women for the study. The variances are
assumed equal and the populations normally distributed. The sample results are:
Based on these sample data, the critical value for developing the confidence interval is z
= 1.96.
Recently, a report in a financial journal indicated that the 90 percent confidence interval
estimate for the proportion of investors who own one or more mutual funds is between
0.88 and 0.92. Given this information, the sample size that was used in this study was
approximately 609 investors.

When dealing with the number of occurrences of an event over a specified interval of
time or space, the appropriate probability distribution is hypergeometric.
Common cause variation is variation in the output of a process that is unexpected and
has an assignable cause.
Sampling error is the difference between the sample statistic and the population
parameter.

The makers of a particular type of candy have stated that 75 percent of their sacks of
candy will contain 6 ounces or more of candy. A consumer group that studies such
claims recently selected a random sample of 100 sacks of this candy. Of these, 70 sacks
actually contained 6 ounces or more. The probability that 70 or fewer sacks would
contain 6 ounces or less is approximately 0.1251.
The sign on the intercept coefficient in a simple regression model will always be the
same as the sign on the correlation coefficient.
If a process control chart has only one point outside the upper or lower control limits,
there is insufficient evidence to conclude that the process was out of control at the time
that the measurement was taken.
The only two types of random variables are discrete and continuous random variables.

In a large sample test about a single population median, it is appropriate to employ the
standard normal distribution so long as the population is also normally distributed.
The mean of a sampling distribution would be equal to the mean of the population from
which the sampling distribution is constructed.
If a population is not normally distributed, then the sampling distribution for the mean
also cannot be normally distributed.

A dairy farm in Wisconsin bottles milk in one gallon containers. At a recent meeting,
the production manager asked top management for a new filling machine that he argued
would assure that all containers had exactly one gallon of milk. Based on sound
statistical principles, the top management group should conclude that the production
manager could have merit to his argument.
The distribution of T-values in the Wilcoxon Matched-Pairs Signed Rank test is
approximately normal if the sample size (number of matched pairs) exceeds 25.
The vehicle speeds on a city street have been determined to be normally distributed
with a mean of 33.2 mph and a variance of 16. Based on this information, the
probability that if three randomly selected vehicles are monitored and that two of the
three will exceed the 35 mph speed limit is slightly greater than 0.18.

Sawyer & Company is a law firm in Dallas, Texas. Recently, the administrative
manager prepared a report for the managing partners that showed the number of court
cases handled by the firm monthly over the past three years. It was appropriate for her
to use a line chart in this case.
A major package delivery company claims that at least 95 percent of the packages it
delivers reach the destination on time. As part of the evidence in a lawsuit against the
package company, a random sample of n = 200 packages was selected. A total of 188 of
these packages were delivered on time. Using a significance level of 0.05, the critical
value for this hypothesis test is approximately 0.90.
When choosing class boundaries for a frequency distribution, classes such as 60-70,
70-80, 80-90 would be acceptable.

If the probability of one event occurring is .40 and the probability of a second event
occurring is 0.60, then the probability that both events will occur must be 1.0 since that
is the maximum value a probability can be.
Given a sample correlation r = -0.5 and a sample size of n = 30, the test statistic for
testing whether the two variables are significantly correlated is approximately t =
-3.055.
When calculating a confidence interval, the reason for using the t-distribution rather
than the normal distribution for the critical value is that the population standard
deviation is unknown.
If a company has the opportunity to bid on three contracts, A, B, and C, then the
number of these contracts that are awarded to the company would be considered an
elementary event.

Two common unweighted indexes are the Paasche Index and the Laspeyres Index.
A cell phone service provider has selected a random sample of 20 of its customers in an
effort to estimate the mean number of minutes used per day. The results of the sample
included a sample mean of 34.5 minutes and a sample standard deviation equal to 11.5
minutes. Based on this information, and using a 95 percent confidence level:
A) the critical value is z = 1.96
B) the critical value is z = 1.645
C) the critical value is t = 2.093
D) The critical value can’t be determined without knowing the margin of error.
You are given the following results of a paired-difference test:

= -4.6
sd = 0.25
n = 16
Construct a 99% confidence interval estimate for the paired difference in mean values.
A) -2.912 ——– -2.718
B) -4.784 ——– -4.416
C) -5.241 ——– -4.971
D) -3.141 ——– -2.812
At a manufacturing plant workers are divided into 4 different teams that rotate shifts.
The number of units produced by each team is recorded. The best type of chart to
display the data is a:
A) pie chart.
B) histogram.
C) ogive.
D) line chart.
A test is conducted to compare three different income tax software packages to
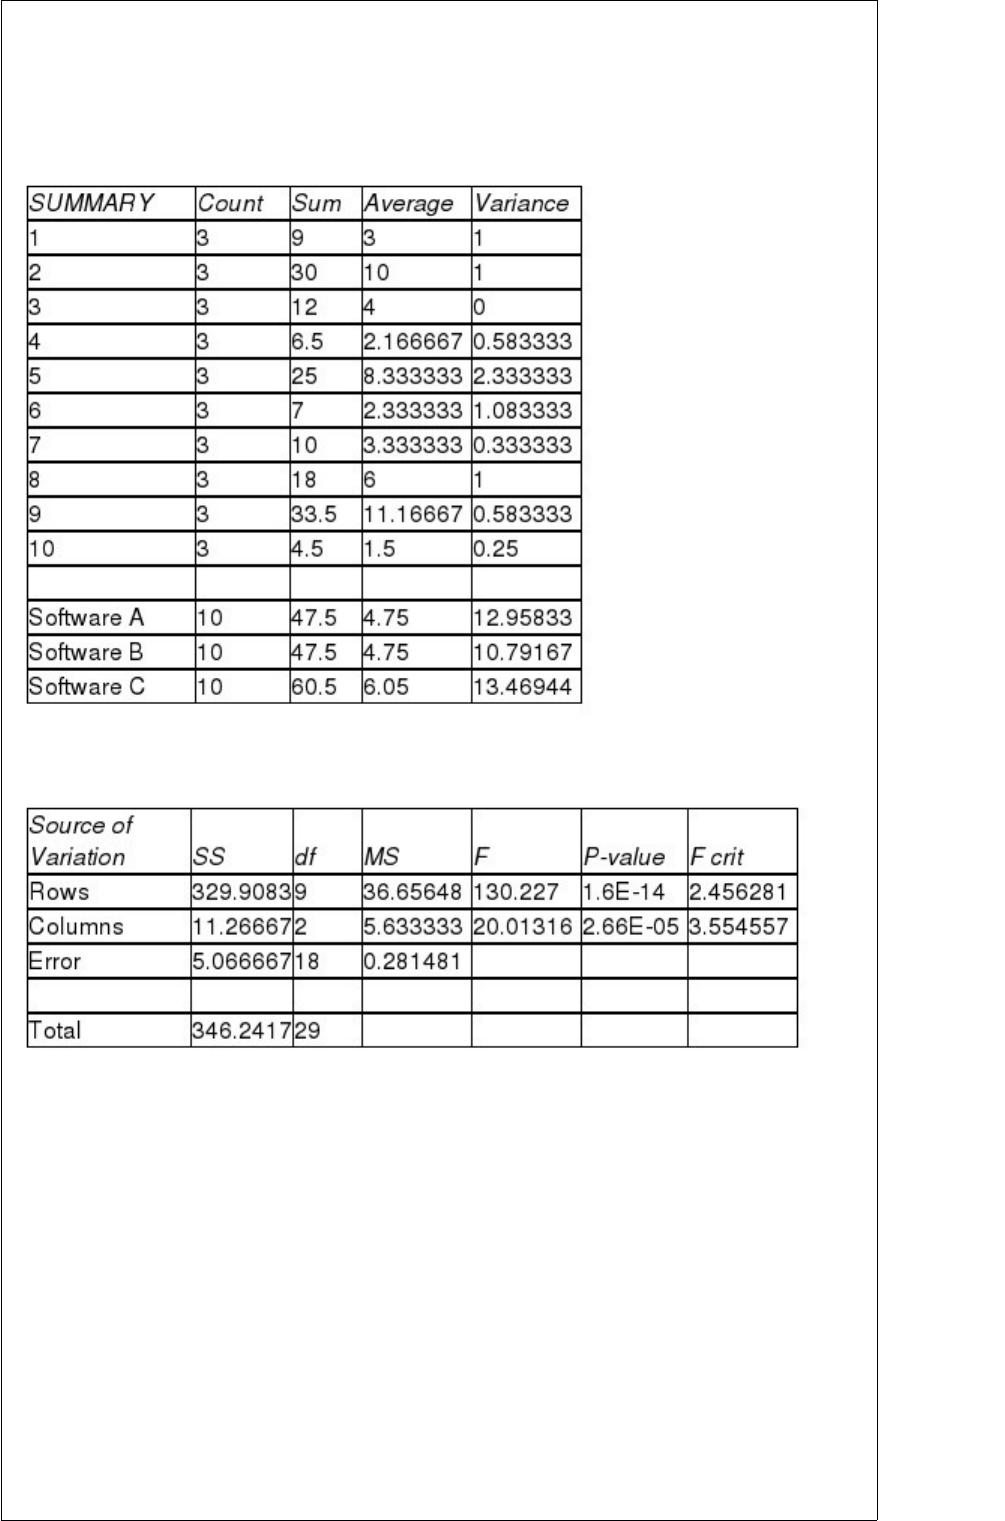
determine whether there is any difference in the average time it takes to prepare income
tax returns using the three different software packages. Ten different persons’ income
tax returns are done by each of the three software packages and the time is recorded for
each. The computer results are shown below.
ANOVA
Based on these results and using a 0.05 level of significance which is correct regarding
the primary hypothesis?
A) The three software packages are not all the same because p-value = 1.6E-14 is less
than 0.05.
B) The three software packages are all the same because p-value = 1.6 is greater than
0.05.
C) The three software packages are not all the same because p-value = 2.66E-5 is less
than 0.05.
D) The three software packages are all the same because p-value = 2.66 is greater than
0.05.
Given a population in which the probability of success is p =0.20, if a sample of 500
items is taken, then calculate the probability the proportion of successes in the sample
will be between 0.18 and 0.23.
A) 0.7812
B) 0.8221
C) 0.9212
D) 0.6812
For the following hypothesis:
With n = 20, = 71.2, s = 6.9, and α = 0.1, state the conclusion.
A) Because the computed value of t = 0.78 is not greater than 2.1727, reject the null
hypothesis.
B) Because the computed value of t = 0.78 is not greater than 2.1727, do not reject the
null hypothesis.
C) Because the computed value of t = 0.78 is not greater than 1.3277, reject the null
hypothesis.
D) Because the computed value of t = 0.78 is not greater than 1.3277, do not reject the
null hypothesis.
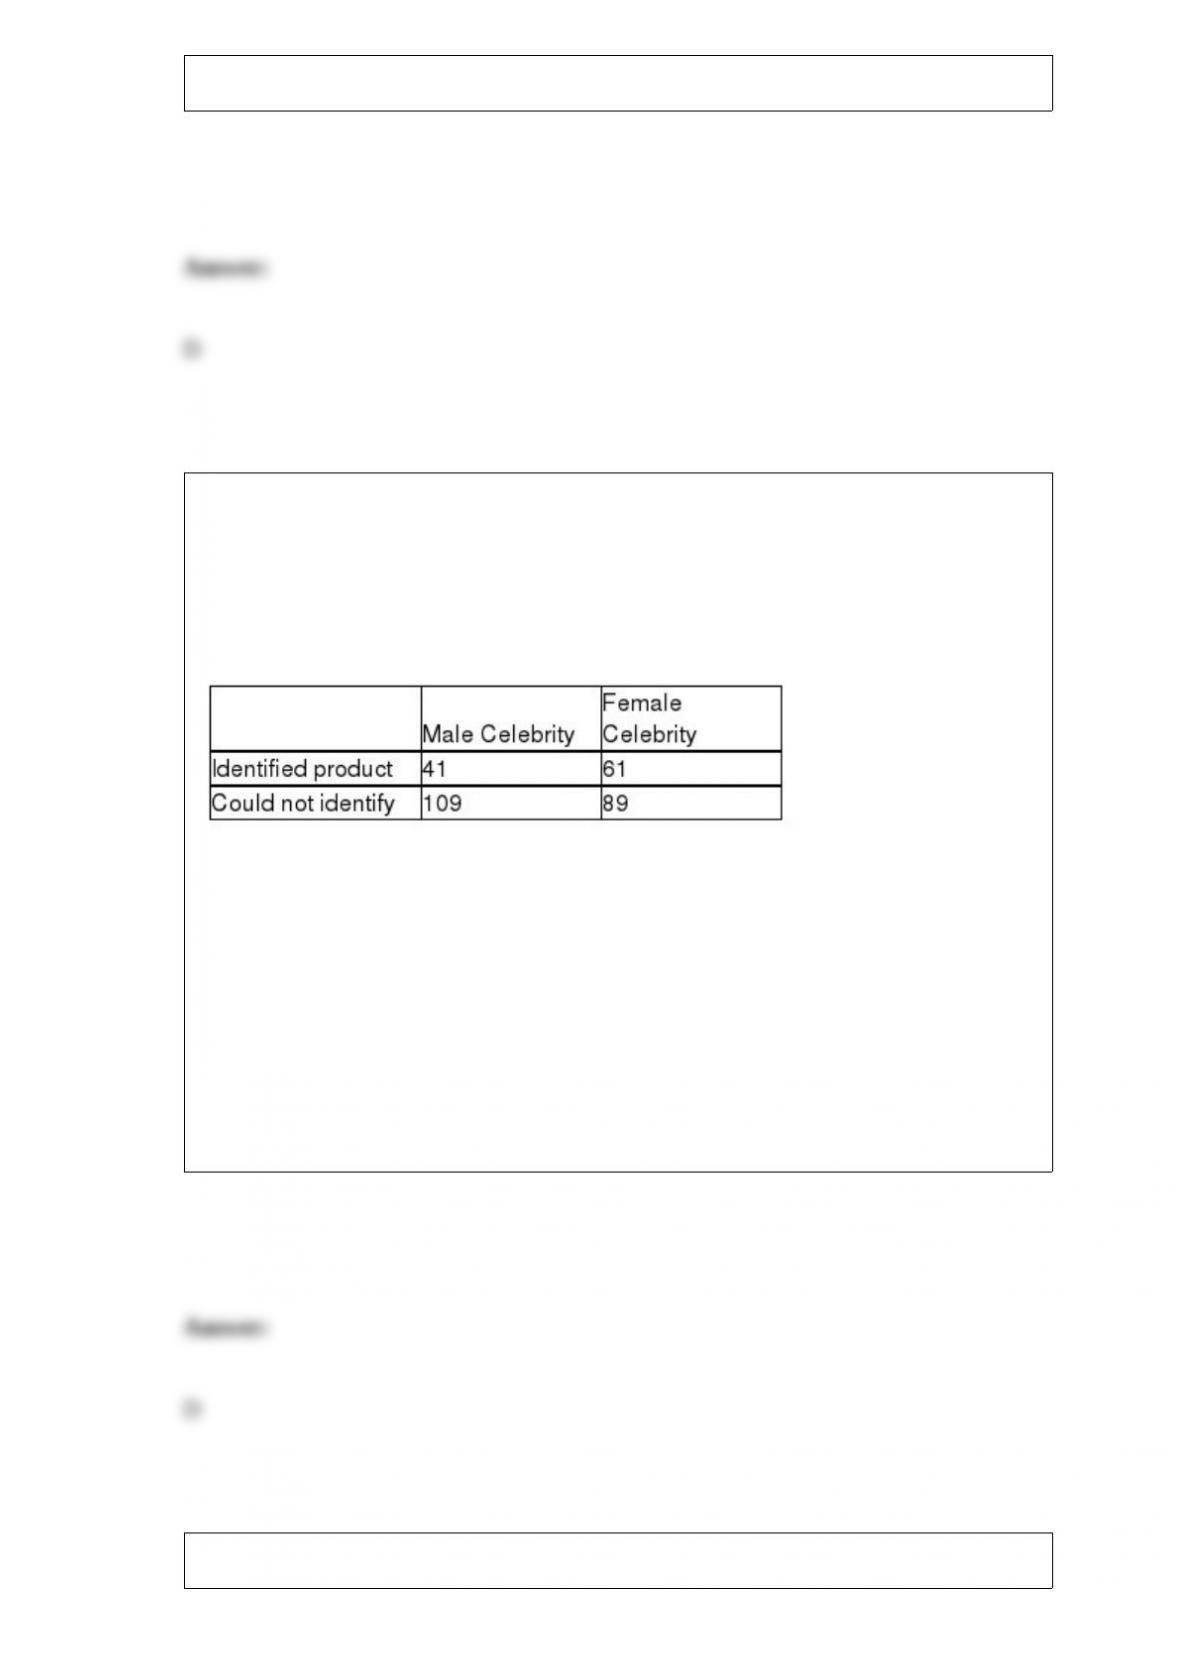
Many companies use well-known celebrities as spokespeople in their TV
advertisements. A study was conducted to determine whether brand awareness of
female TV viewers and the gender of the spokesperson are independent. Each in a
sample of 300 female TV viewers was asked to identify a product advertised by a
celebrity spokesperson. The gender of the spokesperson and whether or not the viewer
could identify the product was recorded. The numbers in each category are given below.
Referring to these sample data, which of the following values is the correct value of the
test statistic?
A) Approximately 9.48
B) Nearly 23.0
C) About 3.84
D) Approximately 5.94
Data collected at a fixed point in time are:

A) time-series data.
B) approximate time-series data.
C) cross-sectional data.
D) panel data.
Students who have completed a speed reading course have reading speeds that are
normally distributed with a mean of 950 words per minute and a standard deviation
equal to 220 words per minute. Based on this information, what is the probability of a
student reading at more than 1400 words per minute after finishing the course?
A) 0.0202
B) 0.5207
C) 0.4798
D) 0.9798
Which of the following will increase the width of a confidence interval (assuming that
everything else remains constant)?
A) Decreasing the confidence level

B) Increasing the sample size
C) A decrease in the standard deviation
D) Decreasing the sample size
In an application to estimate the mean number of miles that downtown employees
commute to work roundtrip each day, the following information is given:
n = 20
= 4.33
s = 3.50
The point estimate for the true population mean is:
A) 1.638
B) 4.33 1.638
C) 4.33
D) 3.50
In a two-tailed hypothesis test for a population mean, an increase in the sample size
will:
A) have no effect on whether the null hypothesis is true or false.

B) have no effect on the significance level for the test.
C) result in a sampling distribution that has less variability.
D) All of the above are true.
A plywood manufacturer is interested in monitoring the thickness of the plywood.
Which of the following would be most useful for doing this?
A) p-charts
B) c-charts
C) -charts
D) Histograms
The cost of a college education has increased at a much faster rate than costs in general
over the past twenty years. In order to compensate for this, many students work part- or
full-time in addition to attending classes. At one university, it is believed that the
average hours students work per week exceeds 20. To test this at a significance level of
0.05, a random sample of n = 20 students was selected and the following values were
observed:
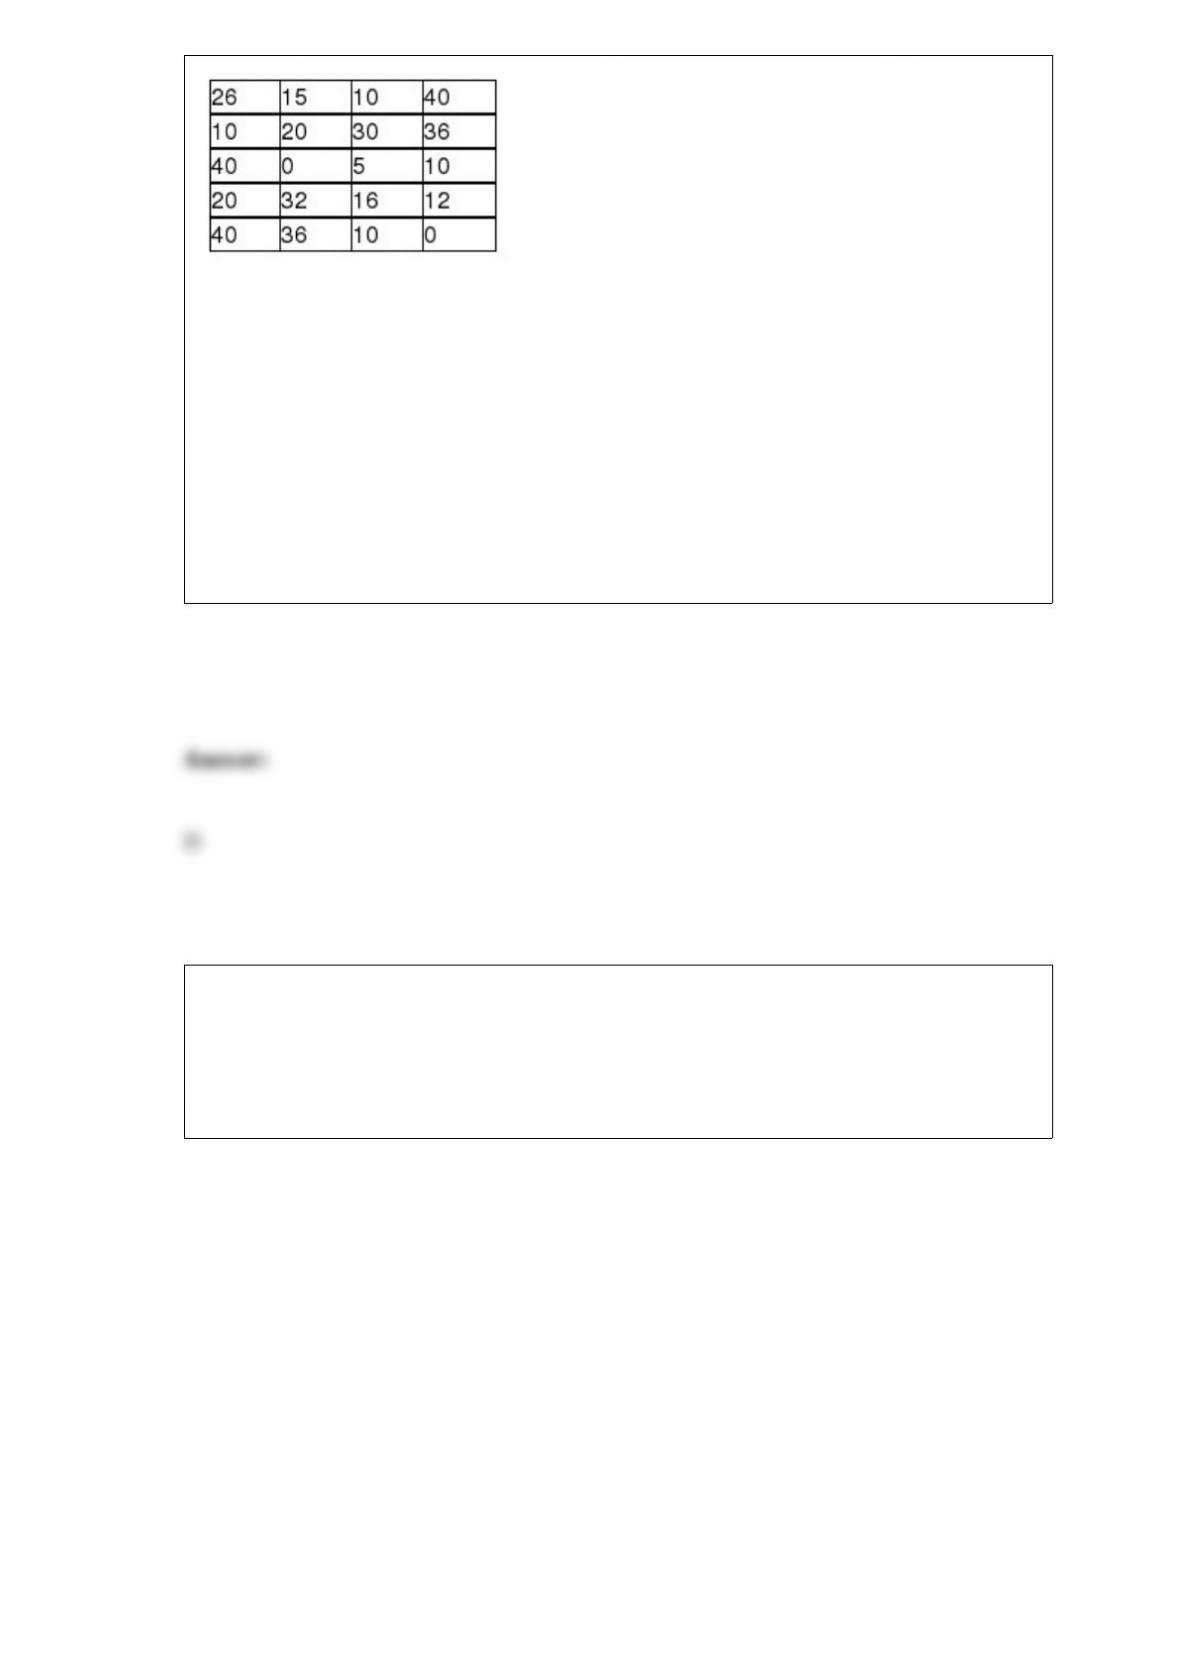
Based on these sample data, which of the following statements is true?
A) The standard error of the sampling distribution is approximately 3.04.
B) The test statistic is approximately t = 0.13.
C) The research hypothesis that the mean hours worked exceeds 20 is not supported by
these sample data.
D) All of the above are true.
The editors of a national automotive magazine recently studied 30 different automobiles
sold in the United States with the intent of seeing whether they could develop a multiple
regression model to explain the variation in highway miles per gallon. A number of
different independent variables were collected. The following regression output (with
some values missing) was recently presented to the editors by the magazine’s analysts:
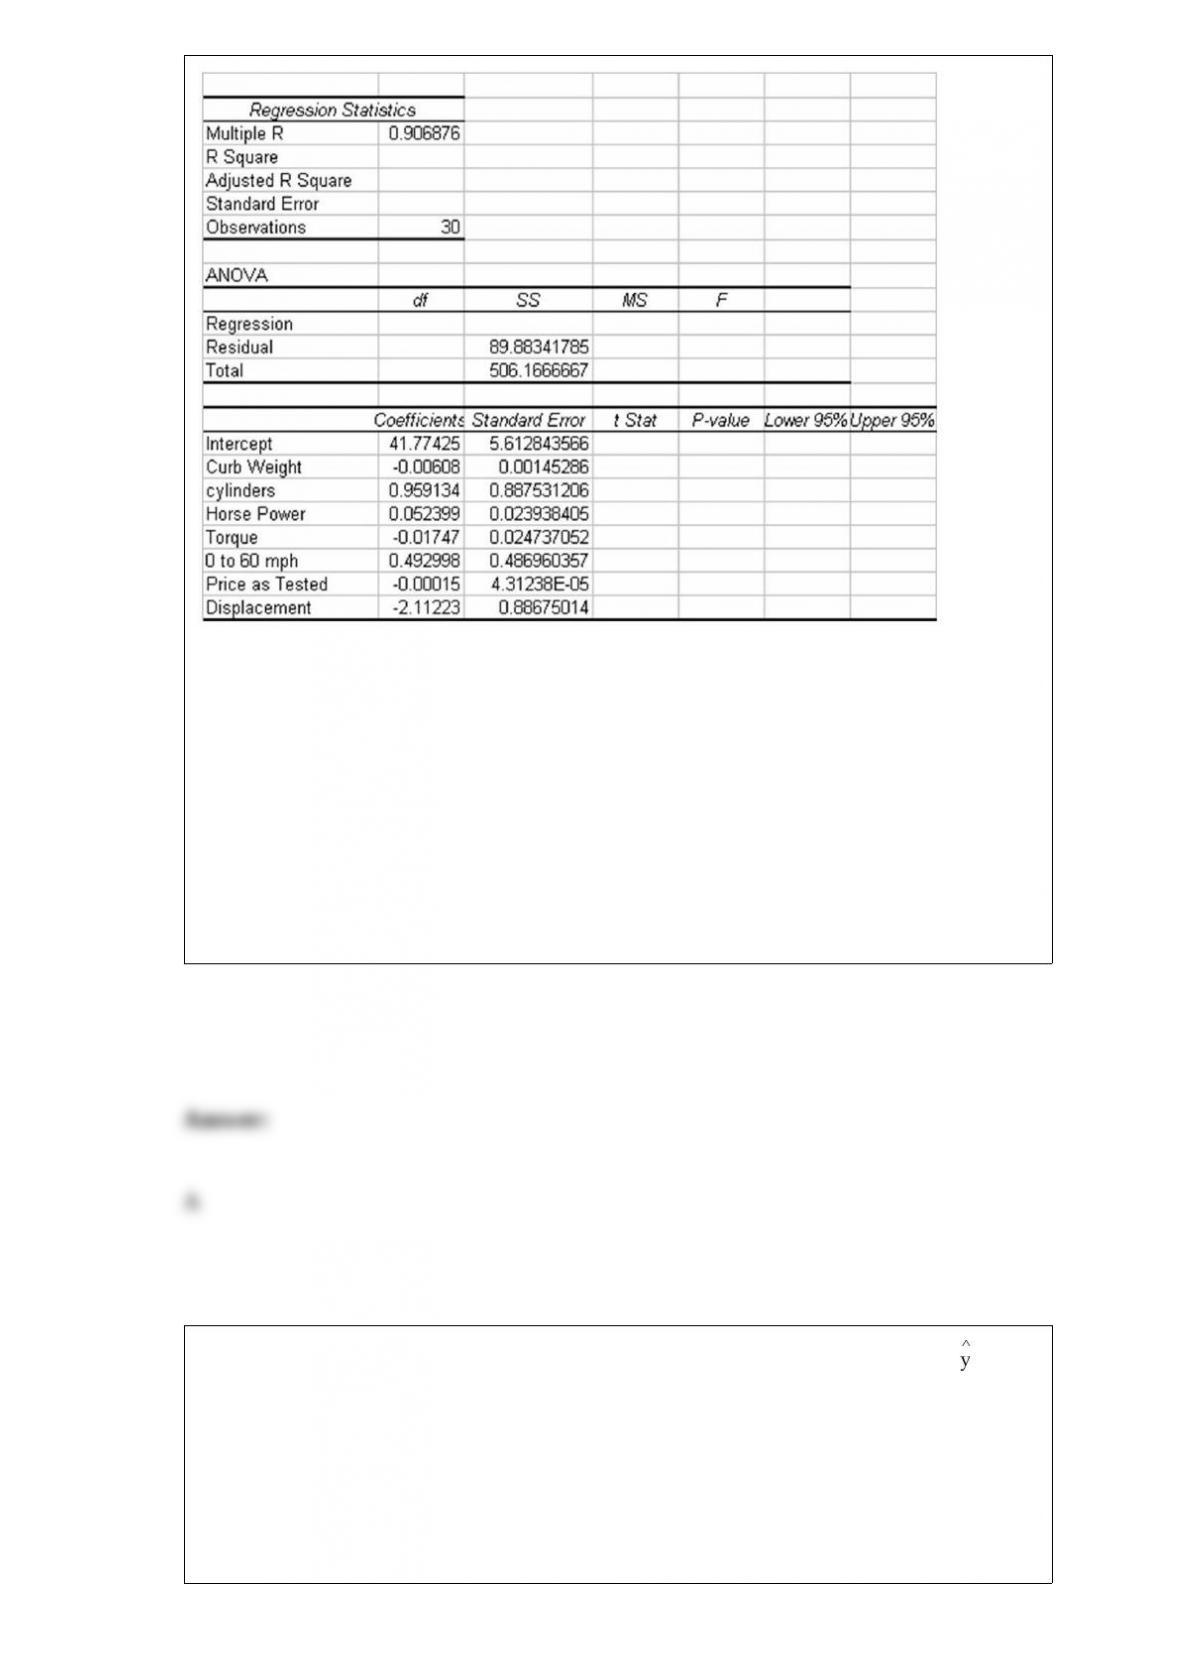
Based on this output and your understanding of multiple regression analysis, what is the
value of the standard error of the estimate for this model?
A) Approximately 2.02
B) About 5.97
C) Approximately 14.05
D) Nearly 8.0
A regression equation that predicts the price of homes in thousands of dollars is t =
24.6 + 0.055x1 – 3.6x2, where x2 is a dummy variable that represents whether the house
in on a busy street or not. Here x2 = 1 means the house is on a busy street and x2 = 0
means it is not. Based on this information, which of the following statements is true?
A) On average, homes that are on busy streets are worth $3600 less than homes that are
not on busy streets.

B) On average, homes that are on busy streets are worth $3.6 less than homes that are
not on busy streets.
C) On average, homes that are on busy streets are worth $3600 more than homes that
are not on busy streets.
D) On average, homes that are on busy streets are worth $3.6 more than homes that are
not on busy streets.
Of the last 100 customers entering a computer shop, 25 have purchased a computer. If
the classical probability assessment for computing probability is used, the probability
that the next customer will purchase a computer is:
A) 0.25
B) 0.50
C) 1.00
D) 0.75
Assume P(A) = 0.4 and P(B) = 0.2 and P(A and B) = 0.1, then the probability of P(A or
B) = 0.7.
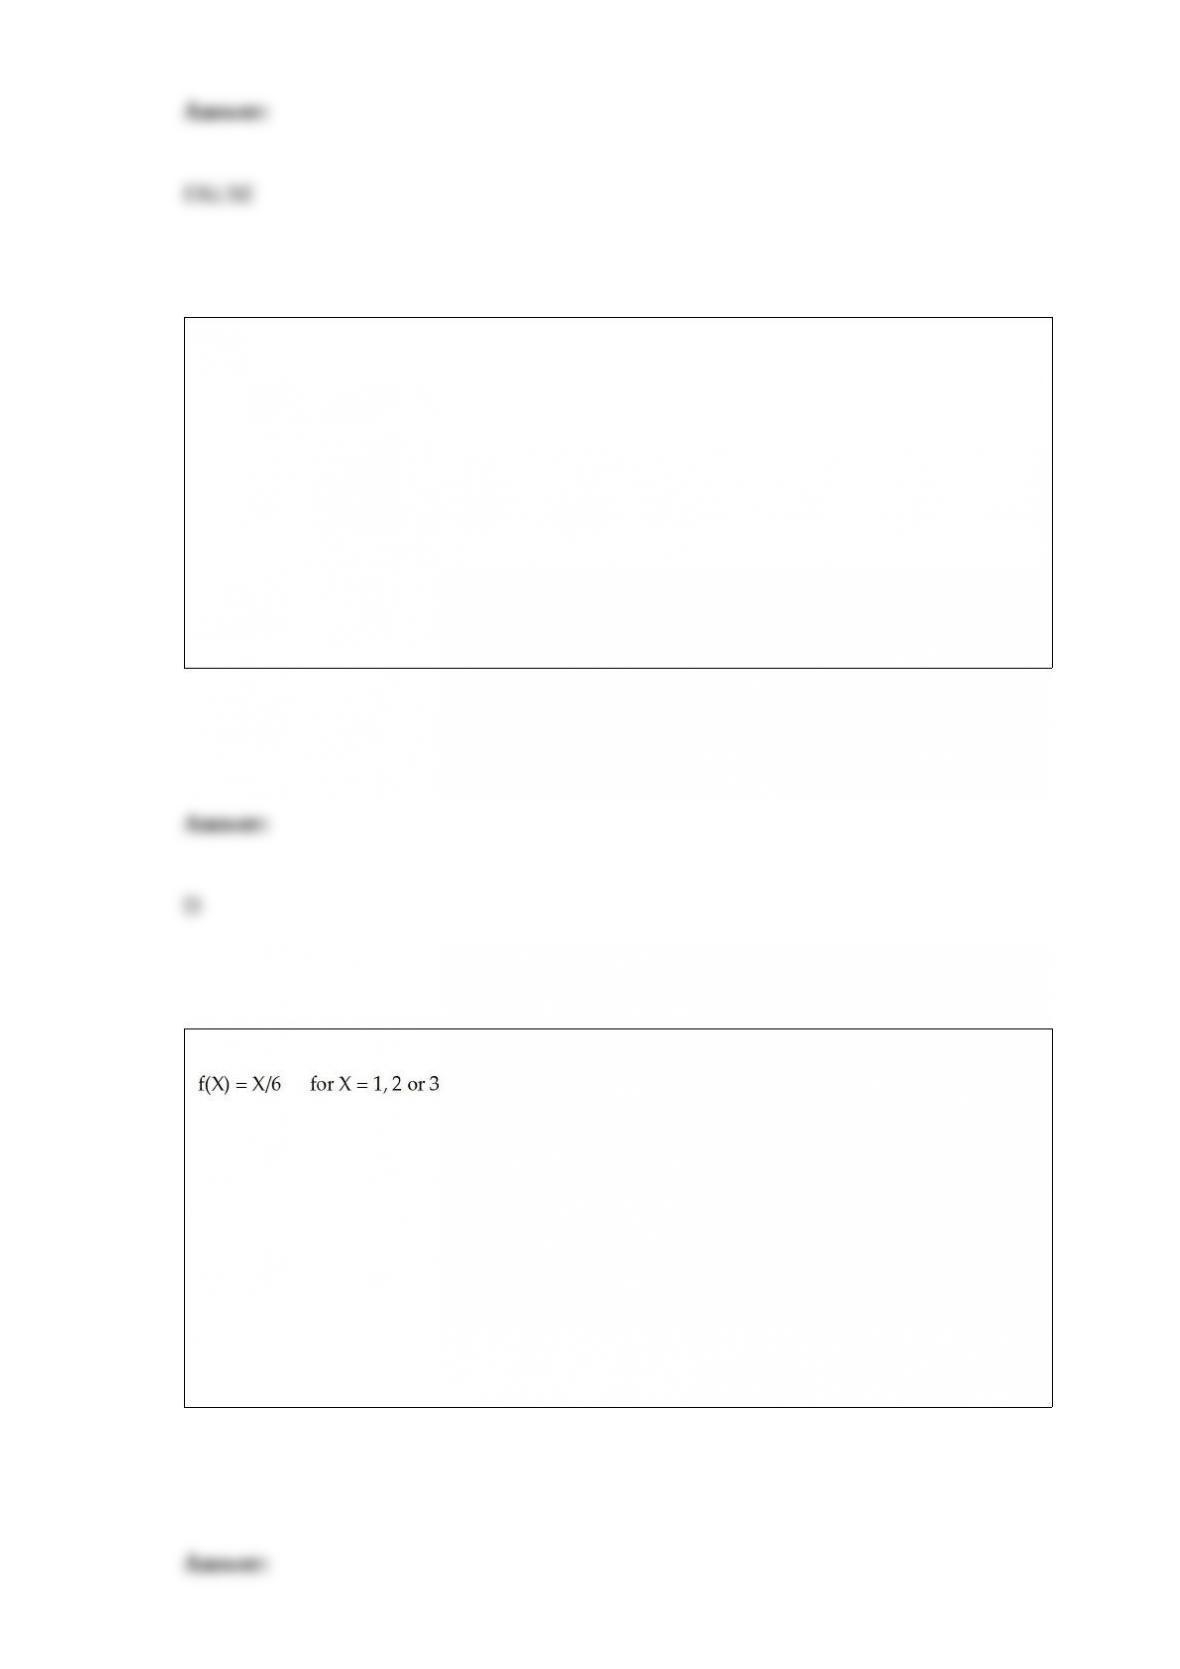
Students who live on campus and purchase a meal plan are randomly assigned to one of
three dining halls: the Commons, Northeast, and Frazier. What is the probability that the
next student to purchase a meal plan will be assigned to the Commons?
A) 0.66
B) 0.5
C) 0.25
D) 0.33
The probability function for random variable X is specified as:
The expected value of X is
A) 0.333
B) 0.500
C) 2.000
D) 2.333

Employees at a large computer company earn sick leave in one-minute increments
depending on how many hours per month they work. They can then use the sick leave
time any time throughout the year. Any unused time goes into a sick bank account that
they or other employees can use in the case of emergencies. The human resources
department has determined that the amount of unused sick time for individual
employees is uniformly distributed between 0 and 480 minutes. The company has
decided to give a cash payment to any employee that returns over a specified amount of
sick leave minutes. Assuming that the company wishes no more than 5 percent of all
employees to get a cash payment, what should the required number of minutes be?
A) 24 minutes
B) 419 minutes
C) 456 minutes
D) 470 minutes
Suppose the life of a particular brand of calculator battery is approximately normally
distributed with a mean of 75 hours and a standard deviation of 10 hours. What is the
probability that a single battery randomly selected from the population will have a life
between 70 and 80 hours?
A) 0.2412
B) 0.3830
C) 0.1712
D) 0.5121
A consumer products company is considering introducing a new product nationally. To
help make the decision, it first conducts a test market by selling the product for a few
months in one city. This is an example of:
A) descriptive statistics.
B) charts and graphs.
C) estimation.
D) hypothesis testing.
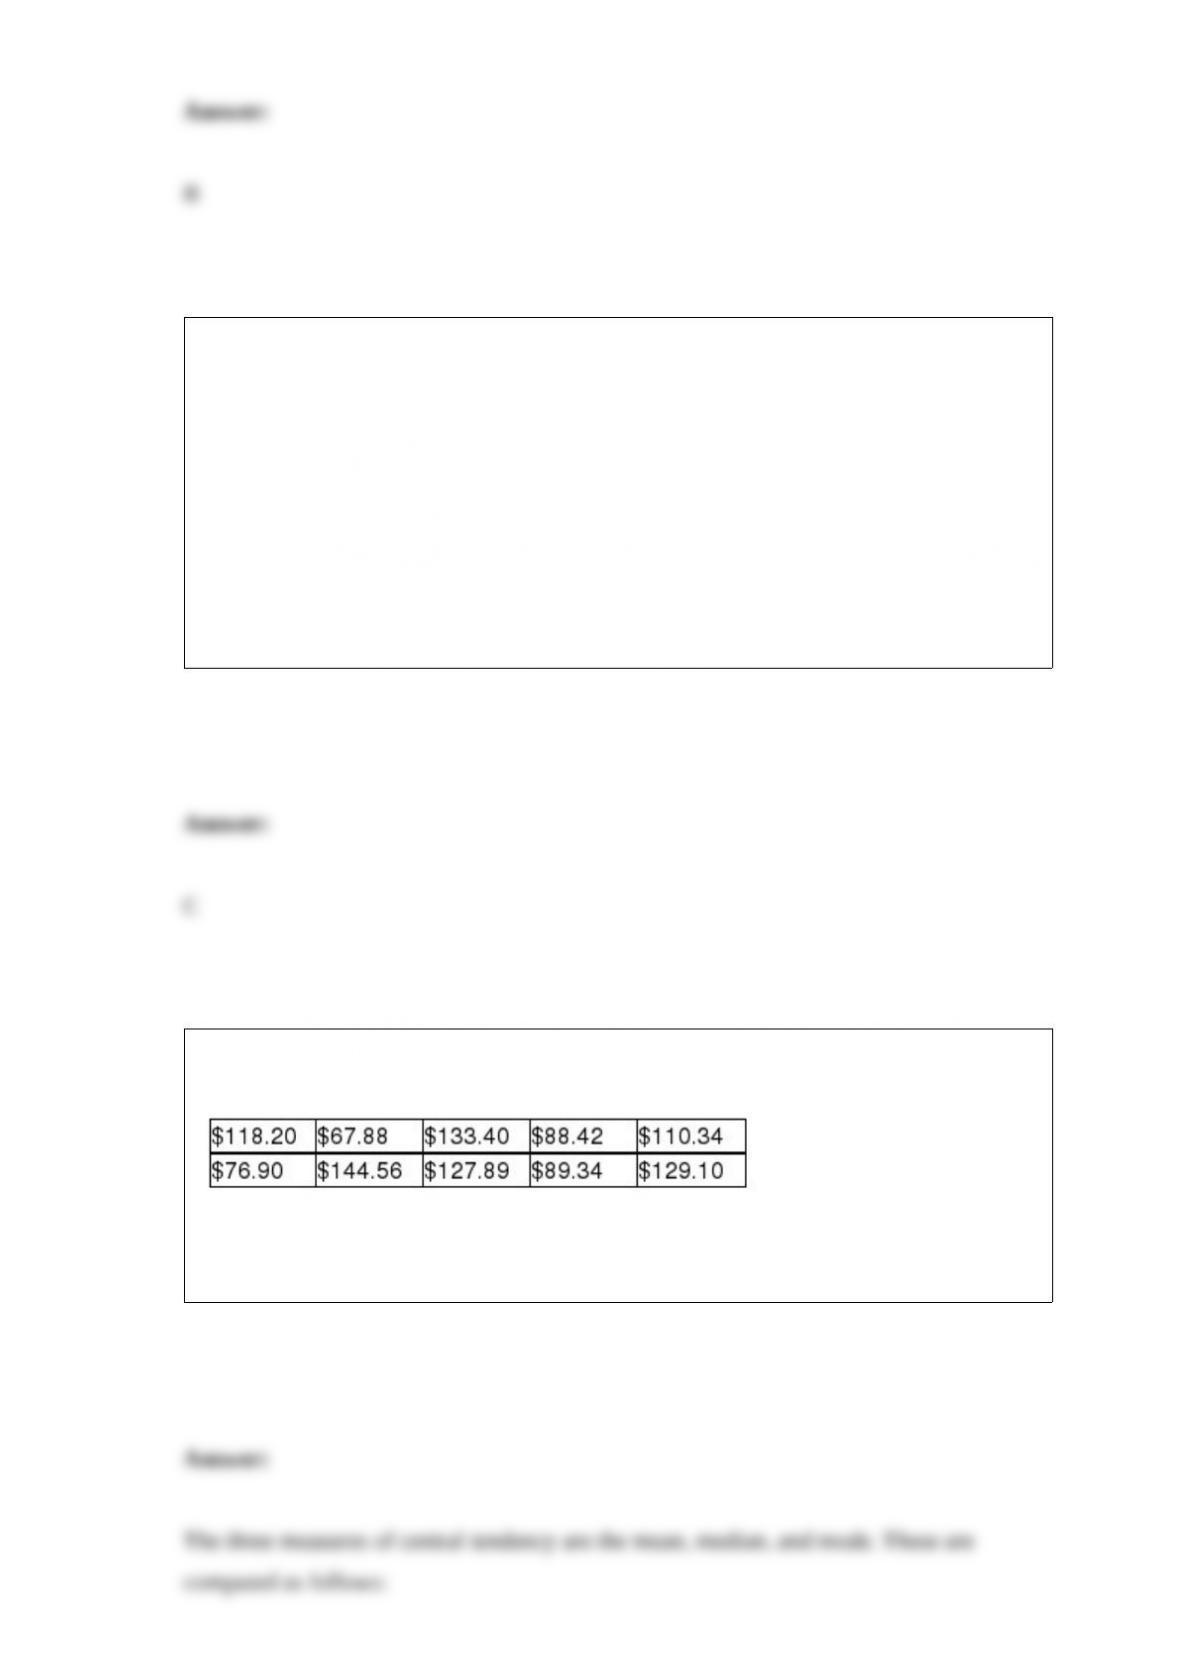
The following sample data reflect electricity bills for ten households in San Diego in
March.
Determine three measures of central tendency for these sample data. Then, based on
these measures, determine whether the sample data are symmetric or skewed.
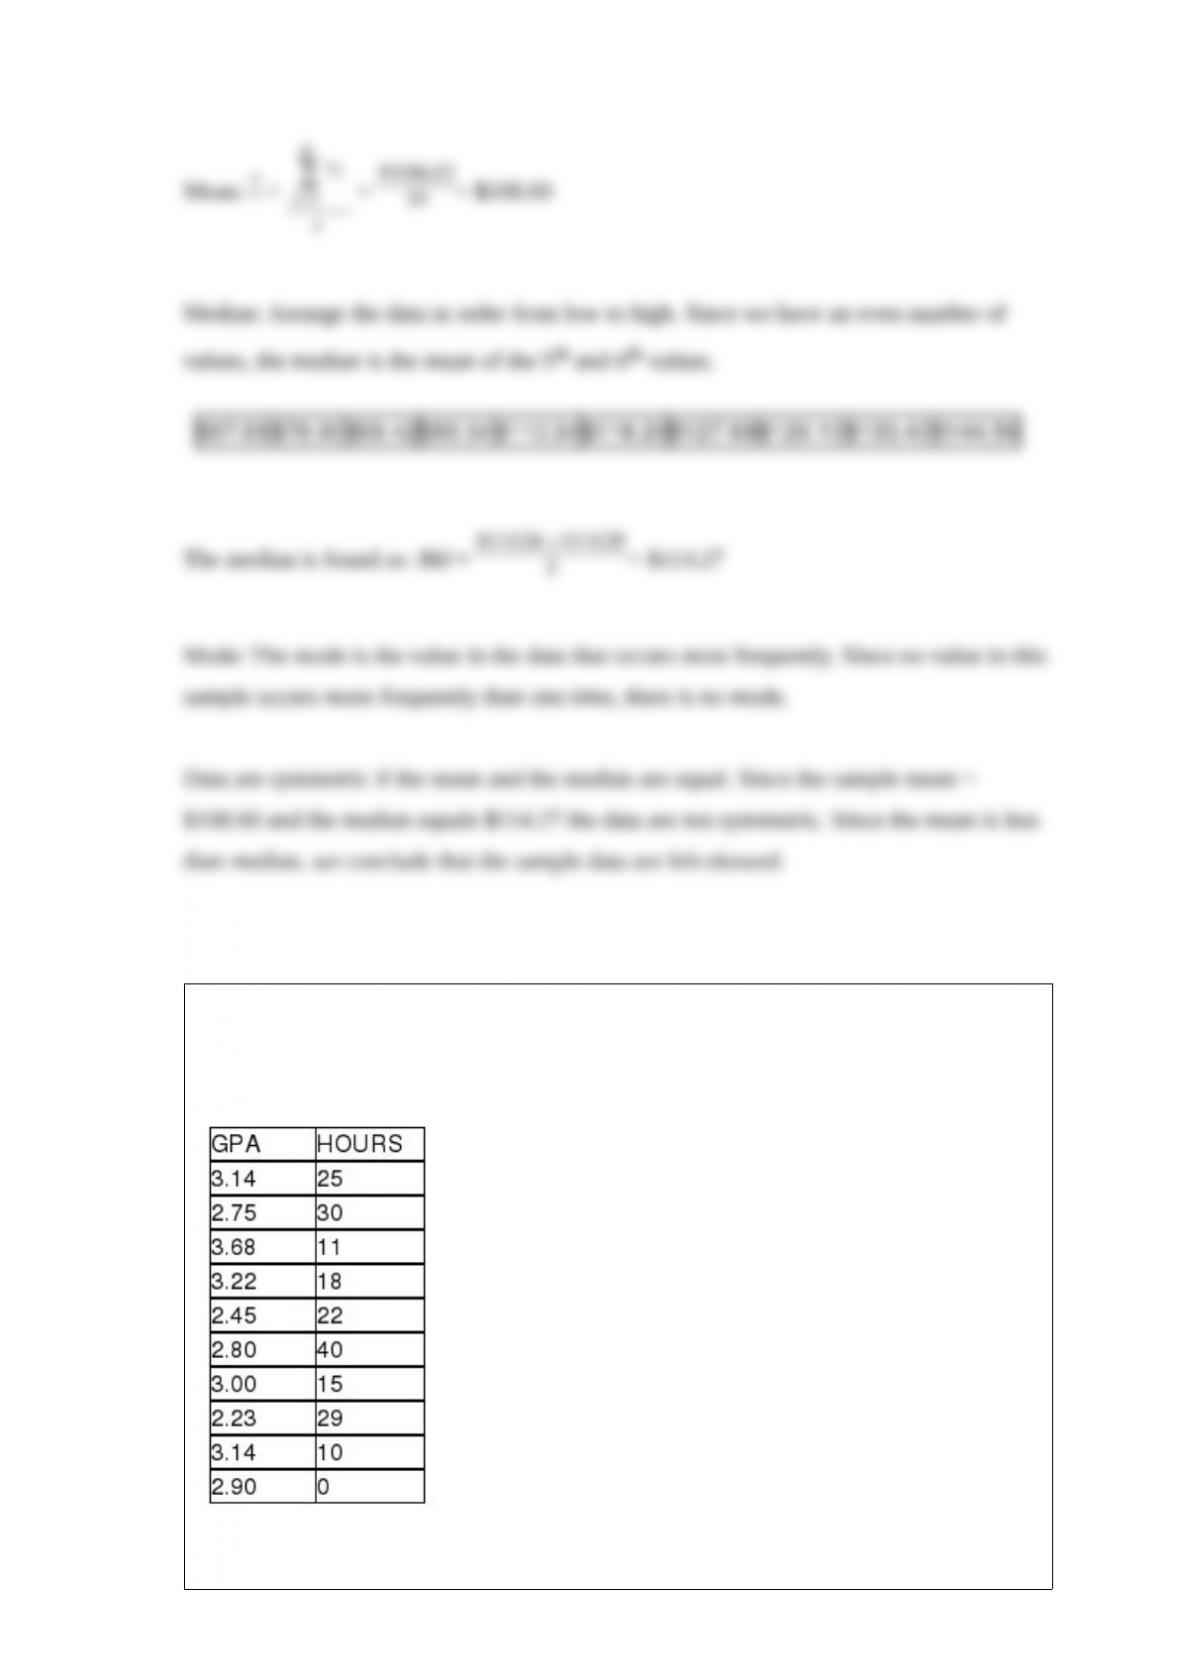
State University recently randomly sampled seven students and analyzed grade point
average (GPA) and number of hours worked off-campus per week. The following data
were observed:
A regression model with HOURS as the independent variable has an R-square equal to
approximately .46.
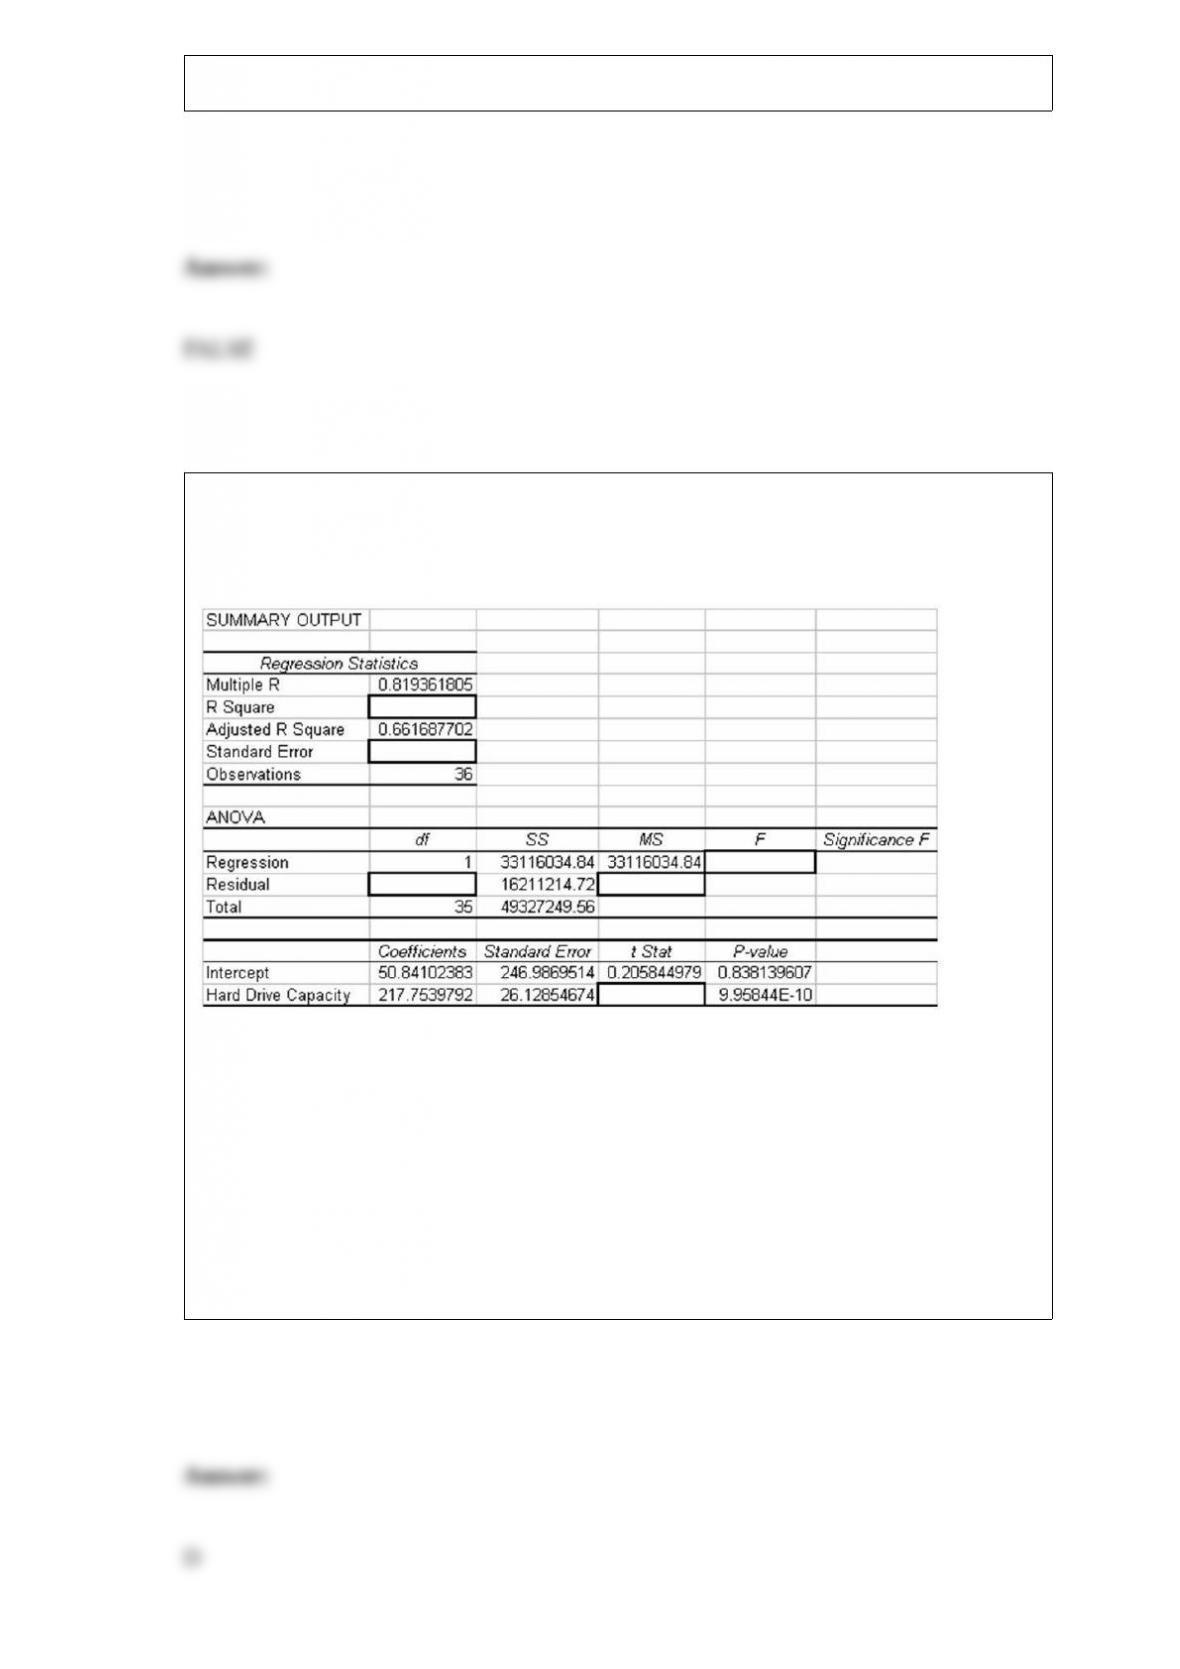
Consider the following partially completed computer printout for a regression analysis
where the dependent variable is the price of a personal computer and the independent
variable is the size of the hard drive.
Based on the information provided, what is the F statistic?
A) About 8 .33
B) Just over 2.35
C) About 4.76
D) About 69.5

A company that fills soft drinks into bottles wishes to establish an -chart to monitor the
average fill level in the bottles. To do this, the company has taken a series of samples of
size n = 4 bottles. The overall average fill is 12.03 ounces. The average range for the
subgroups has been .06 ounces. Based on this information, what is the upper limit of the
3-sigma control limit?
A) .729
B) .0437
C) 12.09
D) 12.074
In the finding the critical value for the Wilcoxon signed rank test, what does “n”
represent?
A) The number of observations in the sample
B) The number of pairs
C) The number of nonzero deviations
D) The number of positive ranks
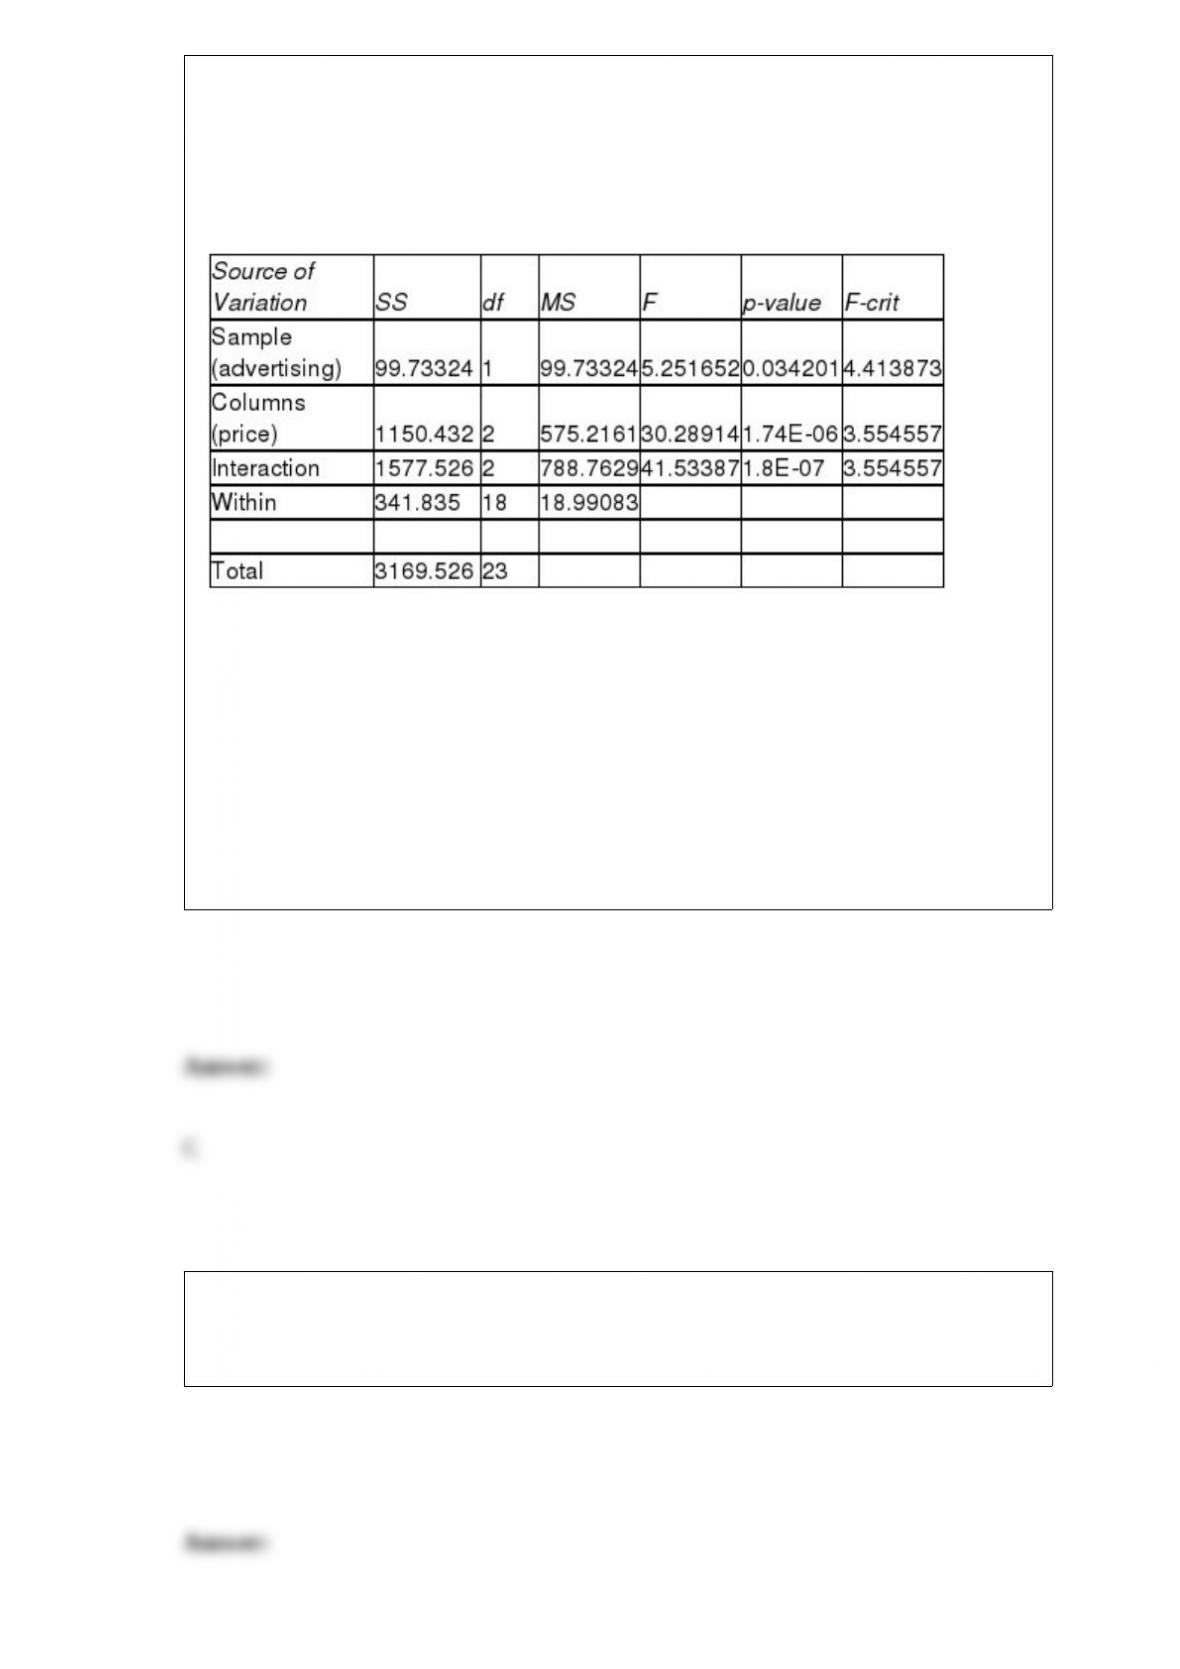
A two-factor analysis of variance is conducted to test the effect the price and advertising
have on sales of a particular brand of bottled water. Each week a combination of
particular levels of price and advertising are used and the sales level is recorded. The
computer results are shown below.
ANOVA
How many replications were used in this study?
A) 2
B) 3
C) 4
D) 5
A major fast-food chain has installed a device that measures the temperature of the
hamburgers on the grill. These data are stored in a computer file. If you were to analyze
these data, you would be working with ordinal level data.

In conducting a one-way analysis of variance where the test statistic is less than the
critical value, which of the following is correct?
A) Conclude that the means are not all the same and that that the Tukey-Kramer
procedure should be conducted.
B) Conclude that the means are not all the same and that that the Tukey-Kramer
procedure is not needed.
C) Conclude that all means are the same and that the Tukey-Kramer procedure should
be conducted.
D) Conclude that all means are the same and there is no need to conduct the
Tukey-Kramer procedure.
Explain why it is important to construct scatter plots prior to conducting regression
analysis.
A major U.S. oil company has developed two blends of gasoline. Managers are
interested in estimating the difference in mean gasoline mileage that will be obtained
from using the two blends. As part of their study, they have decided to run a test using
the Chevrolet Impala automobile with automatic transmissions. They selected a random
sample of 100 Impalas using Blend 1 and another 100 Impalas using Blend 2. Each car
was first emptied of all the gasoline in its tank and then filled with the designated blend
of the new gasoline. The car was then driven 200 miles on a specified route involving
both city and highway roads. The cars were then filled and the actual miles per gallon
were recorded. The following summary data were recorded:
Blend 1 Blend 2
Sample Size 100 100
Sample Mean 23.4 mpg 25.7 mpg
Sample St. Dev. 4.0 mpg 4.2 mpg
Based on these sample data, compute and interpret the 95 percent confidence interval
estimate for the difference in mean mpg for the two blends.
In a survey, what is meant by demographic questions and why might we want to include
demographic questions in survey?