
In an observational study, the variable of interest is called a response variable.
It can be established at α = .05 that a majority of students favor the plus/minus grading
system at a university if in a random sample of 500 students, 270 favor the system.

When applying either the critical value rule or the p-value rule about a single mean,
other relevant factors held constant, increasing the level of significance, α, from .05 to .
10 will reduce the probability of a Type I error.
A decision maker’s expected utility is based upon his/her attitude toward risk.
If the sampled population is exactly normally distributed, then the sampling distribution
of is also expected to be normal, regardless of the sample size.
If events A and B are mutually exclusive, then P(A∩B) is always equal to zero.

The median is said to be resistant to extreme values.
A ttest is used in testing the significance of an individual independent variable.
For a binomial probability experiment, with n = 150 and p = .2, it is appropriate to use
the normal approximation to the binomial distribution.
A correlation coefficient close to −1 says x and y are highly related.
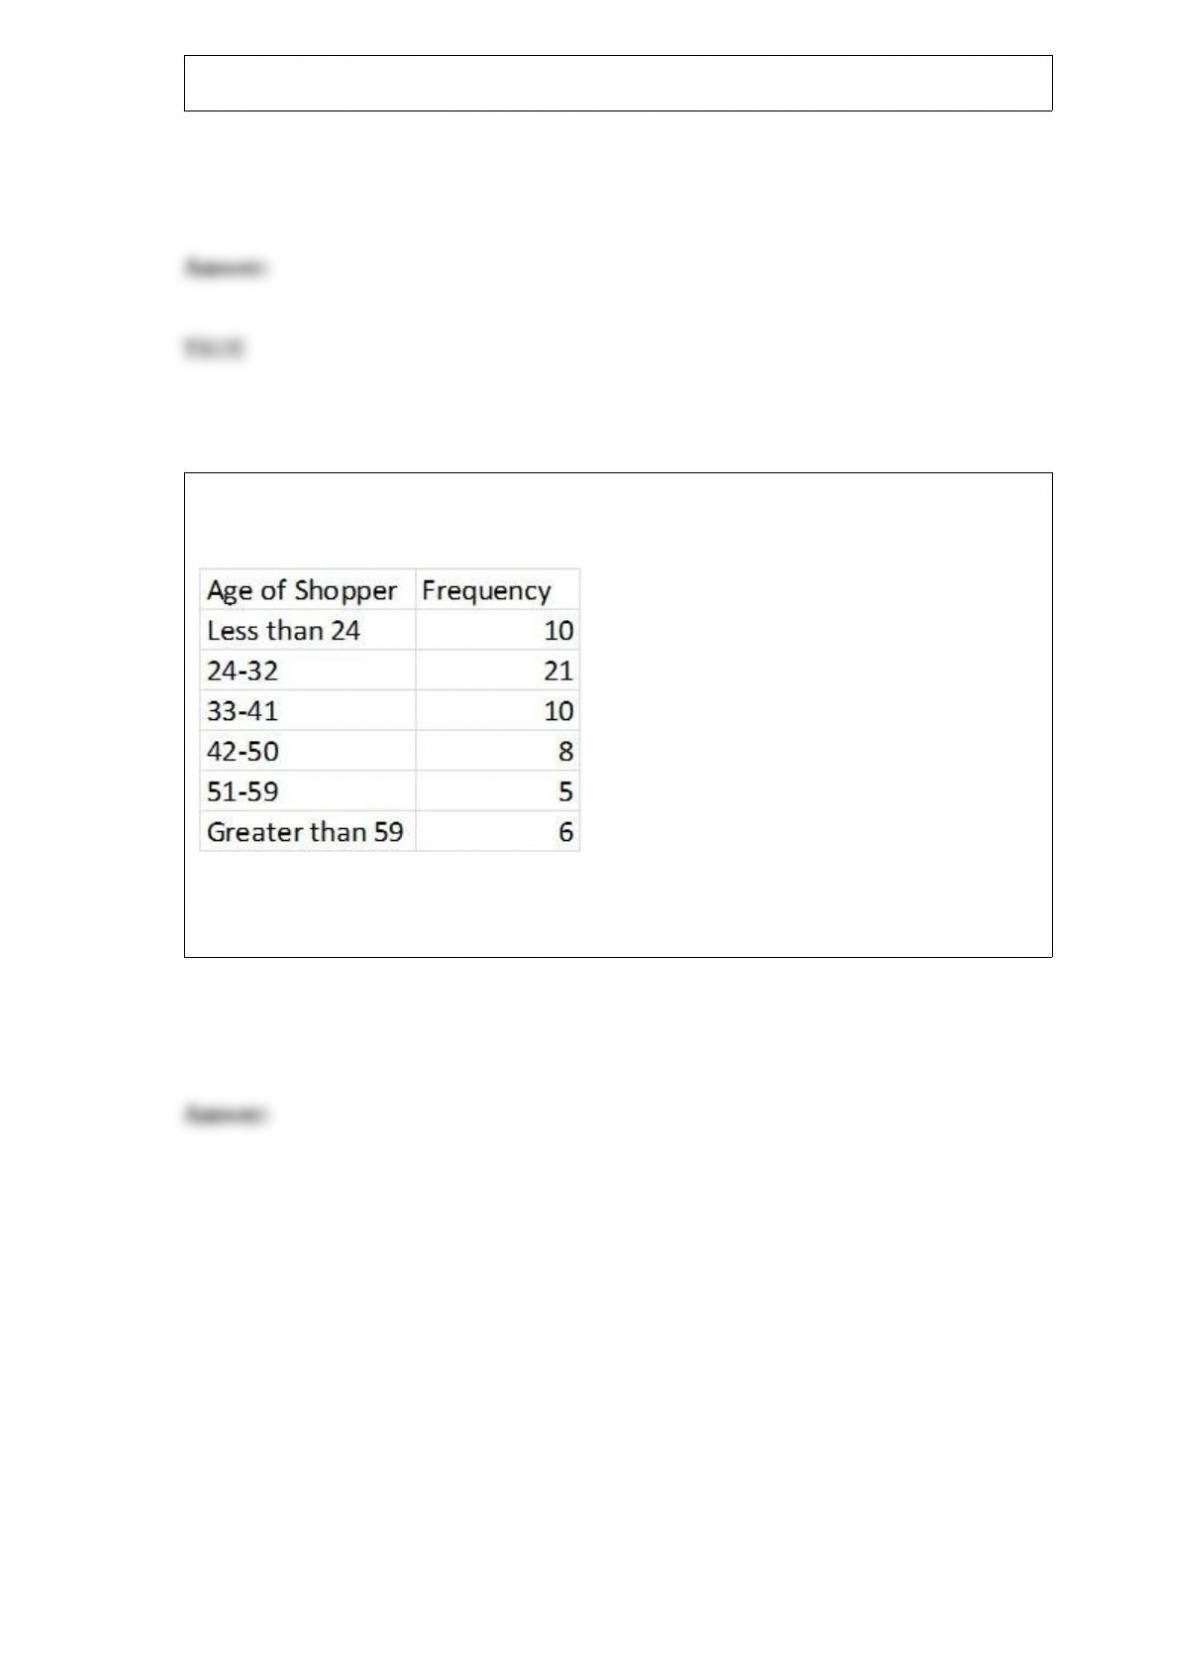
The following frequency table summarizes the ages of 60 shoppers at the local farmer’s
market.
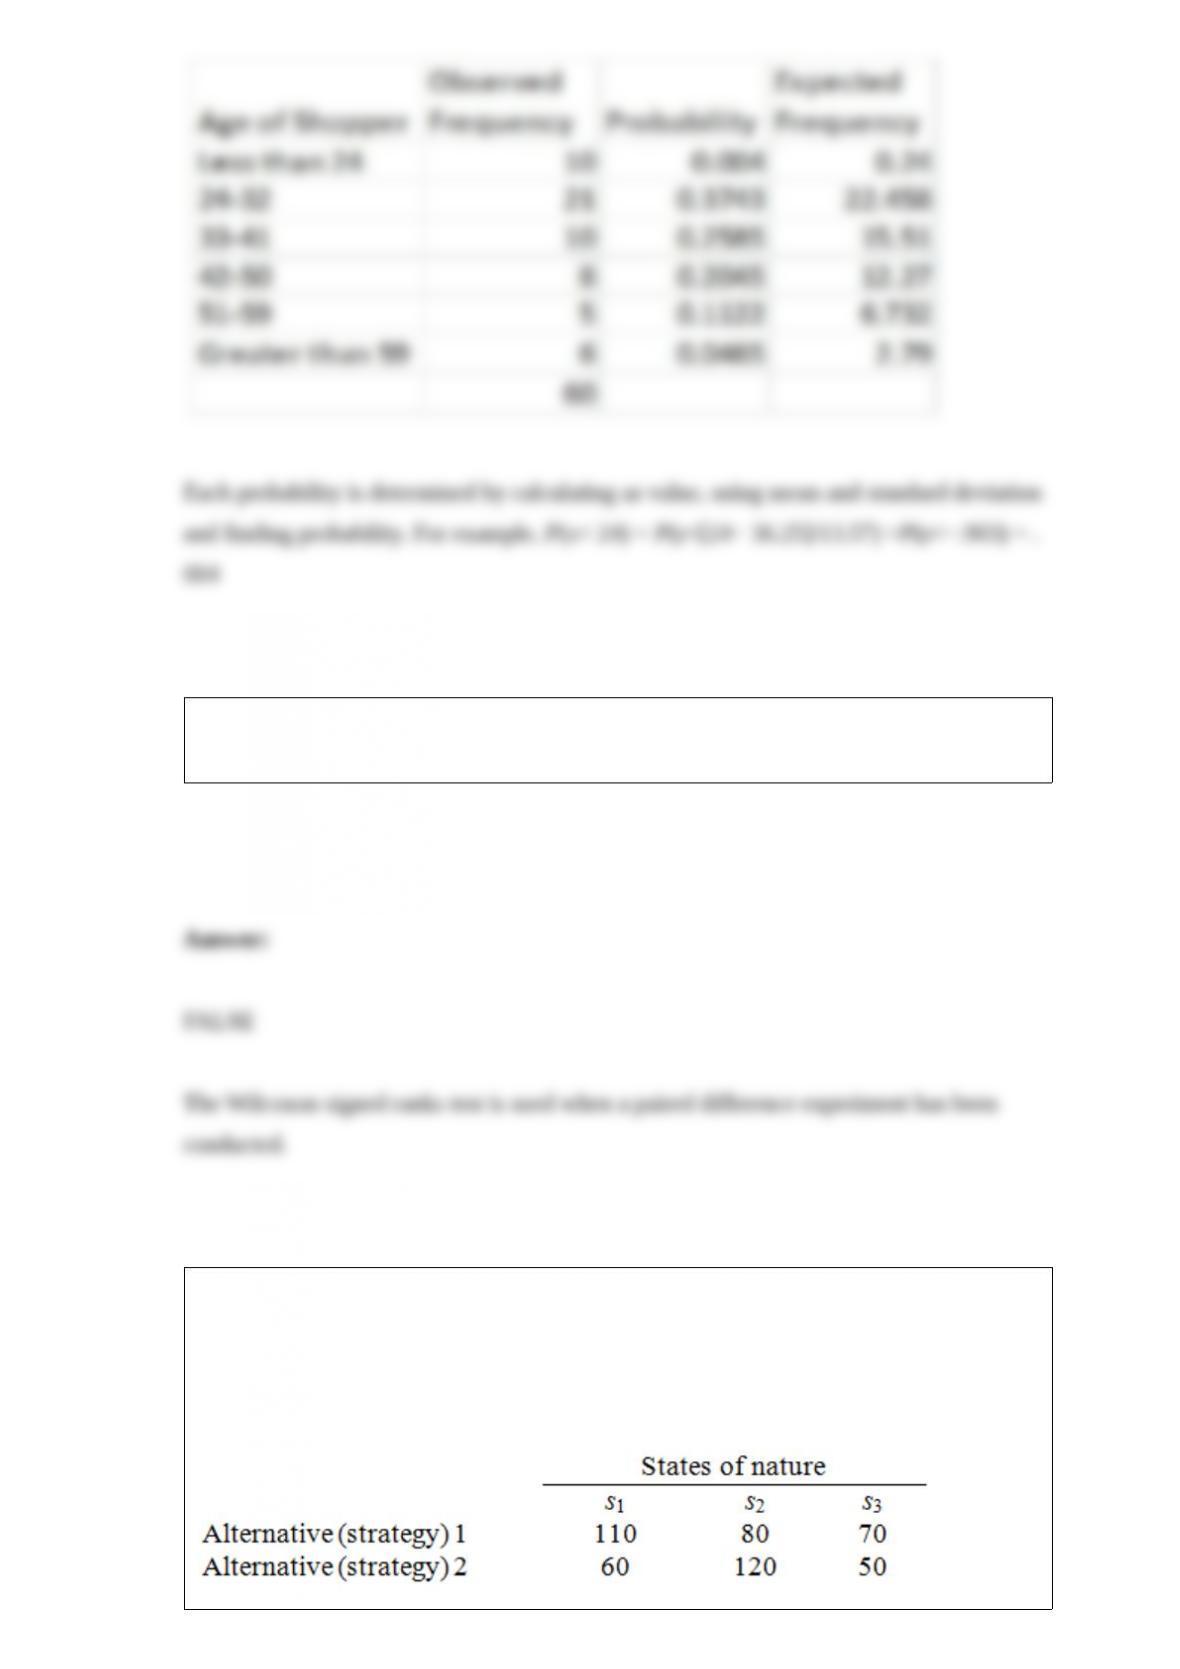
The estimated mean is 36.25, and estimated standard deviation is 13.57. Calculate the
probability for each interval, assuming a normal distribution.
The Wilcoxon rank sum test is a nonparametric test used to compare the central
tendencies of two populations when a paired difference experiment has been conducted.
Alternatives 1 and 2 in the following payoff table represent the two possible
manufacturing strategies that the EKA manufacturing company can adopt. The level of
demand affects the success of both strategies. The states of nature (SI) represent the
levels of demand for the company products. S1, S2, and S3 characterize high, medium,
and low demand, respectively. The payoff values are in thousands of dollars.

The best alternative (course of action) for the EKA manufacturing company, using the
maximax criterion, is alternative 1.
If the limits of the confidence interval of the difference between the means of two
normally distributed populations were from −2.6 to 1.4 at the 95 percent confidence
level, then we can conclude that we are 95 percent certain that there is a significant
difference between the two population means.
The mean and median are the same for an exponential distribution.

The Wilcoxon signed ranks test is also called the Mann-Whitney test.
In a multiple regression analysis, if the normal probability plot exhibits approximately a
straight line, then it can be concluded that the assumption of normality is not violated.
If a manufacturing process is in statistical control, it means that the process is capable
of producing products that meet the needs of the customers.

Nonparametric tests can be more powerful than the corresponding t or F tests if the
population distribution is highly skewed or nonnormal.
For a continuous distribution, P(X 100) = P(X < 100).
Multiplicative decompositions assumes that time series components remain essentially
constant over time.
If the distances between the ordered data values are proportional to the distances
between the actual values, then the normal probability plot will be a straight line.

The least squares simple linear regression line minimizes the sum of the vertical
deviations between the line and the data points.
The null hypothesis is a statement that will be accepted only if there is convincing
sample evidence that it is true.
Expected cell frequencies for a multinomial distribution are calculated by assuming
statistical dependence.

Selecting many different samples and running many different tests can eventually
produce a result that makes a desired conclusion be true.
Common causes of variation represent the inherent variability of a given process.
A bullet graph features a single measure as either a horizontal or vertical bar.

The trials of a multinomial probability are assumed to be dependent.
The median is the value below which and above which approximately 50 percent of the
measurements lie.
For a given control chart, zone boundaries consist of the UCL and LCL.

When the population is normally distributed and the population standard deviation σ is
unknown, then for any sample size n, the sampling distribution of is based on the z
distribution.
In an experiment involving matched pairs, a sample of 12 pairs of observations is
collected. The degrees of freedom for the t statistic is 10.
The HR department tested how long employees stay with the company in their current
positions. A random sample of 50 employees yielded a mean of 2.79 years and σ = .76.
The sample evidence indicates that the average time is less than 3 years and is
significant at α = .01.

Z-score is often used as a measure of risk.
Four employees who work as drive-through attendants at a local fast-food restaurant are
being evaluated. As part of a quality improvement initiative and employee evaluation,
these workers were observed over three days. One of the statistics collected was the
proportion of time the employee forgot to include a napkin in the bag. Related
information is given in the table.

What is the probability that there is not a napkin included for a given order?
A. 0.22
B. 0.24
C. 0.053
D. 0.015
E. 0.04
A manufacturer of windows produces one type that has a plastic coating. The
specification limits for the plastic coating are 30 and 70. From time to time the plastic
coating can become uneven. Therefore, in order to keep the coating as even as possible,
thickness measurements are periodically taken at four different locations on the
window. 15 subgroups were observed, each consisting of four thickness measurements,
with the following results: mean of the means = = 50.05, and average range = 8.85.
Calculate the center line for the X-bar chart.
A. 50.05
B. 8.85
C. 4.12
D. 3.34

The __________________ criterion is preferred by pessimistic decision makers.
A. maximax
B. maximin
C. utility theory
D. risk theory
When we assess the worth of sample information in a decision-making problem, we are
performing a
A. prior analysis.
B. preposterior analysis.
C. posterior analysis.
D. payoff analysis.
E. utility analysis.
The _______________________is the difference between the expected payoff of
sampling and the expected payoff based on expected monetary criterion and prior

probabilities.
A. maximax criterion
B. maximin criterion
C. expected utility
D. expected value of perfect information
E. expected value of sample information
______________ and _____________ are used to describe qualitative (categorical)
data.
A. Stem-and-leaf displays, scatter plots
B. Scatter plots, histograms
C. Box plots, bar charts
D. Bar charts, pie charts
E. Pie charts, histograms
Which of the following dashboard graphical methods will show variation over time?
A. bullet graph
B. sparkline

C. treemap
D. gauge
A set of final examination grades in a calculus course was found to be normally
distributed with a mean of 69 and a standard deviation of 9. What percentage of
students scored between 65 and 89?
A. 65.68%
B. 100%
C. 98.68%
D. 33.00%
Methods for obtaining a sample are called
A. sample surveys.
B. probability sampling.
C. random sampling.
D. sampling designs.

A sequence of values of some variable or composite of variables taken at successive,
uninterrupted time periods is called a
A. least squares (linear) trend line.
B. moving average.
C. cyclical component.
D. time series.
E. seasonal factor.
A sample of 2,000 people yielded =.52. Calculate a 99 percent confidence interval for
p.
A. [.515, .525]
B. [.494, .546]
C. [.506, .534]
D. [.491, .549]

Which of the following statements is not a property of the normal probability
distribution?
A. The normal distribution is symmetric.
B. 95.44 percent of all possible observed values of the random variable x are within
plus or minus three standard deviations of the population mean.
C. The mean, median, and mode are equal.
D. The area under the normal curve to the right of the mean is equal to the area under
the normal curve to the left of the mean.
E. All of the other answers are properties of the normal distribution.
If we collect data on the number of wins the Dallas Cowboys earned each of the past 10
years, we have _____________ data.
A. cross-sectional
B. time series
C. non-historical
D. survey
As the significance level α increases, the width of the confidence interval

_______________.
A. stays the same
B. decreases
C. increases
XYZ Company, Annual Data
Based on the information given in the table above, what is the average forecast error?
A. 1.3333
B. 1.6667
C. 2.5
D. 3.3333
E. 4.5

In a multiple regression model, we can conclude that multicollinearity exists if the
average variance inflation factor is substantially greater than _____.
A. 100
B. 5
C. 10
D. 1
Business analytics uses methods that are not part of traditional statistics to look at big
data.
In a statistics class, 10 scores were randomly selected with the following results (mean
= 71.5): 74, 73, 77, 77, 71, 68, 65, 77, 67, 66.
What is the standard deviation?
A. 22.72
B. 12.00

C. 4.77
D. 516.20
E. 144.00
A _______________________ is a diagram that assists the decision maker in analyzing
a decision problem.
A. Bayes Theorem curve
B. decision tree
C. utility curve
D. maximax table
Historical data show that the average number of patient arrivals at the intensive care
unit of General Hospital is 3 patients every 2 hours. Assume that the patient arrivals are
distributed according to a Poisson distribution. Determine the probability of at least 4
but no more than 8 patients arriving in a three-hour period.
A. .3813
B. .5711
C. .4276
D. .7861

E. .6174
The weight of a chemical compound used in an experiment that is obtained using a
well-adjusted scale represents a(n) _____________ level of measurement.
A. nominative
B. ordinal
C. interval
D. ratio
Determine whether these two events are mutually exclusive: consumer with an unlisted
phone number and a consumer who does not drive.
A. mutually exclusive
B. not mutually exclusive

A manufacturer tested a sample of semiconductor chips and found that 35 were
defective and 190 were good. If additional tests are to be conducted with random
samples of 160 semiconductor chips, find the mean for the number of defects in these
groups of 160 (rounded to the nearest whole number).
A. 56
B. 35
C. 29
D. 25
In a hearing test, subjects estimate the loudness (in decibels) of a sound, and the results
are: 68, 67, 70, 71, 68, 75, 68, 62, 80, 73, 68.
What is the median?
A. 70
B. 75
C. 68
D. 71
E. 80
Consider the following data on distances traveled by people to visit the local
amusement park and calculate the relative frequency for the shortest distance.

A. .375
B. .150
C. .500
D. .300
E. .333
Using the critical value rule, if a two-sided null hypothesis cannot be rejected for a
single mean at a given significance level, then the corresponding one-sided null
hypothesis (i.e., the same sample size, the same standard deviation, and the same mean)
will ______________ be rejected at the same significance level.
A. always
B. sometimes
C. never

A special version of the chi-square goodness-of-fit test that involves testing the null
hypothesis that all of the multinomial probabilities are equal is called the test for
___________.
A. goodness of fit
B. statistical independence
C. normality
D. homogeneity
A pharmaceutical company manufacturing flu test kits wants to determine the
probability of a teenager not having the flu when the test results indicate that they do. It
is estimated that the probability of positive test for flu among potential users of the kit
is 10 percent. According to the company laboratory test results, 1 out of 100
noninfected teenagers tested as having the flu (false positive). On the other hand, 1 out
of 200 teenagers with the flu tested as not having the active virus (false negative). A
teenager has just used the flu test kit manufactured by the company, and the results
showed she does not have the flu. What is the probability that she does have the flu?
A. 1%
B. 0.9%
C. 0.05%
D. 8.3%
E. 0.056%

Quality control is an important issue at ACME Company, which manufactures light
bulbs. To test the life-hours of their light bulbs, they randomly sampled nine light bulbs
and measured how many hours they lasted: 378, 361, 350, 375, 200, 391, 375, 368, 321.
What is the mean?
A. 375
B. 368
C. 389.9
D. 200
E. 346.6
A set of all elements we wish to study is called a ____________.
A. sample
B. process
C. census
D. population

In one-way ANOVA, the total sum of squares is equal to _______________________.
A. Treatment SS + Error SS
B. Treatment SS − Error SS
C. Treatment SS Error SS
D. Treatment SS/Error SS
Using the following data, what would be the range of the values of the stem in a
stem-and-leaf display?
A. 11-17
B. 11-18
C. 10-18
D. 12-17
E. 12-18

A fastener company produces bolts with a nominal (target) length of 2.00 inches. The
specifications are 2.00 .006 inches. Determine the upper specification limit and the
lower specification limit for this process.
A. [1.982, 2.018]
B. [1.94, 2.06]
C. [1.994, 2.006]
D. [1.99, 2.01]
The ______________ is the difference between the expected payoff that would be
realized if the best alternative action were selected if we knew which state of nature
would occur and the expected payoff under risk.
A. maximax criterion
B. maximin criterion
C. expected utility
D. expected value of perfect information
E. expected value of sample information
Consider the following partial computer output from a simple linear regression analysis.
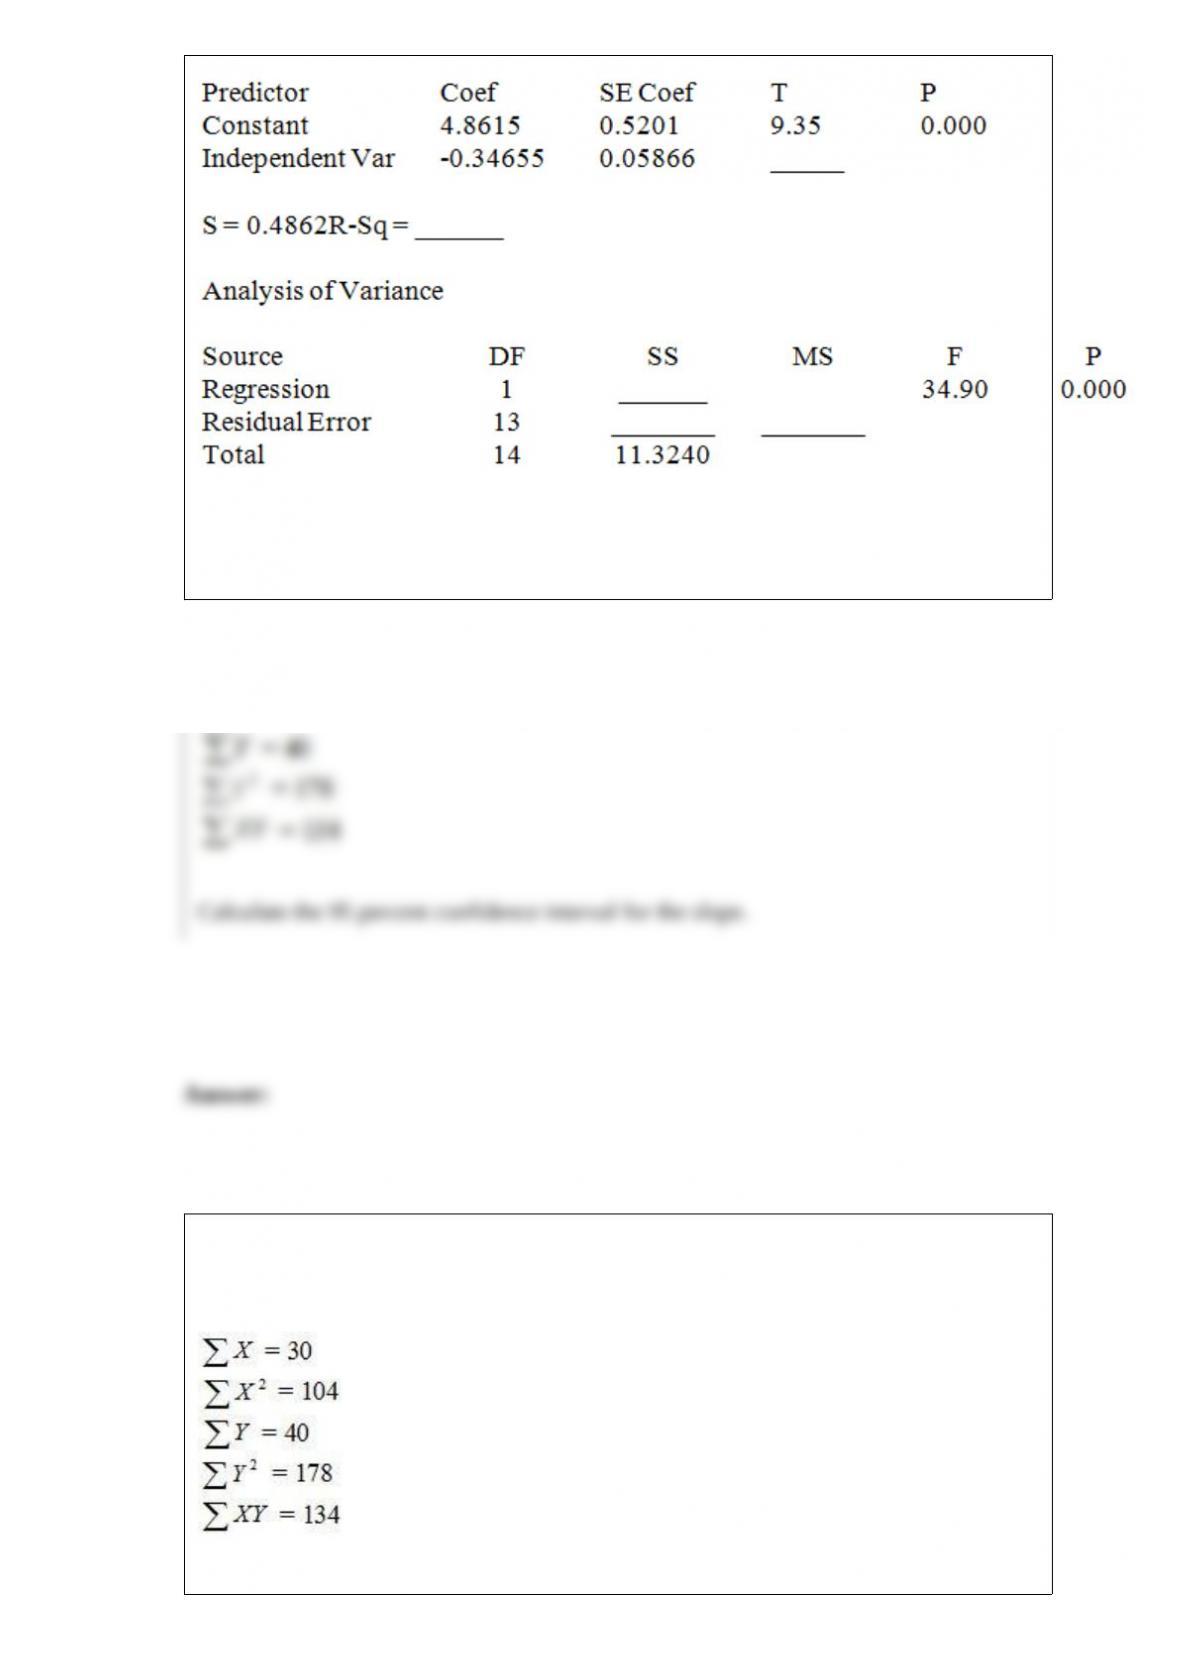
Determine the 95 percent prediction interval for the mean value of y when x = 9.00.
Givens: ∑x = 129.03, ∑x2 = 1178.547
An experiment was performed on a certain metal to determine if the strength is a
function of heating time. Results based on 10 metal sheets are given below. Use the
simple linear regression model.
Calculate the 95 percent confidence interval for the slope.
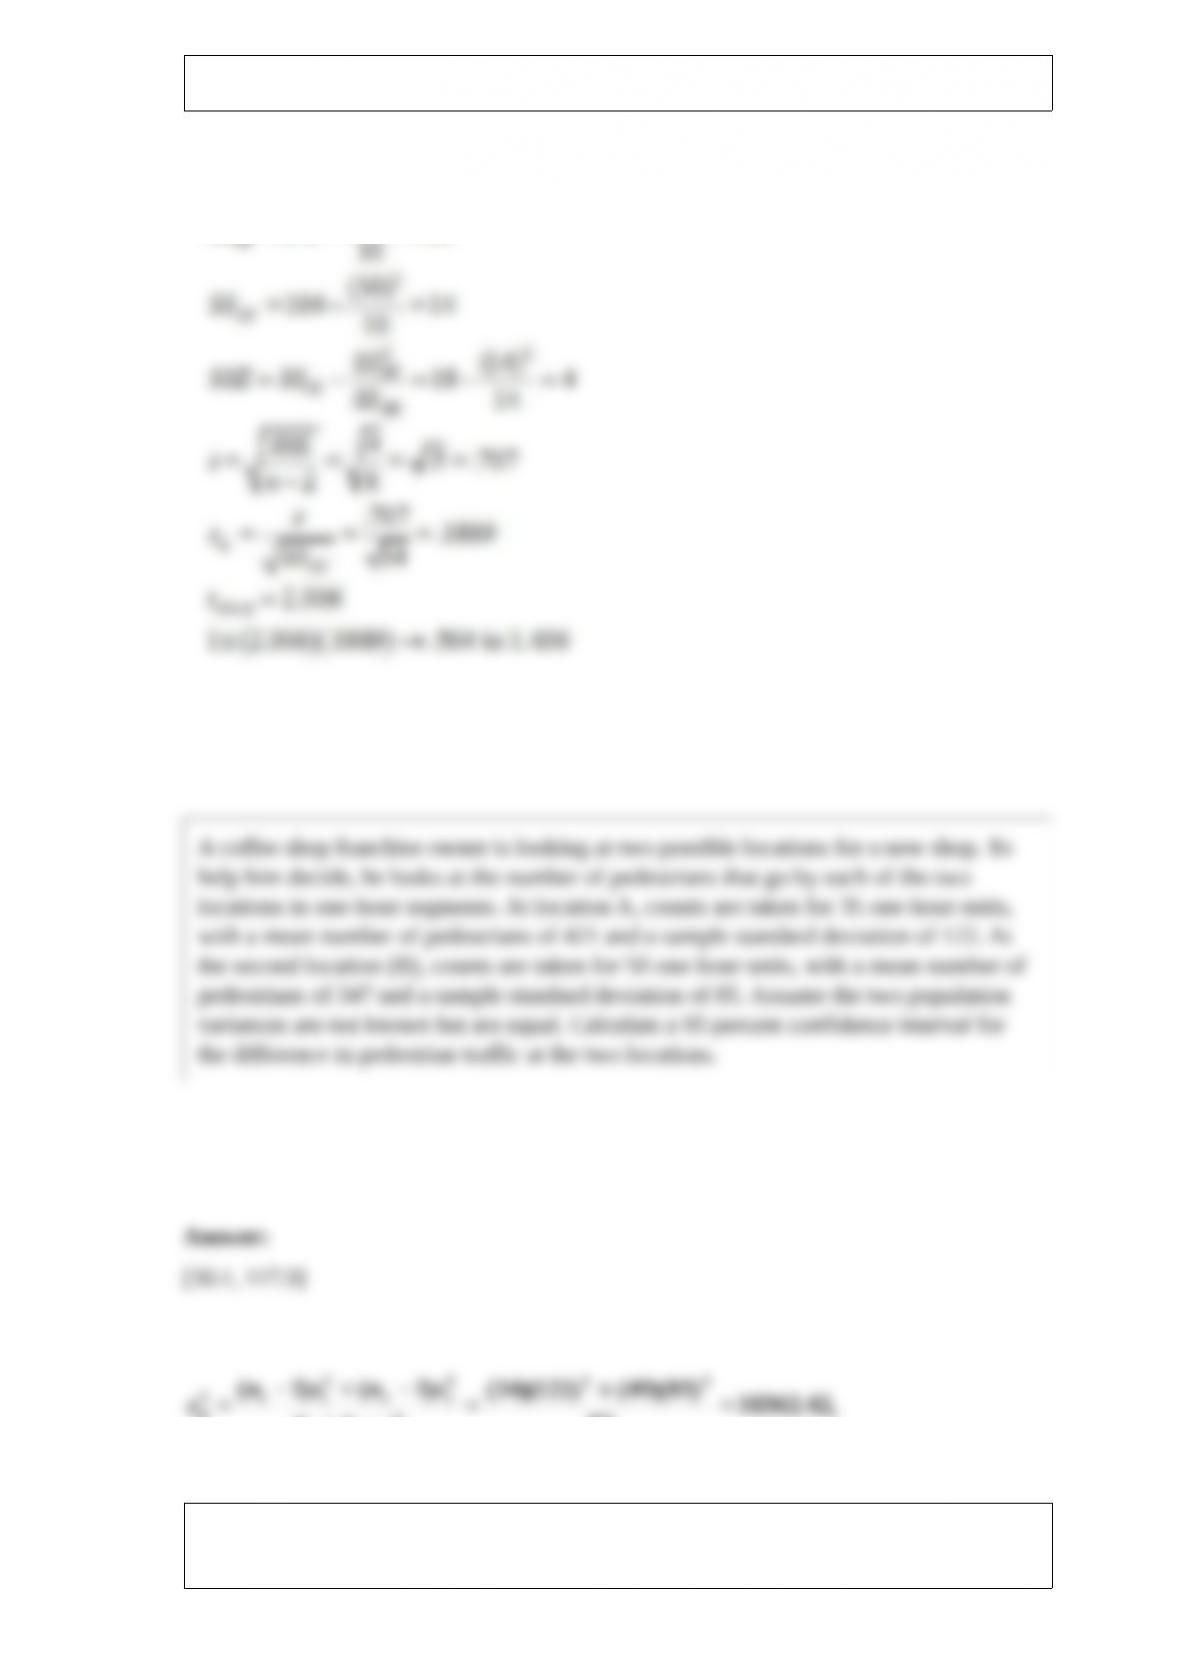
A coffee shop franchise owner is looking at two possible locations for a new shop. To
help him decide, he looks at the number of pedestrians that go by each of the two

locations in one-hour segments. At location A, counts are taken for 35 one-hour units,
with a mean number of pedestrians of 421 and a sample standard deviation of 122. At
the second location (B), counts are taken for 50 one-hour units, with a mean number of
pedestrians of 347 and a sample standard deviation of 85. Assume the two population
variances are not known but are equal. Calculate a 95 percent confidence interval for
the difference in pedestrian traffic at the two locations.
When we test H0: p1 − p2 .01, HA: p1 − p2> .01 at α = .05 where 1 = .08, 2 = .035,
n1 = 200, and n2 = 400, can we reject the null hypothesis?
In the past, of all the students enrolled in Basic Business Statistics, 10 percent earned an
A, 20 percent earned a B, 30 percent earned a C, 20 percent earned a D, and the

remainder failed the course. Dr. Johnson is a new professor teaching Basic Business
Statistics for the first time this semester. At the conclusion of the semester, of his 60
students, 10 had earned an A, 20 a B, 20 a C, 5 a D, and 5 received an F. Assume that
the class constitutes a random sample. Dr. Johnson wants to know if there is sufficient
evidence to conclude that the grade distribution of his class is different from the
historical grade distribution. Calculate the expected values for an A and for a D.
A test of mathematical ability is given to a random sample of 10 eighth-grade students
before and after they complete a semester-long basic mathematics course. The mean
score before the course was 119.60, and after the course the mean score was 130.80.
The standard deviation of the difference is 16.061. What do you conclude at α = .01?
Use confidence intervals to draw your conclusion.
In the past, of all the students enrolled in Basic Business Statistics, 10 percent earned an
A, 20 percent earned a B, 30 percent earned a C, 20 percent earned a D, and the
remainder failed the course. Dr. Johnson is a new professor teaching Basic Business

Statistics for the first time this semester. At the conclusion of the semester, of his 60
students, 10 had earned an A, 20 a B, 20 a C, 5 a D, and 5 received an F. Assume that
the class constitutes a random sample. Dr. Johnson wants to know if there is sufficient
evidence to conclude that the grade distribution of his class is different from the
historical grade distribution. If we assume at α = .05 that the null hypothesis is rejected,
make a one-sentence managerial conclusion.
A U.S.-based company offers an online proficiency course in basic accounting.
Completing this online course satisfies the Fundamentals of Accounting course
requirement in many MBA programs. In the first semester, 315 students have enrolled
in the course. The marketing research manager divided the country into seven regions
of approximately equal population. The course enrollment values for each of the seven
regions are given below. The management wants to know if there is equal interest in the
course across all regions.
Calculate the expected enrollment (frequency) for all 7 regions.
Find a 95 percent confidence interval for μ1 − μ2, where n1 = 50, n2 = 75, = 82,
= 76, s12 = 8, and s22 = 6. Assume unequal variances.
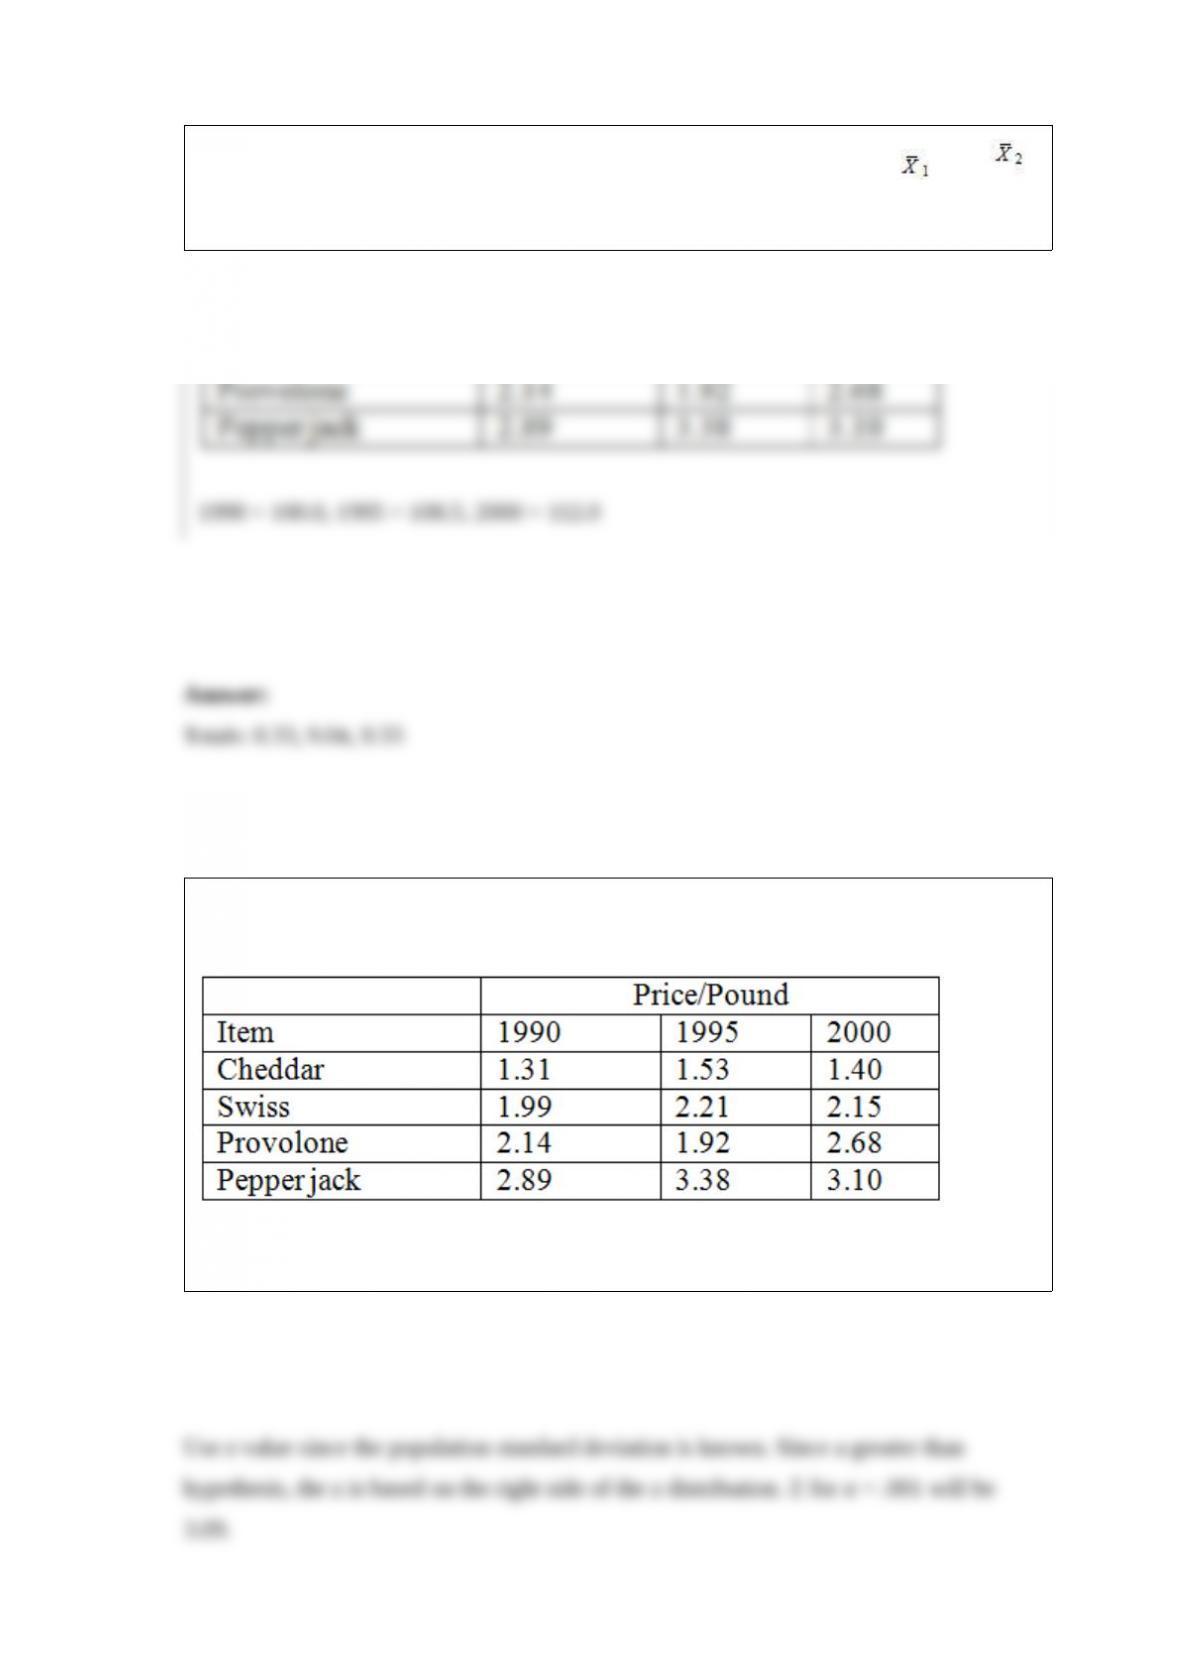
Using the price of the following food items, compute the aggregate index numbers for
the four types of cheese. Let 1990 be the base year for this market basket of goods.
1990 = 100.0, 1995 = 108.5, 2000 = 112.0
A random sample of 80 companies who announced corrections to their balance sheets
took a mean time of 8.1 days for the time between balance sheet construction and the
complete audit. The population standard deviation is assumed to be 1.3 days . What is
the critical value for α = .001 to apply the critical value rule for the claim that μ is
greater than 7.5 days?
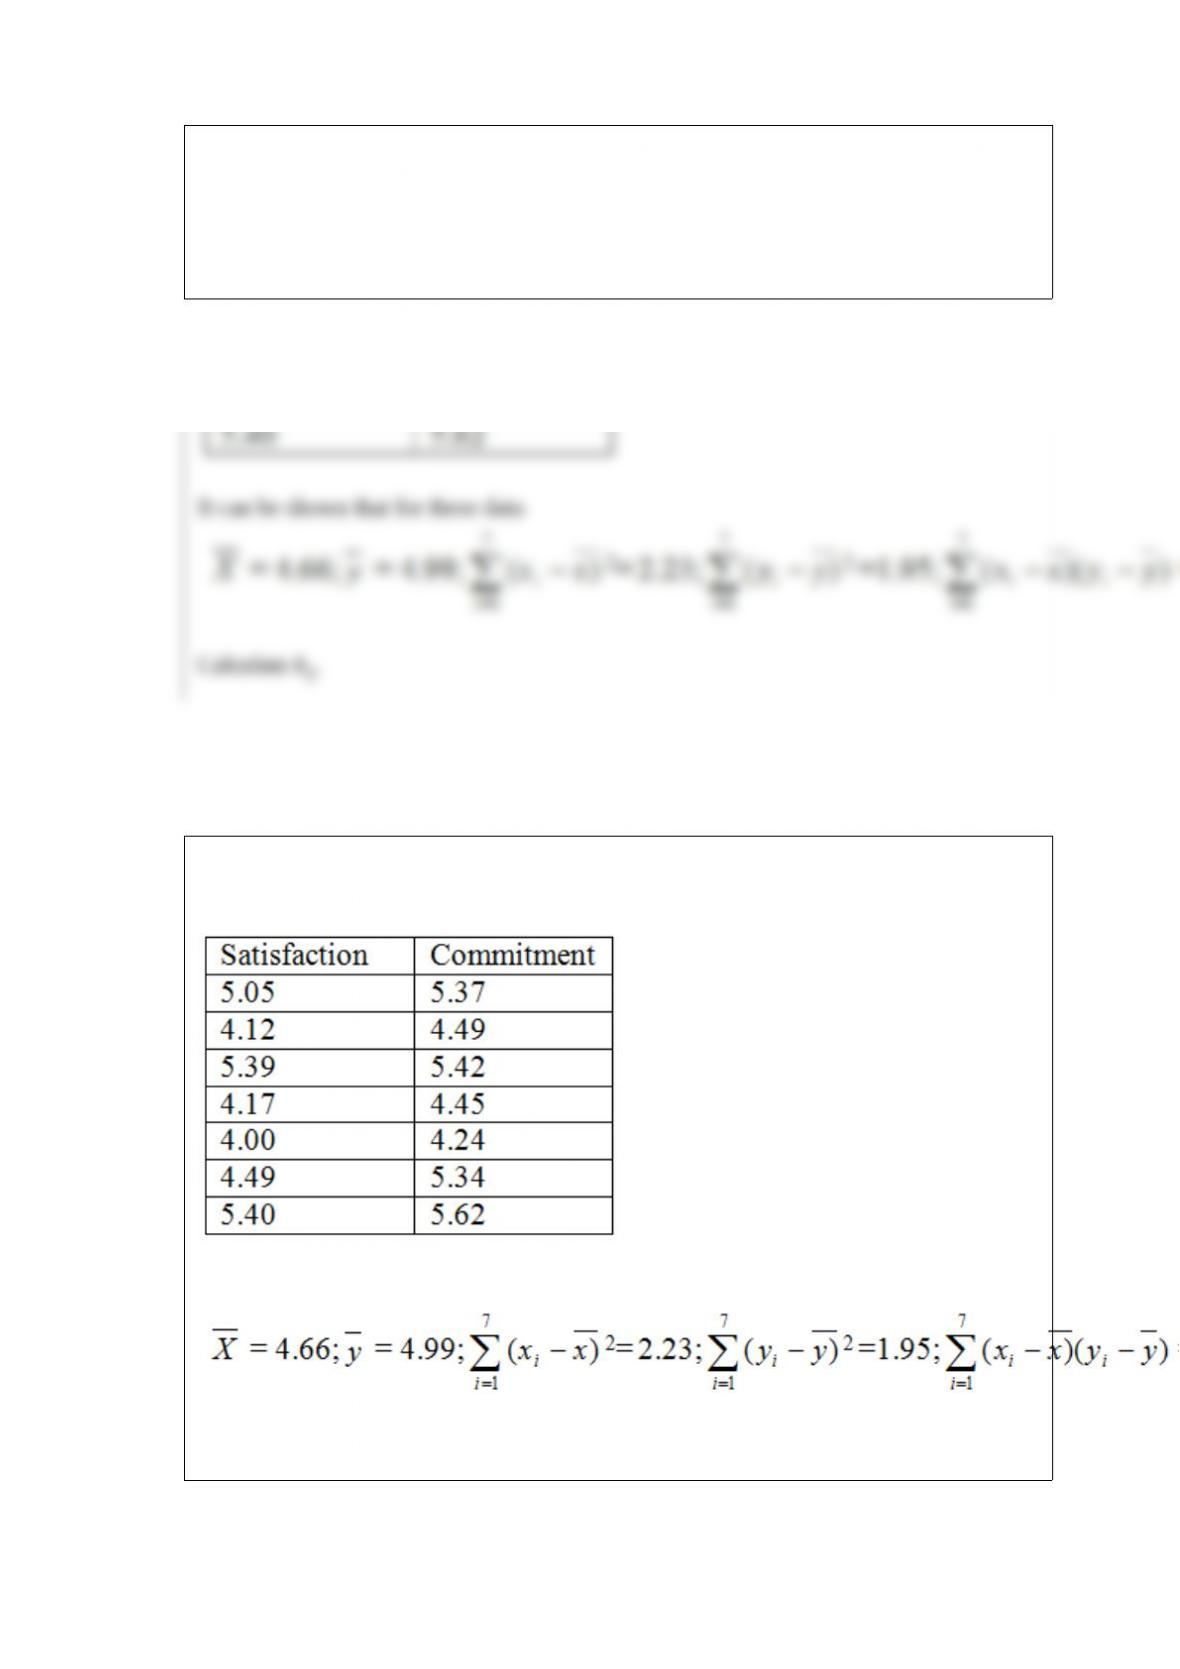
In a study of employee stock ownership plans, data were collected at seven companies
on satisfaction with the plan and the amount of organization commitment.
It can be shown that for these data
Calculate b1.
