A frequency distribution for qualitative data has class limits.
A statistics professor wants to compare grades in two different classes of the same
course. This is an example of a paired sample.
Assuming that the null hypothesis is true, a p-value is the probability of observing a
sample value greater than and/or less than an observed sample observation.
Based on a sample of 3,000 people, the civilian unemployment rate in the United States
was 5.5%. 5.5% is referred to as a statistic.
In a company, the standard deviation of the ages of female employees is 6 years and the
standard deviation of the ages of male employees is 10 years. These statistics indicate
that the dispersion of age is greater for females than for males.
The number of children in a family is a discrete variable.
The mean deviation is the sum of the absolute differences between each value and the
median.
A joint probability measures the likelihood that two or more events will happen
concurrently.
According to Chebyshev’s Theorem, 75% of the observations lie within plus and minus
2.00 average mean deviations.
A frequency distribution groups data into classes showing the number of observations
in each class.

In a bar chart, the x-axis is labeled with the values of a qualitative variable.
A point estimate is a range of values used to estimate a population parameter.
The probability of a particular outcome must always be between 0.0 and 1.0 inclusive.

The number of different standard normal distributions is unlimited.
For any uniform probability distribution, the mean and standard deviation can be
computed based on the maximum and minimum values of the random variable.
Pearson’s coefficient of skewness is a measure of a distribution’s symmetry.
Because the coefficient of determination is expressed as a percent, its value is between

0% and 100%.
If the size of a sample equals the size of the population, we would not expect any error
in estimating the population parameter.
If the null hypothesis states that there is no difference between the mean net income of
retail stores in Chicago and New York City, then the test is two-tailed.
To construct a binomial distribution, it is necessary to know the total number of trials
and the probability of success on each trial.
For a contingency table, the expected frequency for a cell is found by dividing the row
total by the grand total.
If two dependent samples of size 20 are used to test the difference between the means,
the degrees of freedom for a t-statistic are 19.
A test statistic is a value computed from sample information that is used to test the null
hypothesis.

A population is a collection of all individuals, objects, or measurements of interest.
For a global test of a multiple regression equation, the F distribution is defined by the
regression and residual degrees of freedom.
Sampling a population is often necessary because the cost of studying all the items in
the population is prohibitive.
In testing the difference between two population proportions, we pool the two sample
proportions to estimate the population proportion.

The z-scores for X values greater than the mean are negative.
An interval estimate is a single value used to estimate a population parameter.
An individual can assign a subjective probability to an event based on the individual’s
knowledge about the event.

To construct a pie chart, relative class frequencies are used to graph the ‘slices” of the
pie.
A box plot graphically shows the 10th and 90th percentiles.
Based on the Nielsen ratings, the local CBS affiliate claims its 11 p.m. newscast reaches
41% of the viewing audience in the area. In a survey of 100 viewers, 36% indicated that
they watch the late evening news on this local CBS station. What is the sample
proportion?
A. 0.41
B. 0.36%
C. 0.41%

D. 0.36
To test the null hypothesis that a set of sample data is normally distributed, we compare
an expected normal distribution of the data to an observed distribution of the data.
Which of the following measures of dispersion are based on deviations from the mean?
A. Variance
B. Standard deviation
C. Mean deviation
D. All apply

A bank wishes to estimate the mean credit card balance owed by its customers. The
population standard deviation is estimated to be $300. If a 98% confidence interval is
used and an interval of $75 is desired, how many customers should be sampled?
A. 44
B. 212
C. 629
D. 87
A company is studying the number of monthly absences among its 125 employees. The
following probability distribution shows the likelihood that people were absent 0, 1, 2,
3, 4, or 5 days last month.
What is the variance of the number of days absent?
A. 1.1616

B. 1.41
C. 5.00
D. 55.52
In multiple regression analysis, residuals (Y – Ŷ) are used to __________.
A. Provide a global test of a multiple regression model
B. Evaluate the assumption of linearity
C. Calculate the variance inflation factor
D. Compare two regression coefficients
What is the variable used to predict another variable called?
A. Independent variable

B. Dependent variable
C. Important variable
D. Causal variable
What is a disadvantage of the range as a measure of dispersion?
A. It is based on only two observations.
B. It can be distorted by a large mean.
C. It is not in the same units as the original data.
D. It has no disadvantage.
Accounting procedures allow a business to evaluate their inventory costs based on two
methods: LIFO (Last In First Out) or FIFO (First In First Out). A manufacturer
evaluated its finished goods inventory (in $000s) for five products with the LIFO and
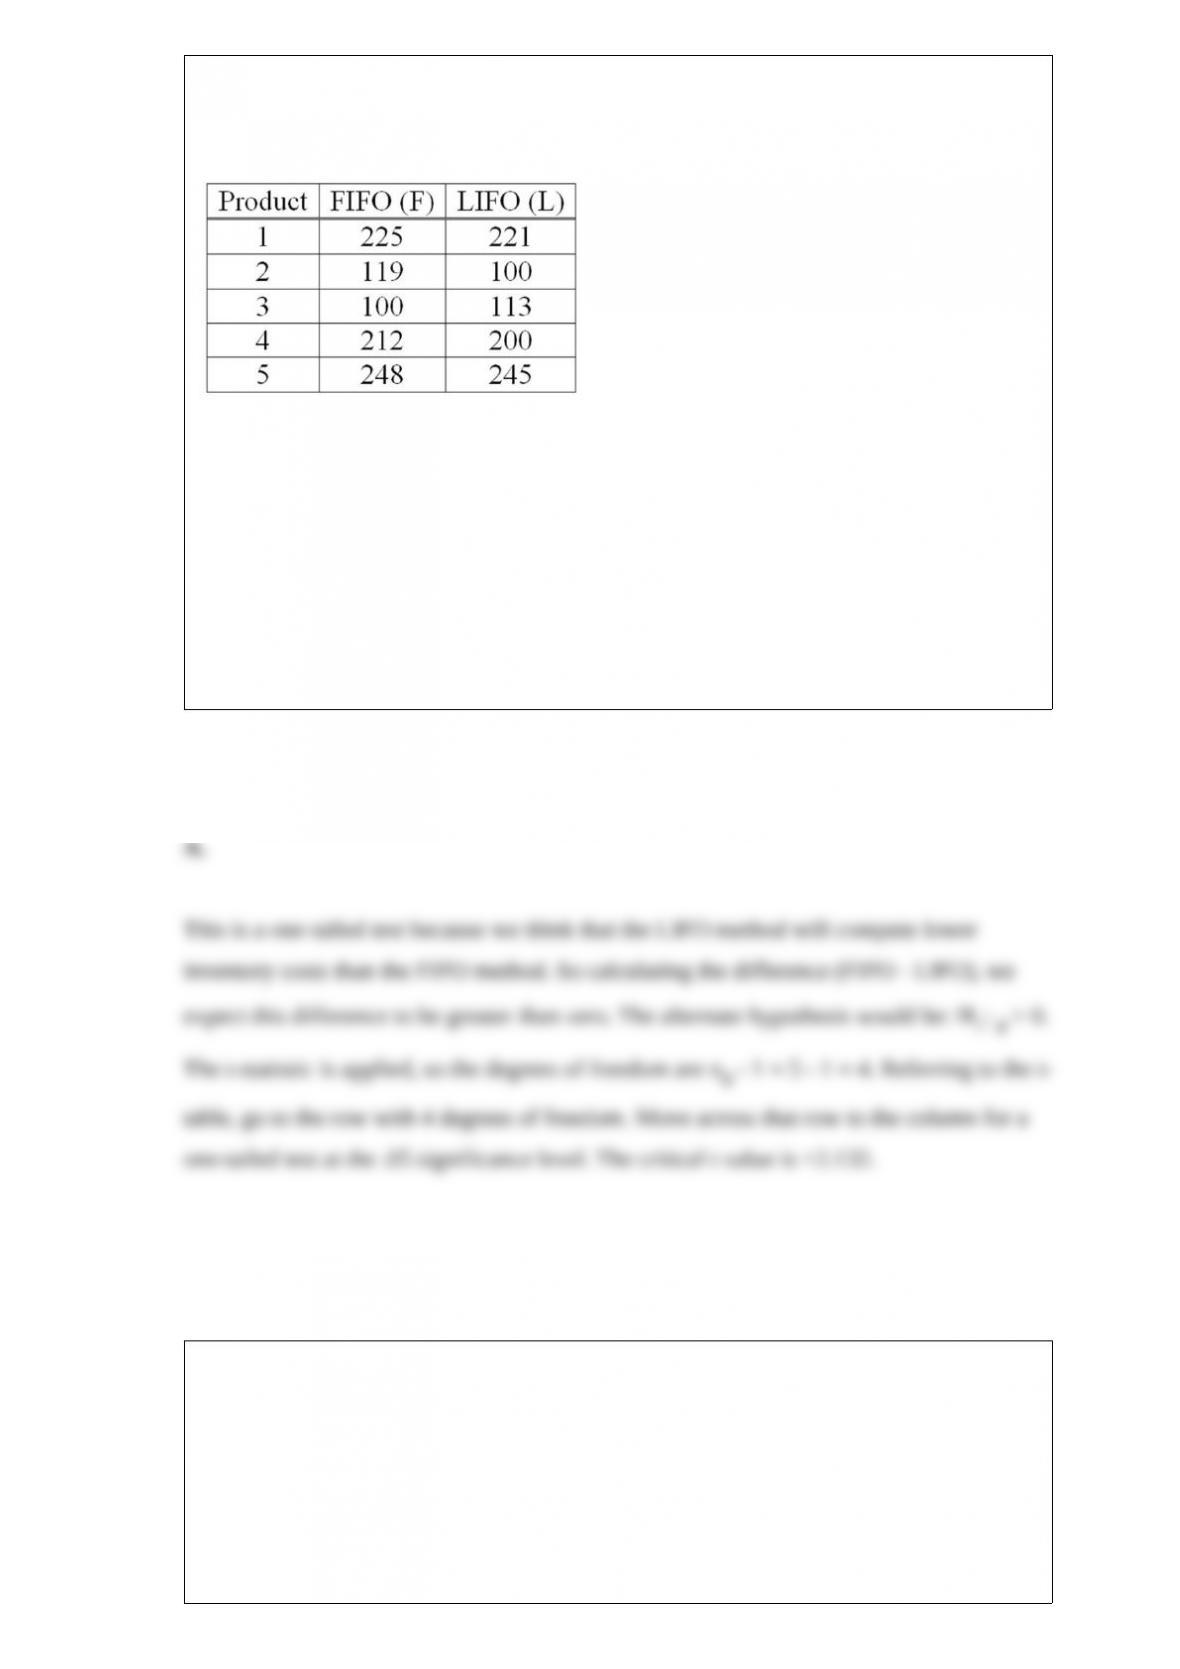
FIFO methods. To analyze the difference, they computed (FIFO – LIFO) for each
product. Based on the following results, does the LIFO method result in a lower cost of
inventory than the FIFO method?
If you use the 5% level of significance, what is the critical t value?
A. +2.132
B. 2.132
C. +2.262
D. 2.228
A stockbroker placed the following order for a customer:
– 50 shares of Kaiser Aluminum at $104 a share
– 100 shares of GTE at $25.25 a share
– 20 shares of Boston Edison at $9.125 a share
What is the weighted arithmetic mean price per share?
A. $25.25
B. $79.75
C. $103.50
D. $46.51
The adjusted R2 accounts for the number of independent variables by ____________.
A. Adding one to the R2
B. Using the degrees of freedom
C. Multiplying by the multiple standard error of the estimate
D. Using a subscript for R2
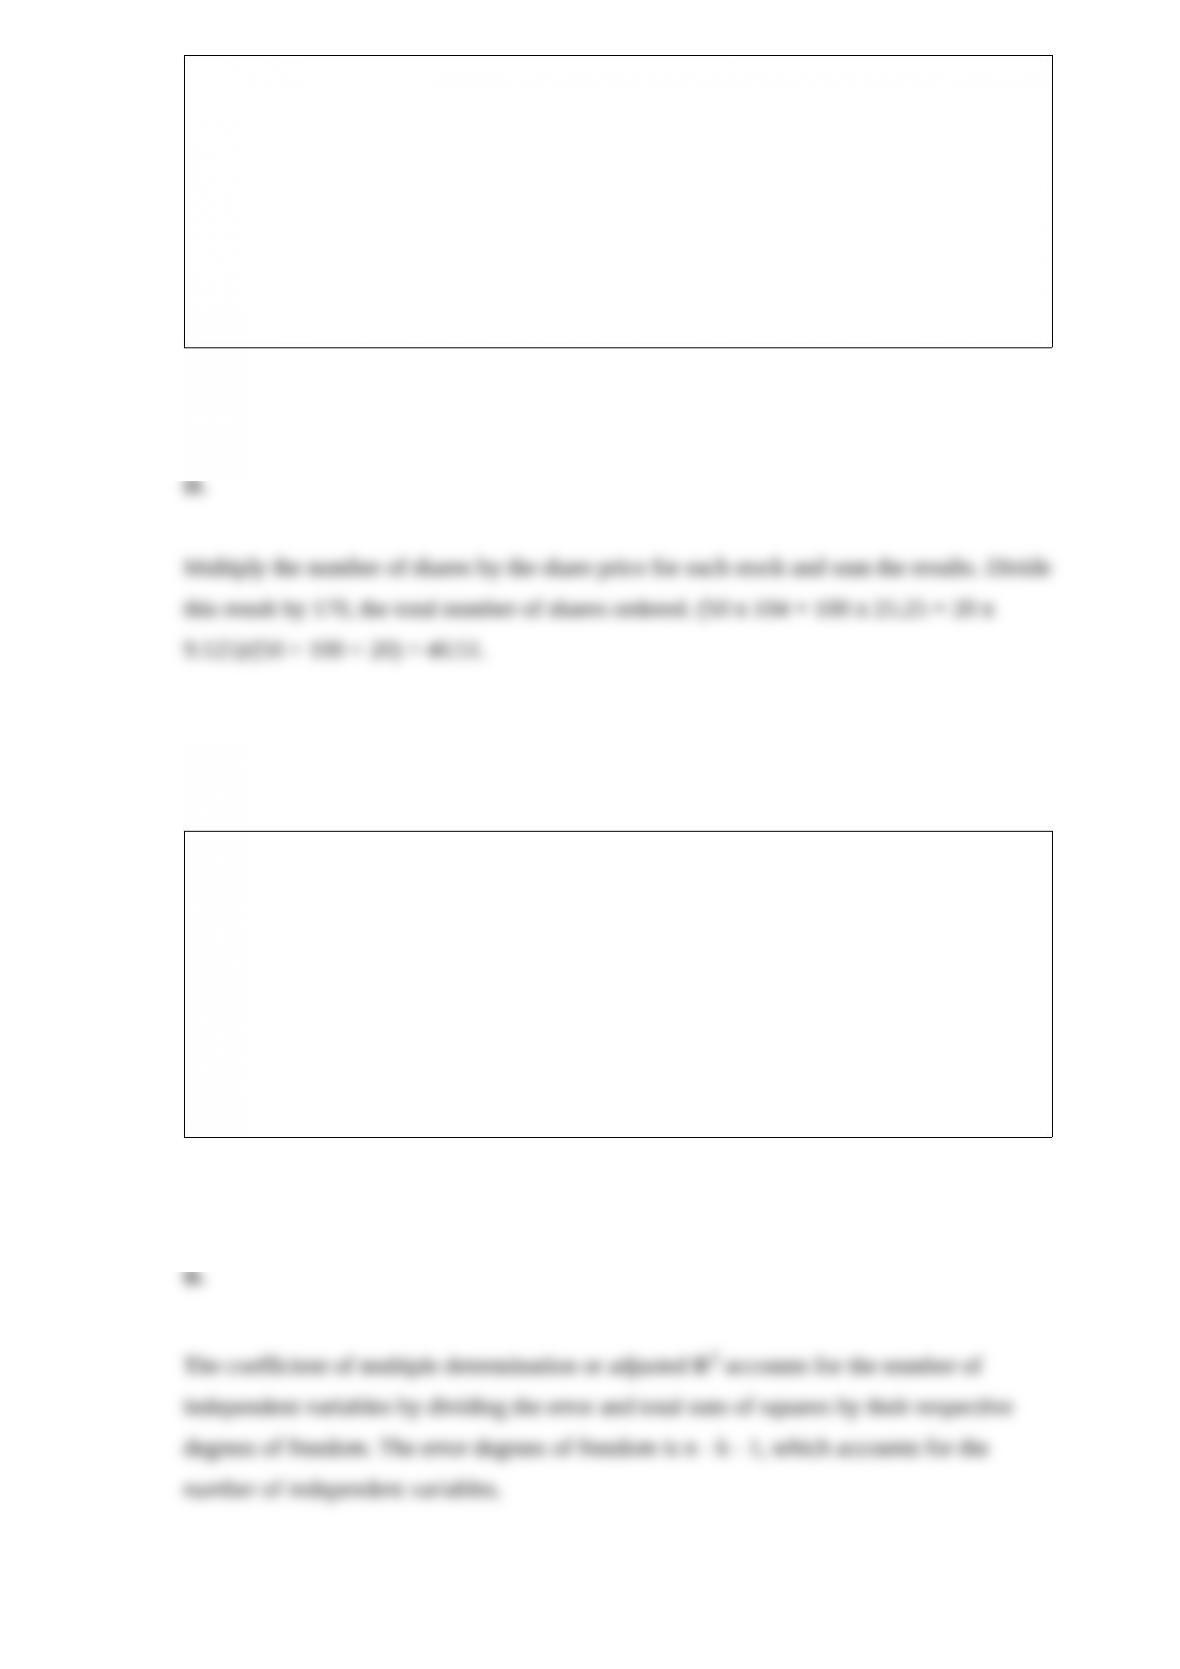
Refer to the following wage breakdown for a garment factory.
What is the class interval for the preceding table of wages?
A. $2
B. $3
C. $4
D. $5
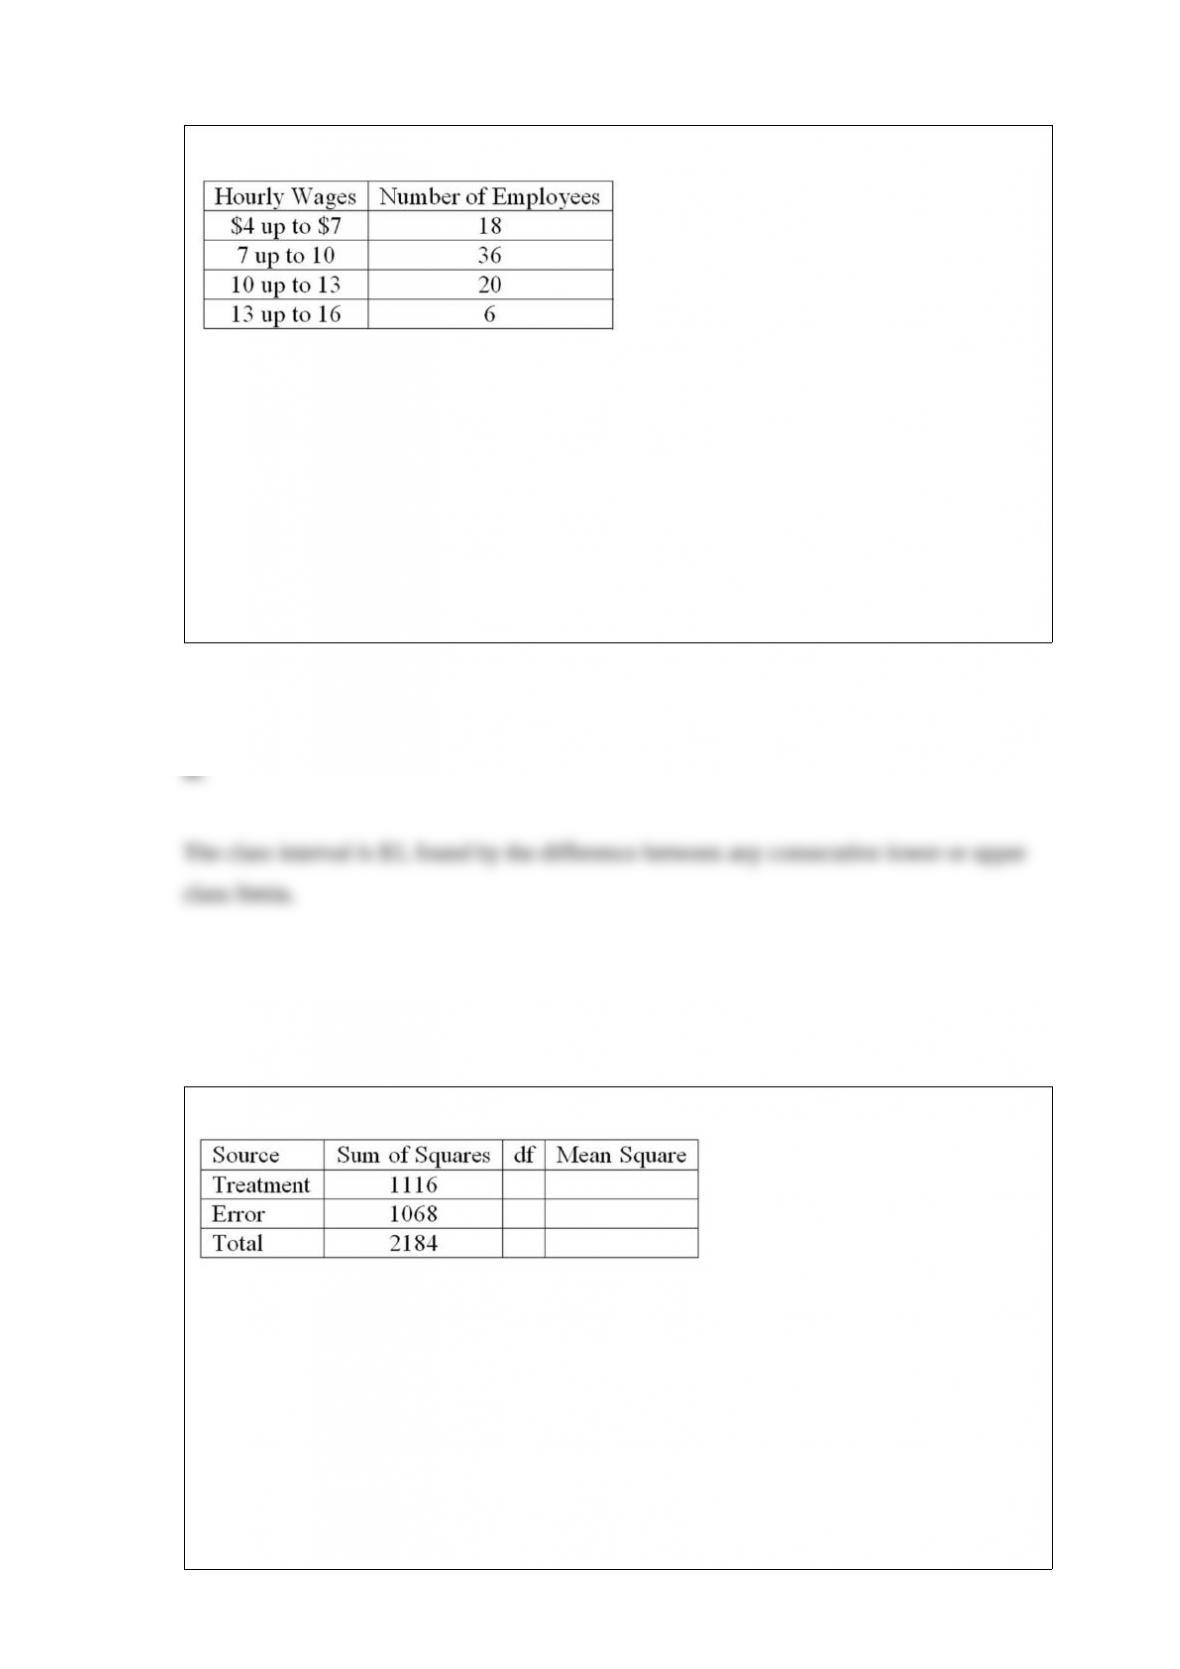
Given the following ANOVA table for three treatments each with six observations:
What are the degrees of freedom for the treatment and error sources of variation?
A. 3 and 18
B. 2 and 17
C. 3 and 15
D. 2 and 15
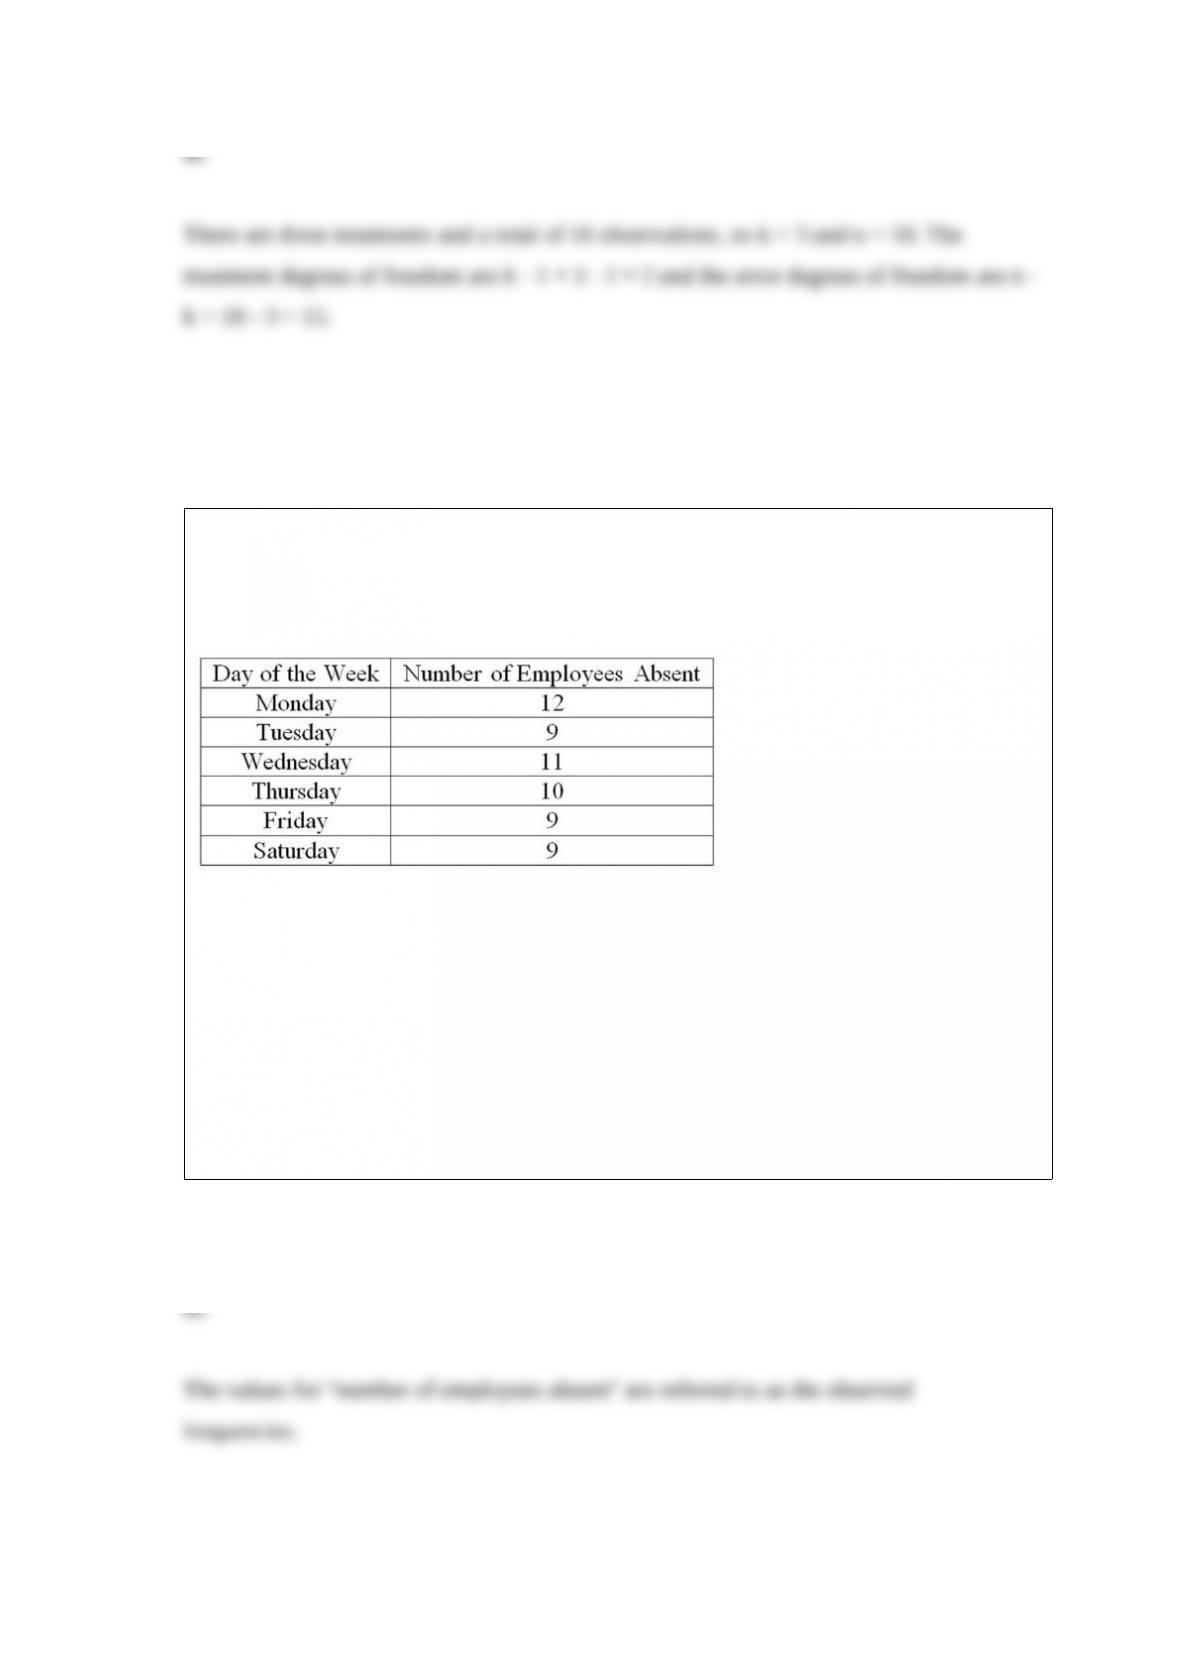
A personnel manager is concerned about absenteeism. She decides to sample employee
records to determine if absenteeism is distributed evenly throughout the six-day
workweek. The null hypothesis is: Absenteeism is distributed evenly throughout the
week. The 0.01 level is to be used. The sample results are:
What kind of frequencies are the numbers 12, 9, 11, 10, 9, and 9 called?
A. Acceptance frequencies
B. Critical frequencies
C. Expected frequencies
D. Observed frequencies

Refer to the following information from a frequency distribution for “heights of college
women” recorded to the nearest inch: the first two class midpoints are 62.5″ and 65.5″.
What are the class limits for the third class?
A. 64 and up to 67
B. 67 and 69
C. 67 and up to 70
D. 66 and 68
In multiple regression, a dummy variable is significantly related to the dependent
variable when ______________.
A. The global test of the regression equation is rejected
B. The test of the dummy variable’s regression coefficient is rejected
C. The dummy variable is correlated with other independent variables
D. The dummy variable is coded as 2 or 3
If the null hypothesis that two means are equal is true, where will 97% of the computed
z values lie between?
A. 2.58
B. 2.33
C. 2.17
D. 2.07
A university surveyed recent graduates of the English Department for their starting
salaries. Four hundred graduates returned the survey. The average salary was $25,000.
The population standard deviation is $2,500. A 95% confidence interval is constructed.
What does the confidence interval mean?
A. The population mean is in the interval.
B. The population mean is not in the interval.
C. The likelihood that any confidence interval based on a sample of 400 graduates will
contain the population mean is 0.95.
D. There is a 5% chance that the computed interval does not contain the population
mean.
When applying the special rule of addition for mutually exclusive events, the joint
probability is _______.
A. 1
B. .5
C. 0
D. Unknown
A manufacturer of headache medicine claims it is 70% effective within a few minutes.
That is, out of every 100 users, 70 get relief within a few minutes. A group of 12
patients are given the medicine. If the claim is true, what is the probability that eight
have relief within a few minutes?
A. 0.001
B. 0.168

C. 0.667
D. 0.231
A sample of assistant professors on the business faculty at state-supported institutions in
Ohio revealed the mean income to be $72,000 for nine months, with a standard
deviation of $3,000. Using Chebyshev’s Theorem, what proportion of the faculty earns
more than $66,000, but less than $78,000?
A. At least 50%
B. At least 25%
C. At least 75%
D. At least 100%
According to the central limit theorem, ____________.
A. The population mean and the mean of all sample means are equal
B. Increasing sample size decreases the dispersion of the sampling distribution
C. The sampling distribution of the sample means is approximately normally distributed
D. The sampling distribution of the sample means will be skewed
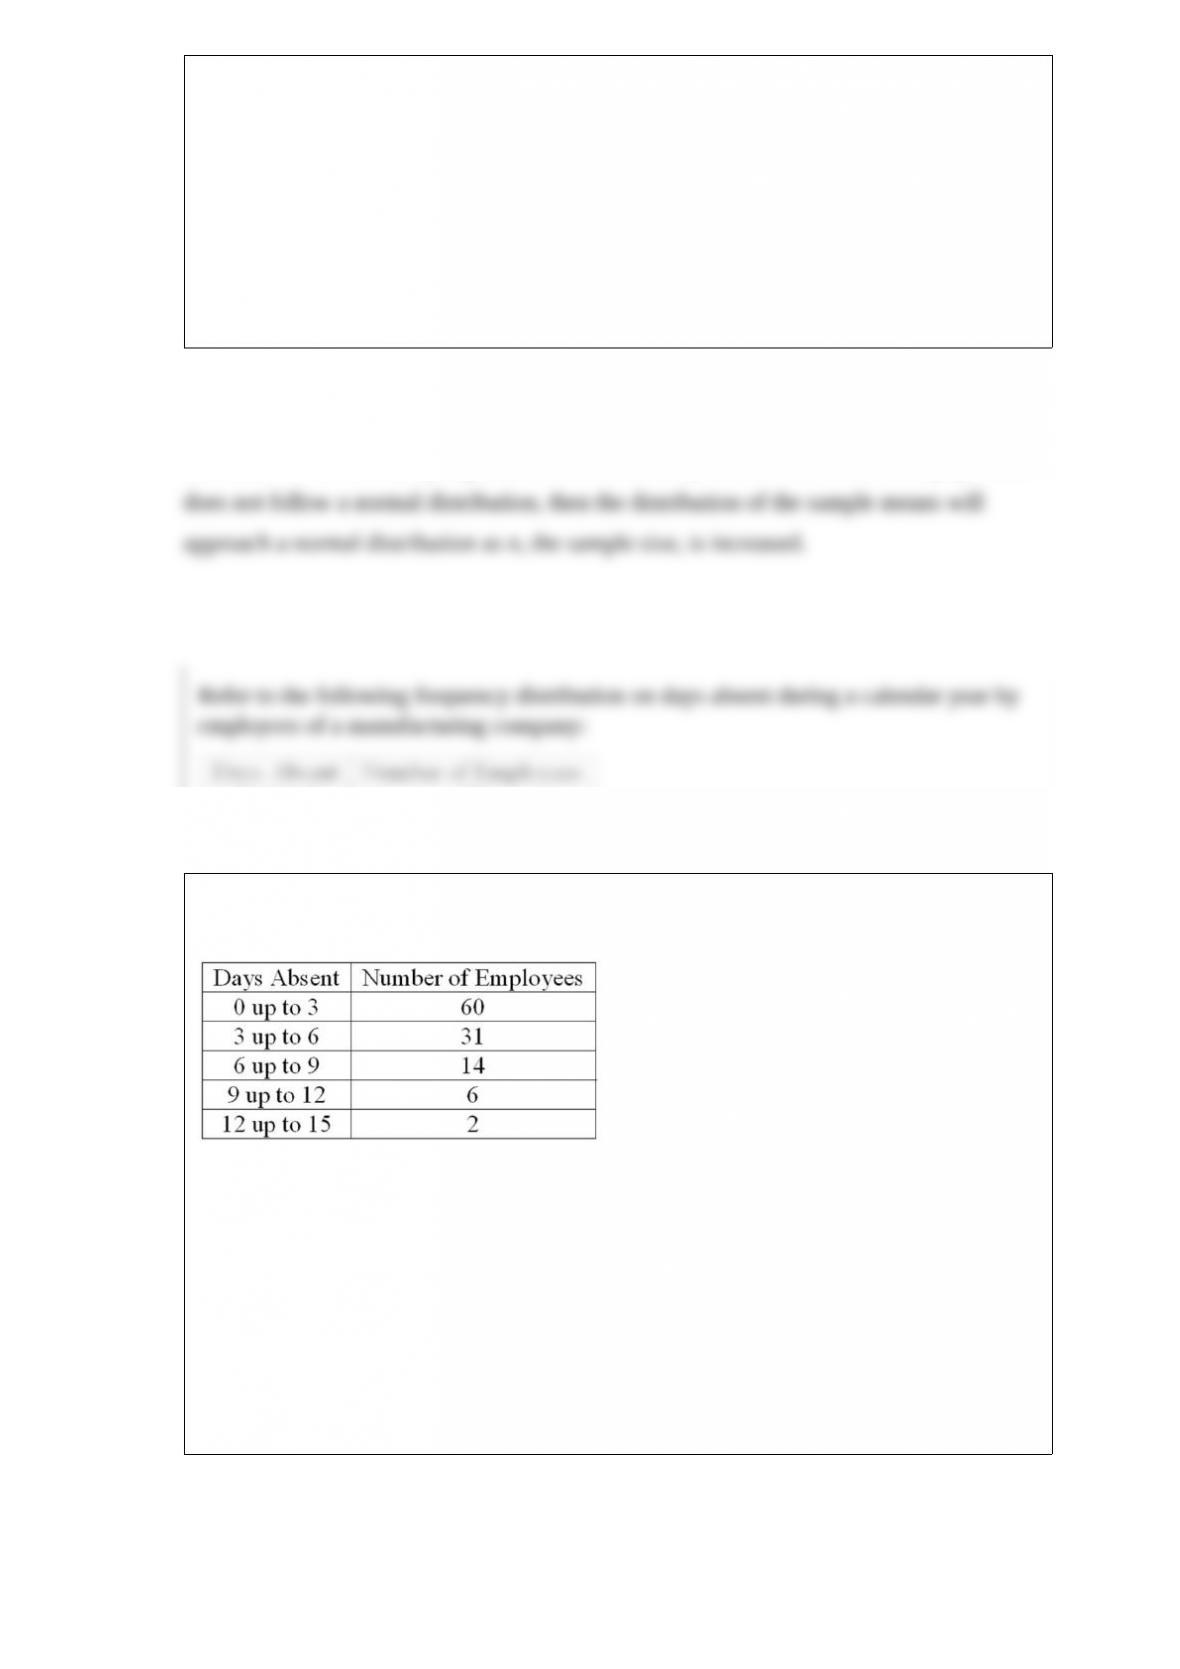
Refer to the following frequency distribution on days absent during a calendar year by
employees of a manufacturing company:
How many employees were absent from 6 up to 12 days?
A. 20
B. 8
C. 12
D. 17
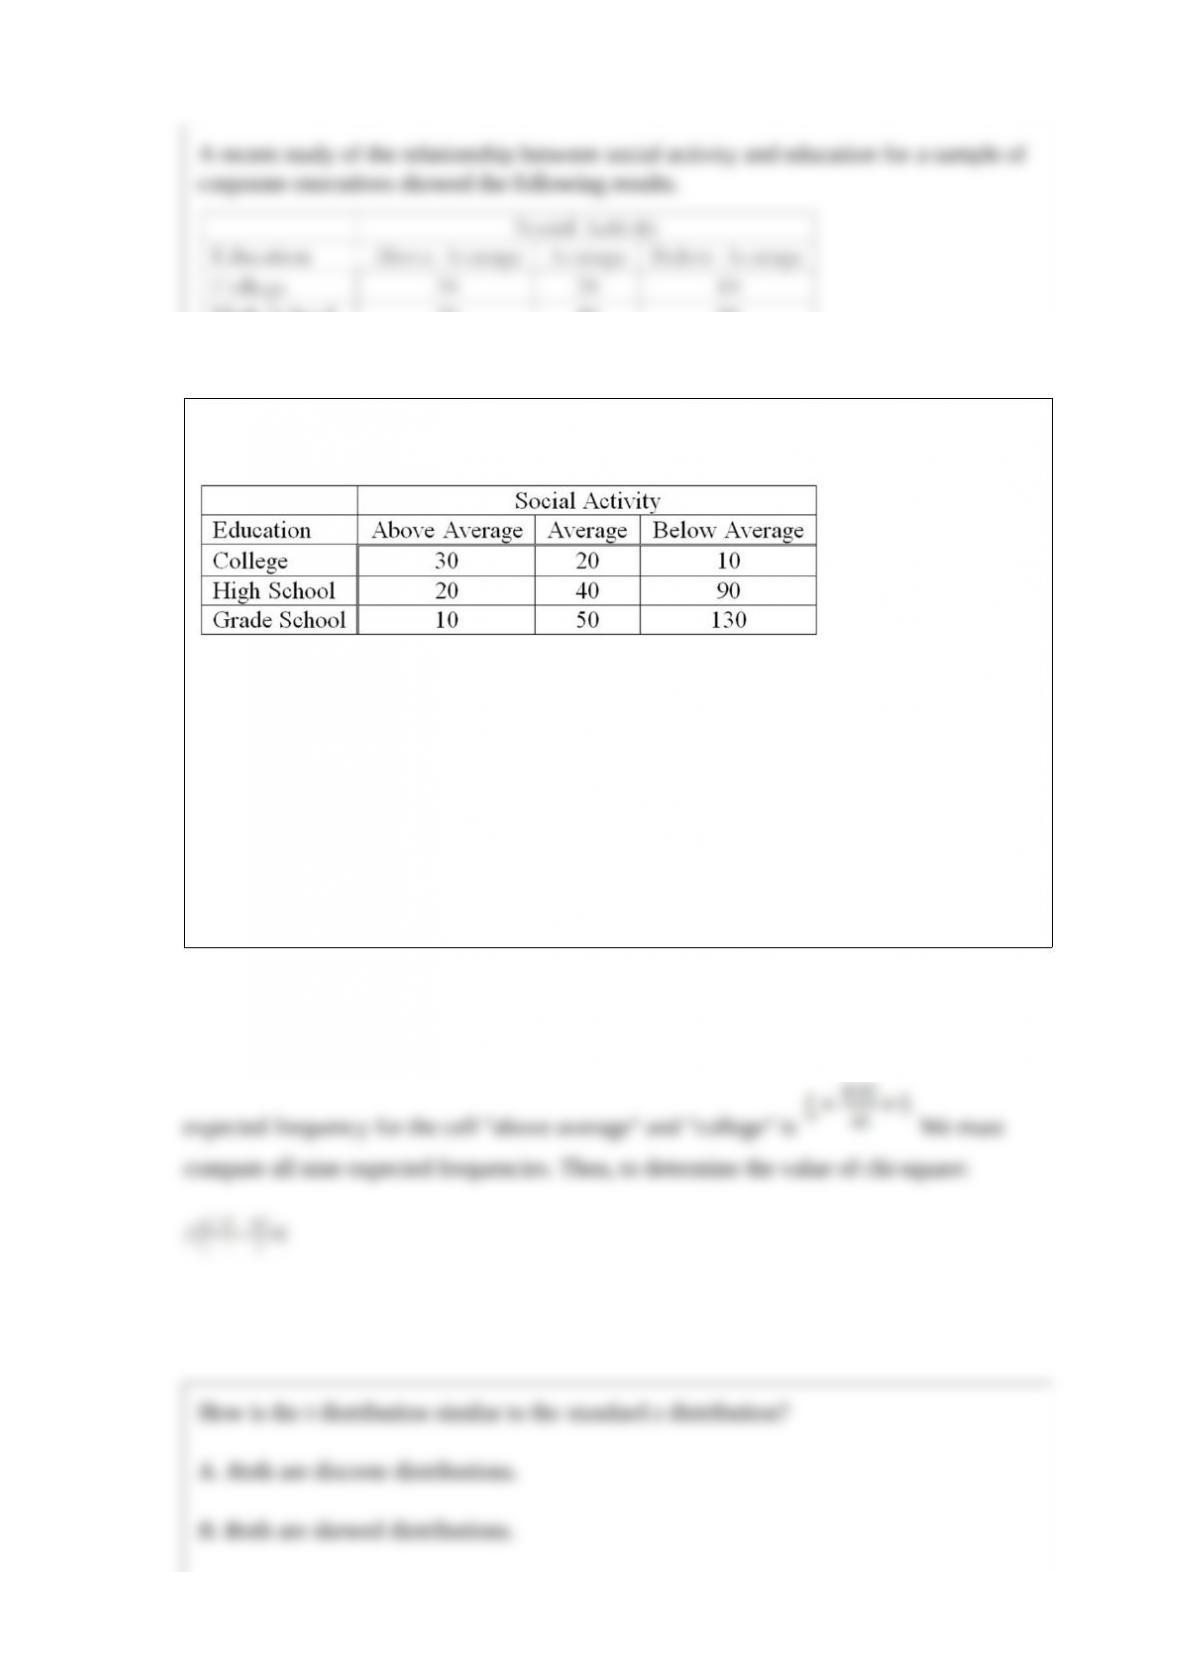
A recent study of the relationship between social activity and education for a sample of
corporate executives showed the following results.
What is the value of the chi-square test statistic?
A. 100
B. 83.67
C. 50
D. 4.94

How is the t distribution similar to the standard z distribution?
A. Both are discrete distributions.
B. Both are skewed distributions.
C. Both are families of distributions.
D. Both are continuous distributions.
In a management trainee program, 80% of the trainees are female, 20% male. A total of
90% of the females attended college, while 78% of the males attended college. A
management trainee is selected at random. What is the probability that the person
selected is a female who did attend college?
A. 0.20
B. 0.08
C. 0.25
D. 0.72

In ANOVA, the null hypothesis is:
A.
B.
C.
D.
David’s gasoline station offers 4 cents off per gallon if the customer pays in cash and
does not use a credit card. Past evidence indicates that 40% of all customers pay in
cash. During a one-hour period, 15 customers buy gasoline at this station. What is the
probability that at least 10 pay in cash?
A. 0.024
B. 0.033
C. 0.009
D. 0.976

The mean of all the sample means is _______.
A.
B. µ
C. σ
D. α
Which one of the following is NOT an example of discrete data?
A. Number of households watching the Home Shopping Network
B. Number of employees reporting in sick
C. Number of miles between New York City and Chicago
D. Number of members of the Denver Lions Club
In a study of protein breakfast bars, five bars from each of three brands were tested to
see if the mean amount of protein per bar differs among the brands. To select a critical
F-statistic, the number of degrees of freedom for the denominator is _____.
Approximately 25% of tourists going to Atlantic City to gamble spend more than $500.
The Atlantic City Chamber of Commerce wants to update this percentage. For the new
study, the estimate should be within 1% of the population proportion, with a 90%
confidence level. What is the necessary sample size?
To collect a sample, a population is first divided into subgroups and then a sample is
selected from each subgroup. This is called _________ sampling.
Pearson’s coefficient of skewness (Sk) ranges from -3.0 to +3.0. It is computed by
subtracting the median from the mean, multiplying the result by 3, and dividing by the
_______________.
For hypotheses that compare two population means, when is a pooled variance used?
The formula used to compute the standard deviation is ________.
When deciding on the number of observations to include in a sample, what would favor
larger sample sizes?
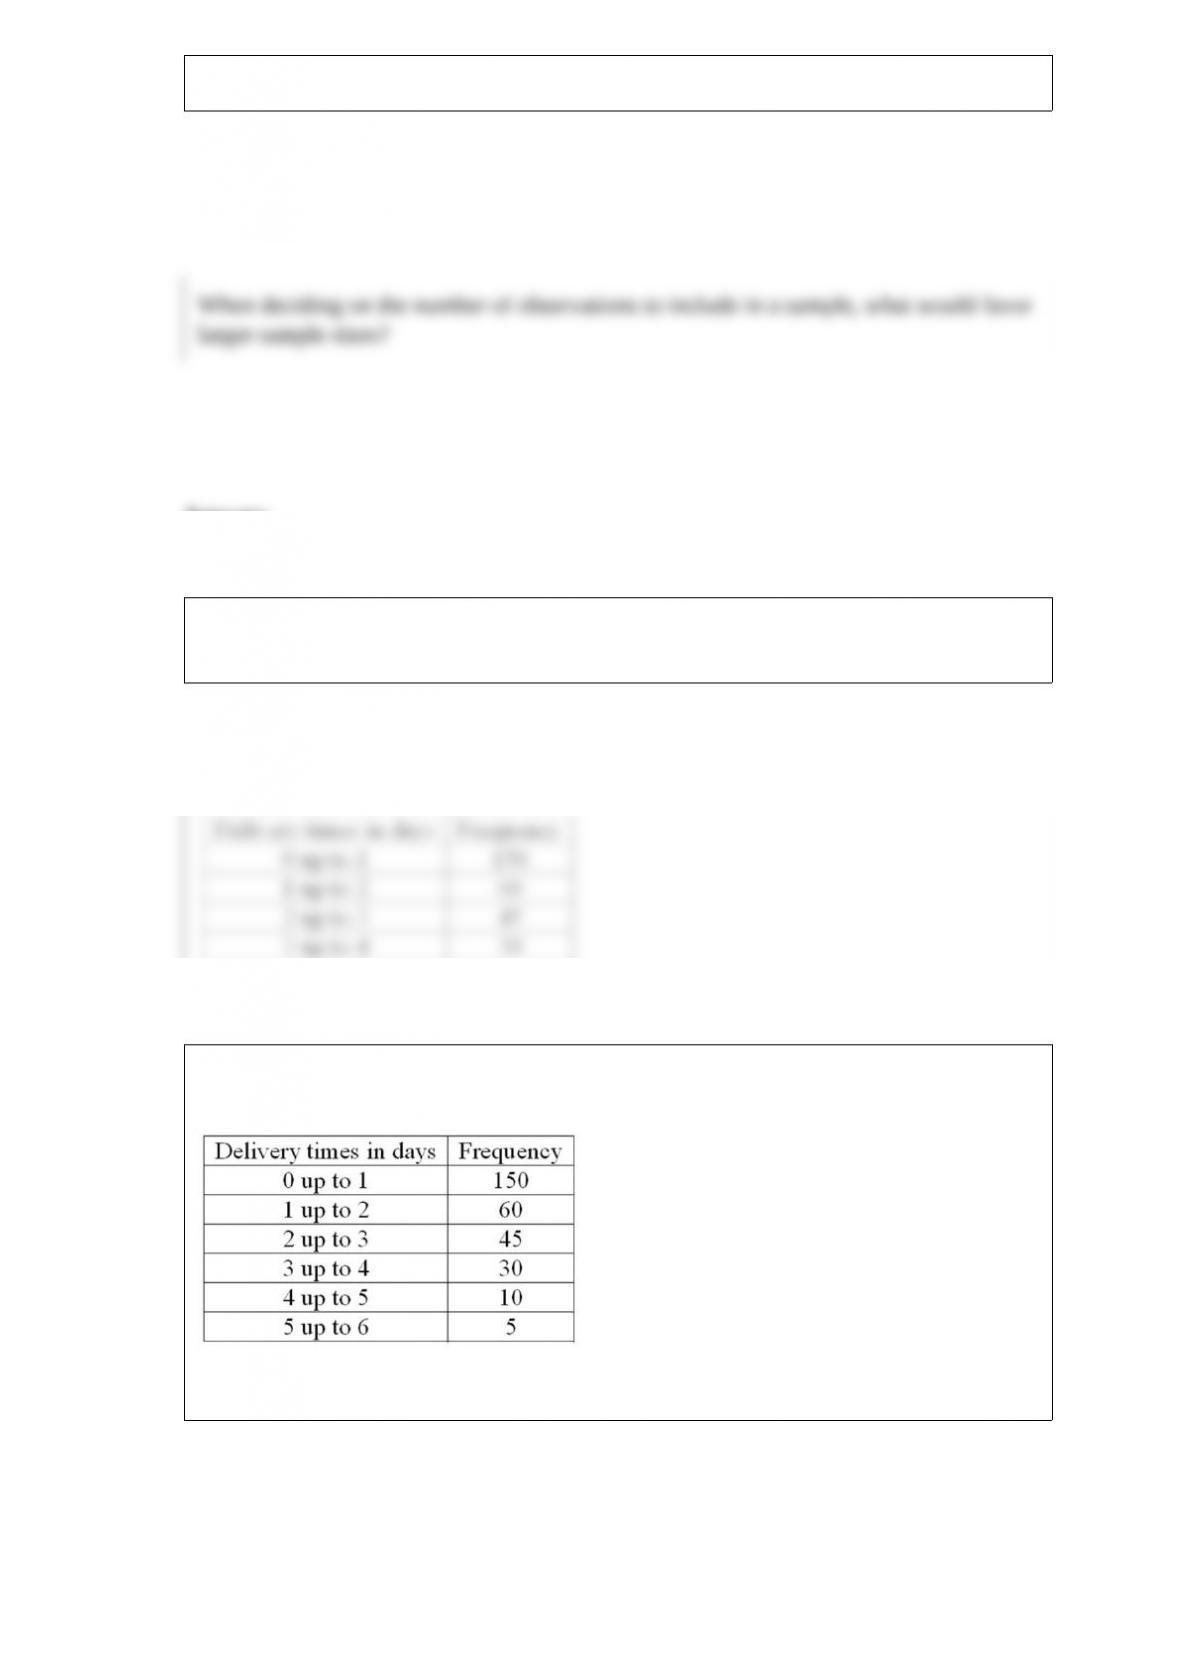
The following frequency distribution shows the distribution of delivery times (in days)
for swimstuff.com customer orders during the last month.
What is the relative frequency for orders delivered in less than one day?
What are the similarities and differences between the range and the standard deviation?
What is the common purpose of a scatter diagram and a contingency table?
A new computer game has been developed and 80 veteran game players will test its
market potential. If 60 players liked the game, the probability that any veteran game
player will like the new computer game is ______.
A data set consists of 40 observations. For a quantitative variable, how many classes
would you recommend for the frequency distribution?
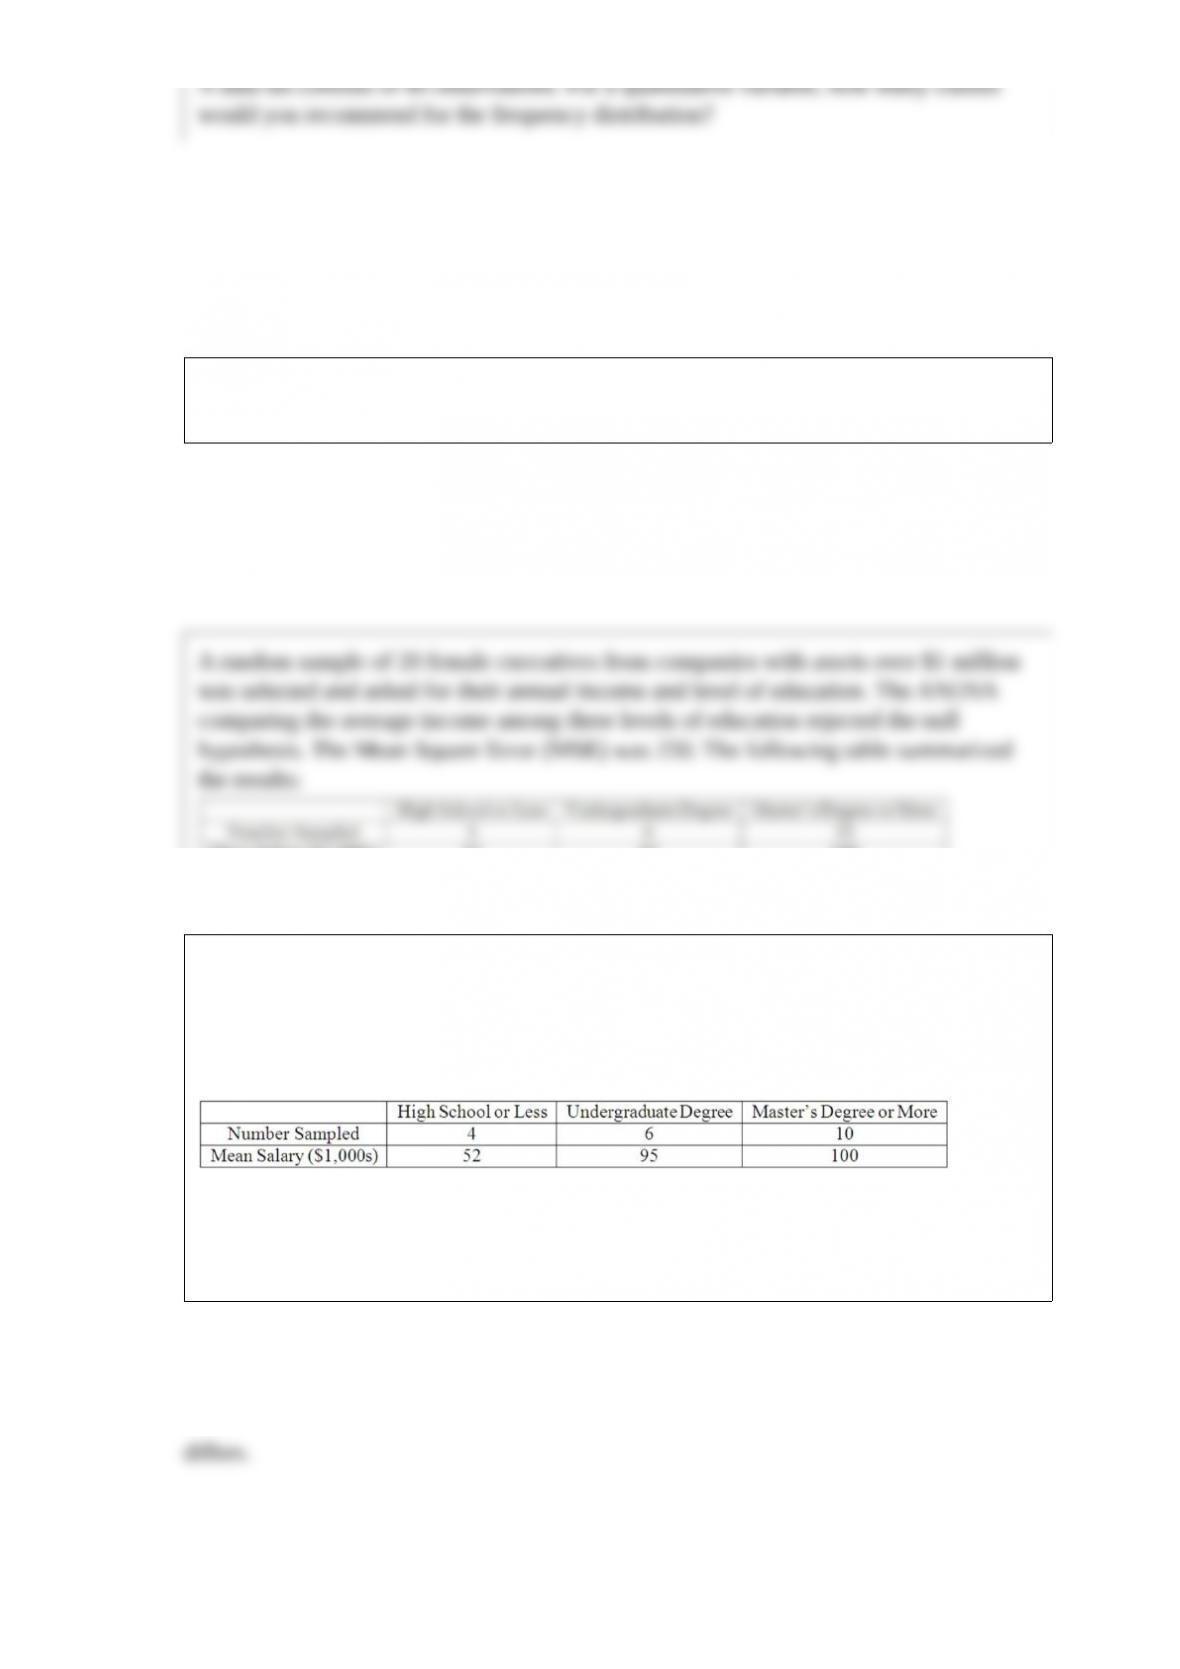
A random sample of 20 female executives from companies with assets over $1 million
was selected and asked for their annual income and level of education. The ANOVA
comparing the average income among three levels of education rejected the null
hypothesis. The Mean Square Error (MSE) was 250. The following table summarized
the results:
To compare the mean annual incomes of female executives with an undergraduate
degree and female executives with a high school or less education, compute the 95%
confidence interval.
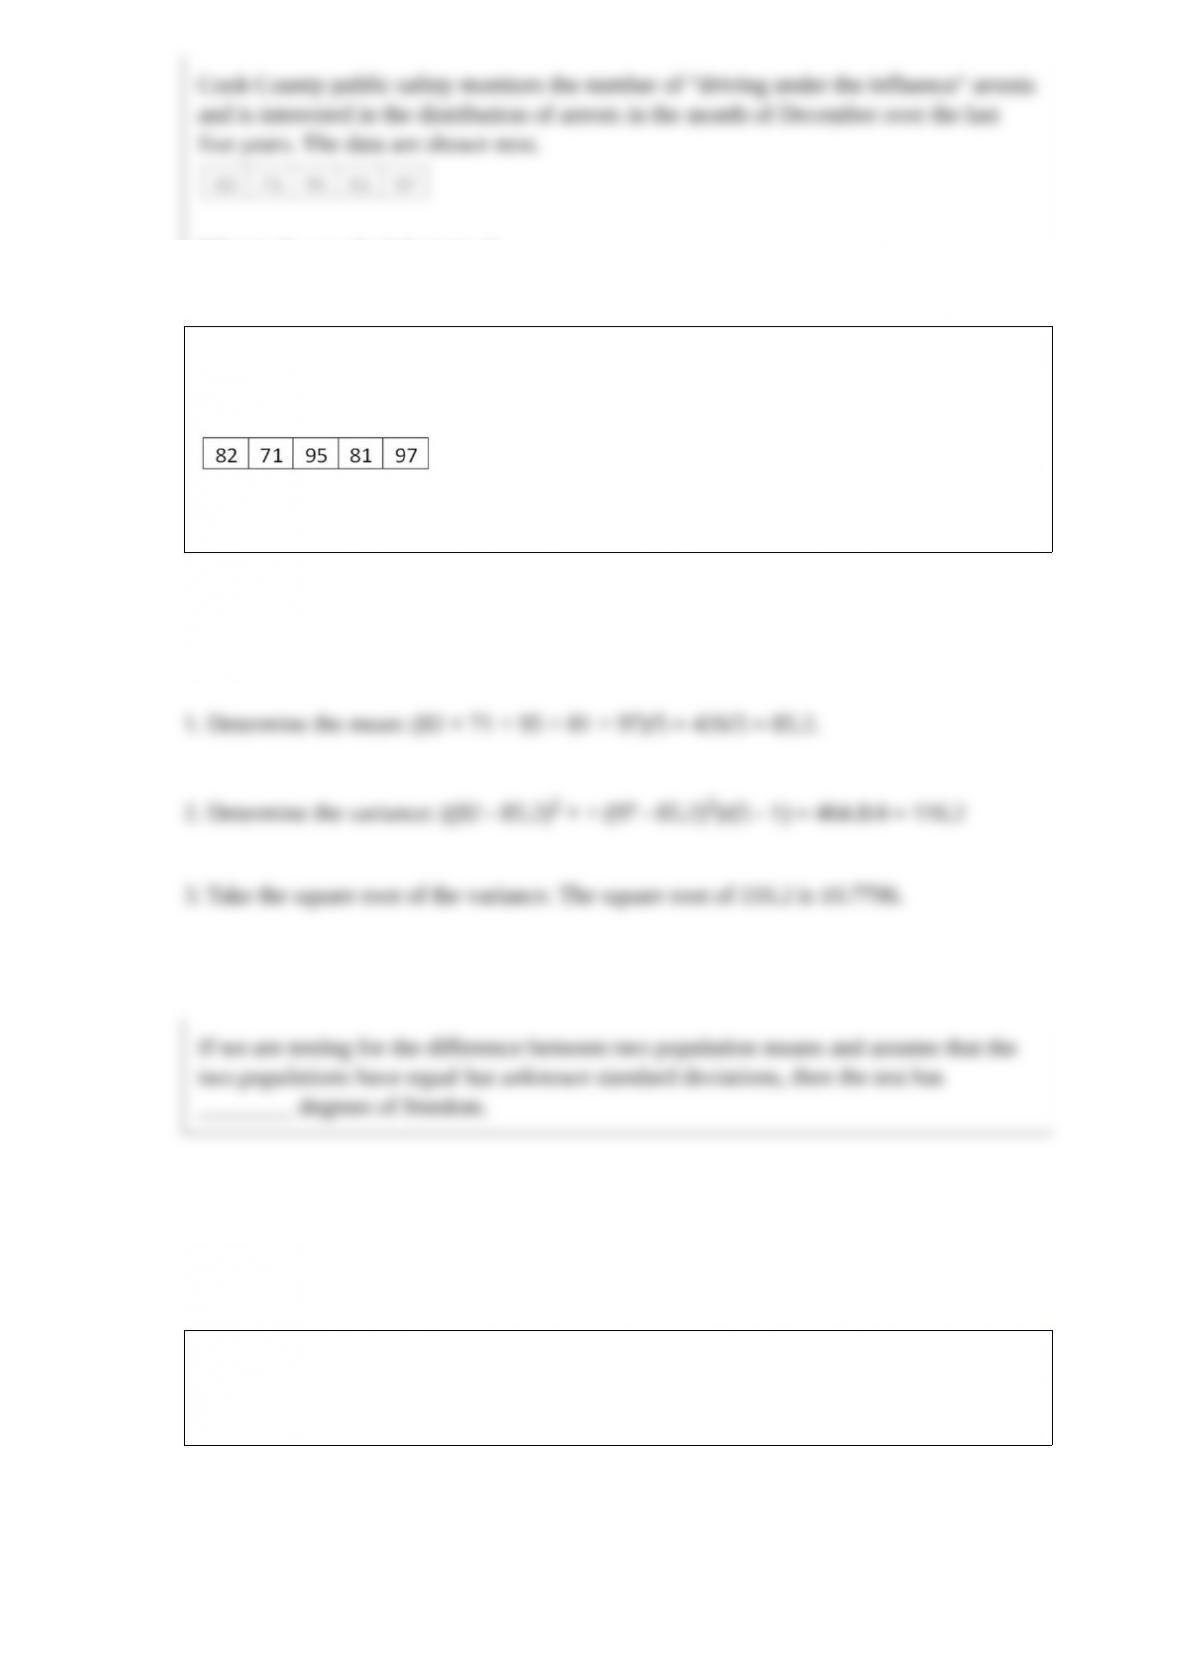
Cook County public safety monitors the number of “driving under the influence” arrests
and is interested in the distribution of arrests in the month of December over the last
five years. The data are shown next.
What is the standard deviation?
If we are testing for the difference between two population means and assume that the
two populations have equal but unknown standard deviations, then the test has
________ degrees of freedom.

What is unique to the Poisson distribution?
A manufacturer claims that less than 1% of all its products do not meet the minimum
government standards. A survey of 500 products revealed that 10 did not meet the
standard. If the computed z-statistic is -1.960 and the level of significance is 0.01, your
decision would be _______________.