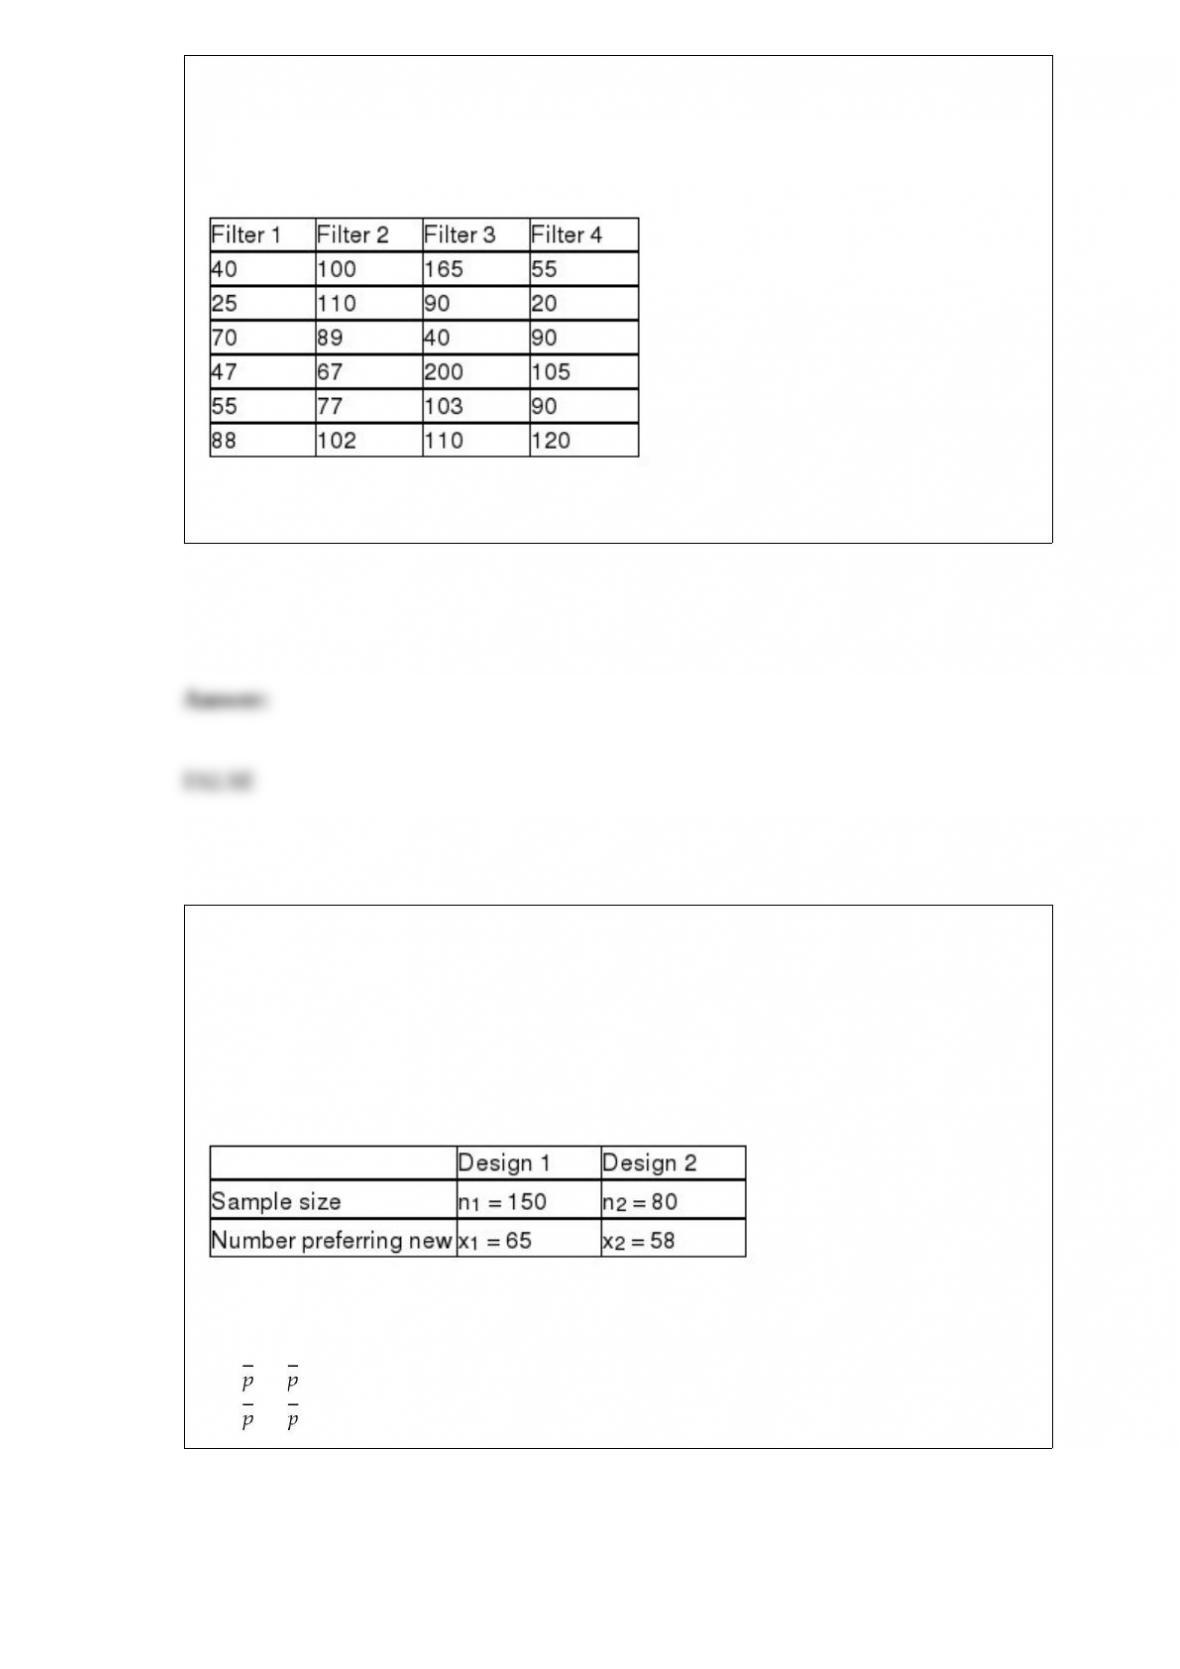
The makers of furnace filters recently conducted a test to determine whether the median
number of particulates that would pass through their four leading filters was the same. A
random sample of 6 of each type of filter was used with the following data being
recorded:
If the Kruskal-Wallis test is used, the test statistic is approximately H = 7.814
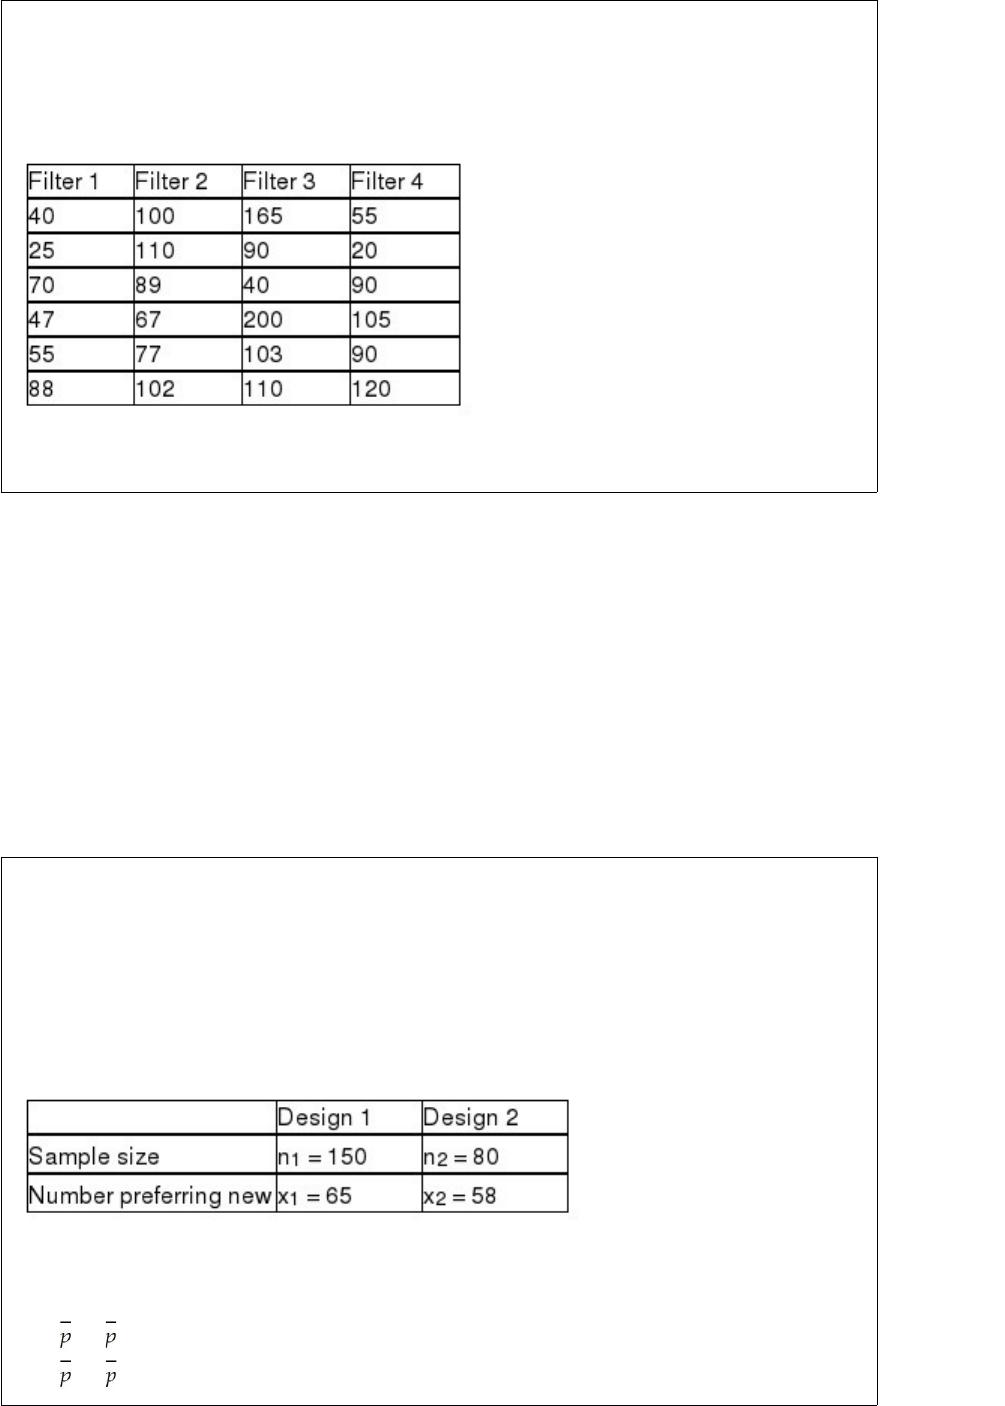
A major manufacturer of home electronics is interested in determining whether
customers have a preference between two new speaker designs for their home
entertainment centers. To test this, the design department manager has selected a
random sample of customers and shown them the first design. A second sample of
customers is shown design 2. The manager then asks each customer whether they prefer
the new design they were shown over the one they currently own. The following results
were observed:
Based on these data and a significance level equal to 0.05, the appropriate null and
alternative hypotheses are:
H0 : 1 ≥ 2
Ha : 1 < 2
In process improvement efforts, the goal is to first remove the common cause variation
and then to reduce the special cause variation in a system.
The state insurance commissioner believes that the mean automobile insurance claim
filed in her state exceeds $1,700. To test this claim, the agency has selected a random
sample of 20 claims and found a sample mean equal to $1,733 and a sample standard
deviation equal to $400. They plan to conduct the test using a 0.05 significance level.
Given this, the appropriate null and alternative hypotheses are
H0 : ≤ $1,700
HA : > $1,700
An electronics repair shop has determined that the time between failures for a particular
electronic component part is exponentially distributed with a mean time between
failures of 200 hours. Based on this information, the probability that a part will not fail
in the first 200 hours is 0.50.


The manager of the local county fair believes that no more than 30 percent of the adults
in the county would object to a fee increase to attend the fair if it meant that better
entertainment could be secured. To estimate the true proportion, he has selected a
random sample of 200 adults. The manager will use a 90 percent confidence level.
Assuming his assumption about the 30 percent holds, the margin of error for the
estimate will be approximately .169.
If a simple least squares regression model is developed based on a sample where the
two variables are known to be positively correlated, the sign on the regression
coefficient will be positive also.
When an interviewer asks a specified series of questions in the course of a personal
interview, he/she is conducting an unstructured interview.

The null hypothesis that two population variances are equal will tend to be rejected if
the ratio of the sample variances from each population is substantially larger than 1.0.
A local bank has 1,400 checking account customers. Of these, 1,020 also have savings
accounts. A sample of 400 checking account customers was selected from the bank of
which 302 also had savings accounts. The sampling error in this situation is .0264.
A major airline has stated in an industry report that its mean onground time between
domestic flights is less than 18 minutes. To test this, the company plans to sample 36
randomly selected flights and use a significance level of 0.10. Assuming that the
population standard deviation is known to be 4.0 minutes, the probability that the null
hypothesis will be “accepted” if the true population mean is 16 minutes is
approximately 0.955.

In analyzing the sampling distribution of a proportion, doubling the sample size will cut
the standard deviation of the sampling distribution in half.
The Cranston Hardware Company is interested in estimating the difference in the mean
purchase for men customers versus women customers. It wishes to estimate this
difference using a 95 percent confidence level. If the sample size is n = 10 from each
population, the samples are independent, and sample standard deviations are used, and
the variances are assumed equal, then the critical value will be t = 2.1009.
Simple random sampling involves selecting members of the population in such as way
that all members are equally likely to be chosen.
Six food critics each visited and rated four different restaurants. Each critic visited each
restaurant on three separate occasions and recorded a score for each visit. Assume that
results show that there is an interaction. This would mean that, for example, which
restaurant is rated the highest depends on which critic does the rating.
To calculate beta requires making a “what if” assumption about the true population
parameter, where the “what-if” value is one that would cause the null hypothesis to be
false.
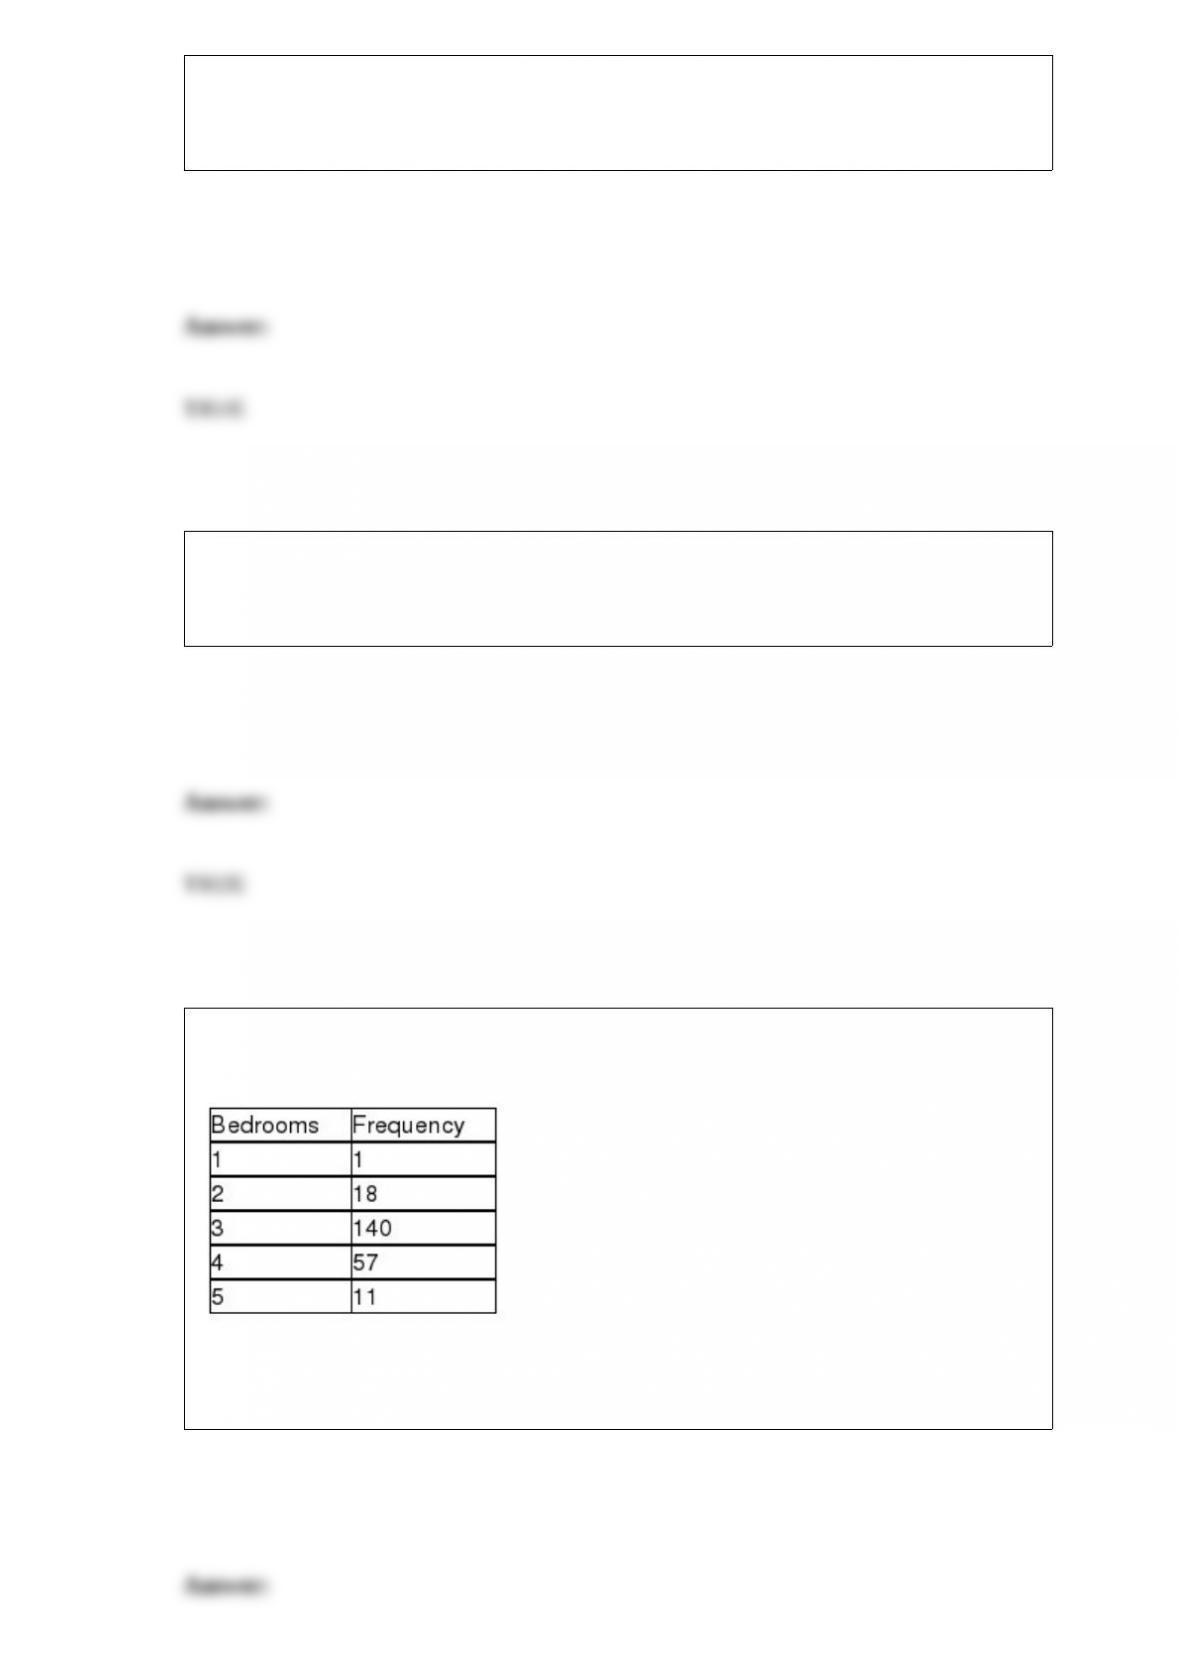
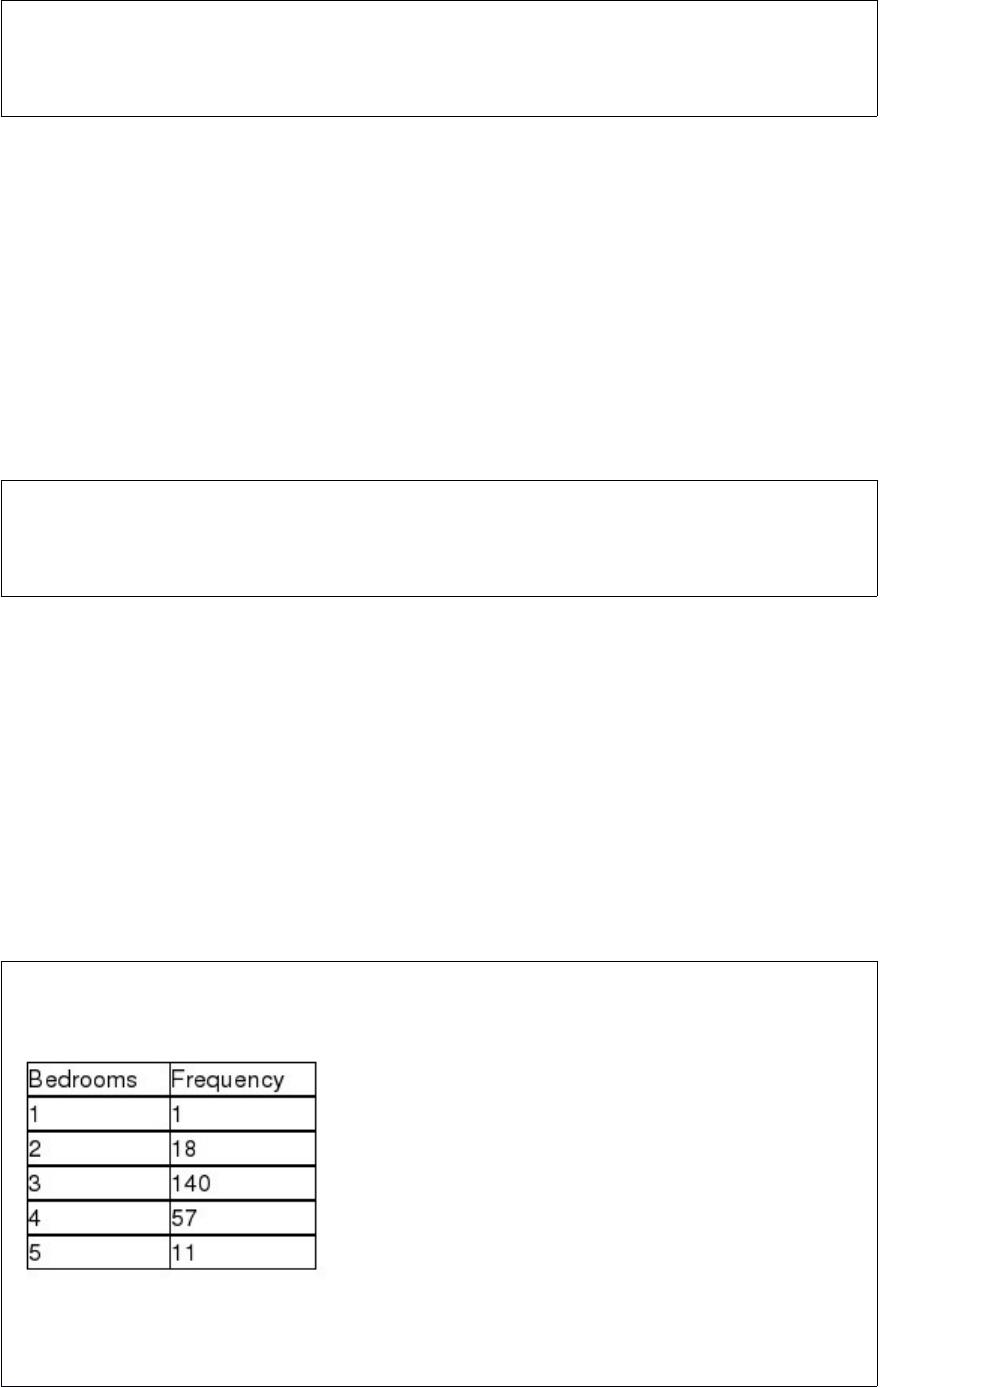
Suppose a study of houses that have sold recently in your community showed the
following frequency distribution for the number of bedrooms:
Based on this information the mean number of bedrooms in houses that sold is
approximately 3.26.

A study at State University involved an analysis of students’ GPAs and the number of
hours that they work at jobs off-campus. An appropriate graph to display the
relationship between these two variables might be a scatter diagram.
A statement in the newspaper attributed to the leader of a local union stated that the
average hourly wage for union members in the region is $13.35. He indicated that this
number came from a survey of union members. If an estimate was developed with 95
percent confidence, we can safely conclude that this value is within 95 percent of the
true population mean hourly wage.
If the mean, median and mode are all equal for a continuous random variable, then the
random variable is normally distributed.
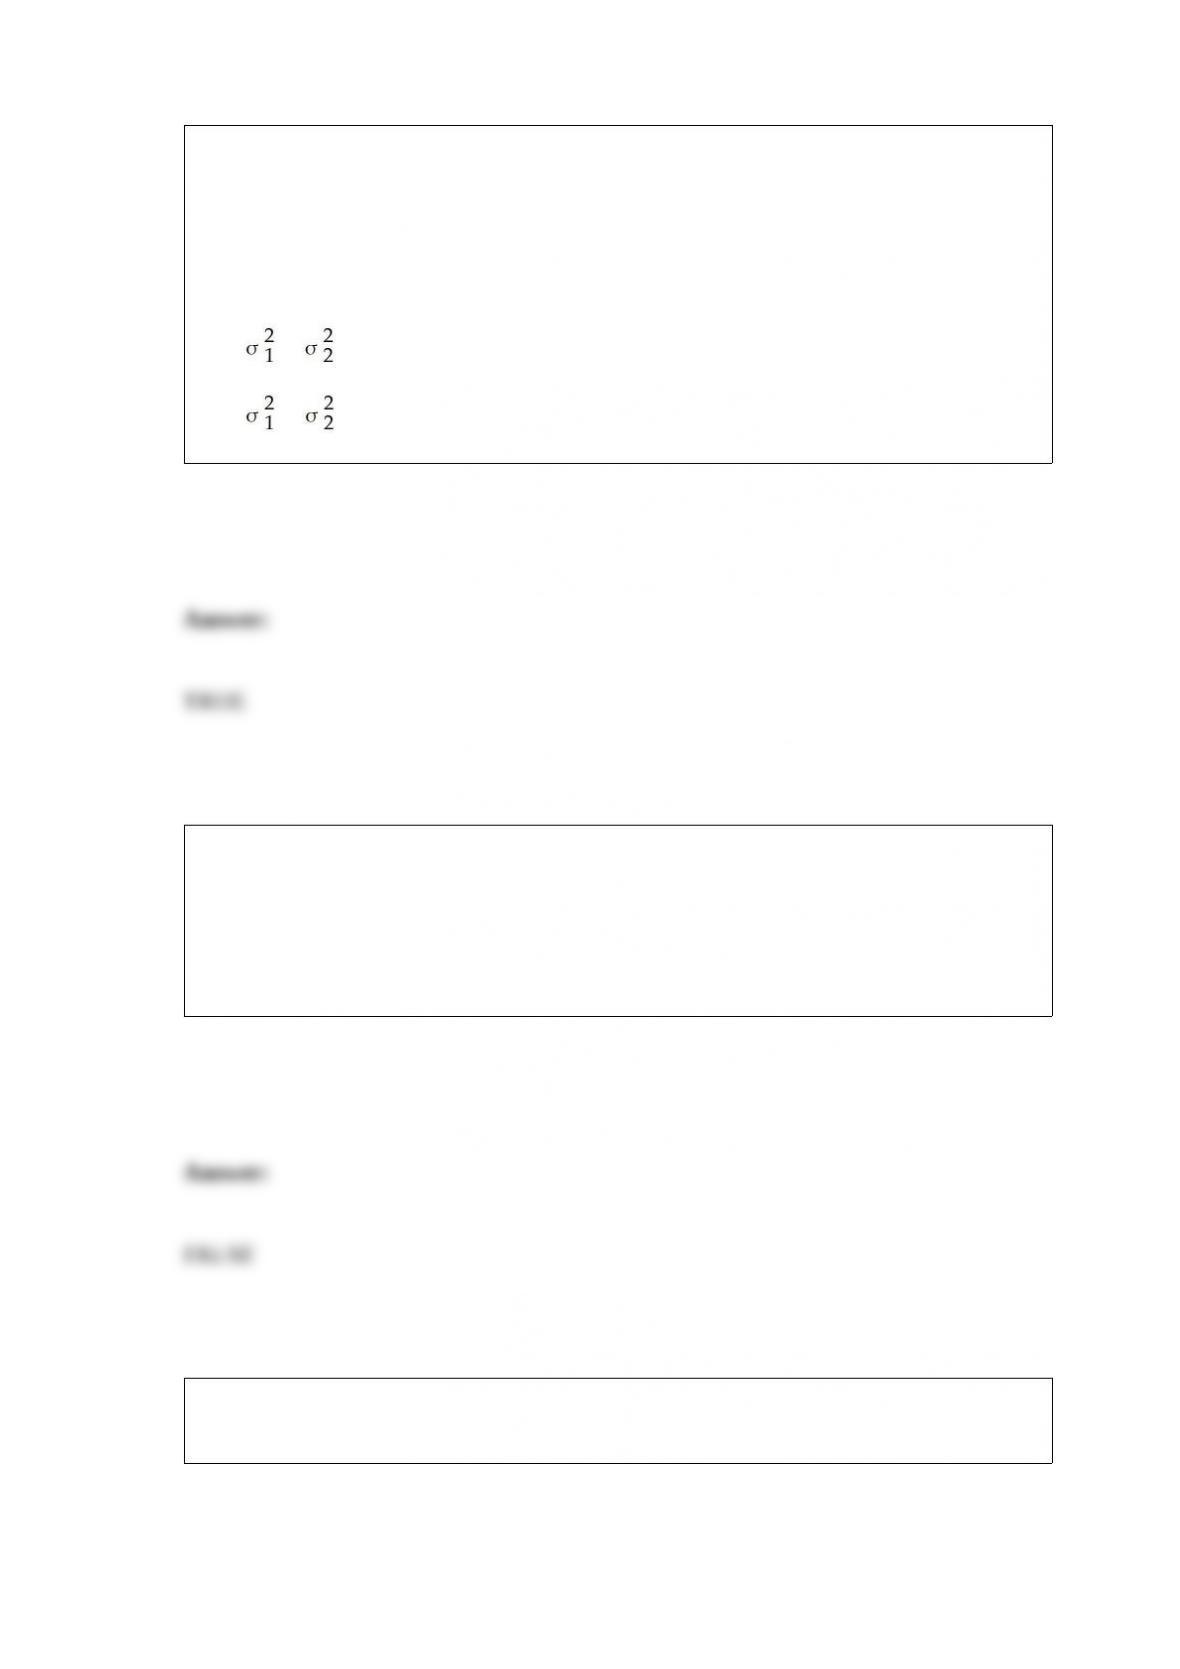
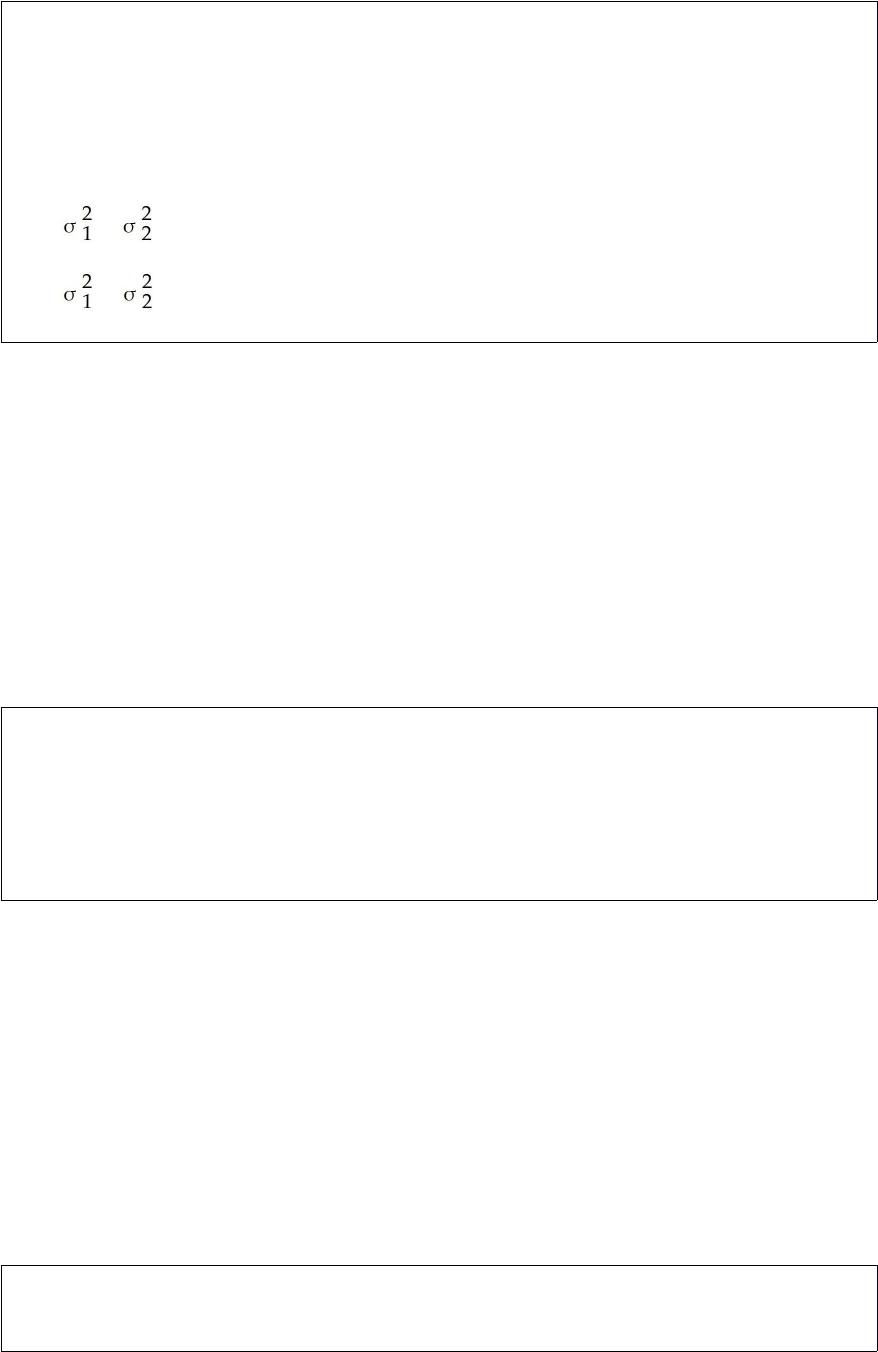
A frozen food company that makes burritos currently has employees making burritos by
hand. It is considering purchasing equipment to automate the process and wants to
determine if the automated process would result in lower variability of burrito weights.
To conduct a hypothesis test using a 0.05 level of significance, the proper format for the
null and alternative hypotheses is (where the current by-hand process is process 1 and
the automated process is process 2).
H0 : ≤
Ha : >
The police chief in a local city claims that the average speed for cars and trucks on a
stretch of road near a school is at least 45 mph. If this claim is to be tested, the null and
alternative hypotheses are:
H0: μ < 45 mph
Ha : μ ≥ 45 mph
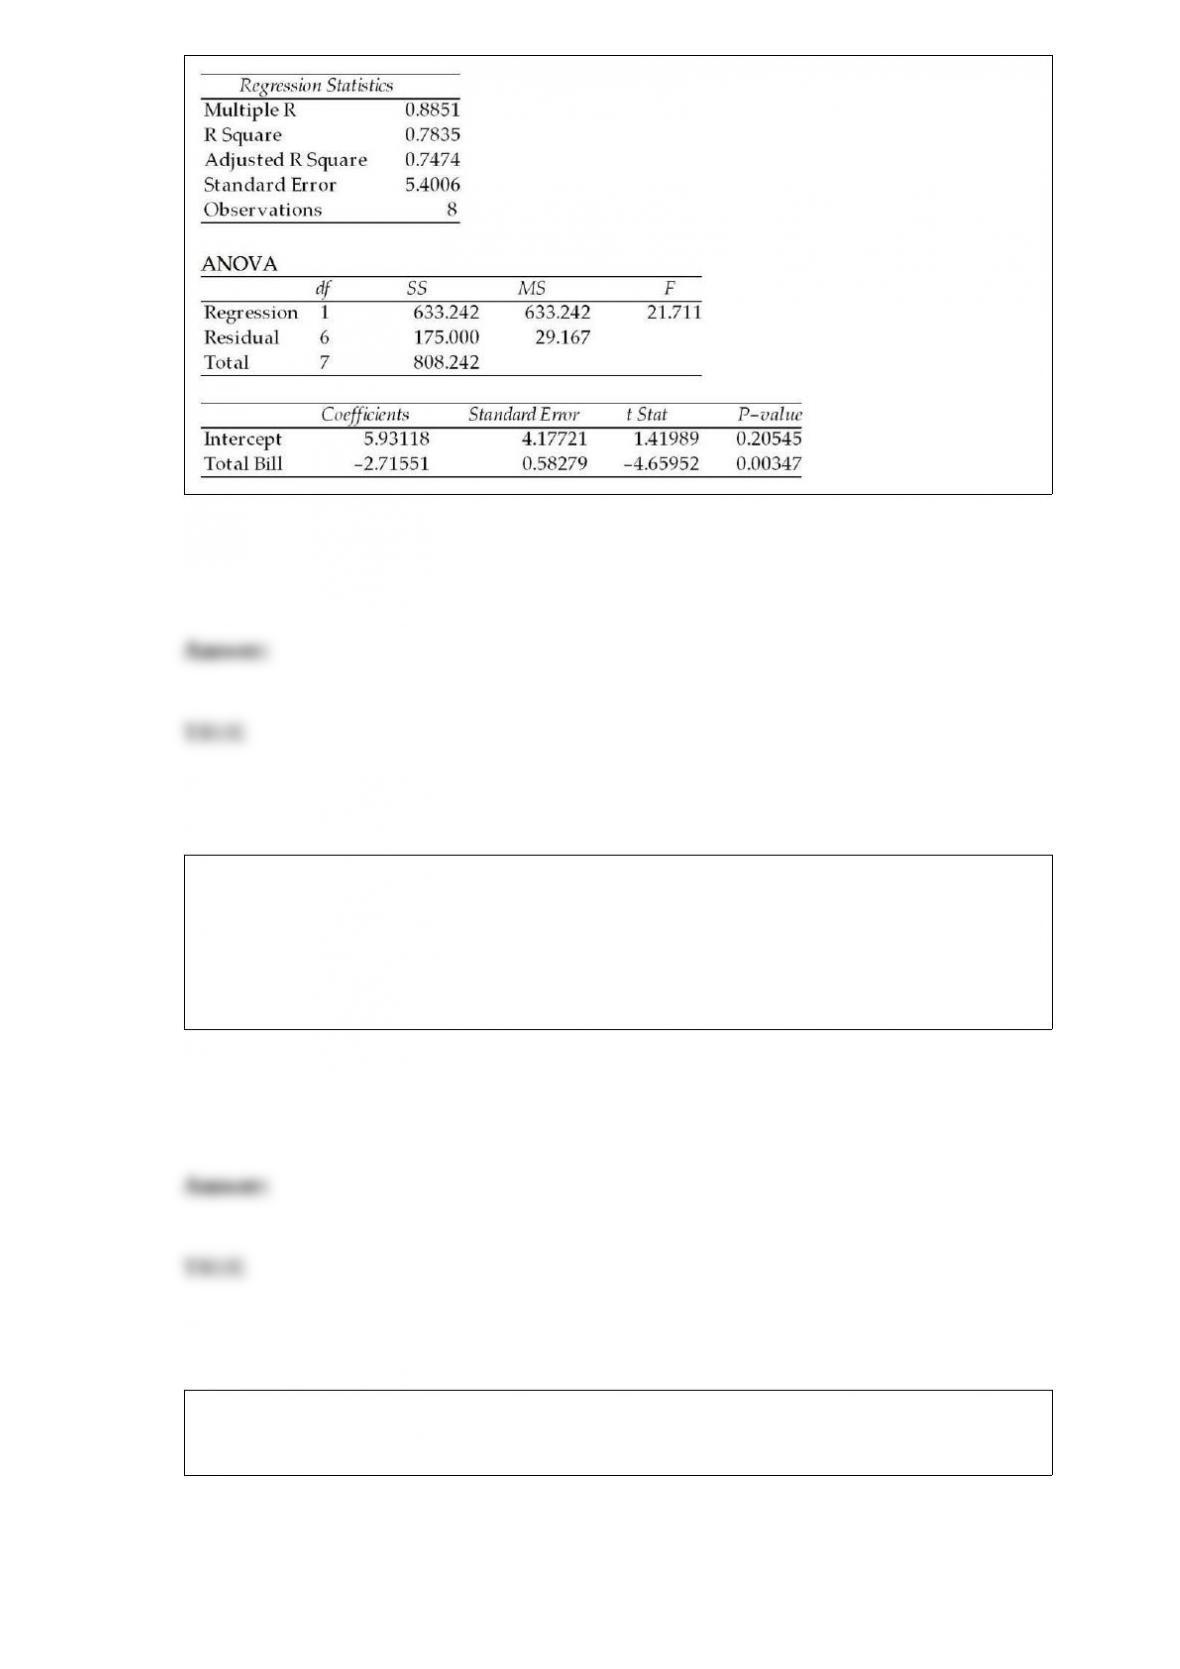
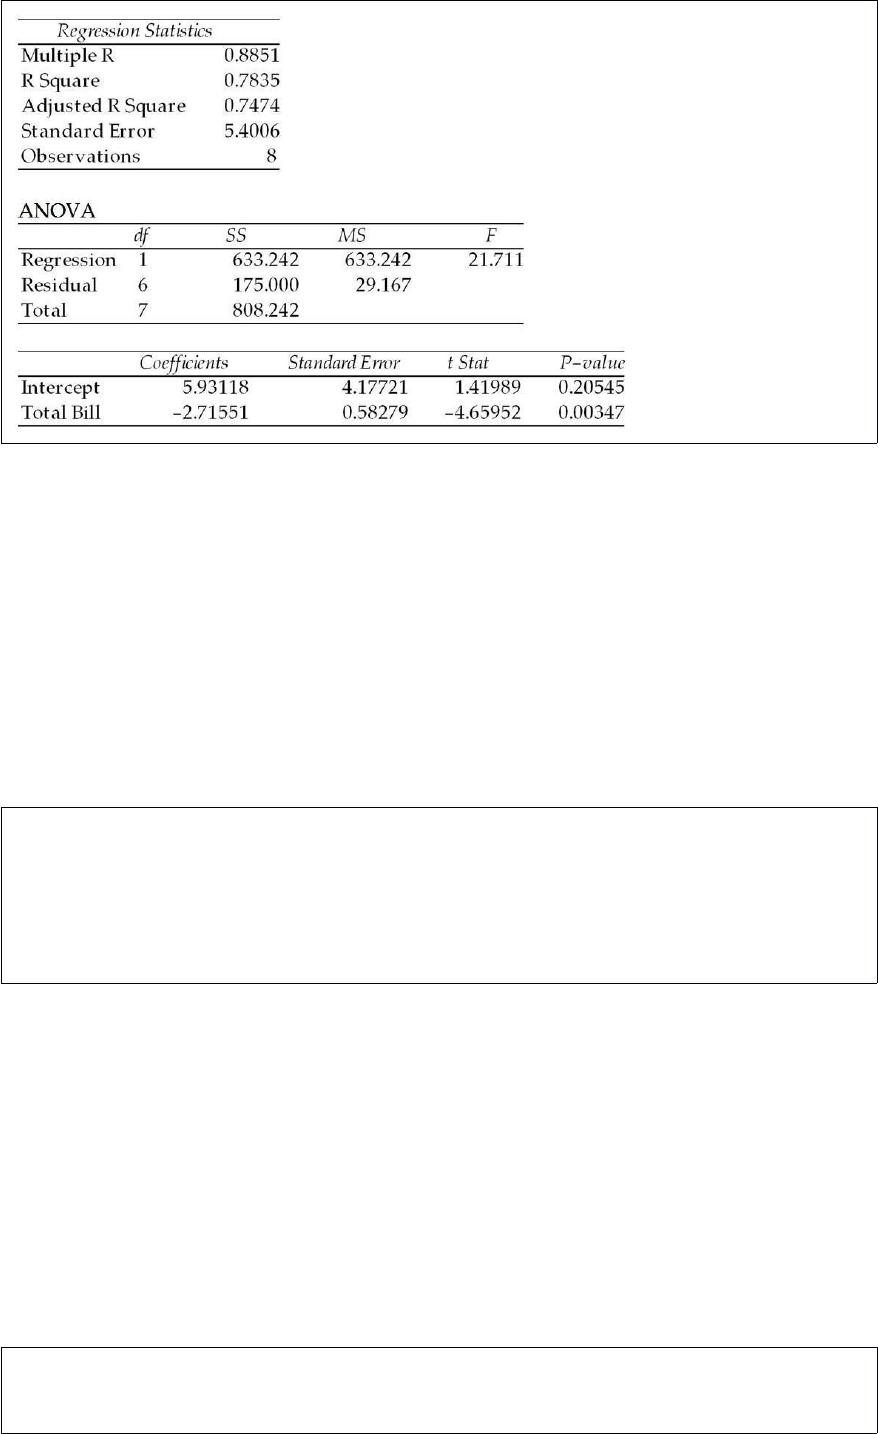
Given the following regression equation, the predicted value for y when x = 0.5 is about
4.57
A study recently conducted by a marketing firm analyzed three different advertising
designs and four different income levels of potential customers. At each combination of
factor A and factor B, 5 customers are observed and the number of products produced
are recorded. The total number of degrees of freedom associated with this two-factor
ANOVA design is 59.
Special cause variation is variation in the output of a process that is naturally occurring
and expected and that may be the result of random causes.
In a multiple regression model, R-square can be computed by squaring the highest
correlation coefficient between the dependent variable and any independent variable.
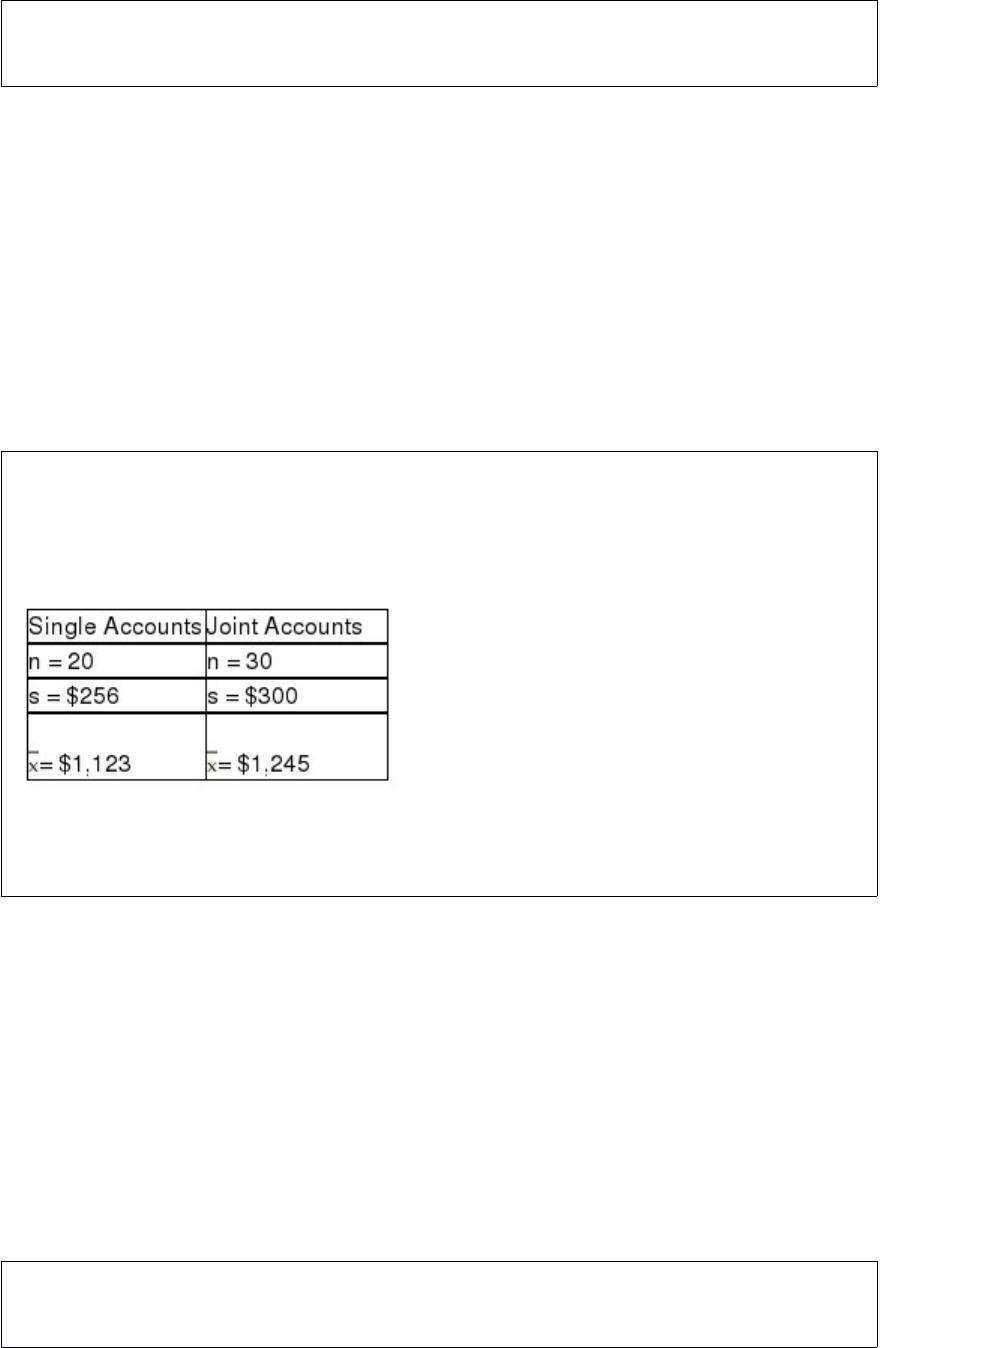
There is interest at the American Savings and Loan as to whether there is a difference
between average daily balances in checking accounts that are joint accounts (two or
more members per account) versus single accounts (one member per account). To test
this, a random sample of checking accounts was selected with the following results:
Based upon these data, the critical value from the t-distribution for testing the difference
between the two population means using a significance level of 0.05 is t = 1.6772.
If the sample data lead us to suspect that the variances of the two populations are not
equal, the t-test statistic and the degrees of freedom must be adjusted accordingly.


By combining cells we guard against having an inflated test statistic that could have led
us to incorrectly reject the H0.
The t-distribution can be used to test hypotheses about the difference between two
population means given the following two assumptions:
– each population is normally distributed, and
– the two populations have equal variances.
A bank manager wishes to estimate the mean waiting time spent by customers at his
bank. He knows from previous experience that the standard deviation is about 4.0
minutes. If he desires a 90 percent confidence interval estimate and wishes to have a
margin of error of 1 minute, the required sample size will be approximately 143.

The makers of weight loss product are interested in estimating the mean weight loss for
users of their product. To do this, they have selected a random sample of n = 9 people
and have provided them with a supply of the product. After six months, the nine people
had an average weight loss of 15.3 pounds with a standard deviation equal to 3.5
pounds. The upper limit for the 90 percent confidence interval estimate for the
population mean is approximately 17.47 pounds.
A stockbroker at a large brokerage firm recently analyzed the combined annual profits
for all firms in the airline industry. One time-series component that may have been
present in these annual data was a seasonal component.
The Wilson company monitors customer complaints and organizes these complaints
into six distinct categories. Over the past year, the company has received 534
complaints. One possible graphical method for representing these data would be a
histogram.
A chain of fast food restaurants wants to compare the average service times at three
different restaurants. It wants to conduct a hypothesis test to determine if all three
means are the same or not, at the 0.05 level of significance. If n = 7 observations are
taken at each of the three restaurants, the critical value is F = 3.555.
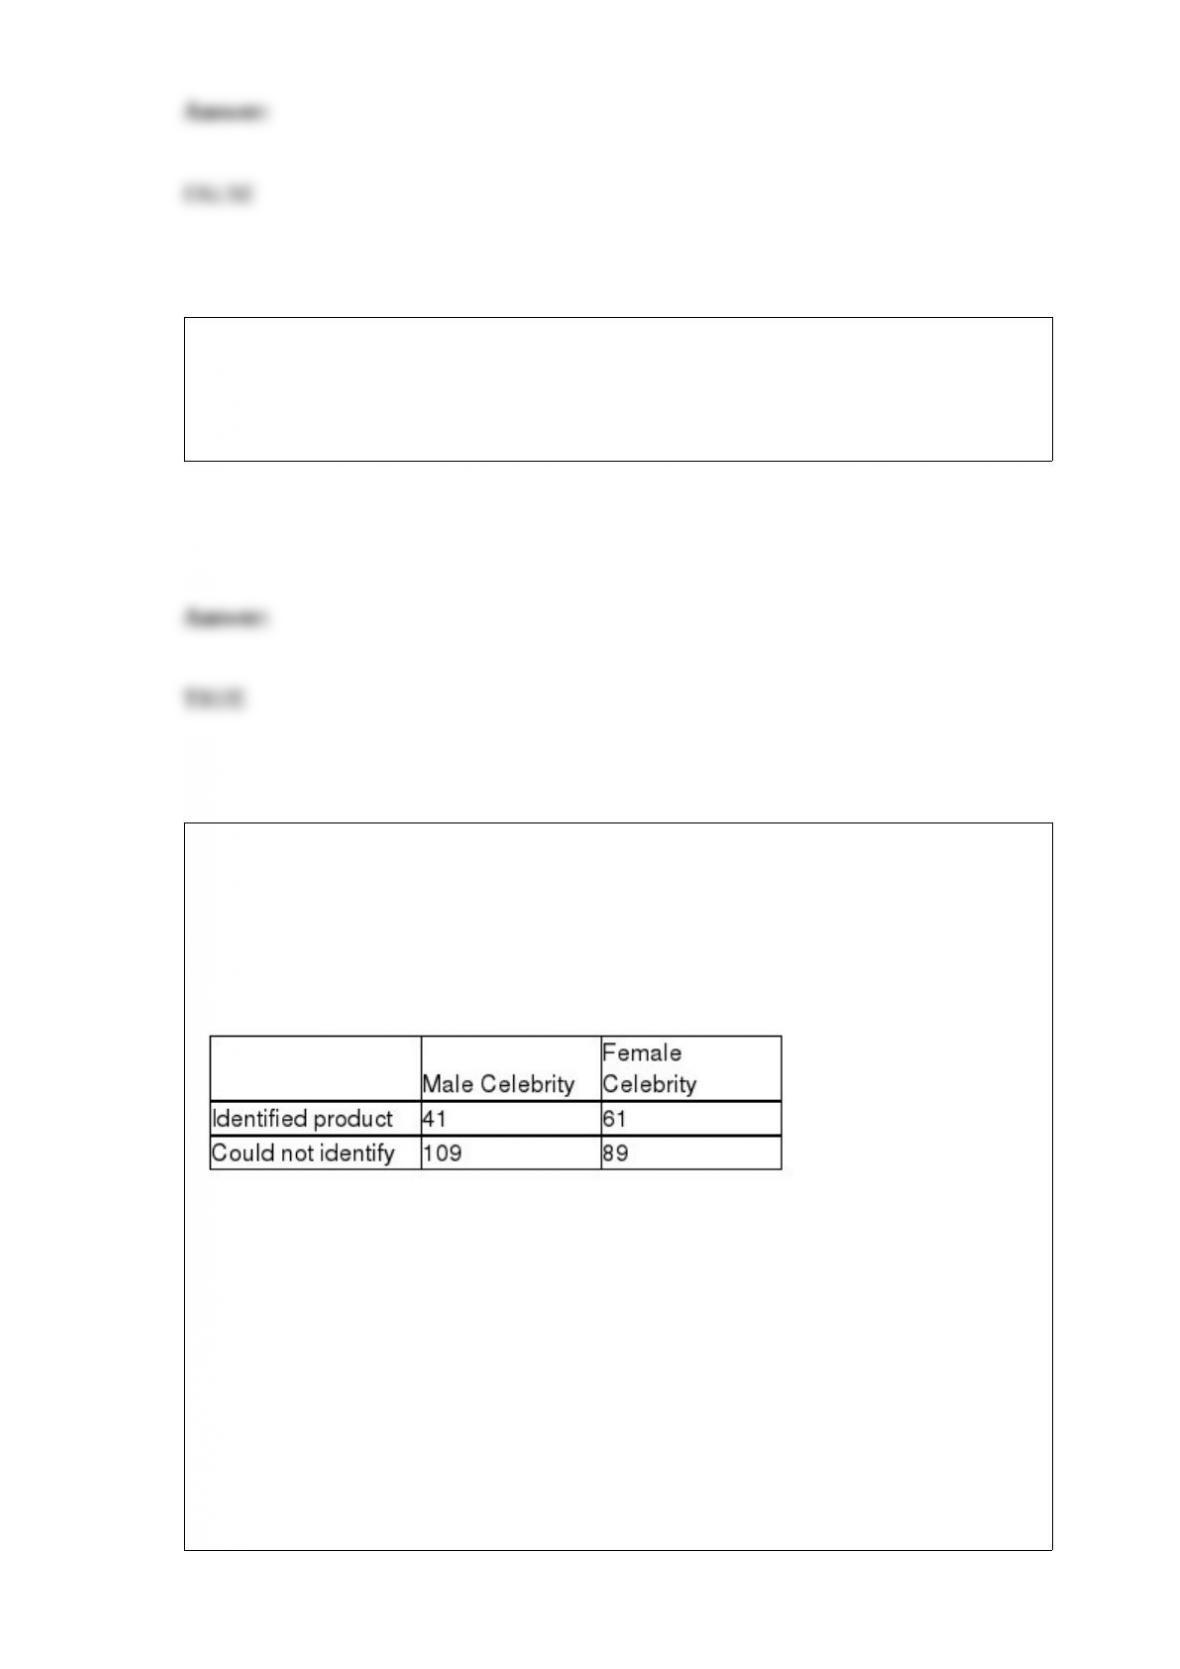
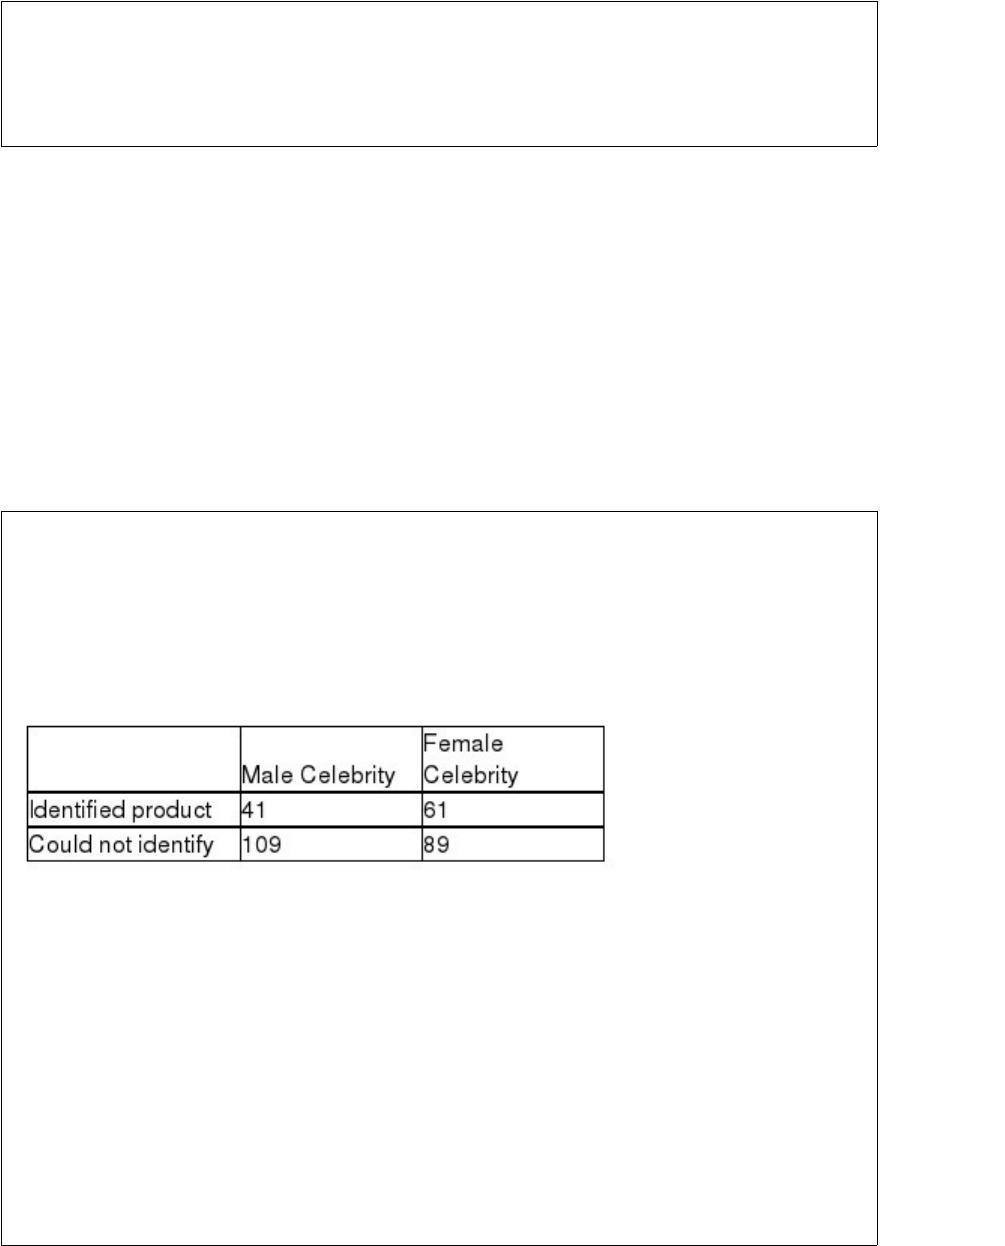
Many companies use well-known celebrities as spokespeople in their TV
advertisements. A study was conducted to determine whether brand awareness of
female TV viewers and the gender of the spokesperson are independent. Each in a
sample of 300 female TV viewers was asked to identify a product advertised by a
celebrity spokesperson. The gender of the spokesperson and whether or not the viewer
could identify the product was recorded. The numbers in each category are given below.
Referring to these sample data, if the appropriate null hypothesis is tested using a
significance level equal to .05, which of the following conclusions should be reached?
A) There is a relationship between gender of the celebrity and product identification.
B) There is no relationship between gender of the celebrity and product identification.
C) The mean number of products identified for males is different than the mean number
for females.
D) Females have higher brand awareness than males.
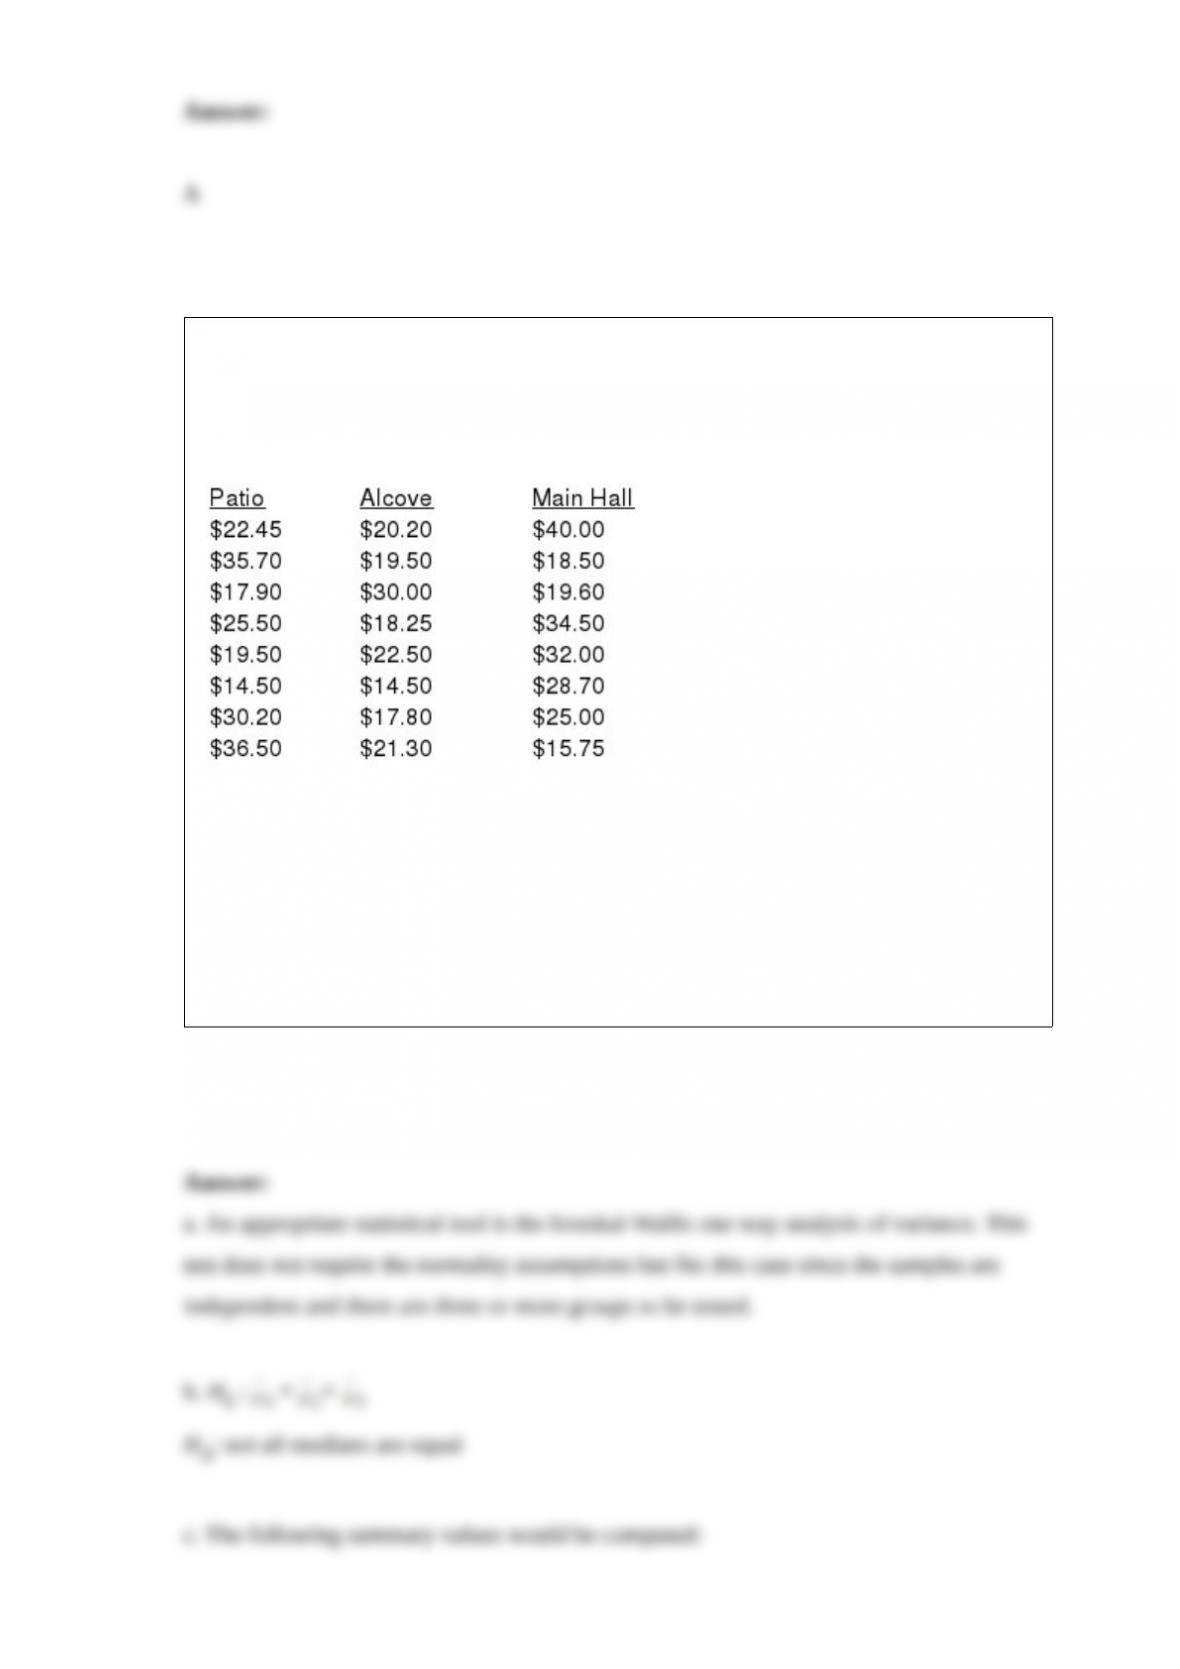
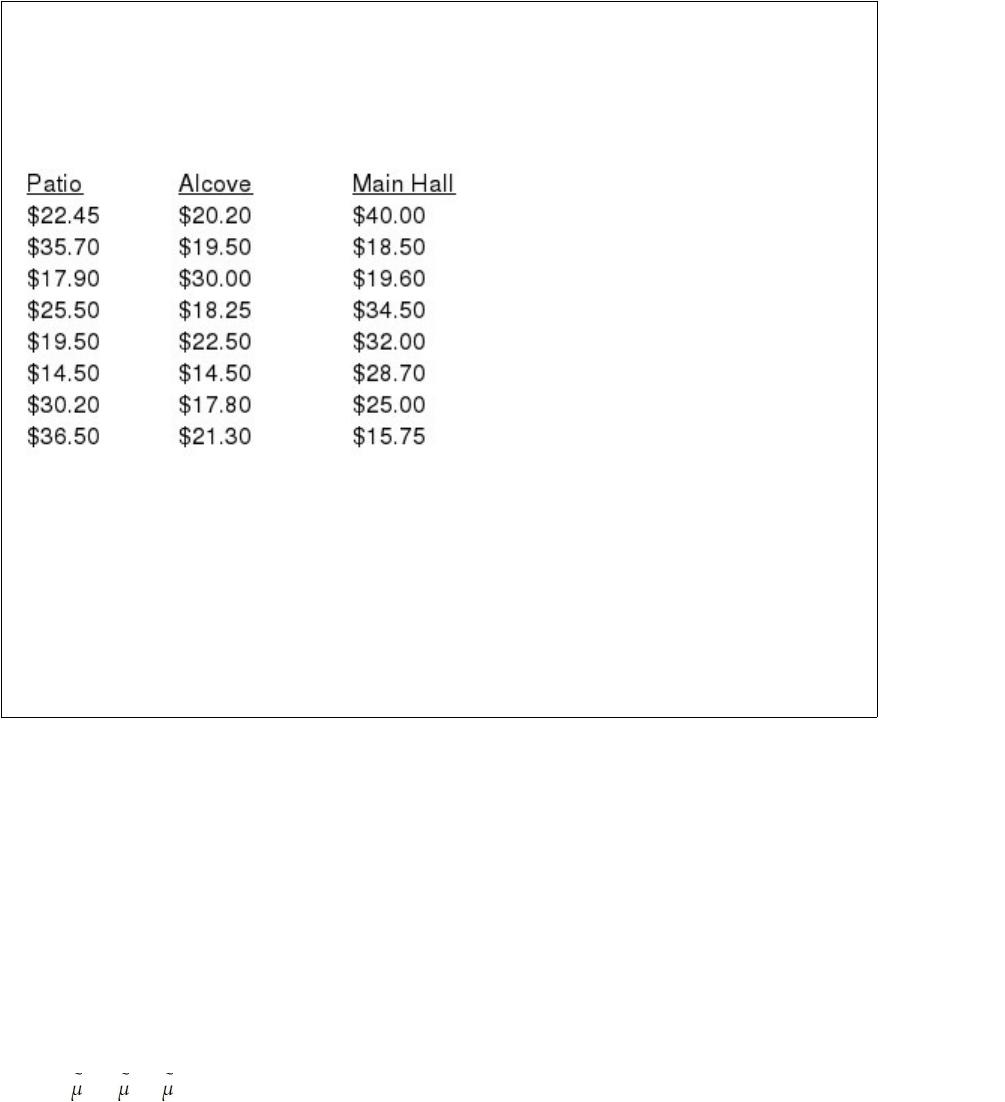
A restaurant has three separate dining areas: the patio, the alcove, and the main hall. At
question is whether the median dollar amount per customer is the same or different
between these three restaurant locations. To test this, the manager has randomly
selected samples from each location. These data are shown as follows:
a. If the manager is unwilling to make the assumption that the bill amounts are normally
distributed at all three locations, what statistical technique would you suggest to test
whether the median bill amounts are the same or different?
b. State the appropriate null and alternative hypotheses.
c. Using an alpha level equal to .05, test the null hypothesis and state your conclusion.
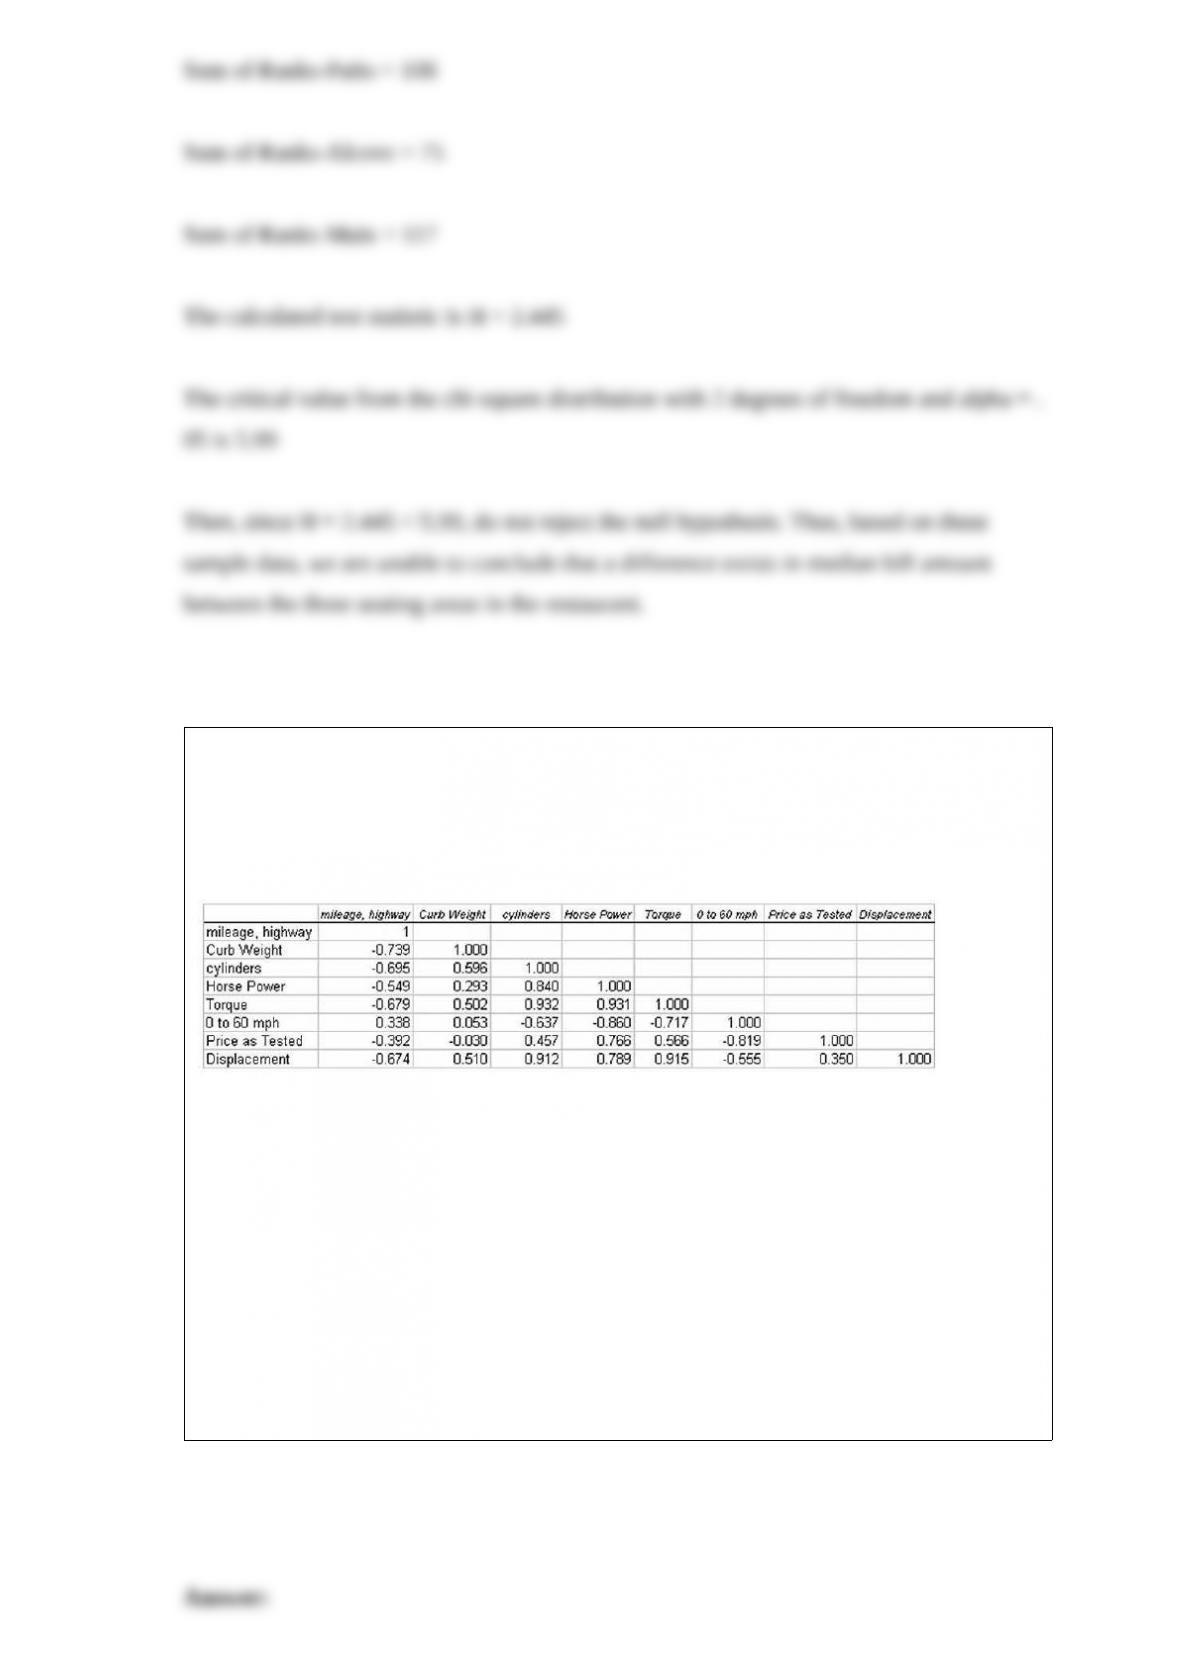
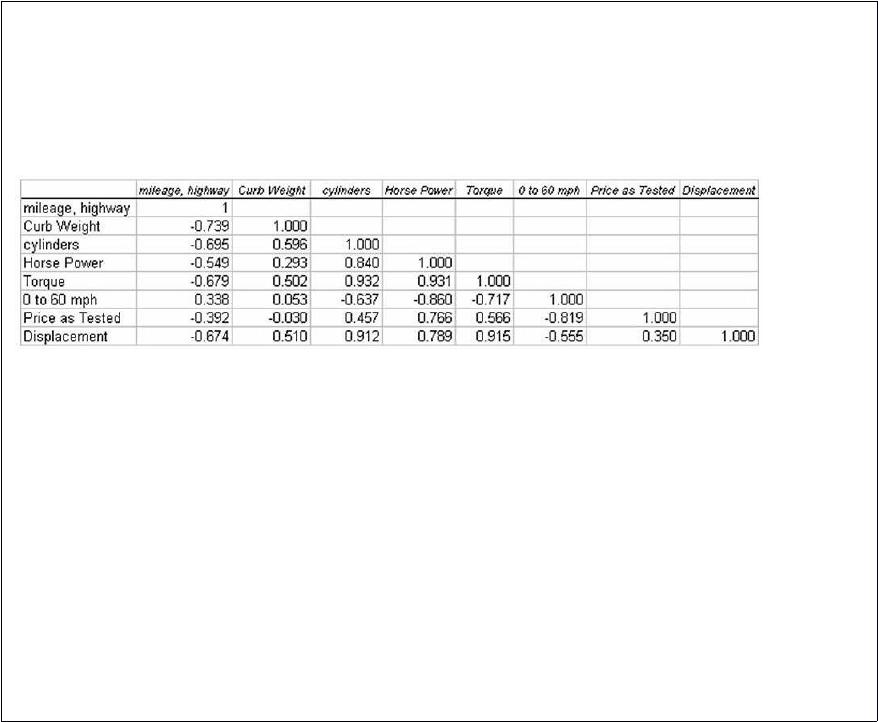
The editors of a national automotive magazine recently studied 30 different automobiles
sold in the United States with the intent of seeing whether they could develop a multiple
regression model to explain the variation in highway mileage per gallon. A number of
different independent variables were collected. The following correlation matrix was
developed:
If only one variable were to be brought into the model, which variable should it be if
the goal is to explain the highest possible percentage of variation in the dependent
variable?
A) 0 to 60 mph
B) Horsepower
C) Curb weight
D) Displacement
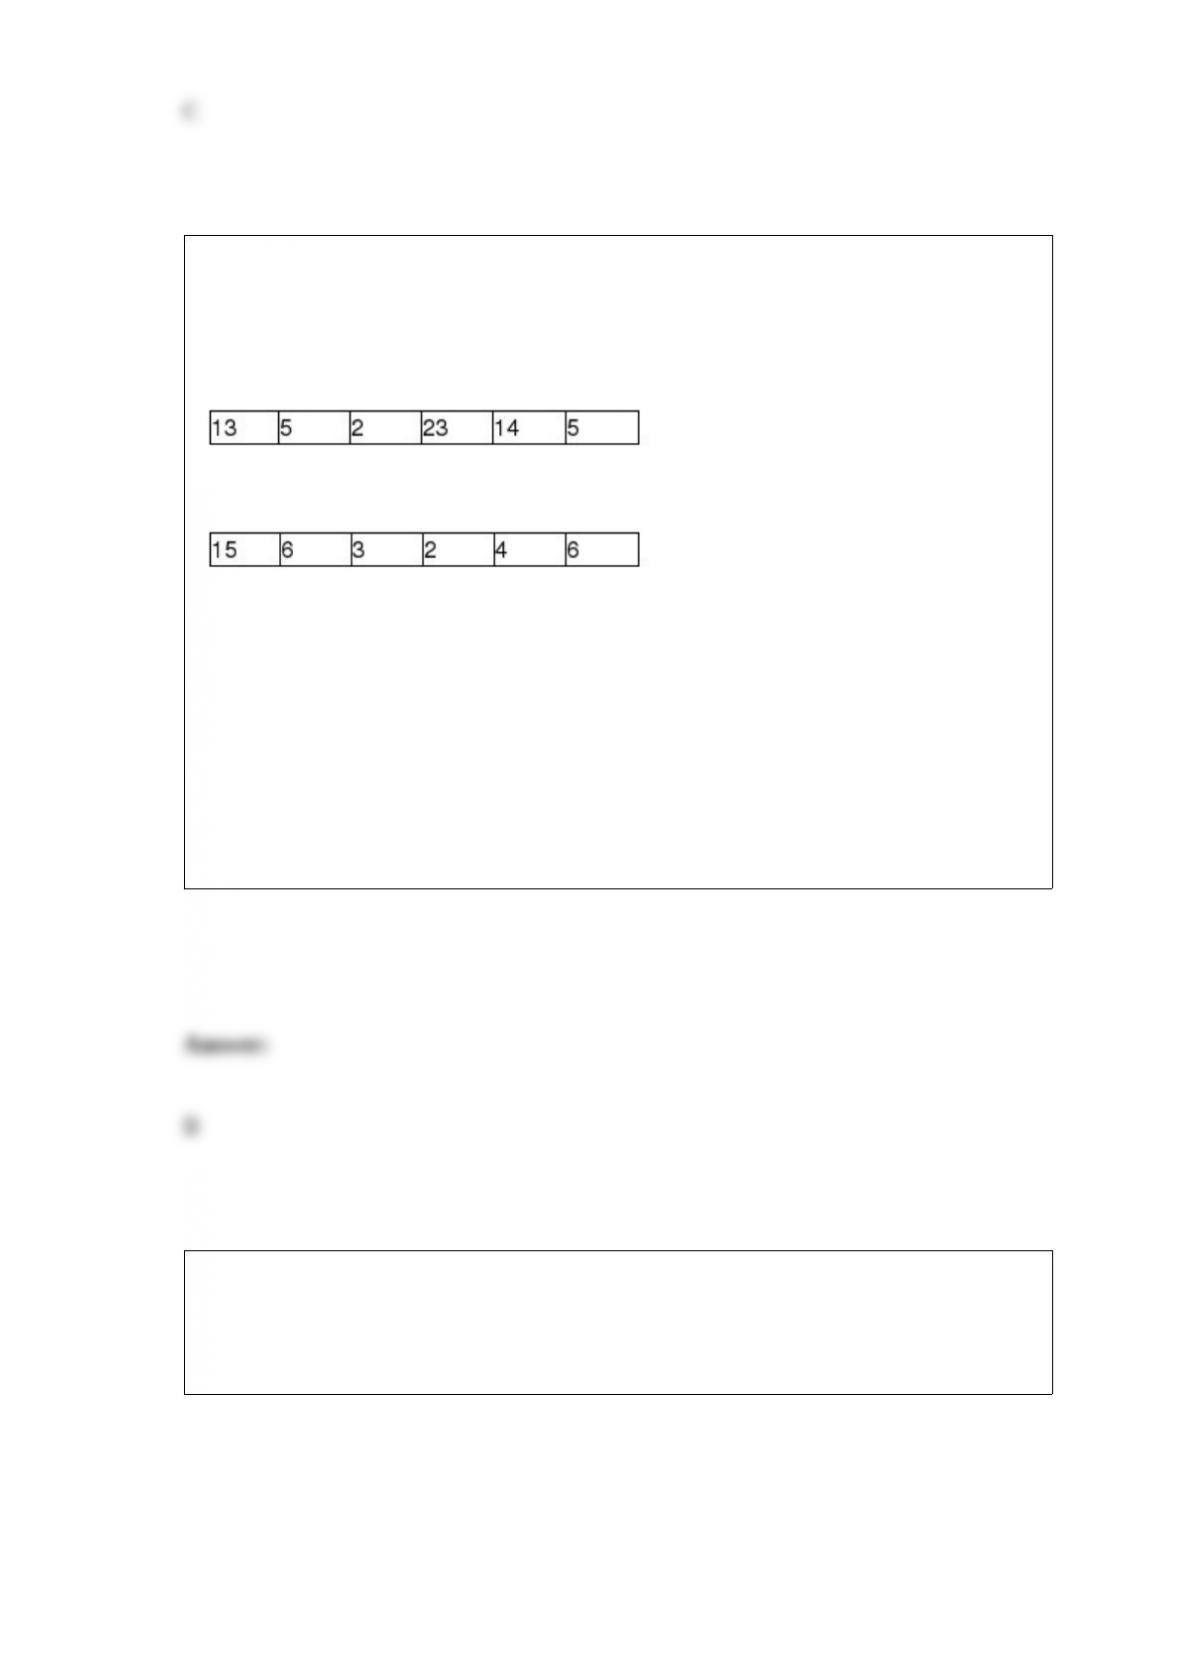
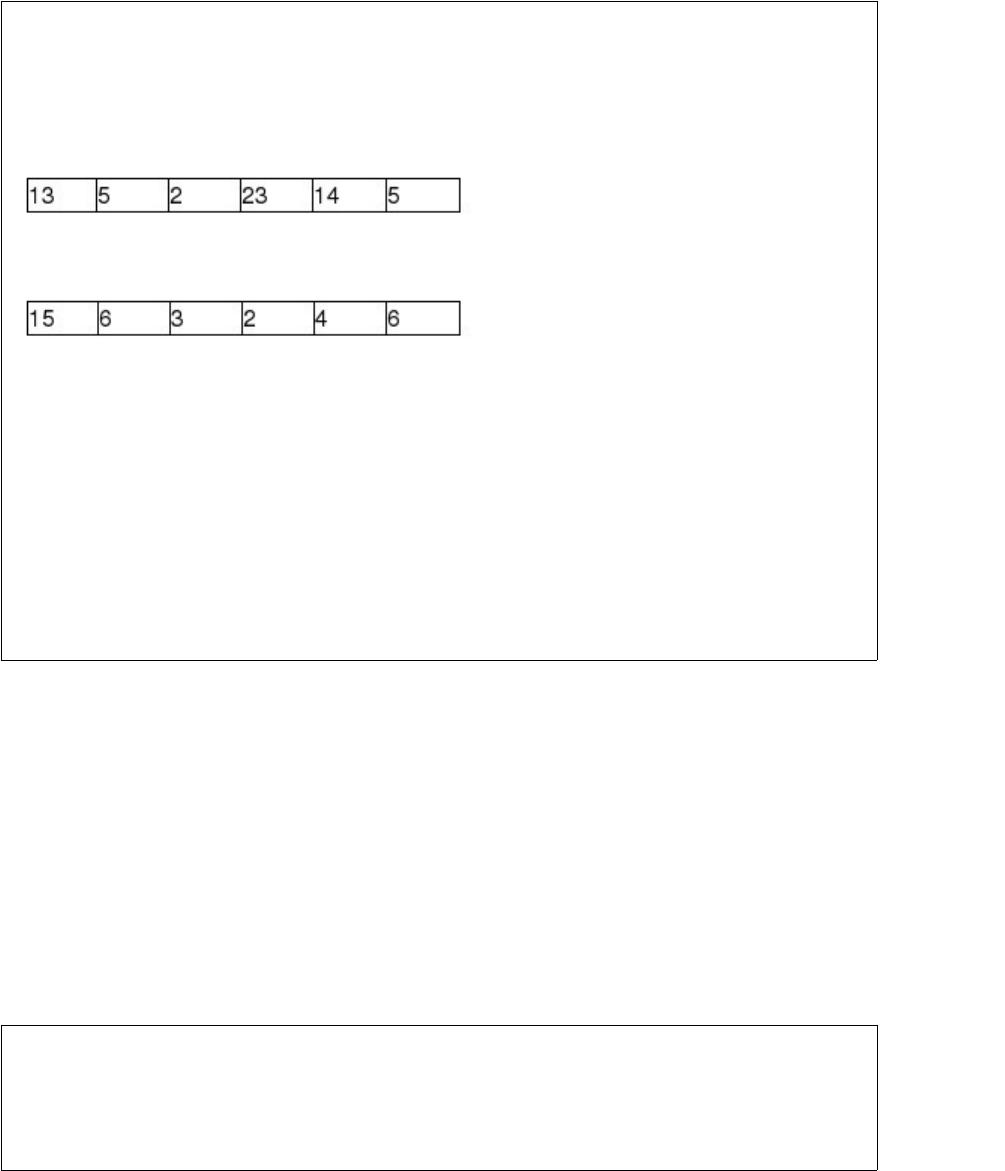
Consider the following data, which represent the number of miles that employees
commute from home to work each day. There are two samples: one for males and one
for females.
Males:
Females:
Which of the following statements is true?
A) Females have the larger mean.
B) The coefficient of variation is larger for females than for males.
C) The coefficient of variation is larger for males than for females.
D) Females have the larger range.
A national job placement company is interested in developing a model that might be
used to explain the variation in starting salaries for college graduates based on the
college GPA. The following data were collected through a random sample of the clients
with which this company has been associated.
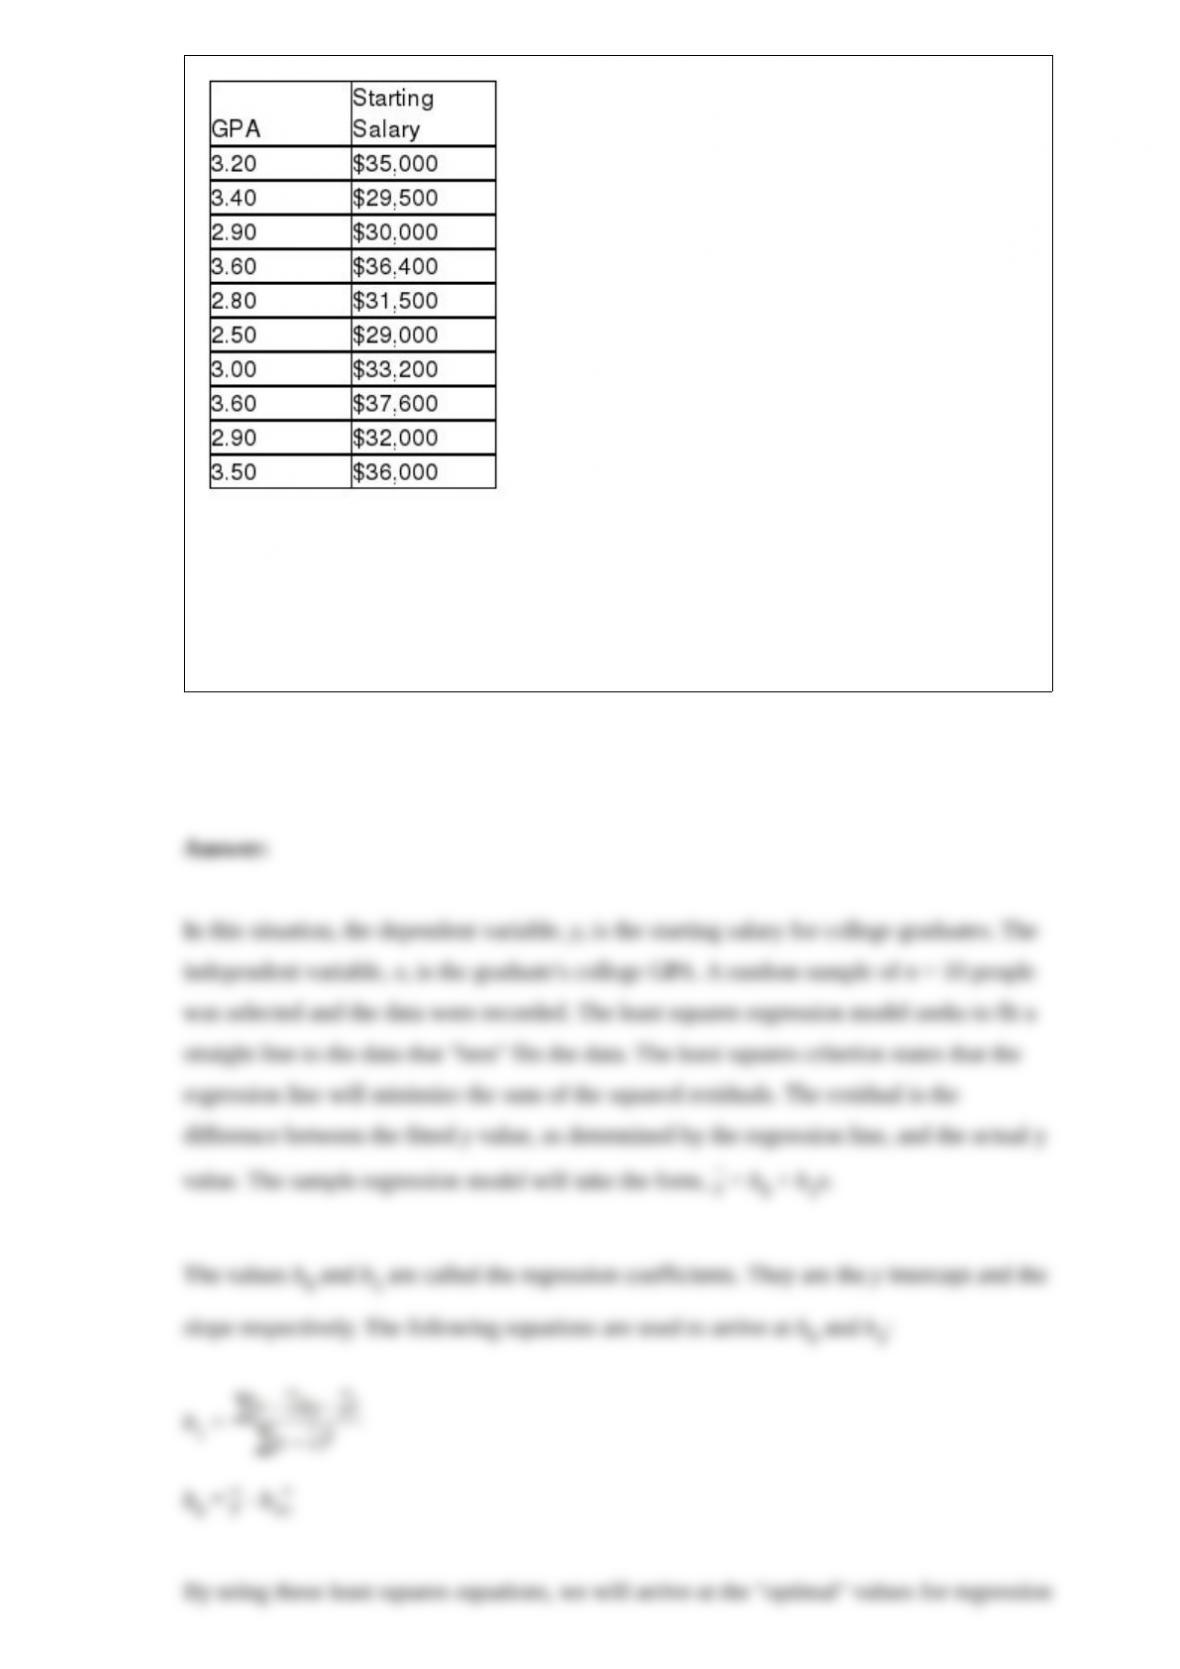
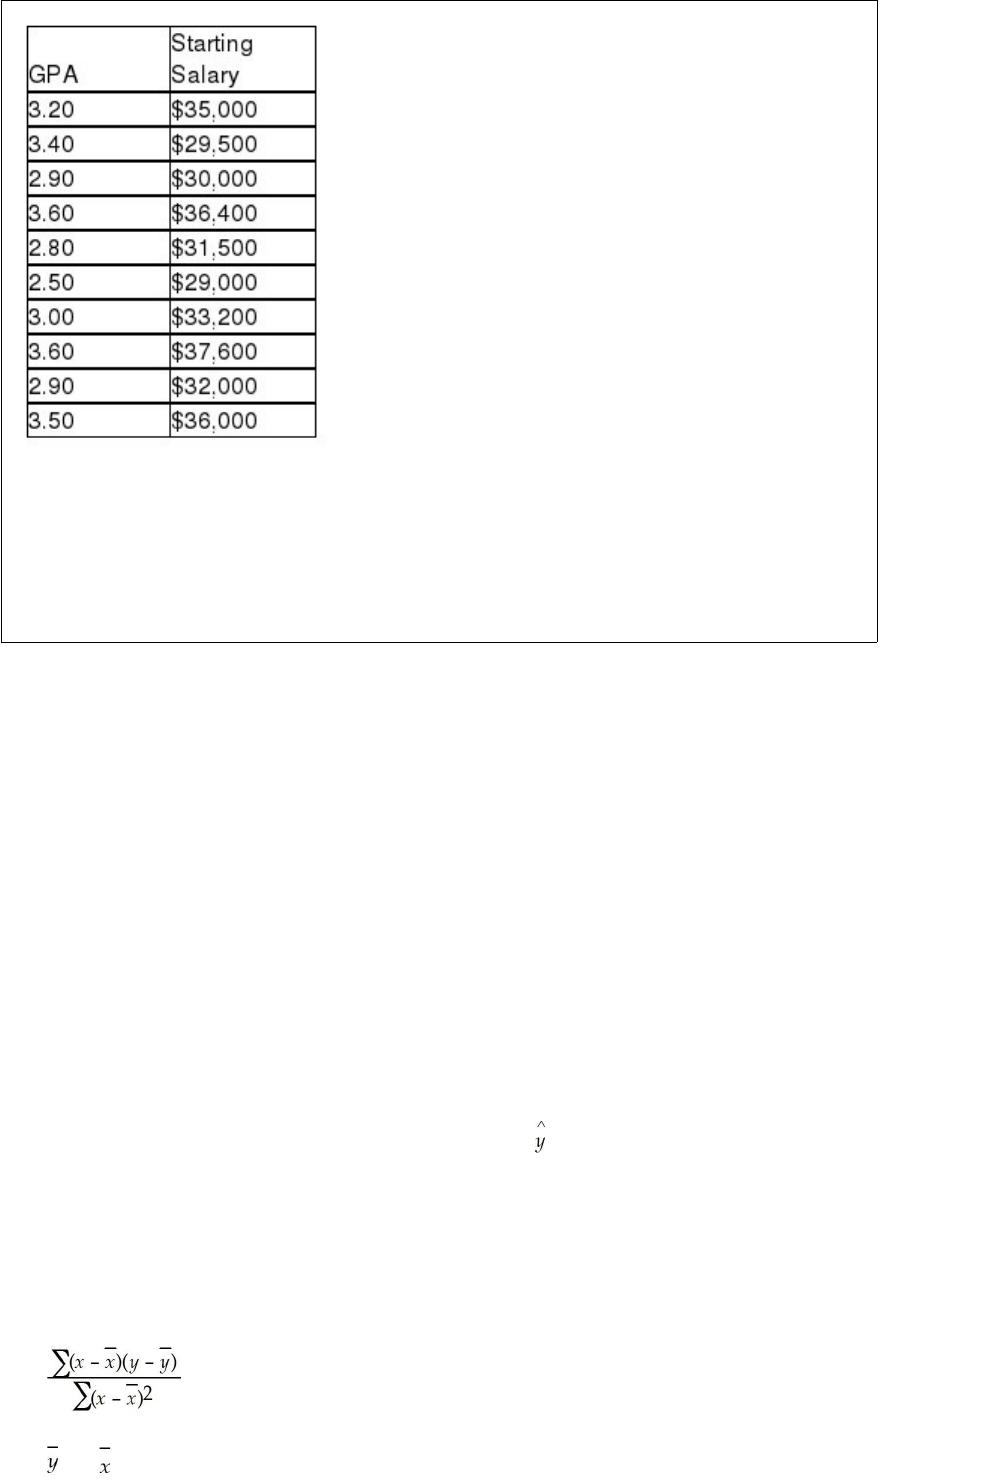
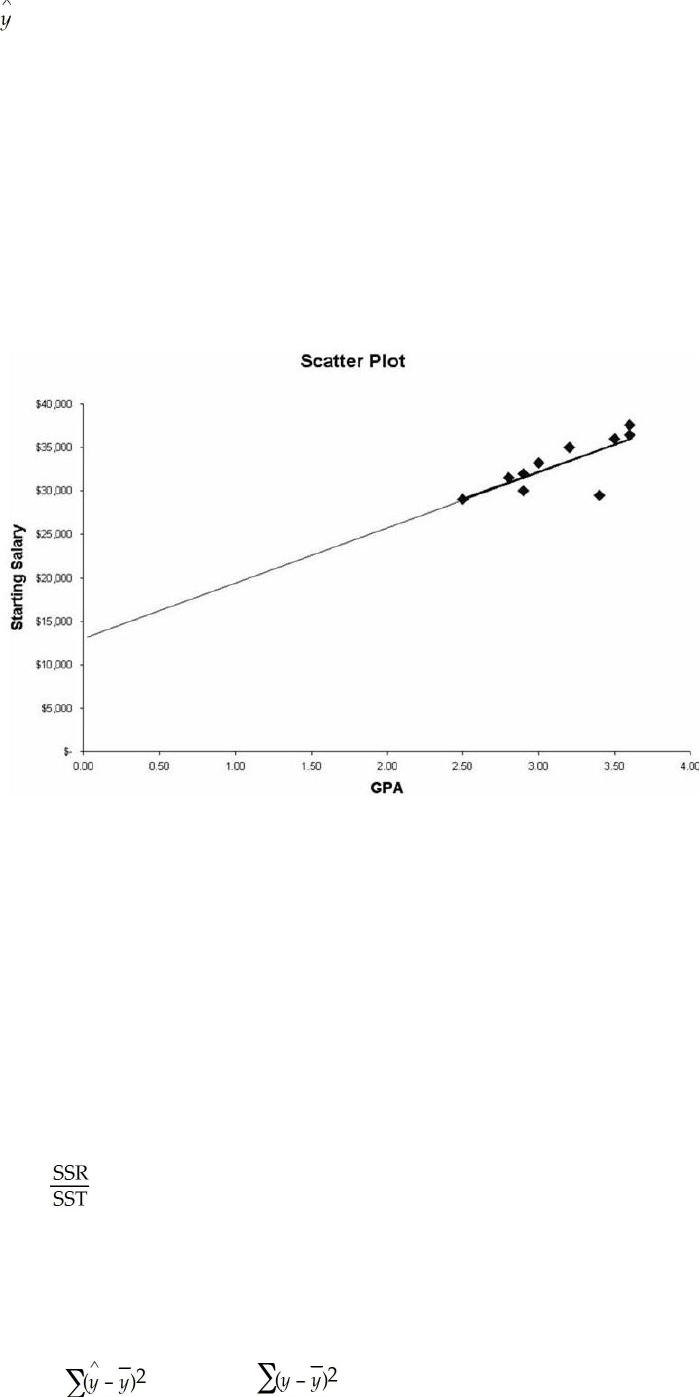
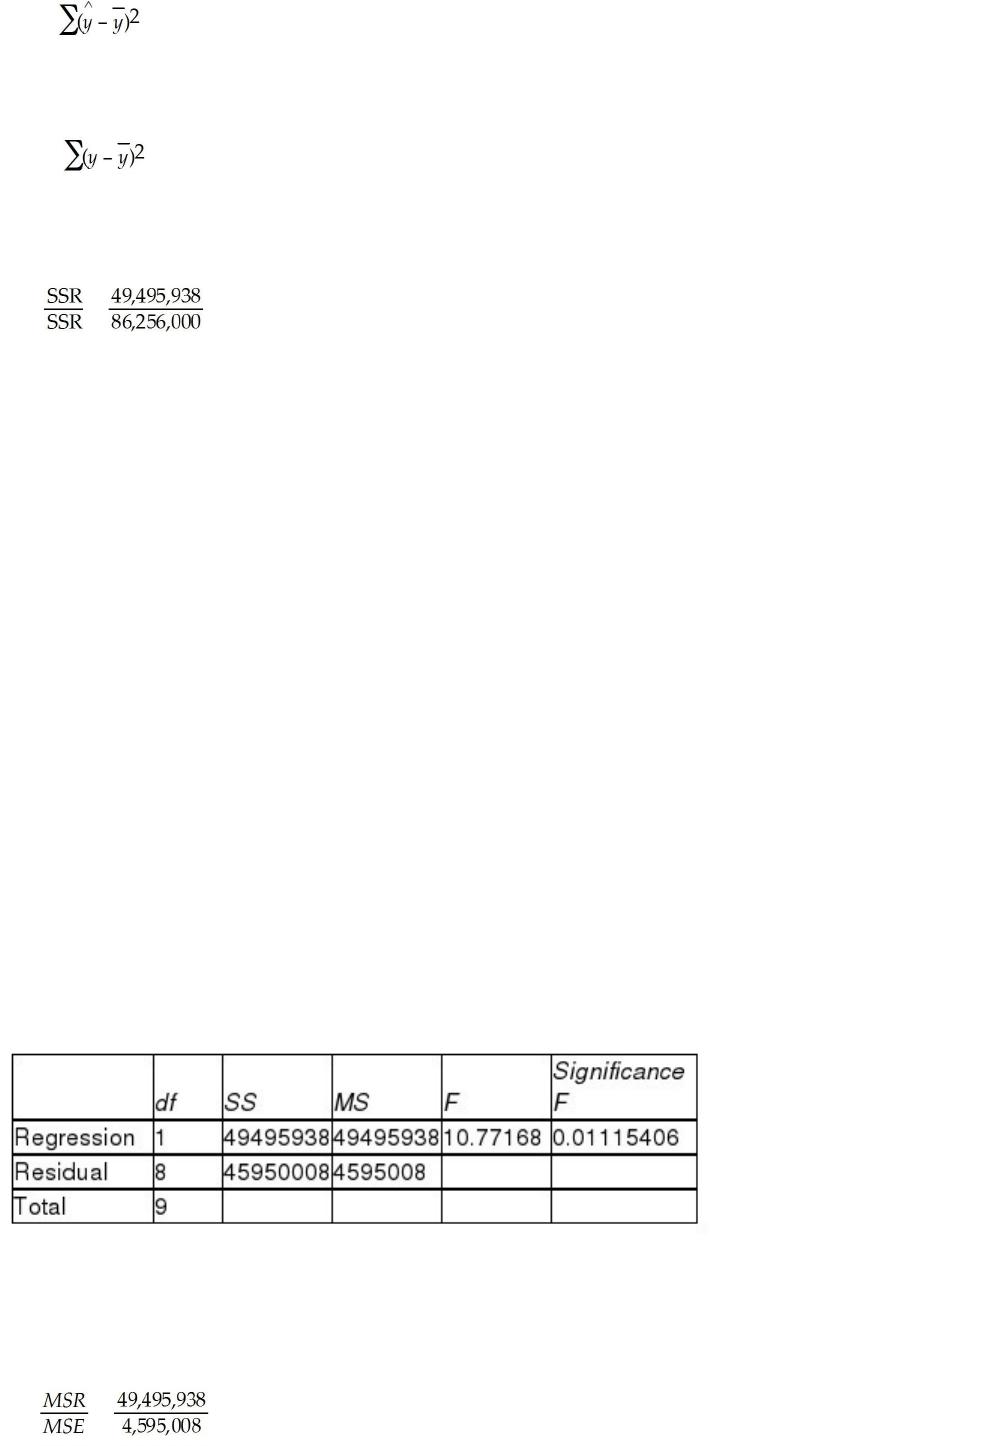
Based on this sample information, determine the least squares regression model,
determine what percent of the variation in starting salaries is explained by GPA, and
test to determine whether the regression model is statistically significant at the 0.05
level of significance. Also, develop a scatter plot of the data and locate the regression
line on the scatter plot.

Second-order polynomial models:
A) always curve upward.
B) always curve downward.
C) can curve upward or downward depending on the data.
D) measure interaction between variables.
Which one of the following is NOT statistical sampling?
A) Simple random sample
B) Stratified random sampling
C) Cluster sampling
D) Convenience sampling
The box and whisker plot CANNOT be used to identify:
A) skewedness.
B) centerness.
C) outliers.
D) symmetry.
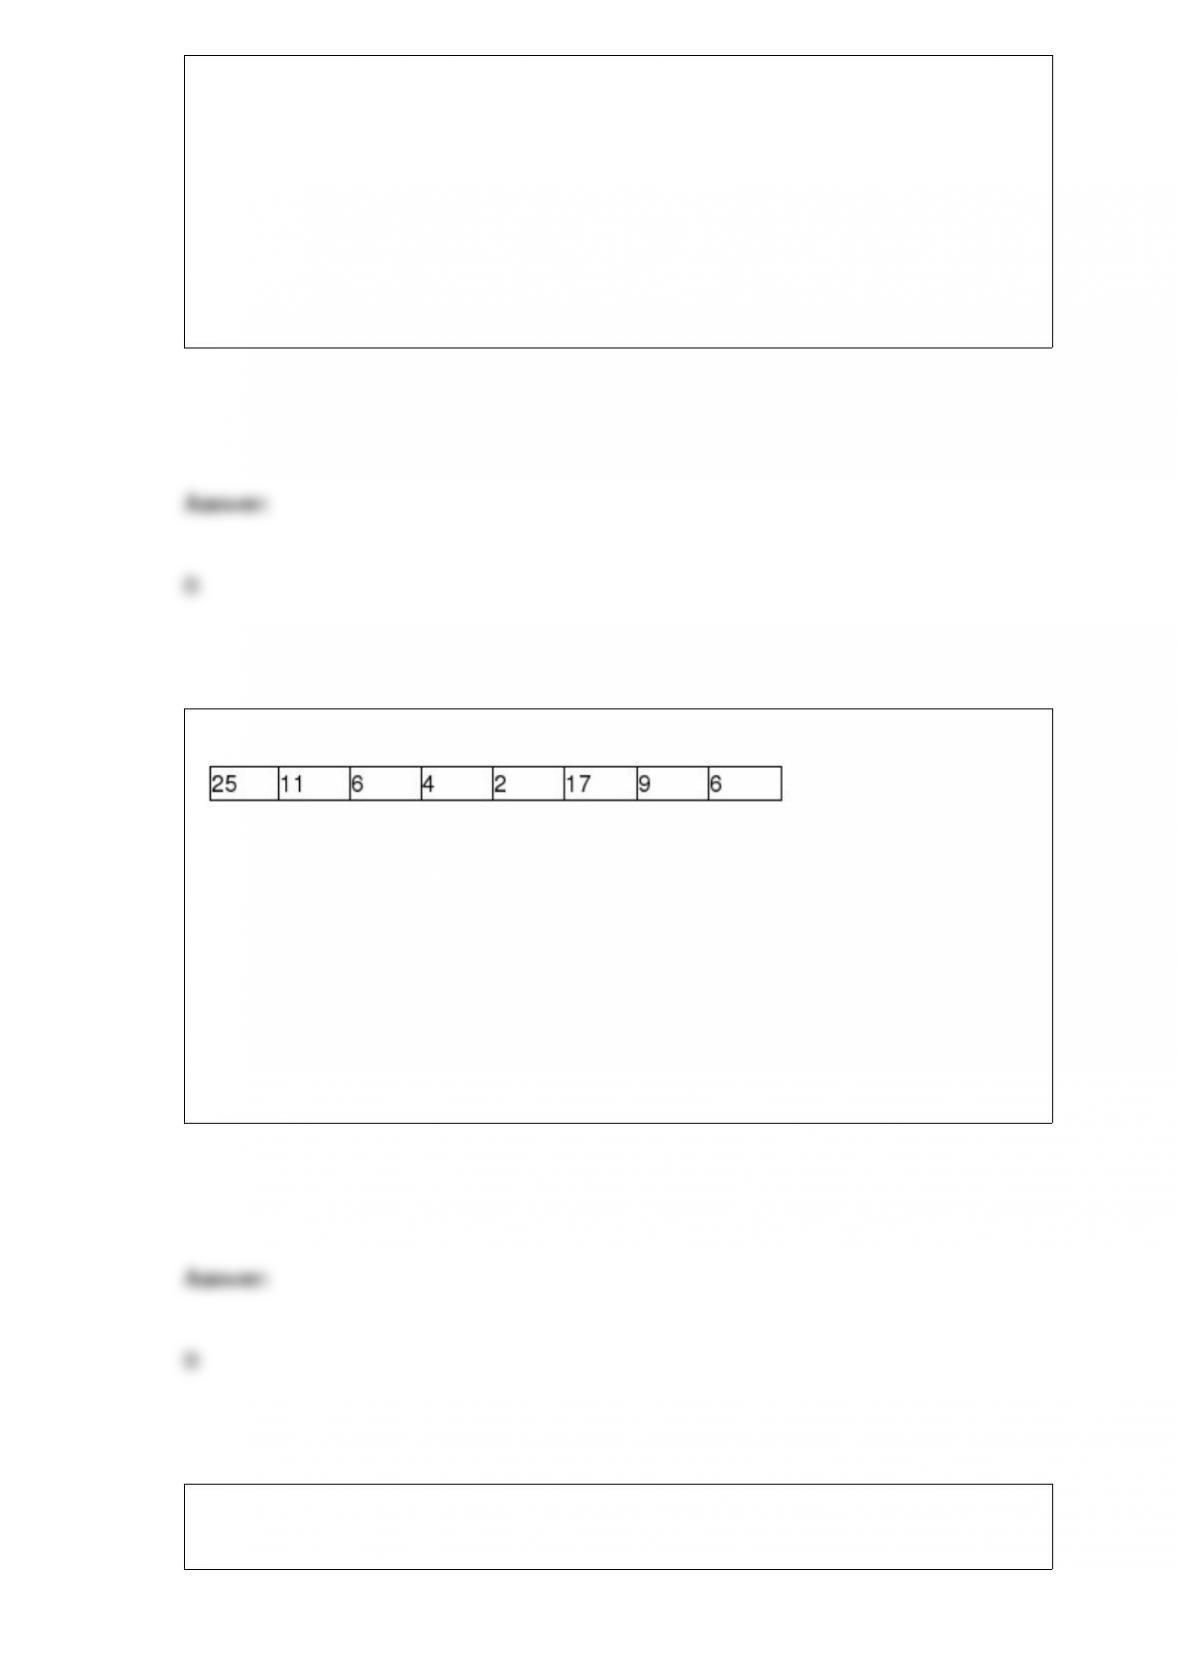
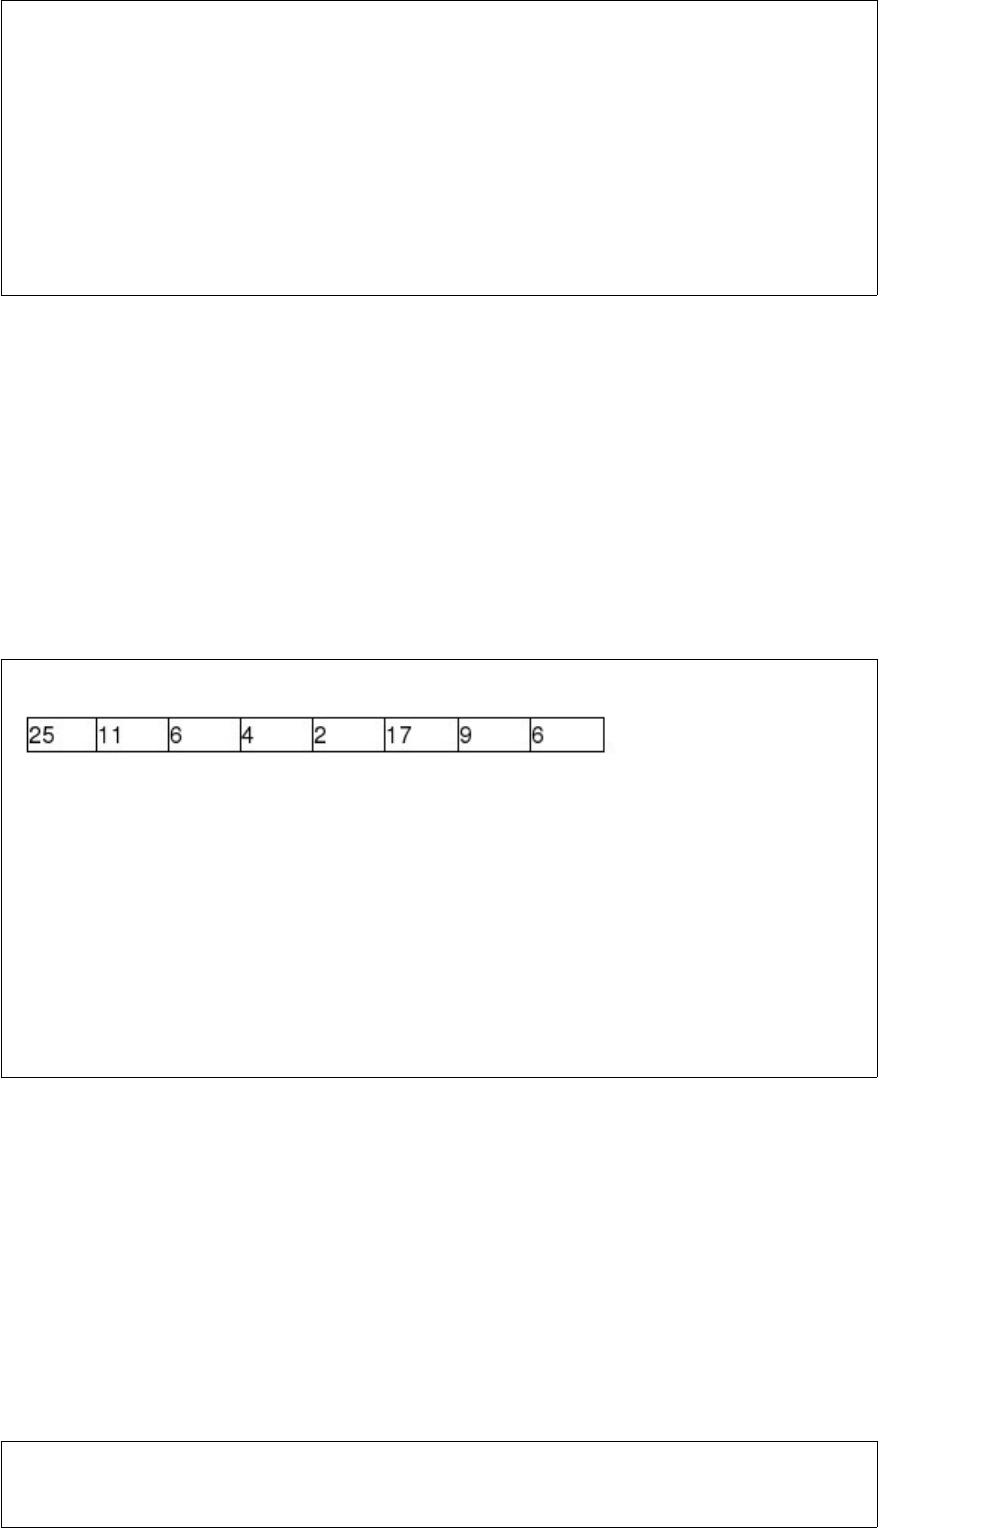
Consider the following sample data:
For these data the sample mean is:
A) 8
B) 10
C) 3
D) 12
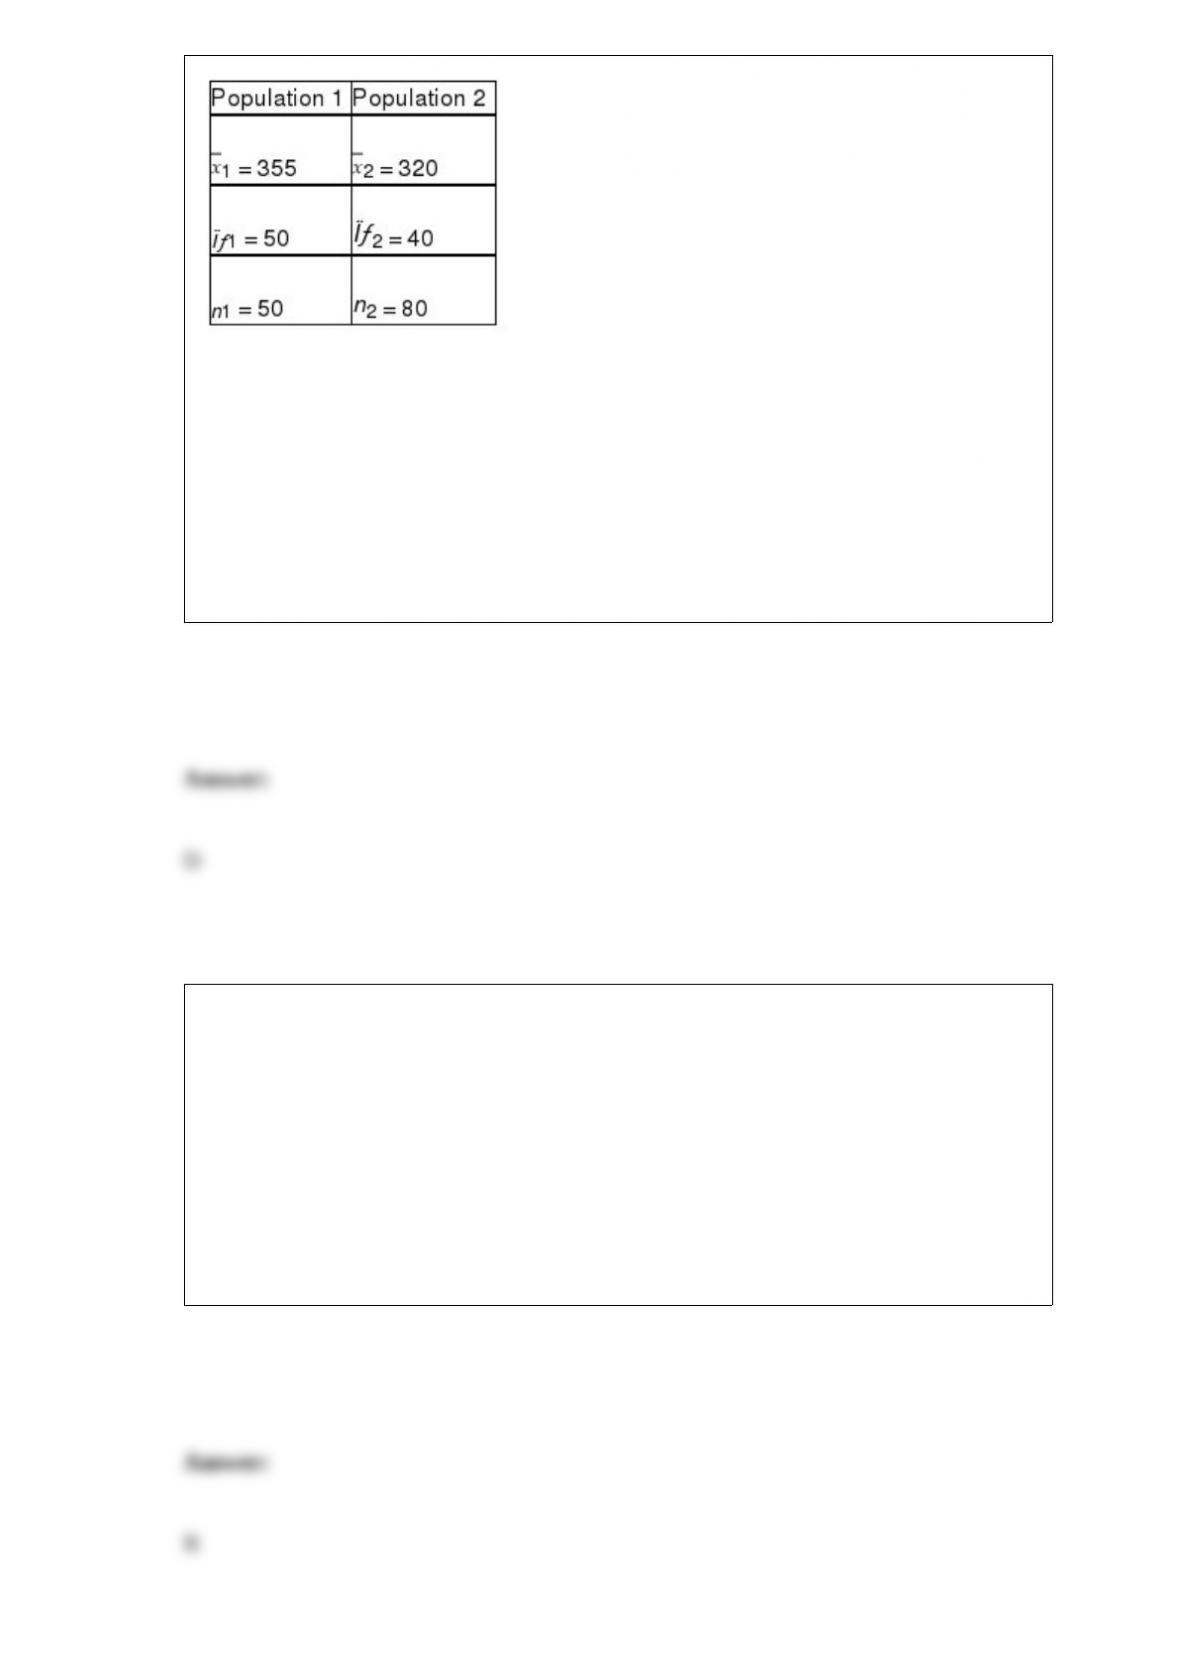
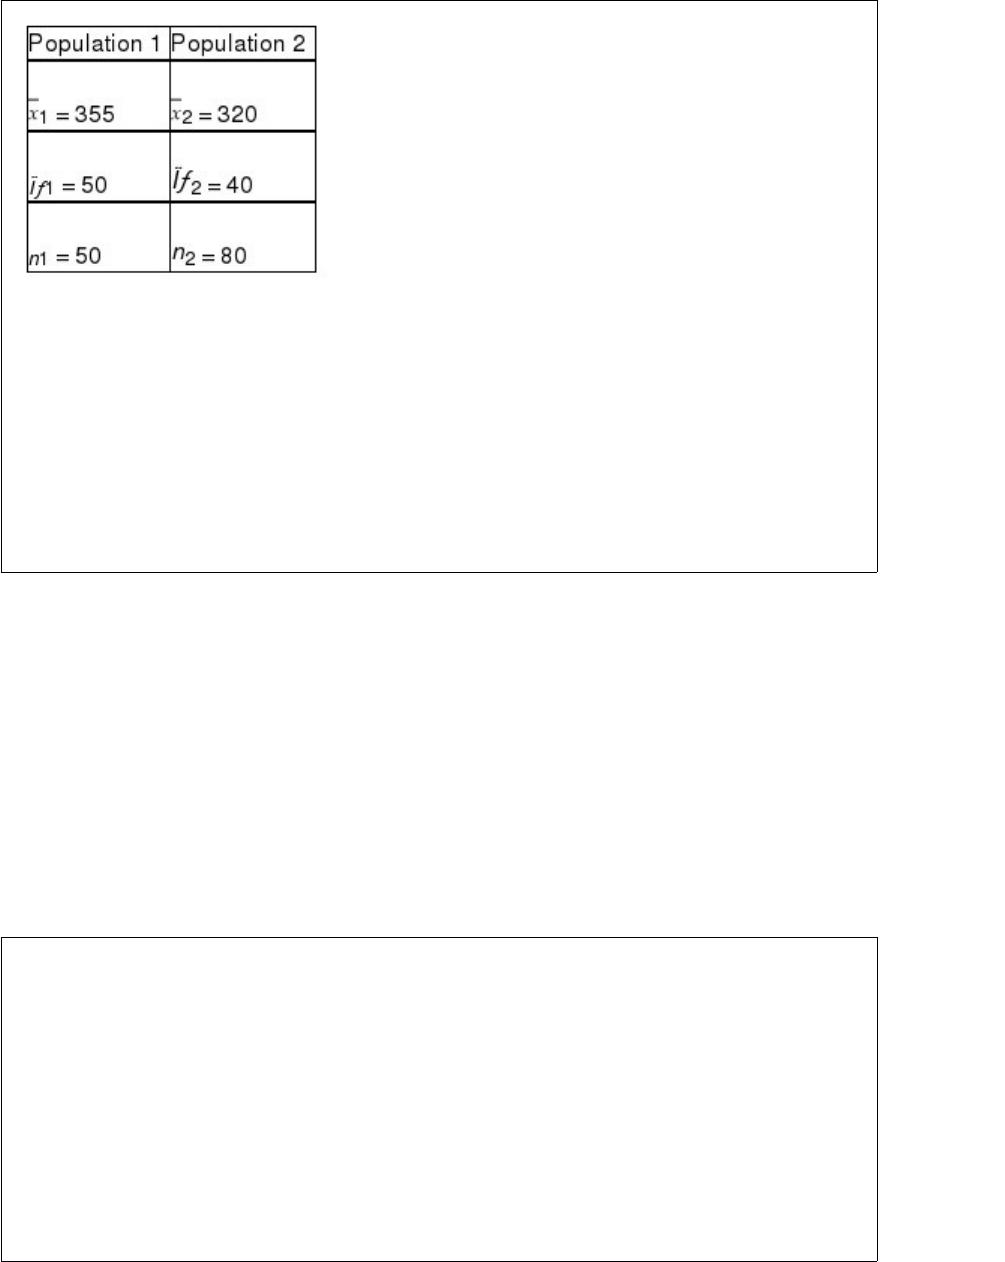
Construct a 95% confidence interval estimate for the difference between two population
means based on the following information:
A) 25.41 ≤ (1 – 2) ≤ 44.59
B) 35.41 ≤ (1 – 2) ≤ 40.59
C) 15.741 ≤ (1 – 2) ≤ 54.16
D) 22.13 ≤ (1 – 2) ≤ 47.87
A hypothesis test for the difference between two means is considered a two-tailed test
when:
A) the population variances are equal.
B) the null hypothesis states that the population means are equal.
C) the alpha level is 0.10 or higher.
D) the standard deviations are unknown.


Which of the following is a correct interpretation for the regression slope coefficient?
A) For a one-unit change in y, we can expect the value of the independent variable to
change by b1 units on average.
B) For each unit change in x, the dependent variable will change by b1 units.
C) The average change in y of a one-unit change in x will be b1 units.
D) The average change in x of a one-unit change in y will be b1 units.
The Wilcoxon signed rank test is used to test which of the following type of
hypotheses?
A) Tests about a single population median
B) Tests involving three or more population medians
C) Tests about the variances of two or more populations
D) Tests about two or more population proportions
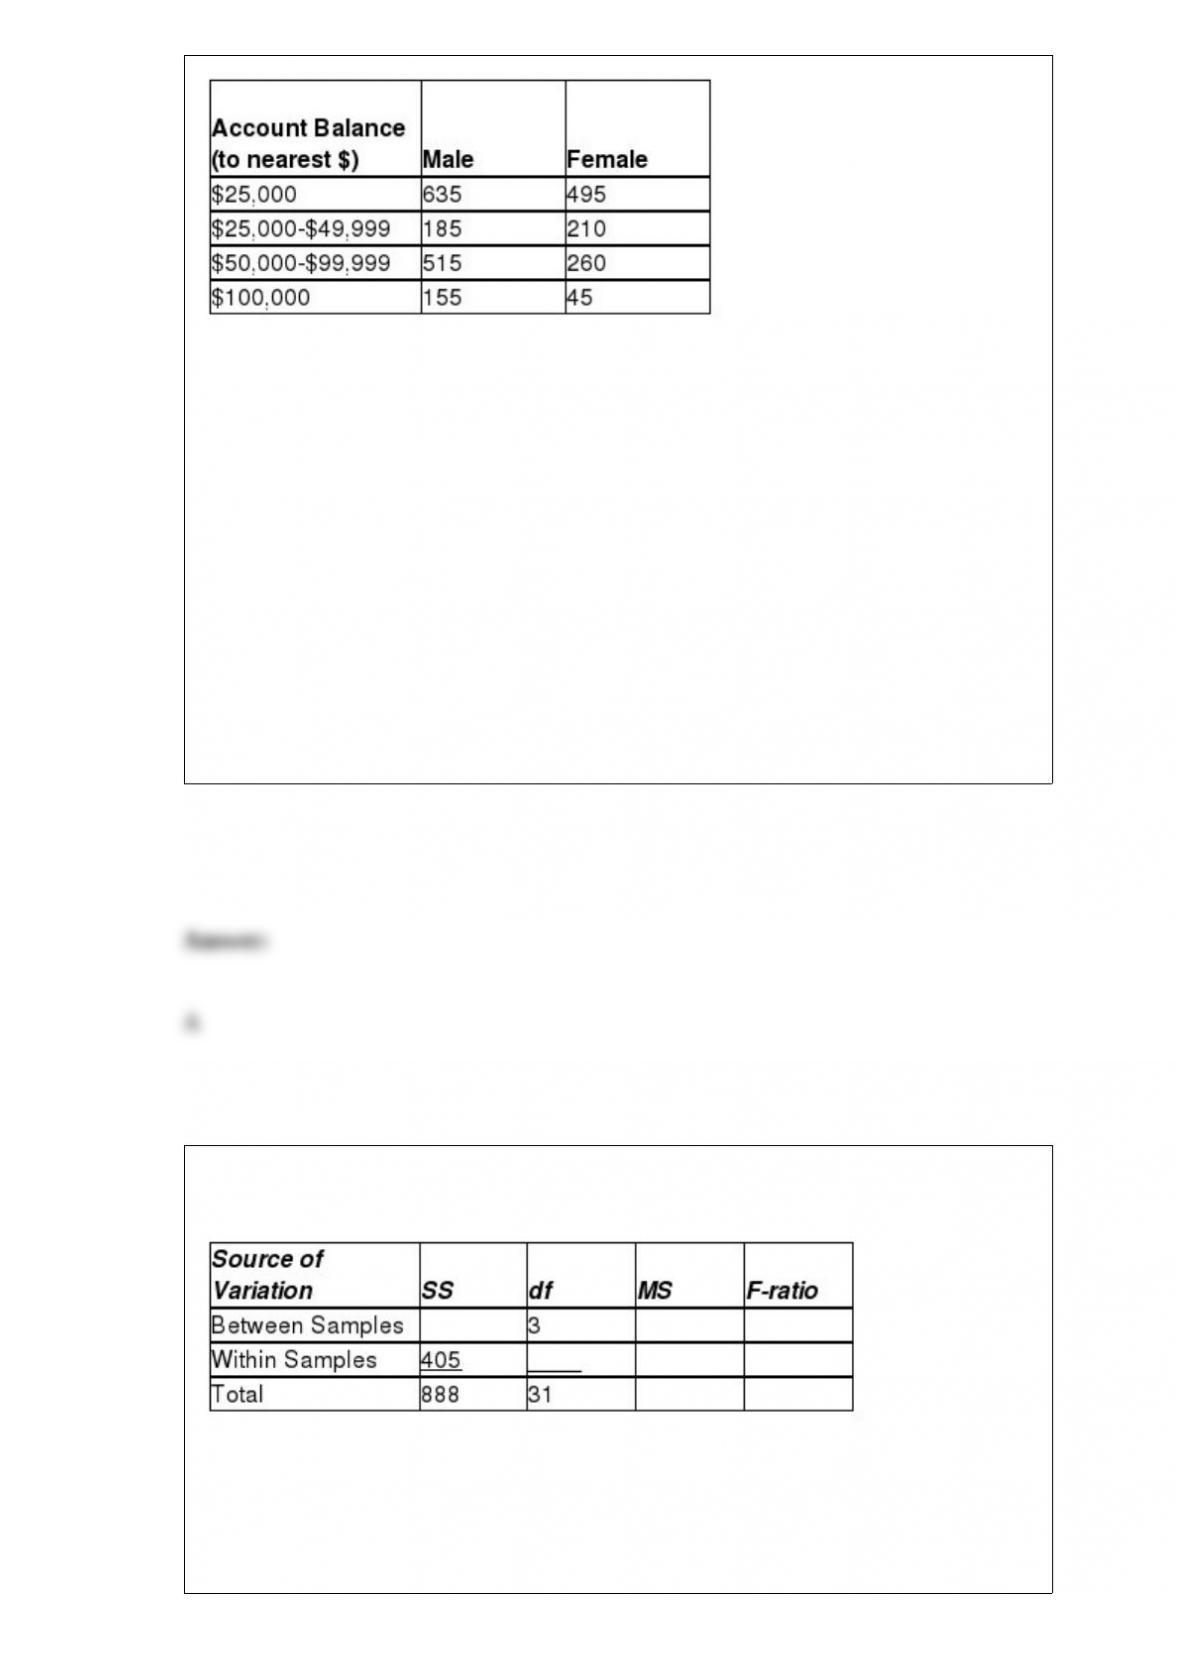
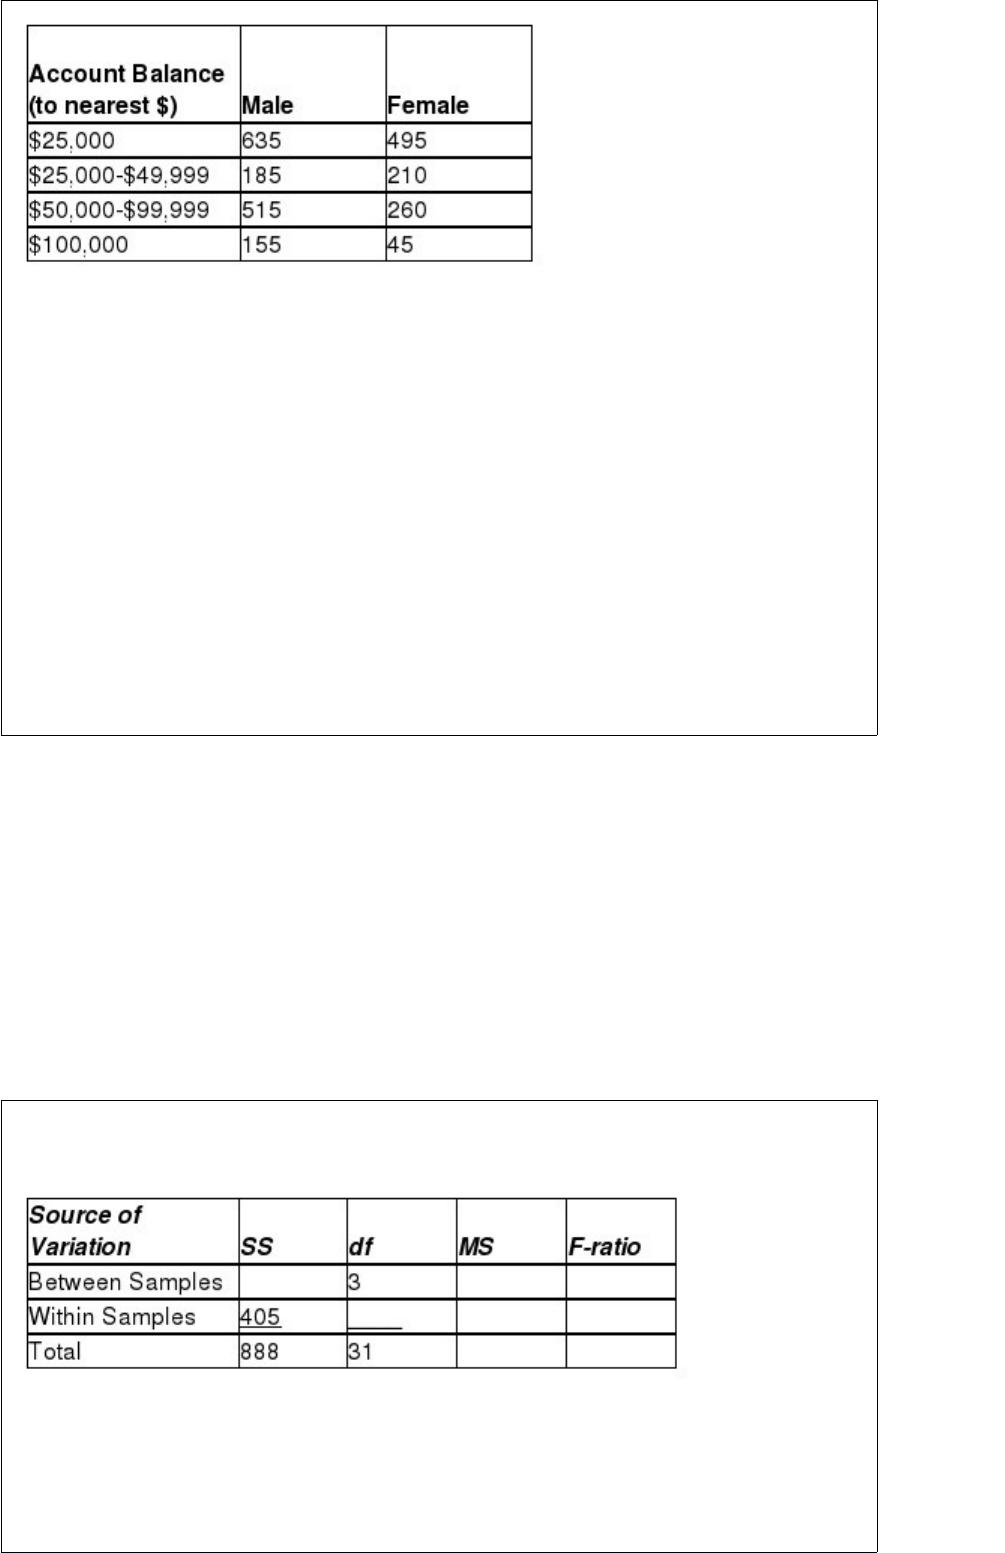
The results of a census of 2,500 employees of a mid-sized company with 401(k)
retirement accounts are as follows:
Suppose researchers are going to sample employees from the company for further
study.
Based on the relative frequency assessment method, what is the probability that a
randomly selected employee will have a 401(k) account balance of between $25,000
and $49,999?
A) 0.1580
B) 0.1040
C) 0.6160
D) 0.4040
Respond to the following questions using this partially completed one-way ANOVA
table:
Based on the analysis of variance F-test, what conclusion should be reached regarding
the null hypothesis? Test using alpha = 0.05.
A) Since 11.1309 > 2.9467 accept H0 and conclude that all population means are the


same.
B) Since 2.9467 > 11.1309 accept H0 and conclude that all population means are the
same.
C) Since 11.1309 > 2.9467 reject H0 and conclude that at least two populations means
are different.
D) Since 2.9467 > 11.1309 reject H0 and conclude that at least two populations means
are different.
Men have a reputation for not wanting to ask for directions. A Harris study conducted
for Lincoln Mercury indicated that 42% of men and 61% of women would stop and ask
for directions. The U.S. Census Bureau’s 2012 population estimate was that for
individuals 18 or over, 48.2% were men and 51.8% were women. This exercise
addresses this age group.
Calculate the probability that the driver stops to ask for directions.
A) 0.518
B) 0.420
C) 0.316
D) 0.390


The random variable x is the number of customers arriving at the service desk of a local
car dealership over an interval of 10 minutes. It is known that the average number of
arrivals in 10 minutes is 5.3. The probability that there are less than 3 arrivals in any 10
minutes is:
A) .0659
B) .0948
C) .1016
D) .1239
Some stores and restaurants have “tell us what you think” cards available for customers.
Assuming that angry customers are more likely to take the time to fill these out, this is
an example of:
A) simple random sampling.
B) stratified sampling.
C) cluster sampling.
D) nonstatistical sampling.
Consider a random variable, z, that has a standardized normal distribution. Determine
(-2 ≤ z ≤ 3).


A) 0.12414
B) 0.97587
C) 0.47722
D) 0.49865
An industry study was recently conducted in which the sample correlation between
units sold and marketing expenses was 0.57. The sample size for the study included 15
companies. Based on the sample results, test to determine whether there is a significant
positive correlation between these two variables. Use an alpha = 0.05
A) Because t = 2.50 > 1.7709, do not reject the null hypothesis. There is not sufficient
evidence to conclude there is a positive linear relationship between sales units and
marketing expense for companies in this industry.
B) Because t = 2.50 > 1.7709, reject the null hypothesis. There is sufficient evidence to
conclude there is a positive linear relationship between sales units and marketing
expense for companies in this industry.
C) Because t = 3.13 > 1.7709, do not reject the null hypothesis. There is not sufficient
evidence to conclude there is a positive linear relationship between sales units and
marketing expense for companies in this industry.
D) Because t = 3.13 > 1.7709, reject the null hypothesis. There is sufficient evidence to
conclude there is a positive linear relationship between sales units and marketing
expense for companies in this industry.
A joint frequency distribution can be constructed for either quantitative or qualitative
data.
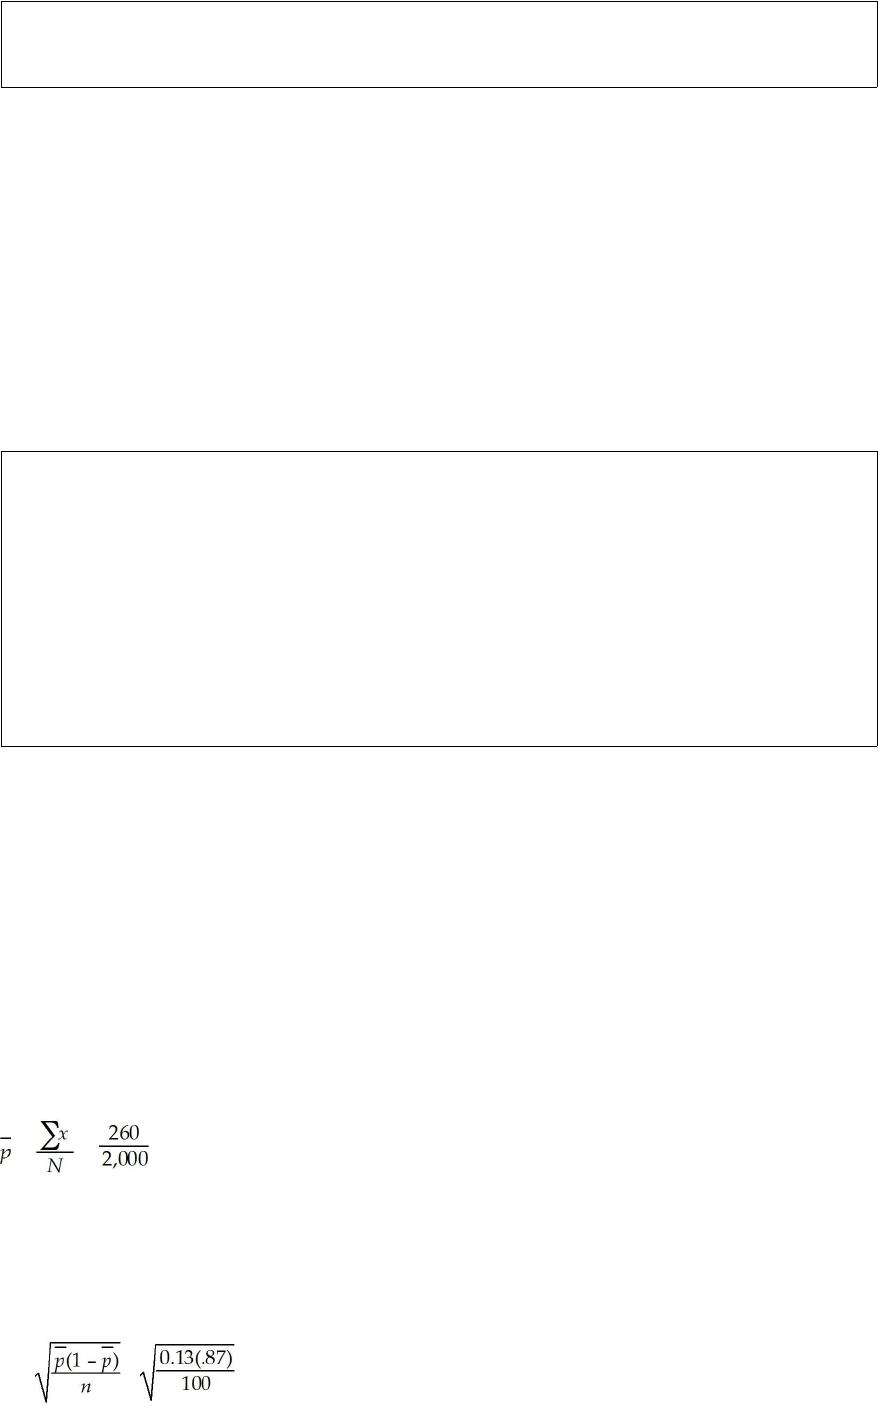
A major airline is interested in monitoring customer satisfaction with its baggage
handling process. To do so, each day the airline randomly selects 100 customers and
surveys them to determine if they are satisfied or not with the service provided. After 20
samples, a total of 260 unsatisfied customers were surveyed.
a. If the airline wishes to use a control chart, which chart would you recommend and
why?
b. Determine the 3-sigma control limits for the appropriate control chart.
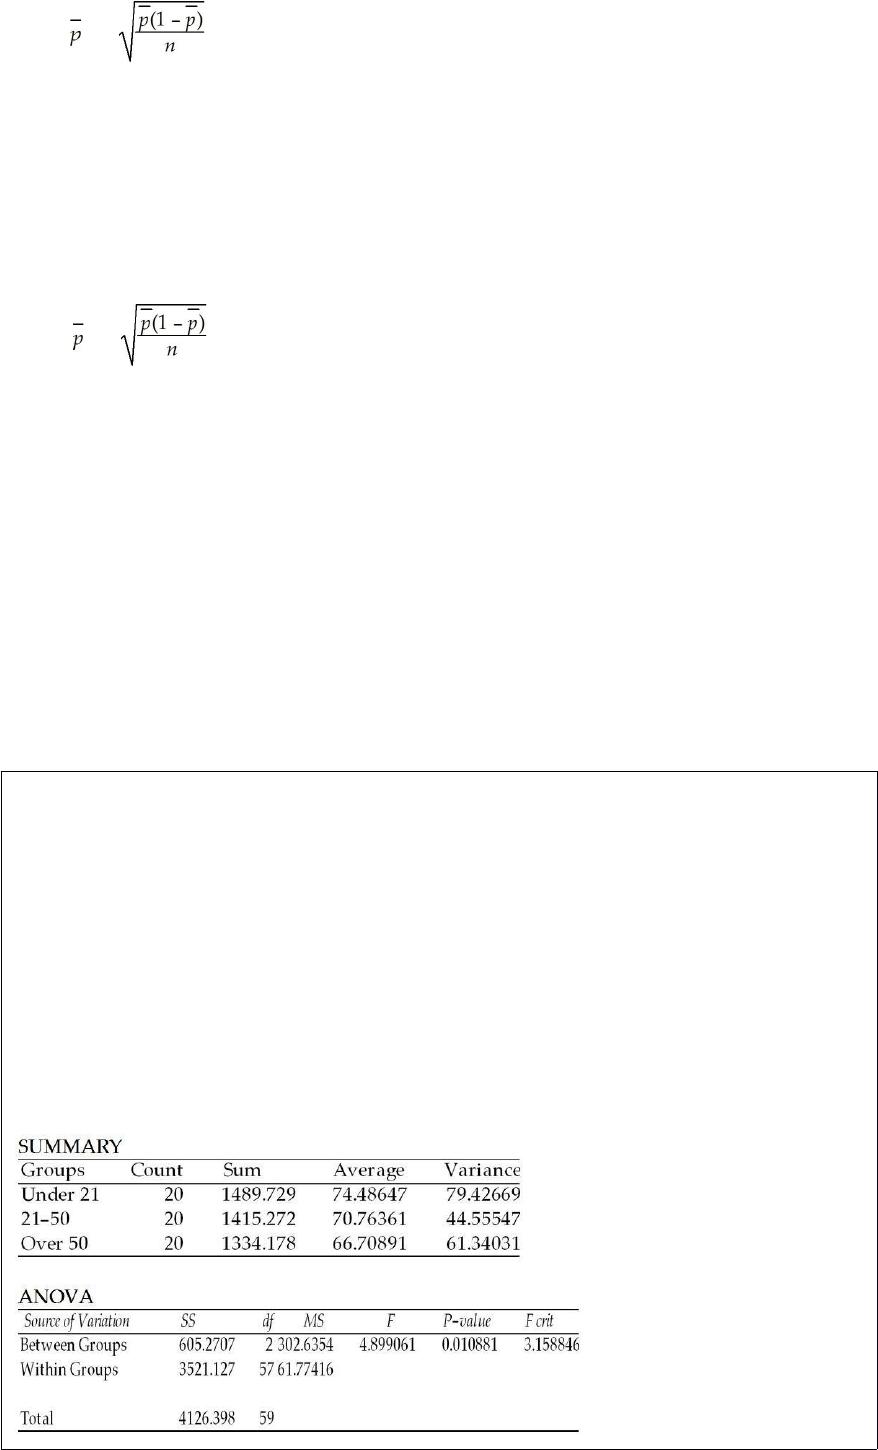
As a step in establishing its rates, an automobile insurance company is interested in
determining whether there is a difference in the mean highway speeds that drivers of
different age groups drive. To help answer this question, it has selected a random
sample of drivers in three age categories: under 21, 21-50, and over 50. The engineers
then recorded the drivers’ speeds at a designated point on a highway in the state. The
subjects were unaware that their speed was being recorded. The following one-way
ANOVA output was generated from the sample data. Based upon this output, if the
significance level is 0.05, the engineers should conclude that the mean speeds may all
be equal since the p-value is less than alpha.
ANOVA: Single Factor

A randomly selected value from a normal distribution is found to be 2.1 standard
deviations above its mean. What is the probability that a randomly selected value from
the distribution will be less than 2.1 standard deviations from the mean?
A) 0.9488
B) 0.9821
C) 0.9976
D) 0.9712
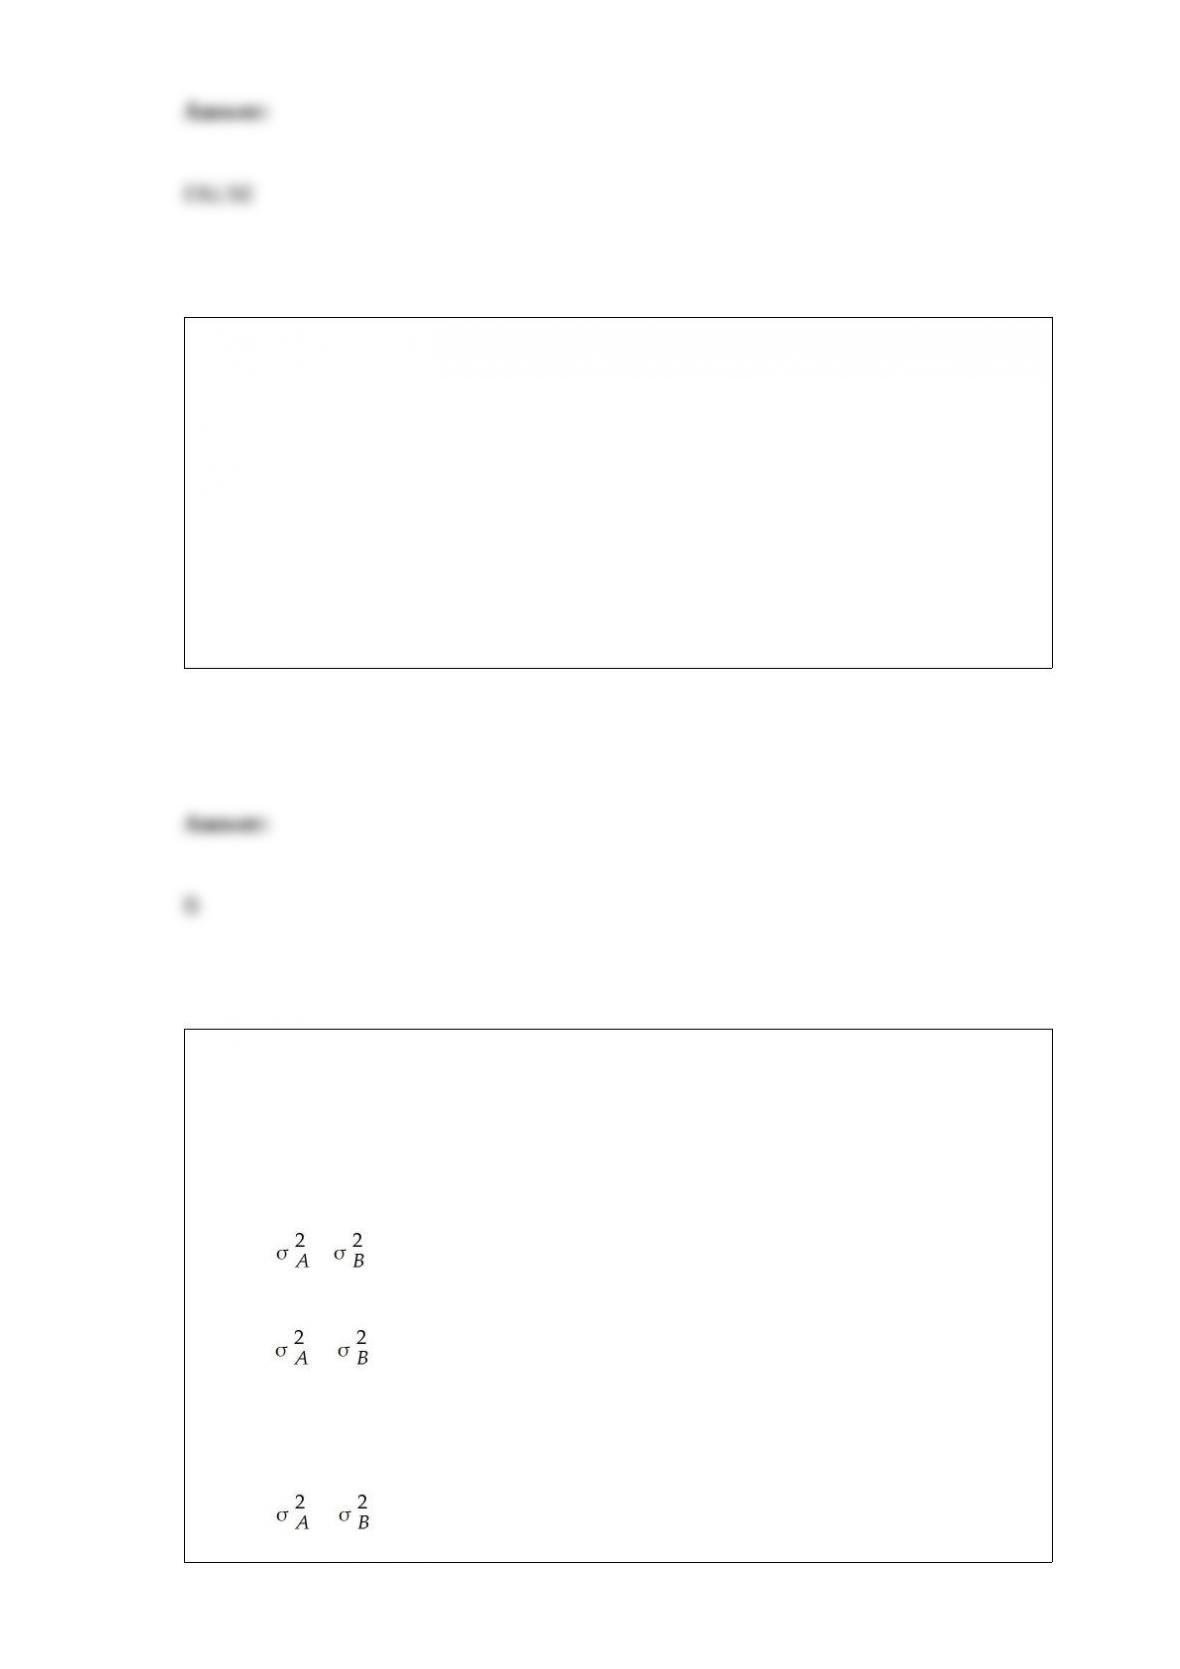
It is believed that the SAT scores for students entering two state universities may have
different standard deviations. Specifically, it is believed that the standard deviation at
University A is greater than the standard deviation at University B. If a statistical test is
to be conducted, which of the following would be the proper way to formulate the null
hypothesis?
A) H0 : – = 0
B) H0 : ≤
C) H0 : σA ≤ σB
D) H0 : >


Each evening, a nationwide retail chain randomly calls 100 of the customers who came
to their store that day to ask whether they were satisfied with the service they had
received. The customers respond yes or no. Suppose the company has found over time
that 8 percent of the customers are not satisfied (“no” answers), what is the 3-sigma
upper and lower control limits for the appropriate control chart?
A) About .053 and .107
B) 0 to about .16
C) -.0.14 to about .16
D) About -1.96 to 1.96
For the following z-test statistic, compute the p-value assuming that the hypothesis test
is a one-tailed test: z = 2.09.
A) 0.0172
B) 0.0183
C) 0.0415
D) 0.0611
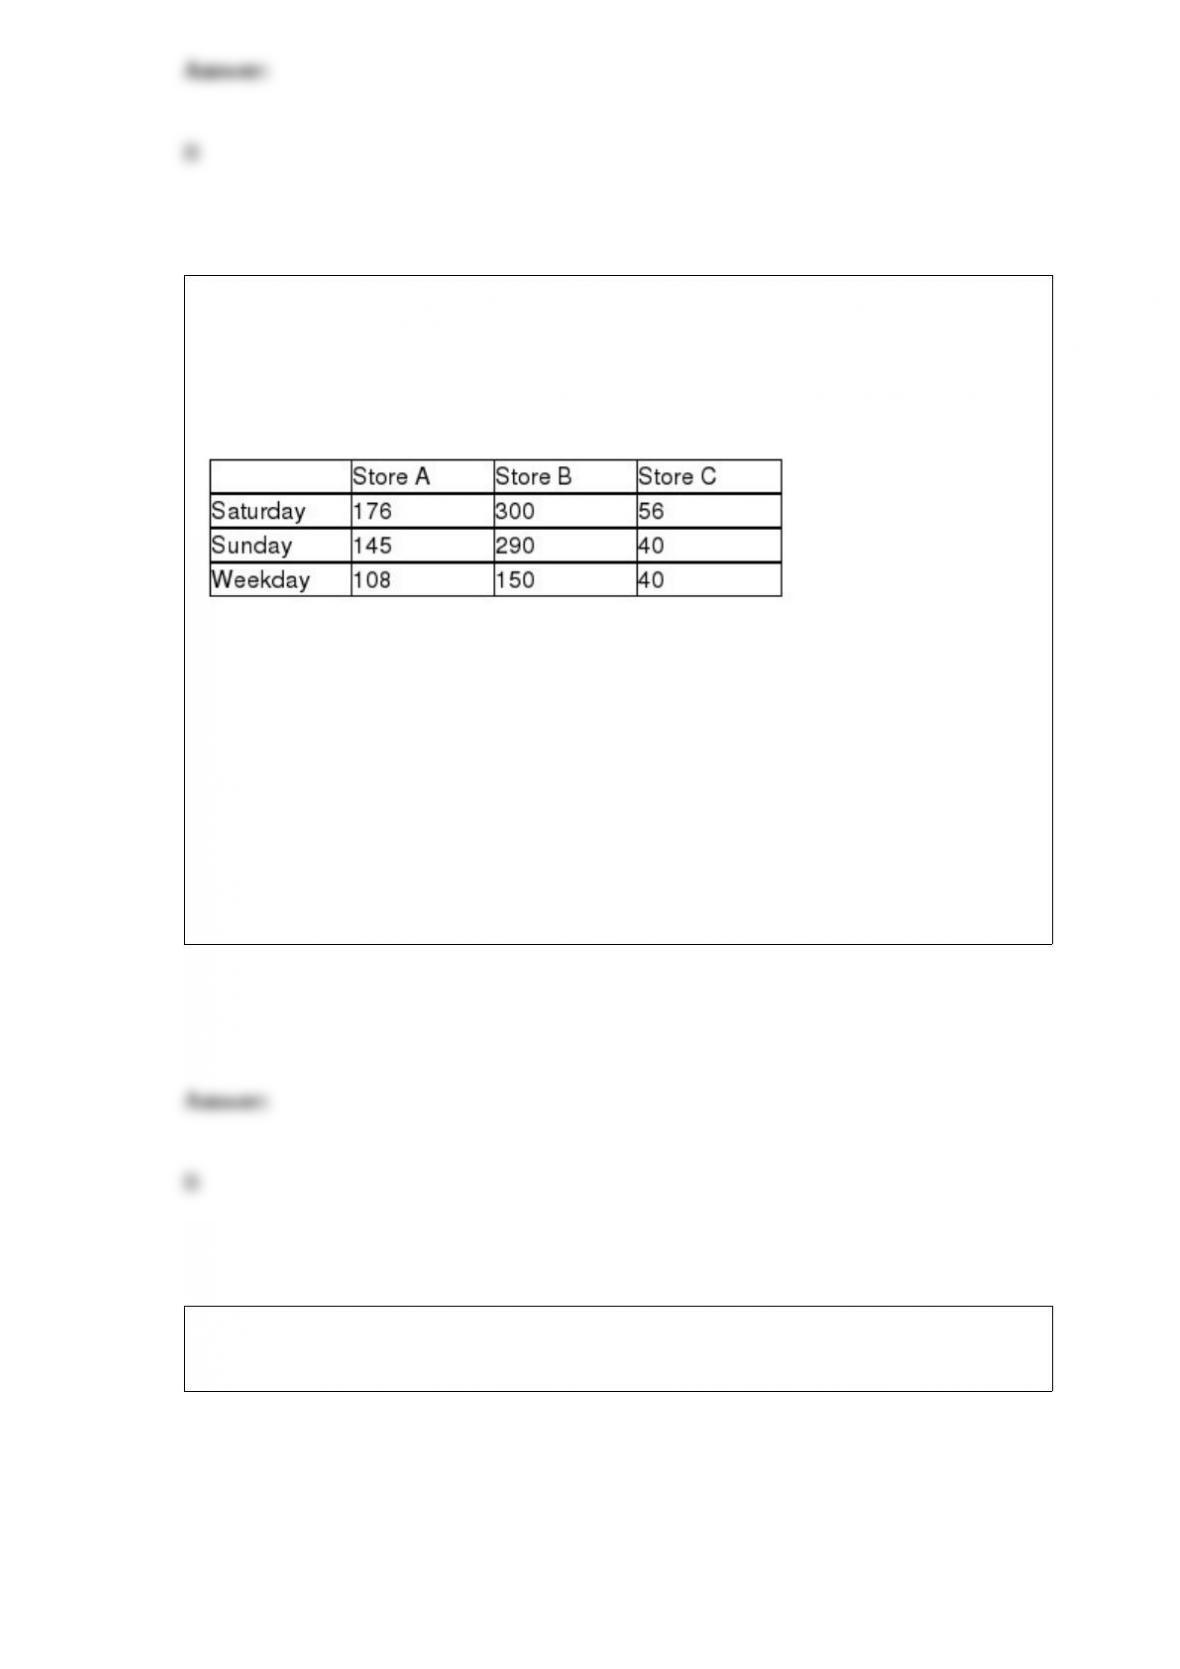
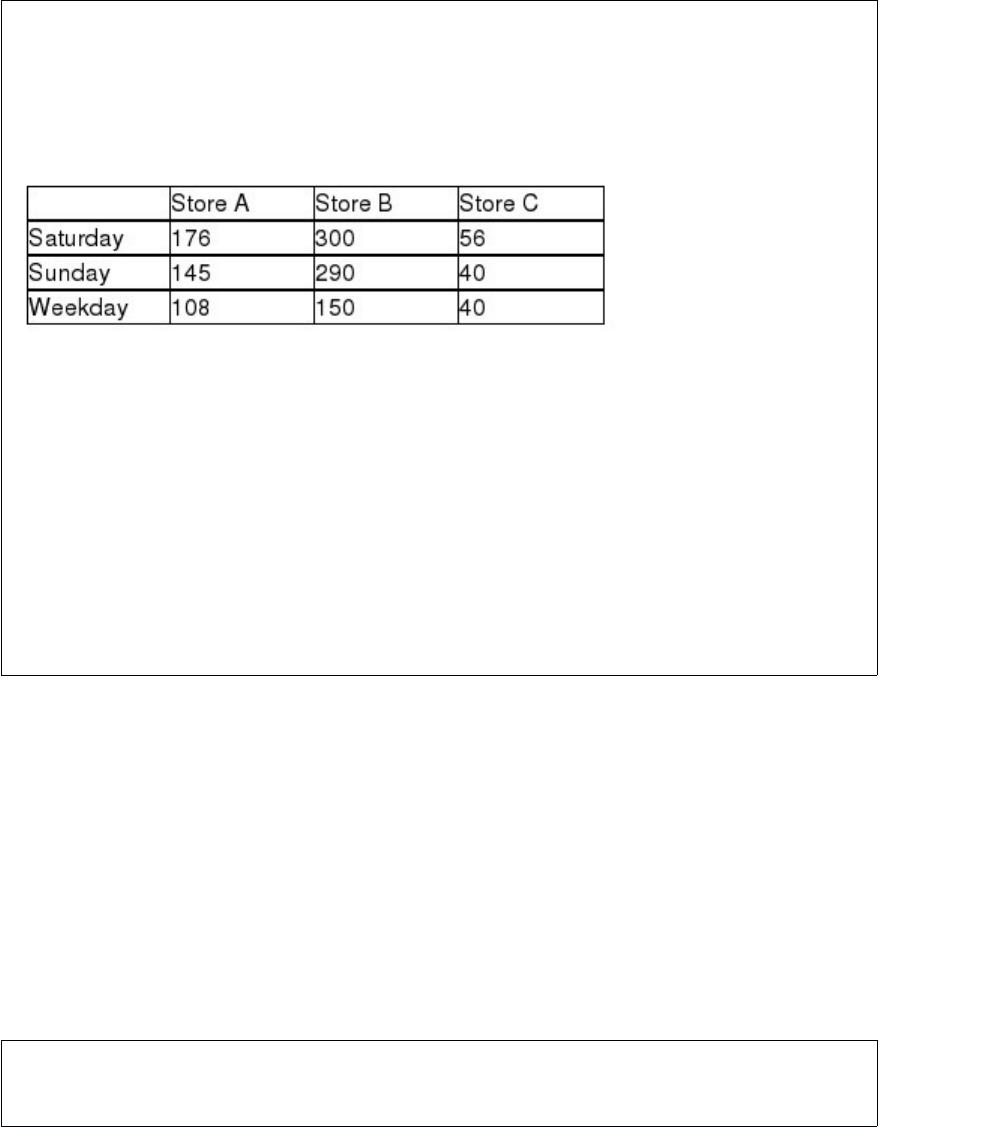
Recently, a department store chain was interested in determining if there was a
difference in the mean number of customers who enter the three stores in Seattle. The
analysts set up a study in which the number of people entering the stores was counted
depending on whether the day of the week was Saturday, Sunday, or a weekday. The
following data were collected:
Given this format, what is the null hypothesis for testing whether blocking is effective?
A) H0 : μA= μB= μC
B) H0 : μSat= μSun= μWeek
C) Not all means are equal.
D) H0 : σ1 = σ2 = σ3
A multiple regression is shown for a data set of yachts where the dependent variable is
the price in thousands of dollars.
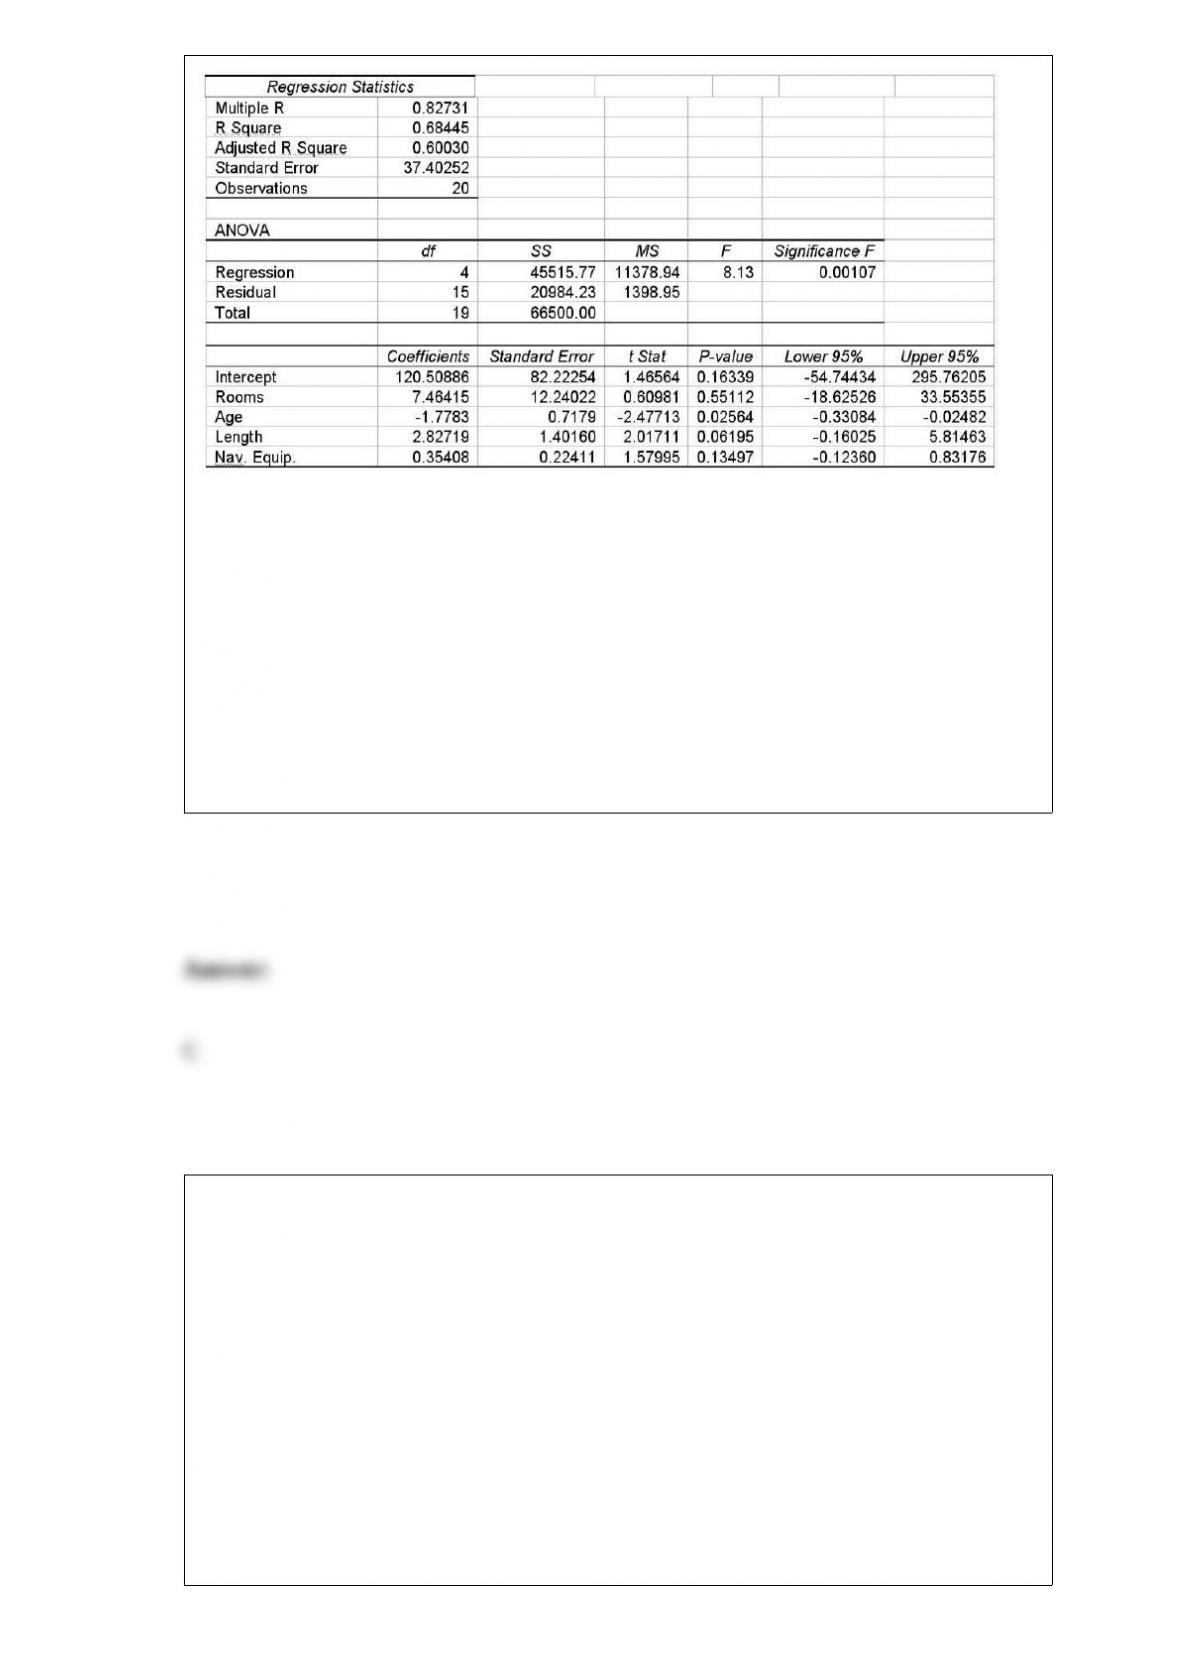
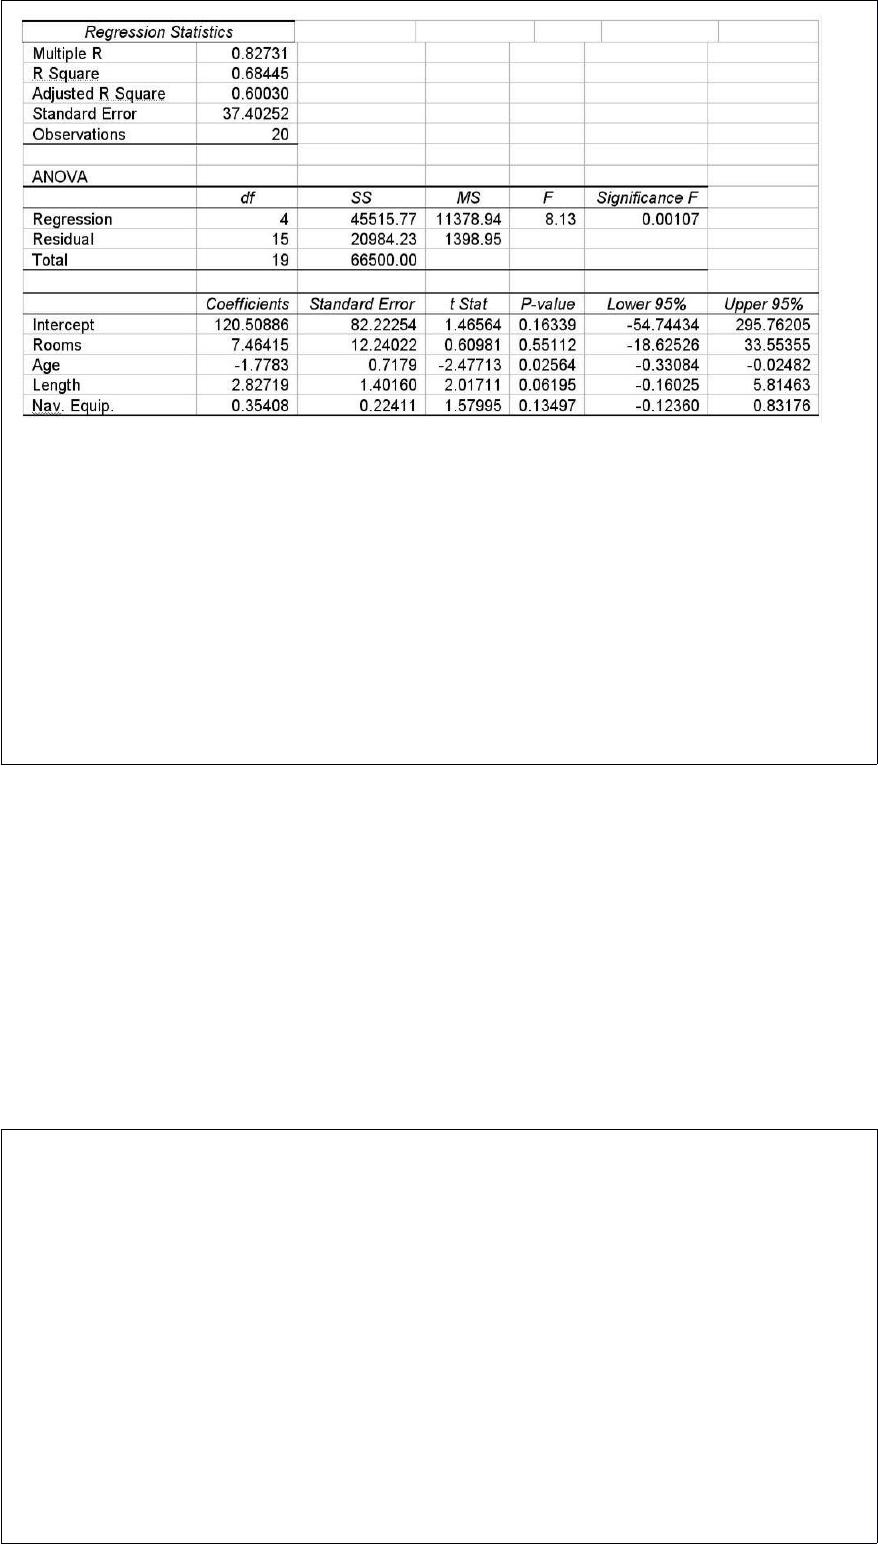
Given this information, which of the following is true regarding the slope coefficient for
Age, where Age represents how many years old the yacht is?
A) On average the price of the yacht falls by $1.778 per year.
B) On average the yacht is 1.778 years older per $1000 price change.
C) On average the price of the yacht falls by $1778 per year.
D) On average the price of the yacht increases by $1778 per year.
The Jack In The Box franchise in Bangor, Maine, has determined that the chance a
customer will order a soft drink is 0.90. The probability that a customer will order a
hamburger is 0.60. The probability that a customer will order french fries is 0.50.
If a customer places an order, what is the probability that the order will include a soft
drink and no fries if these two events are independent?
A) 0.45
B) 0.50
C) 0.65

D) 0.70
If we are testing for the difference between the means of two paired populations with
samples of n1 = 20 and n2 = 20, the number of degrees of freedom is equal to:
A) 39
B) 38
C) 19
D) 18
A population has a proportion equal to 0.30. Calculate the following probabilities with
n = 100. Find P( > 0.40).
A) 0.0146
B) 0.0411
C) 0.0521
D) 0.0312


In a contingency analysis, the greater the difference between the actual and the expected
frequencies, the more likely:
A) H0 should be rejected.
B) H0 should be accepted.
C) we cannot determine H0.
D) the smaller the test statistic will be.
Men have a reputation for not wanting to ask for directions. A Harris study conducted
for Lincoln Mercury indicated that 42% of men and 61% of women would stop and ask
for directions. The U.S. Census Bureau’s 2012 population estimate was that for
individuals 18 or over, 48.2% were men and 51.8% were women. This exercise
addresses this age group.
Given that a driver stops to ask for directions, determine the probability that the driver
was a man.
A) 0.518
B) 0.420
C) 0.316
D) 0.390


Which of the following is not considered desirable when constructing a frequency
distribution for continuous data?
A) Open-ended classes
B) Mutually exclusive classes
C) Equal-width classes
D) All-inclusive classes