
If arrivals at a bank followed a Poisson distribution, then the time between arrivals
would follow a binomial distribution.
To test hypotheses about the equality of two population variances, the ratio of the
variances of the samples from the two populations is tested using the Ftest.
The model y =
0+
1x1+
2x2+
is a second-order regression model.
An appropriate measure of central tendency for ordinal data is the mode.

We may use logistic regression when the dependent variable is a dummy variable,
coded 0 or 1.
In simple regression analysis the error terms are assumed to be independent and
normally distributed with zero mean and constant variance.
If the variance inflation factor is bigger than 10, the regression analysis might suffer
from the problem of multicollinearity.

The Six Sigma approach essentially calls for the process to approach defect-free status.
In conducting a matched-pairs hypothesis test, the null and alternative hypotheses
always represent one-tailed tests.
In regression, the variable that is being predicted is usually referred to as the
independent variable.

In conducting z test of proportions, the sample proportion is computed by dividing the
number of items being counted by the estimated total population.
The Mann-Whitney U test is implemented differently for small samples than for large
samples.
Suppose a random sample of 16 is selected from a population with a normal distribution
with a known population standard deviation σ of 10. Assume that the sample mean is
4.2. Based on a 90% confidence interval for the population mean, we can conclude that
0.1 is a plausible number for the population mean μ.
The coefficient of variation is unitless.

For an exponential distribution, the mean and the median are equal.
The central limit theorem states that if the sample size, n, is large enough (n ≥20), the
distribution of the sample means is normally distributed regardless of the shape of the
population.
The sample standard deviation is calculated by taking the square root of the population
standard deviation.

In a decision-making under uncertainty scenario, the best decision alternative based on
the strategy of minmax regret will always have zero regret.
The rejection region for a hypothesis test becomes smaller if the level of significance is
changed from 0.01 to 0.05.
Edward Deming is a quality guru whose principles of quality management can be
summarized through four basic tenets, or “Absolutes”.
One of the main techniques for isolating the effects of seasonality is decomposition.
A portion or subset of the entities under study is called the statistic.
The Kruskal-Wallis test is an extension of the Mann”Whitney U test to 3 or
more groups.
If the occurrence of one event precludes the occurrence of another event, then the two
events are mutually exclusive.

Sets of matched samples are also referred to as dependent samples.
In the multiple regression model y =
0+
1x1+
2x2+
3x3+
, the
coefficients of
the x variables are called partial regression coefficients.
A linear regression model cannot be used to explore the possibility that a quadratic
relationship may exist between two variables.

A sampling distribution is the distribution of a sample statistic such as the sample mean
or sample proportion.
In testing hypotheses, the researcher initially assumes that the alternative hypothesis is
true and uses the sample data to reject it.
Calculation of population parameters is usually either impossible or excessively time
consuming and costly.
An automobile dealer wishes to investigate the relation between the gender of the buyer
and type of vehicle purchased. Based on the joint probability table below that was

developed from the dealer’s records for the previous year, P (Female SUV) = _______.
a) 0.30
b) 0.40
c) 0.12
d) 0.10
e) 0.60
Sure Stone Tire Company has established that the useful life of a particular brand of its
automobile tires is normally distributed with a mean of 40,000 miles and a standard
deviation of 5000 miles. What is the probability that a randomly selected tire of this
brand has a life of at most 30,000 miles?
a) 0.5000
b) 0.4772
c) 0.0228
d) 0.9772
e) 1.0000

A researcher is conducting a matched”pairs study. She gathers data on each pair in the
study resulting in:
Assume that the data are normally distributed in the population. The sample standard
deviation (sd) of the differences is _______.
a) 1.3
b) 1.14
c) 1.04
d) 1.02
e) 1.47
Golf course designer Roberto Langabeer is evaluating two sites, Palmetto Dunes and
Ocean Greens, for his next golf course. He wants to prove that Palmetto Dunes
residents (population 1) play golf more often than Ocean Greens residents (population
2). Roberto commissions a market survey to test this hypothesis. The market researcher
used a random sample of 64 individuals from each suburb, and reported the following:
1= 15 times per month and 2= 14 times per month. Assume that
1= 2 and 2= 3. With a= .01, the critical zvalue is
_________________.
a) -1.96
b) 1.96
c) -2.33
d) -1.33
e) 2.33
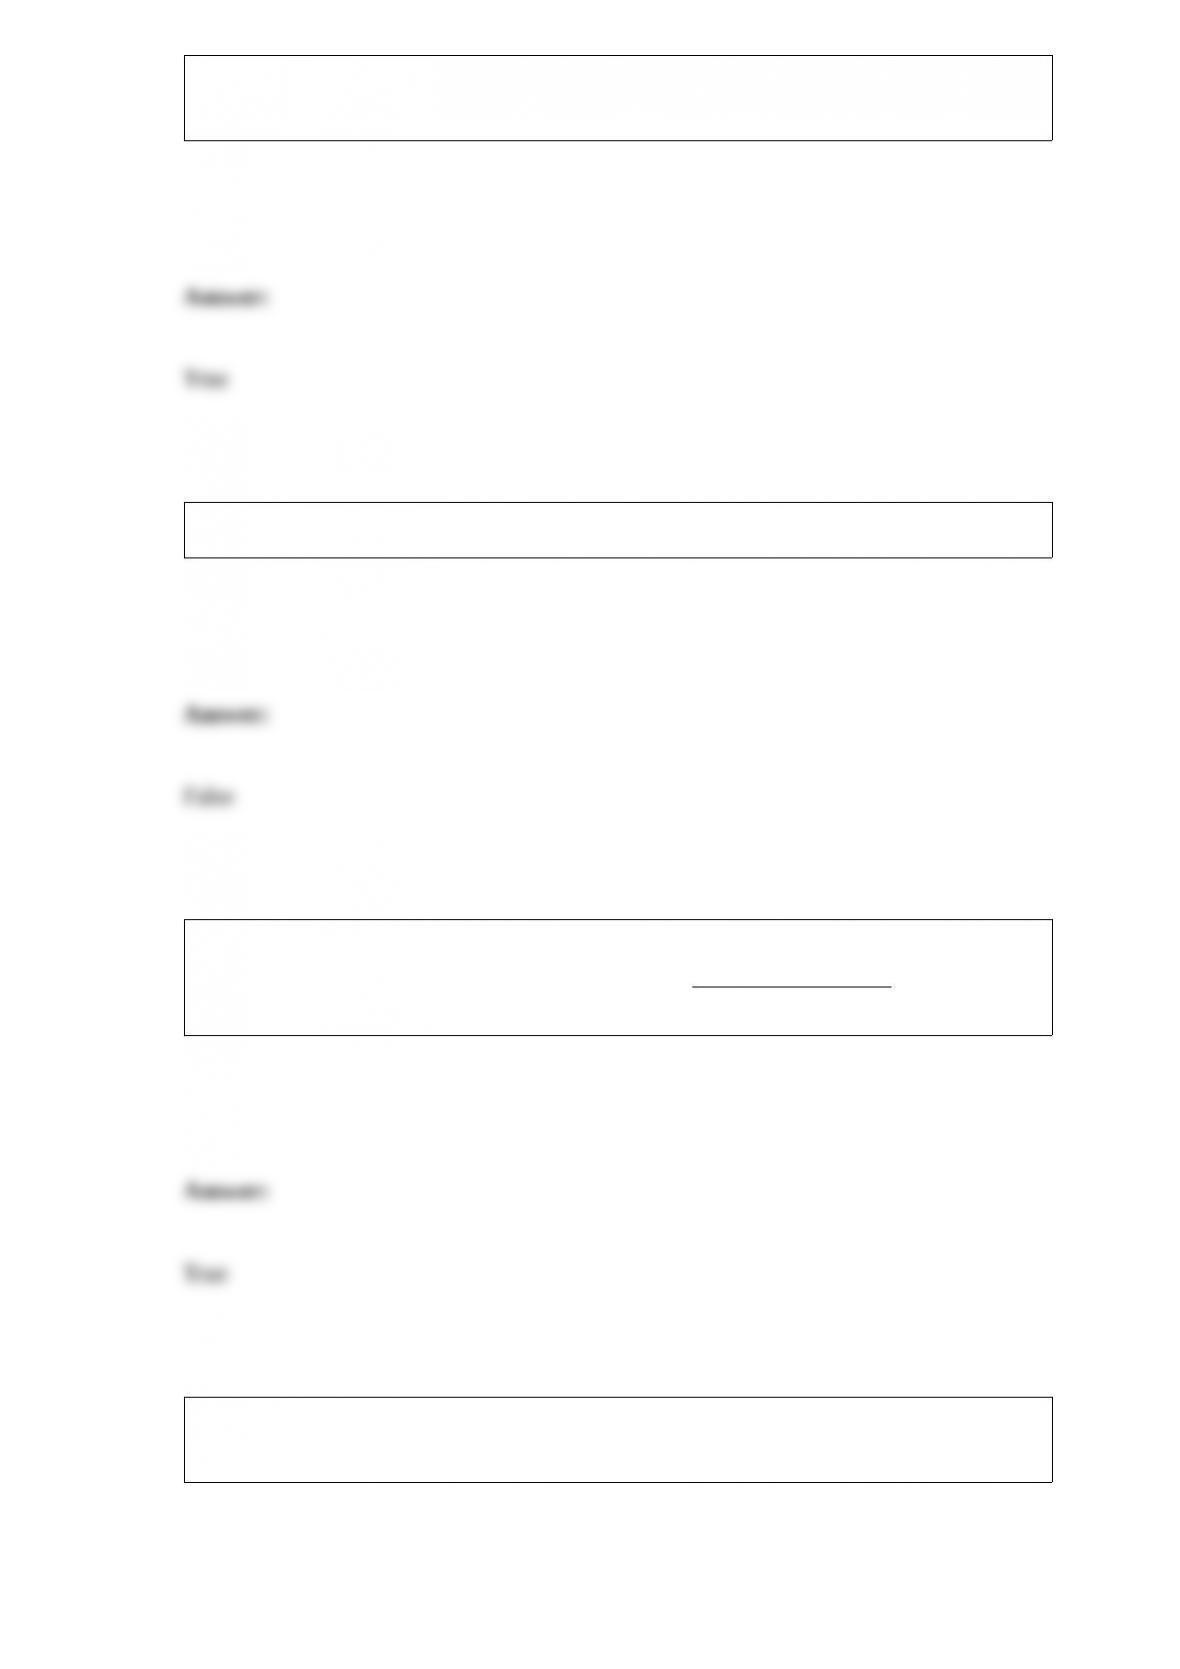
The table below provides summary information about students in a class. The sex of
each individual and their age is given.
A student is randomly selected from this group, and it is found that the student is older
than 25 years. What is the probability that the student is a male?
a) 0.21
b) 0.10
c) 0.50
d) 0.54
e) 0.26

Suppose 65% of all college students have a laptop computer at home and a sample of
150 is taken. The standard deviation of the sampling distribution of is
a) 0.0015
b) 0.0389
c) 0.6500
d) 0.4769
e) 0.0477
The number of finance majors within the School of Business is an example of _______.
a) a discrete random variable
b) a continuous random variable
c) the Poisson distribution
d) the normal distribution
e) a constant
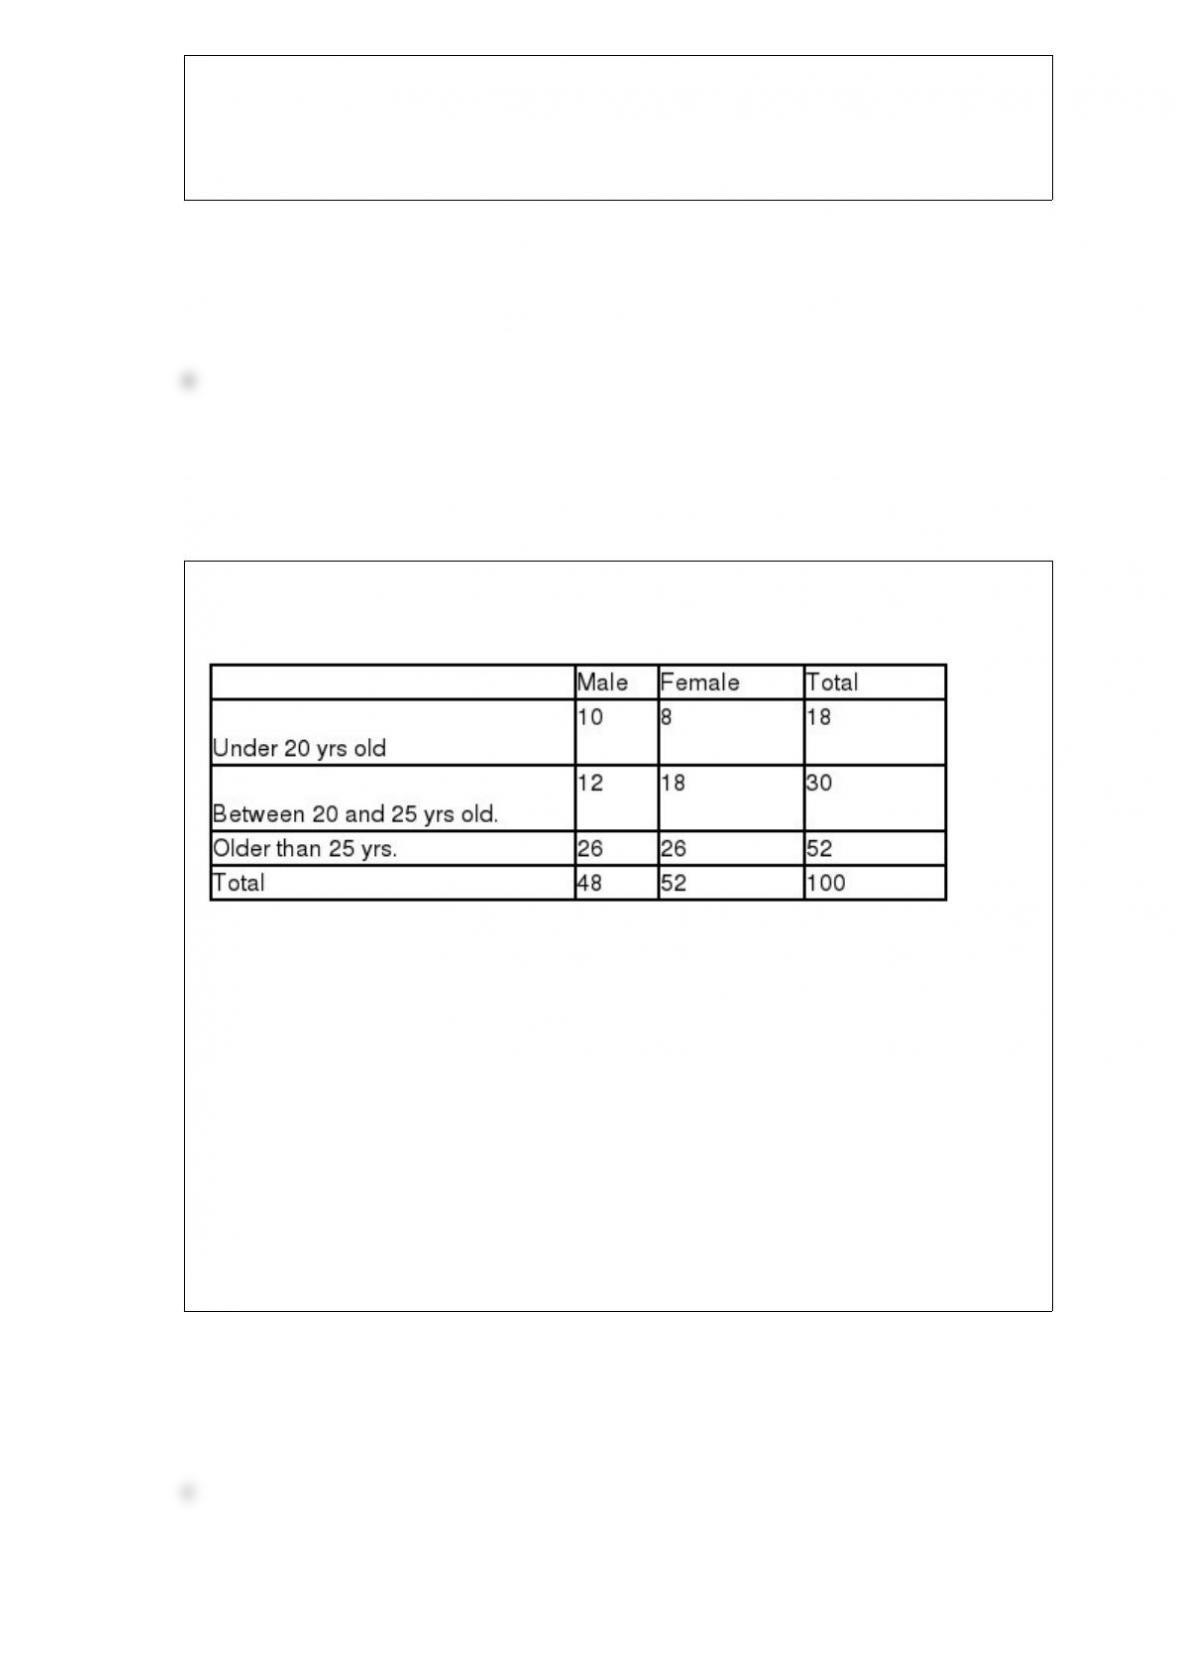
According to the following graphic, “Bent Pins” account for ____% of PCB Failures.
a) 10
b) 20
c) 30
d) 40
e) 50
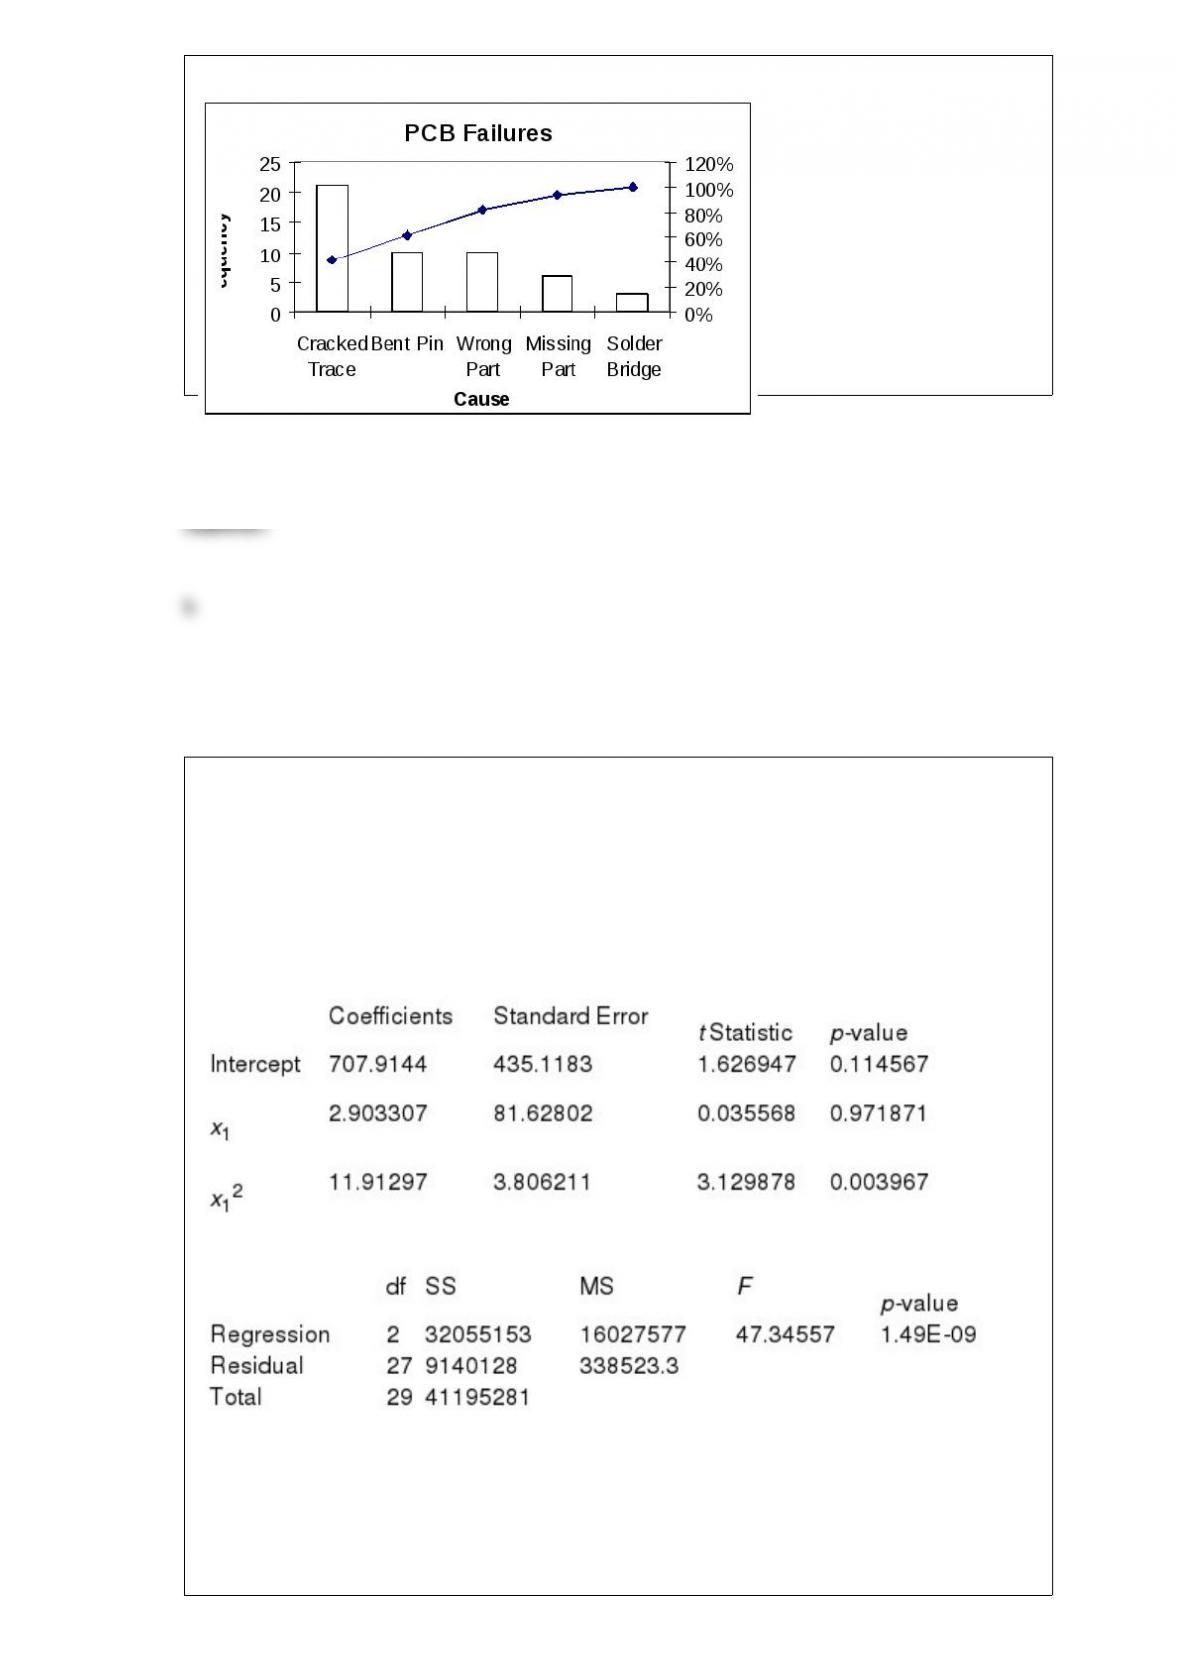
A local parent group was concerned with the increasing school cost for families with
school aged children. The parent group was interested in understanding the relationship
between the academic grade level for the child and the total costs spent per child per
academic year. They performed a multiple regression analysis using total cost as the
dependent variable and academic year (x1) as the independent variables. The multiple
regression analysis produced the following tables.
Using a = 0.01 to test the null hypothesis H0: b1 = b2 = 0, the critical F value is ____.
a) 5.42

b) 5.49
c) 7.60
d) 3.35
e) 2.49
Jake Flanaghan, Vice President for inpatient pharmacy, at Great Atlantic Medical
Center, is designing a c chart to monitor the number of inpatient medication errors that
occur each month. The total number of medication errors for January ” December last
year was 37. The upper control limit for Jake’s c chart is ___________.
a) 3.08
b) 37
c) 8.35
d) -2.18
e) 0.00
For the following scatter plot and regression line, at x = 35 the residual is _______.
a) positive
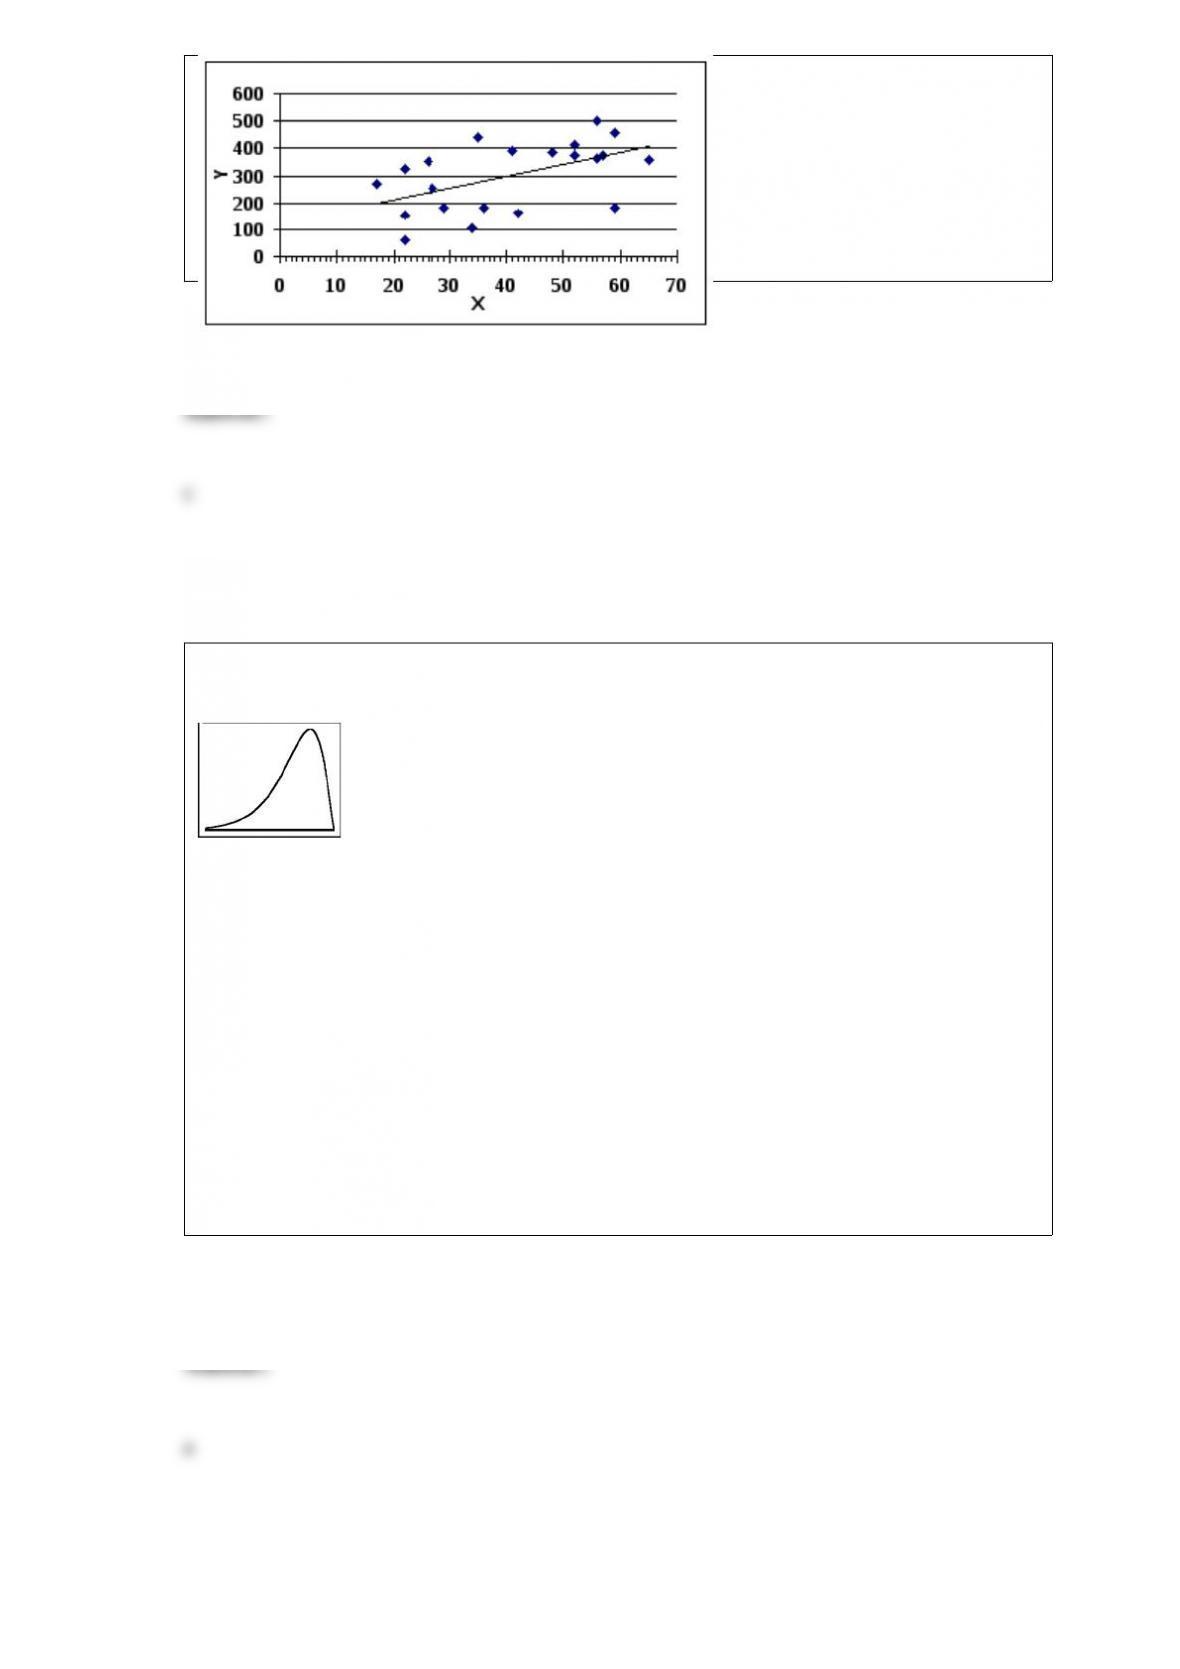
b) zero
c) negative
d) imaginary
e) unknown
The following frequency distribution was constructed for the wait times in the
emergency room.
The frequency distribution reveals that the wait times in the emergency room are
_______.
a) skewed to the left
b) skewed to the right
c) not skewed
d) normally distributed
e) symmetrical

According to the central limit theorem, for samples of size 64 drawn from a population
with µ = 800 and = 56, the mean of the sampling distribution of sample
means would equal _______.
a) 7
b) 8
c) 100
d) 800
e) 80
Golf course designer Roberto Langabeer is evaluating two sites, Palmetto Dunes and
Ocean Greens, for his next golf course. He wants to prove that Palmetto Dunes
residents (population 1) play golf more often than Ocean Greens residents (population
2). Roberto plans to test this hypothesis using a random sample of 81 individuals from
each suburb. His null hypothesis is __________.
His alternative hypothesis is __________.
In its Industry Norms and Key Business Ratios, Dun & Bradstreet reported that Q1, Q2,

and Q3 for 2,037 gasoline service stations’ sales to inventory ratios were 20.8, 33.4, and
53.8, respectively. From this we can conclude that ____________.
a) 68% of these service stations had sales to inventory ratios of 20.8 or less
b) 50% of these service stations had sales to inventory ratios of 33.4 or less
c) 50% of these service stations had sales to inventory ratios of 53.8 or more
d) 95% of these service stations had sales to inventory ratios of 33.4 or more
e) 99% of these service stations had sales to inventory ratios of 53.8 or more
Nominal and ordinal data are sometimes referred to as qualitative data.
A particular electronic component is produced at two plants for an electronics
manufacturer. Plant A produces 70% of the components used and the remainder are
produced by plant B. The probability that a component is defective is 0.02 if it is
produced at plant A and 0.01 if it is produced at plant B. The probability that the
component is defective is ______
a) 0.3
b) 0.01
c) 0.003

d) 0.176
e) 0.017
A coffee-dispensing machine is supposed to deliver 8 ounces of liquid into each paper
cup, but a consumer believes that the actual mean amount is less. The consumer
obtained a sample of 16 cups of the dispensed liquid with sample mean of 7.75 ounces
and sample variance of 0.81 ounces. If the dispensed liquid delivered per cup is
normally distributed, the appropriate decision at =0.05 isα
a) increase the sample size
b) reduce the sample size
c) fail to reject the 8-ounces claim
d) maintain status quo
e) reject the 8-ounces claim
A researcher believes a new diet should improve weight gain. To test his hypothesis a
random sample of 10 people on the old diet and an independent random sample of 10
people on the new diet were selected. The selected people on the old diet gain an
average of 5 pounds with a standard deviation of 2 pounds, while the average gain for
selected people on the new diet was 8 pounds with a standard deviation of 1.5 pounds.
Assuming that the values are normally distributed in each population, the researcher
would like to use the t procedure with pooled standard deviation using the F test.
Usinga = 0.05, the observed Fvalue is _______.
a) 1.78

b) 3.79
c) -3.79
d) 3.18
e) 1.33
Interval- and Ratio-level data are sometimes referred to as quantitative data.
The Wilcoxon test was used on 18 pairs of data. The total of the ranks (T) were
computed to be 111 (for + ranks) and 60 (for – ranks). The zvalue for this test is ____.
a) -1.11
b) -0.05
c) -0.07
d) 0.033
e) 2.22
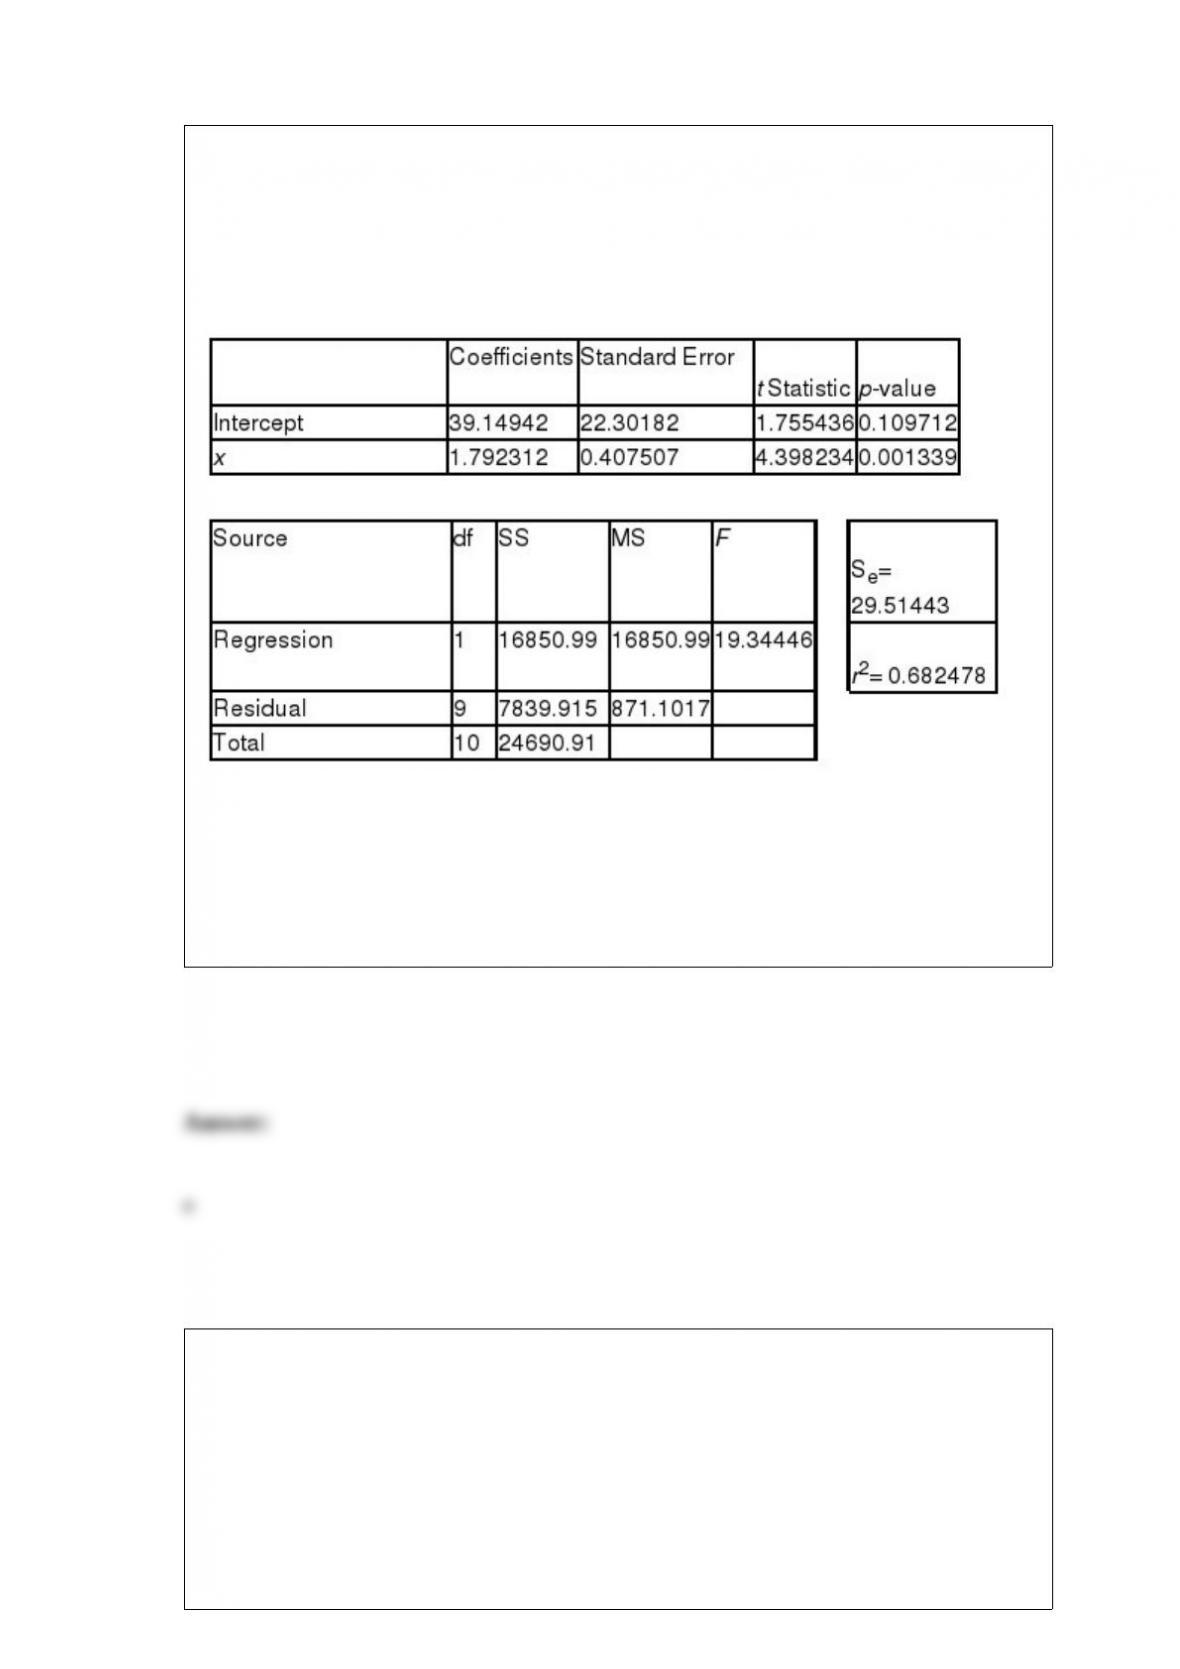
Abby Kratz, a market specialist at the market research firm of Saez, Sikes, and Spitz, is
analyzing household budget data collected by her firm. Abby’s dependent variable is
monthly household expenditures on groceries (in $’s), and her independent variable is
annual household income (in $1,000’s). Regression analysis of the data yielded the
following tables.
Abby’s regression model is __________.
a) y = 39.15 + 2.79x
b) y = 39.15 – 1.79x
c) y = 1.79 + 39.15x
d) y = -1.79 + 39.15x
e) y = 39.15 + 1.79x
Suppose a research uses the Mann-Whitney test to determine if there is a difference in
the volume of text messages sent by a high school student living in a rural area versus
an urban area during the month of December. Eight rural high school students and 9
urban high school students were included in the study. If, among all 17, the sum of the
ranks W2produced from the urban high school is 88, the U test statistic is
_____________
a) 29

b) 45
c) 90
d) 43
e) 20
Abel Alonzo, Director of Human Resources, is exploring employee absenteeism at the
Harrison Haulers Plant during the last operating year. A review of all personnel records
indicated that absences ranged from zero to twenty-nine days per employee. The
following class intervals were proposed for a frequency distribution of absences.
Which of the following might represent a problem with this set of intervals?
a) There are too few intervals.
b) Some numbers between 0 and 29 would not fall into any interval.
c) The first and second interval overlaps.
d) There are too many intervals.
e) The second and the third interval overlap.

The following graph is a binomial distribution withn = 6.
This graph reveals that ____________.
a) p > 0.5
b) p = 1.0
c) p = 0
d) p < 0.5
e) p = 1.5
A p Chart is to be developed for use in quality control. The value of p is calculated to be
0.54. The sample size is 249. What would the upper control limit be?
a) 0.5941
b) 0.6348
c) 0.4452
d) 0.5460
e) 0.5340
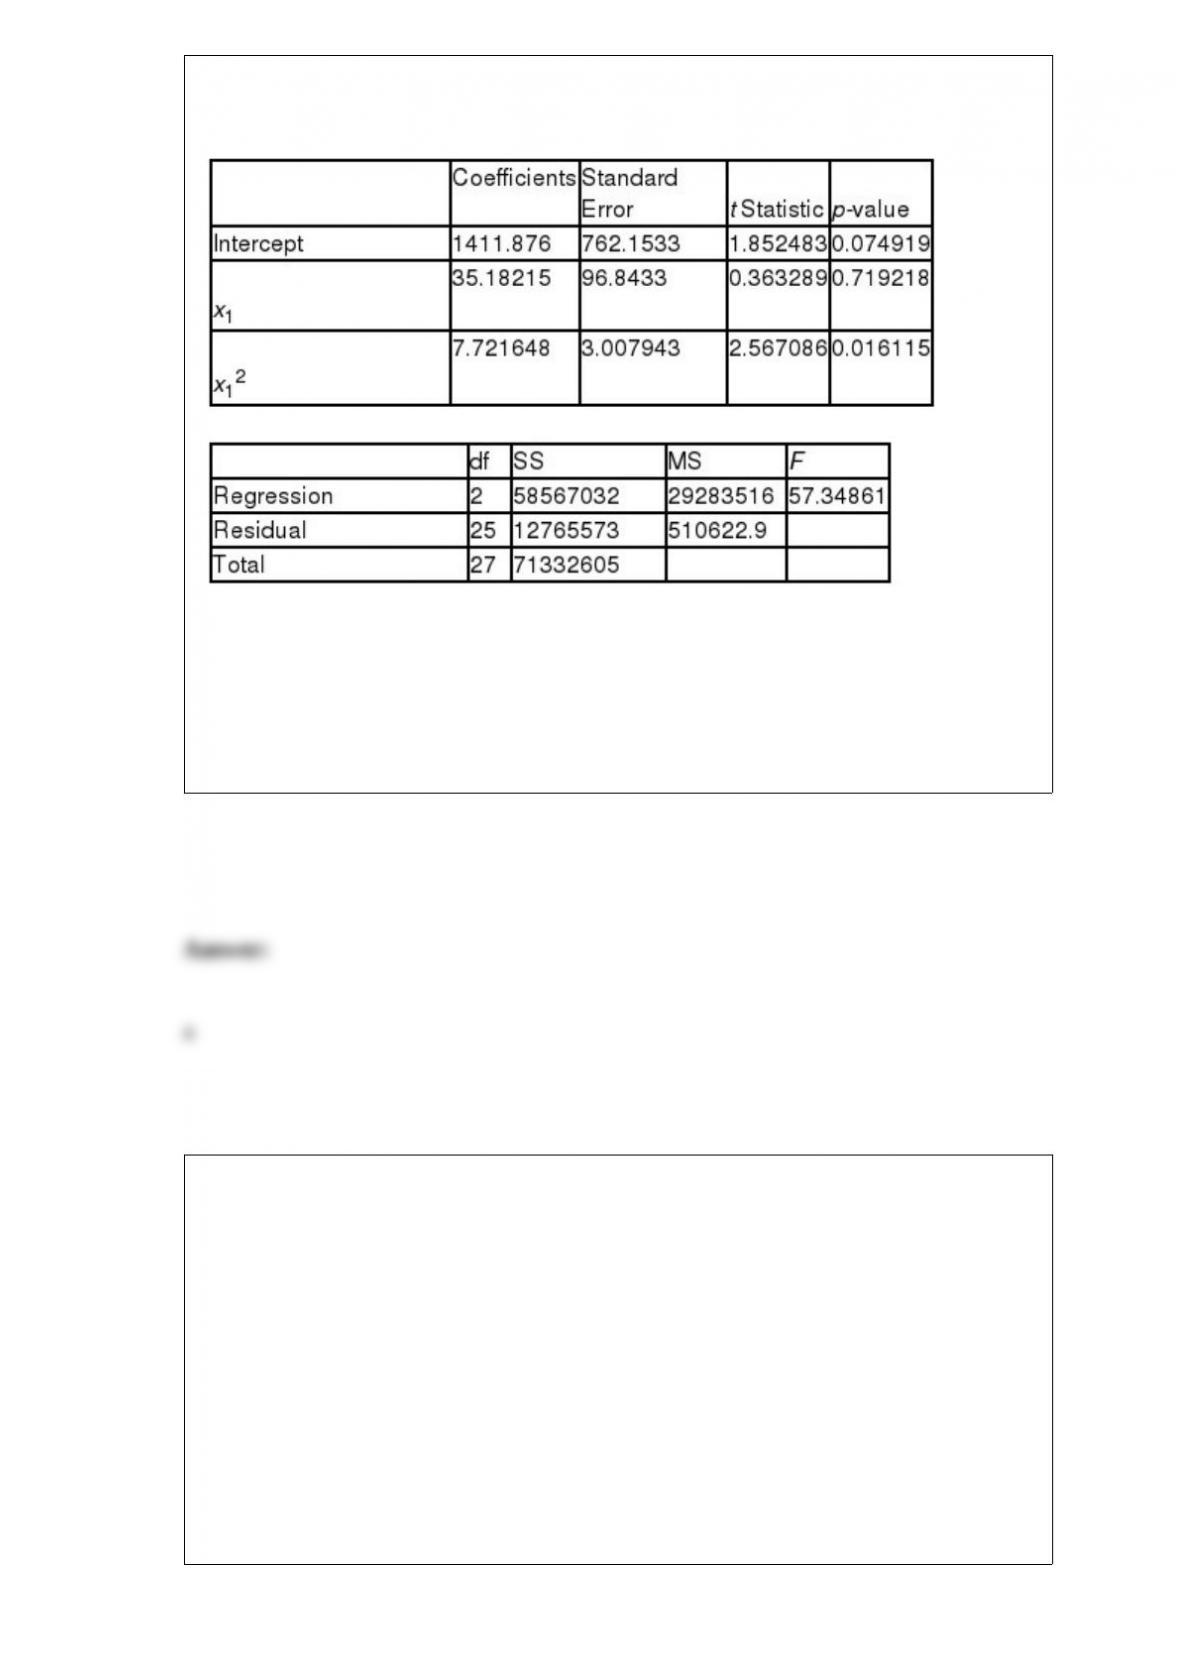
A multiple regression analysis produced the following tables.
For x1= 20, the predicted value of y is ____________.
a) 5,204.18.
b) 2,031.38
c) 2,538.86
d) 6262.19
e) 6,535.86
Morningstar Mutual Funds analyzes the risk and performance of mutual funds. Each
mutual fund is assigned an overall rating of one to five stars. One star is the lowest
rating, and five stars is the highest rating. This level of measurement is __________.
a) ordinal level
b) interval level
c) nominal level
d) ratio level
e) relative level
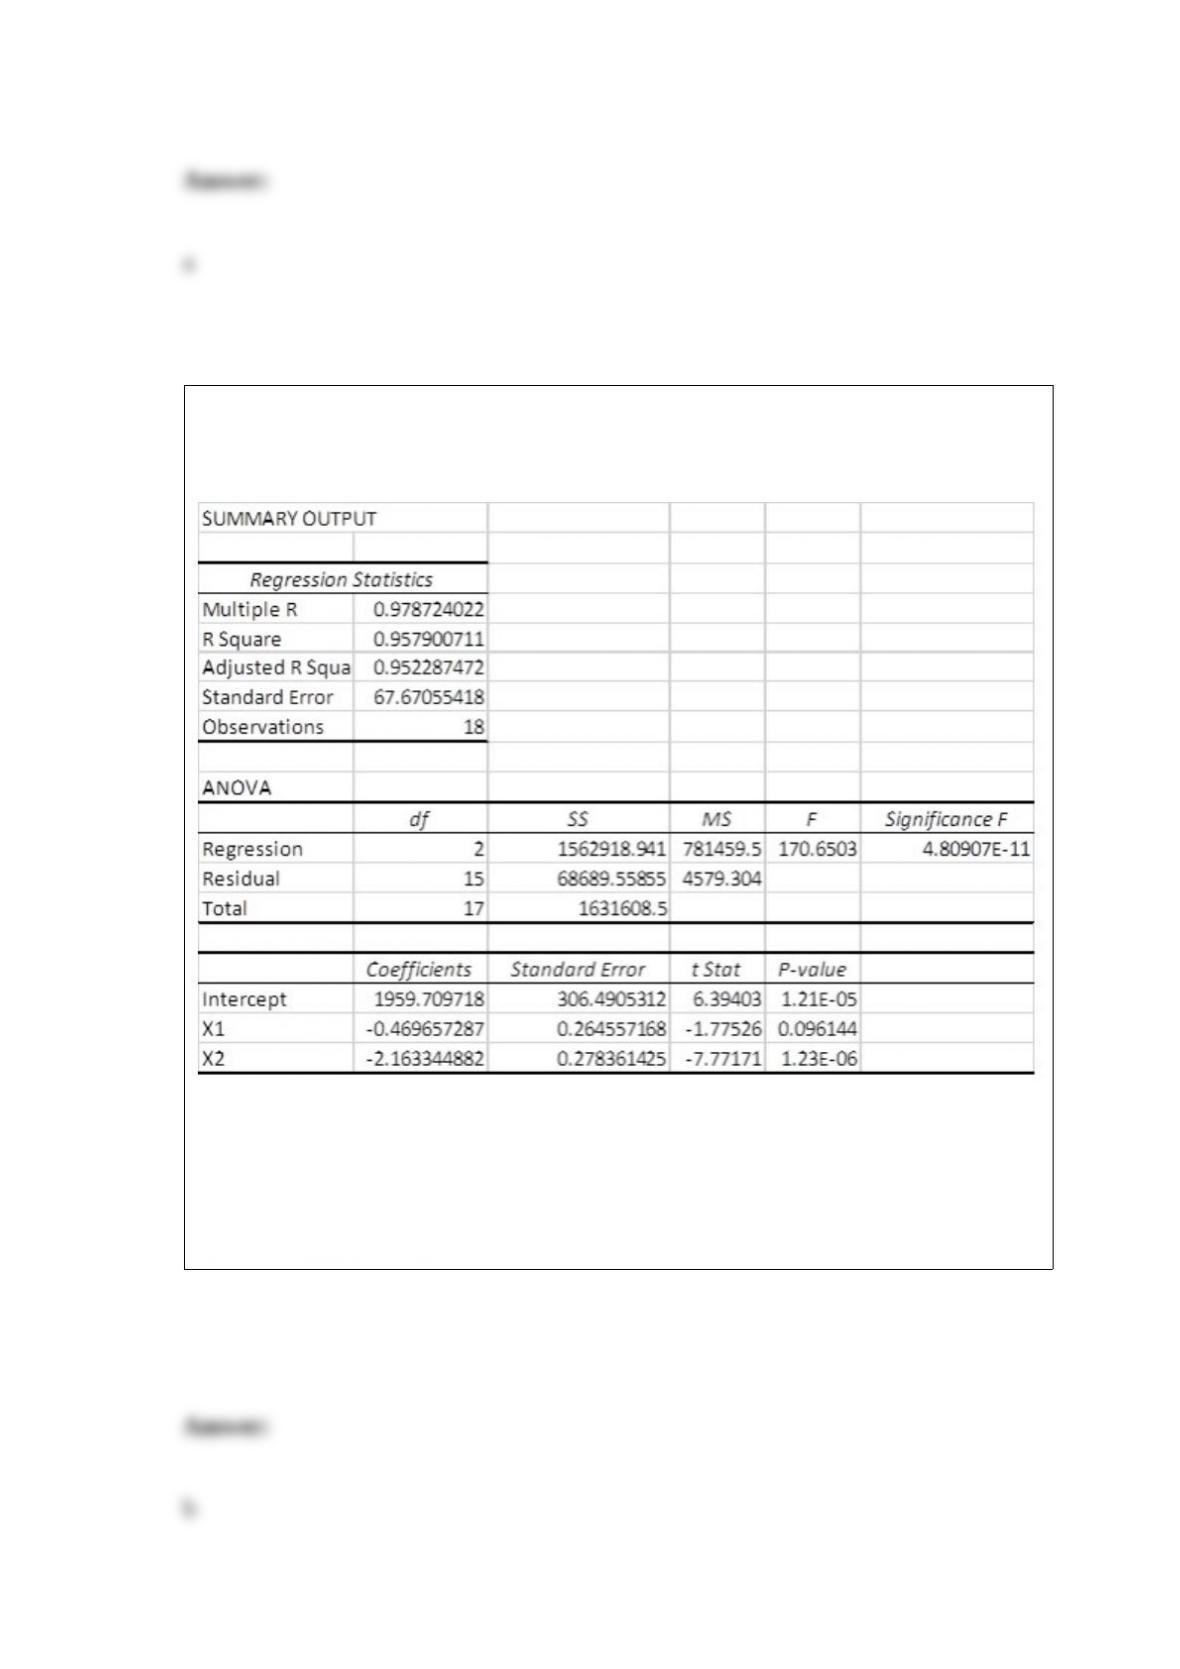
A multiple regression analysis produced the following output from Excel.
The coefficient of multiple determination is ____________.
a) 0.9787
b) 0.9579
c) 0.9523
d) 67.671
e) 0.0489
Which of the following measurement processes is least likely to yield usable data?
a) Counting the number of shoppers entering the department store between 12 pm and 2
pm.
b) Studying cell phone bills and recording the number of text messages sent per month.
c) Performing a consumer survey of preferences in fast food chains
d) Asking students to list three things that are important to them.
e) Calculating the percent of college students who work at least 20 hours while
attending school.
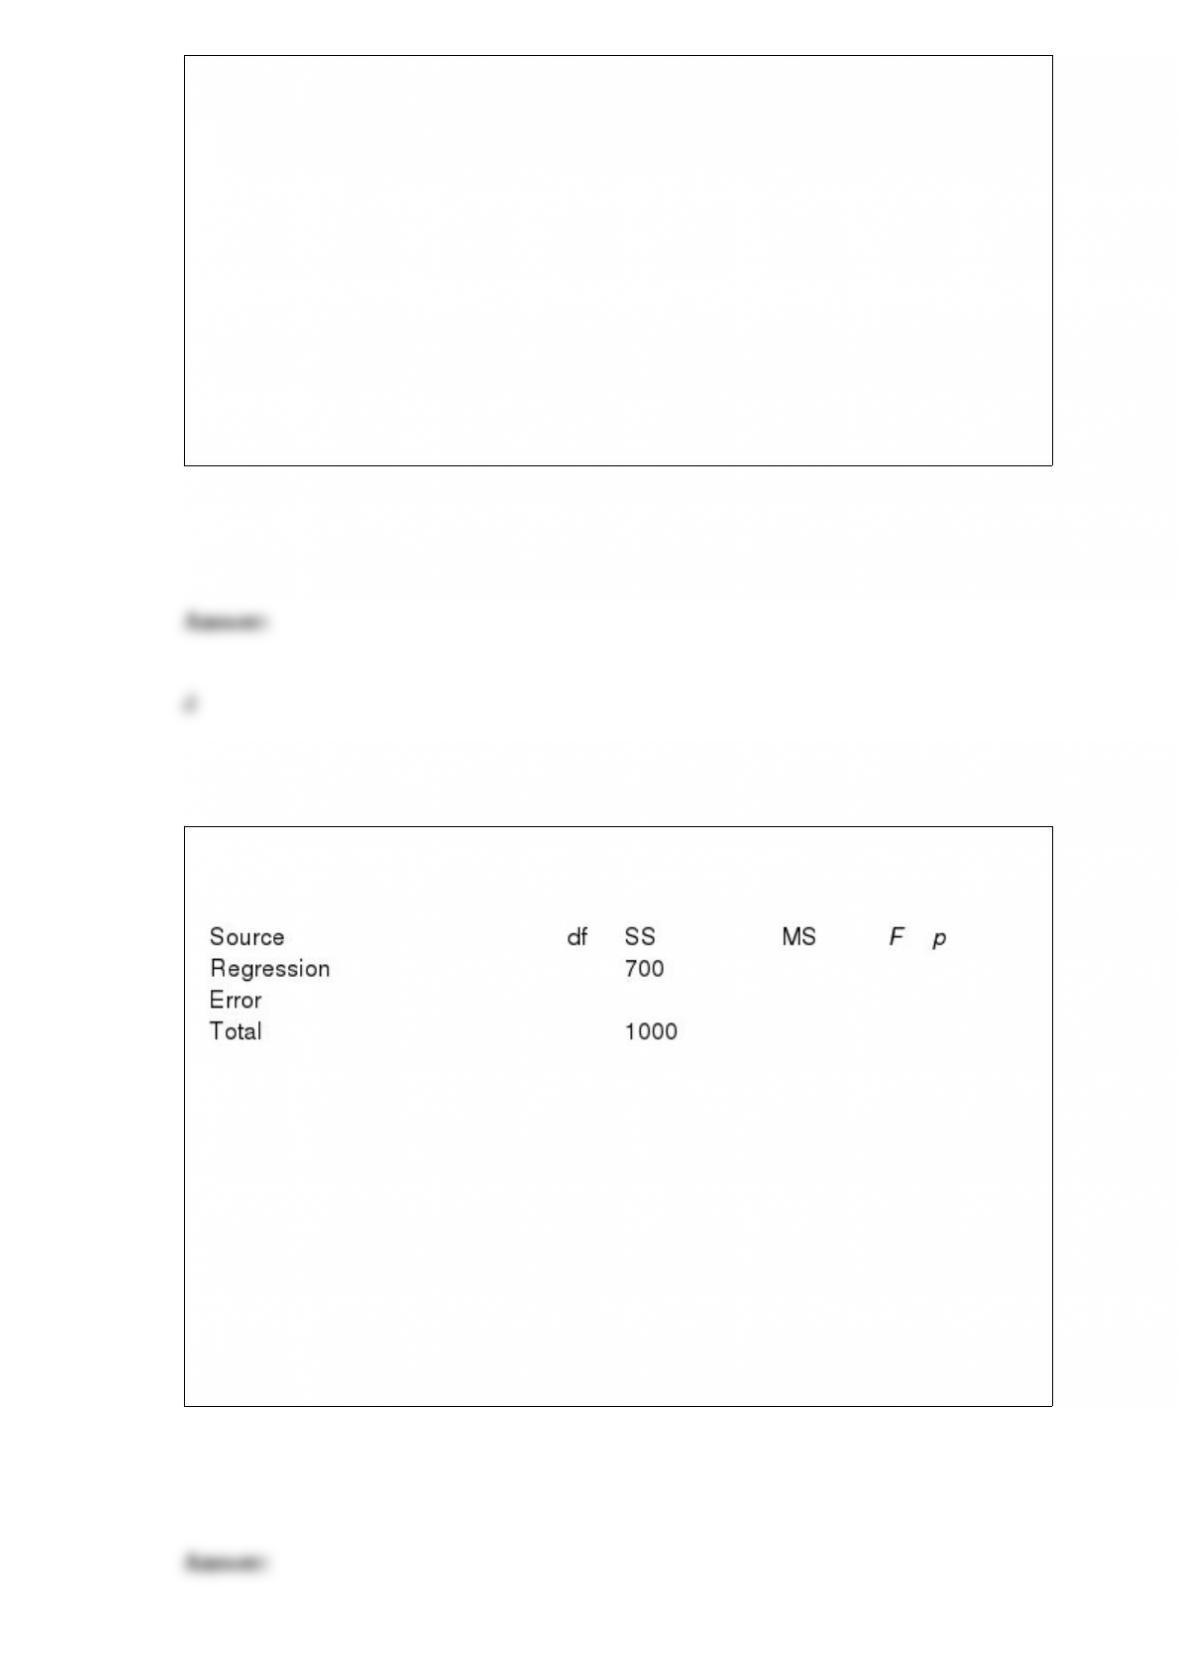
The following ANOVA table is from a multiple regression analysis with n = 35 and four
independent variables.
The value of the standard error of the estimate se is __________.
a) 13.23
b) 3.16
c) 17.32
d) 26.46
e) 10.00

Brian Vanecek, VP of Operations at Portland Trust Bank, is evaluating the service level
provided to walk-in customers. Brian would like to minimize the variance of waiting
time for these customers, since this would mean each customer received the same level
of service. Accordingly, his staff recorded the waiting times for 15 randomly selected
walk-in customers, and determined that their mean waiting time was 15 minutes and
that the standard deviation was 4 minutes. Assume that waiting time is normally
distributed. The 95% confidence interval for the population variance of waiting times is
________.
a) 9.46 to 34.09
b) 56.25 to 64.87
c) 11.05 to 16.03
d) 8.58 to 39.79
e) 12.50 to 42.35
Consider the following decision table with rewards in $ millions.
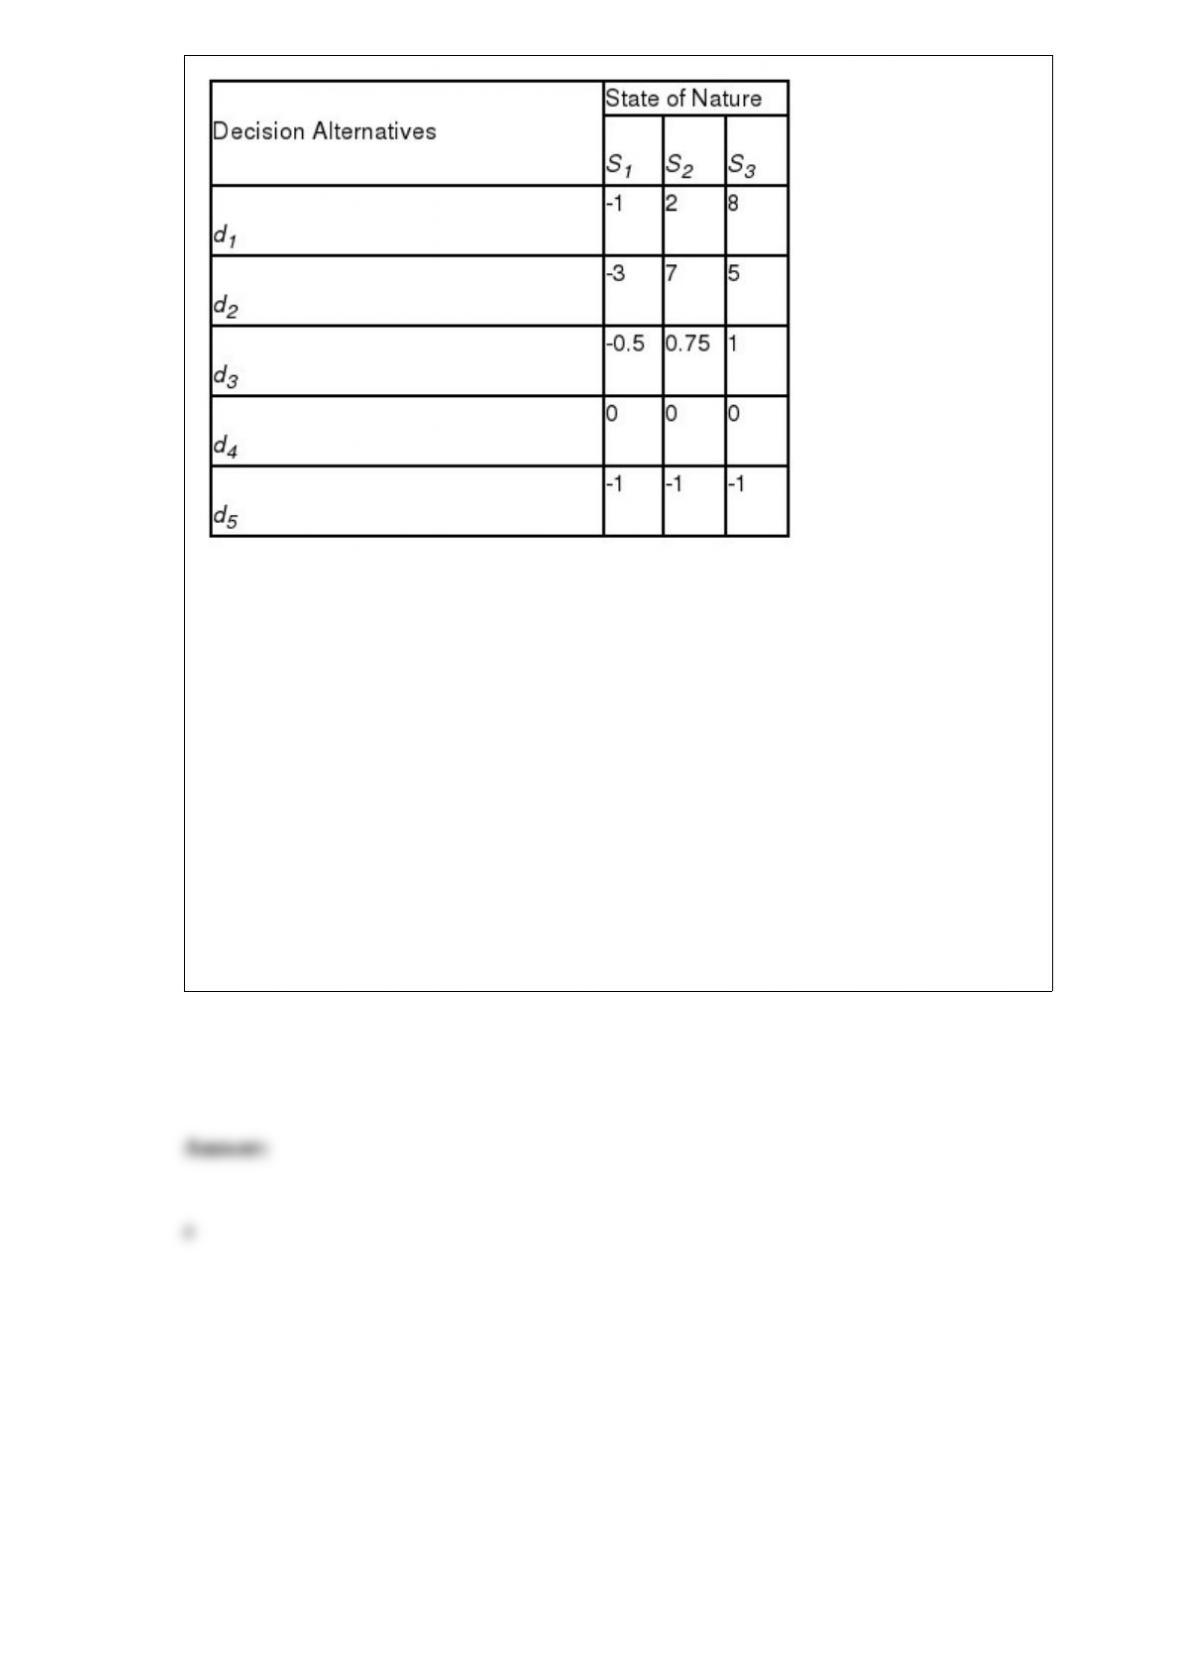
Using the Hurwicz criterion with alpha = 0.2, the appropriate choice would be
________.
a) d1
b) d2
c) d3
d) d4
e) d5