Unlock document.
This document is partially blurred.
Unlock all pages and 1 million more documents.
Get Access

The population mean of income for adults in a particular community is known to be
$28,600. Given this information, the sampling distribution of values will be less than
this depending on the size of the sample used in developing the sampling distribution.
The statistical process control (SPC) chart is one of the most important tools for
identifying important issues to improve quality.
The executive director of the United Way believes that more than 24 percent of the
employees in the high-tech industry have made voluntary contributions to the United
Way. In order to test this statistically, the appropriate null and alternative hypotheses
are:
H0 : ≤ .24
HA : > .24
When developing a scatter diagram, it is appropriate to connect the points on the graph
with straight lines or the lines can be omitted.
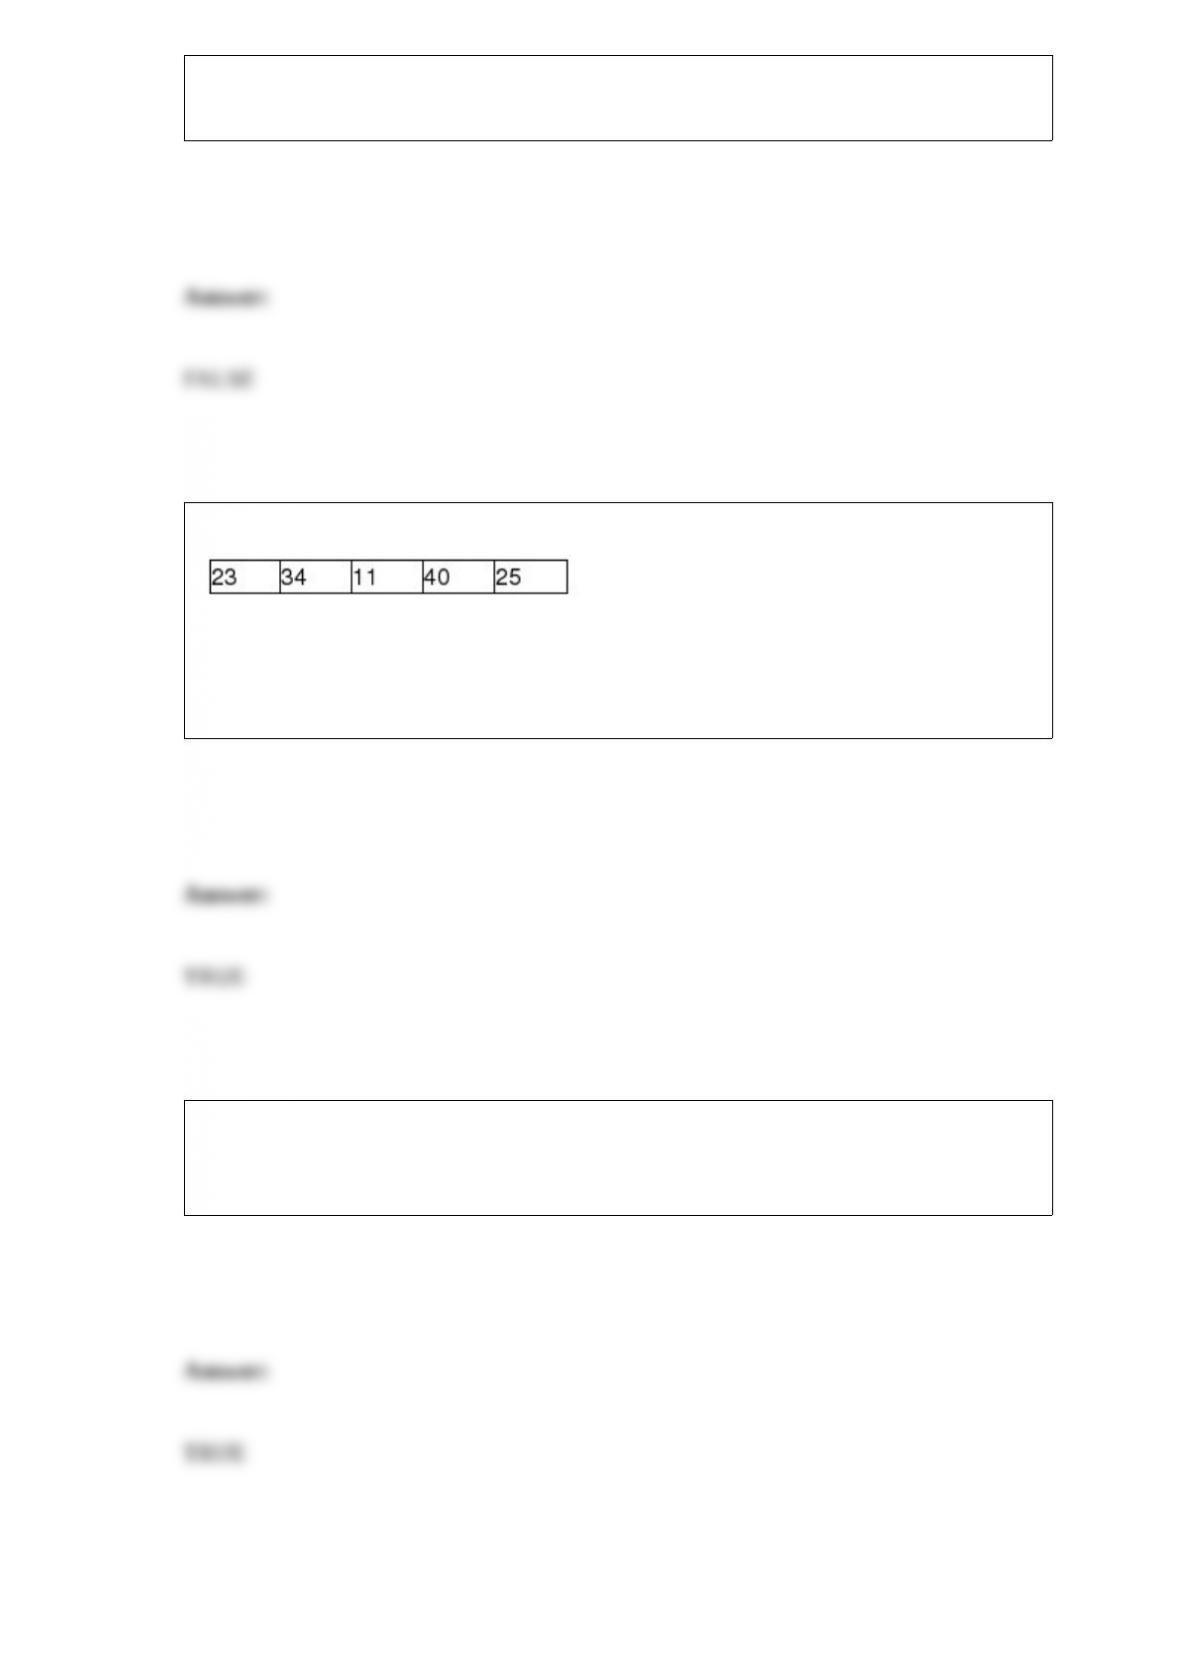
You are given the following data:
If these data were considered to be a population and you computed the mean, you
would get the same answer as if these data were considered to be a sample from a larger
population.
A market research firm that surveys customers in a shopping mall by asking various
people to respond to a short survey about a new product is performing convenience
sampling.
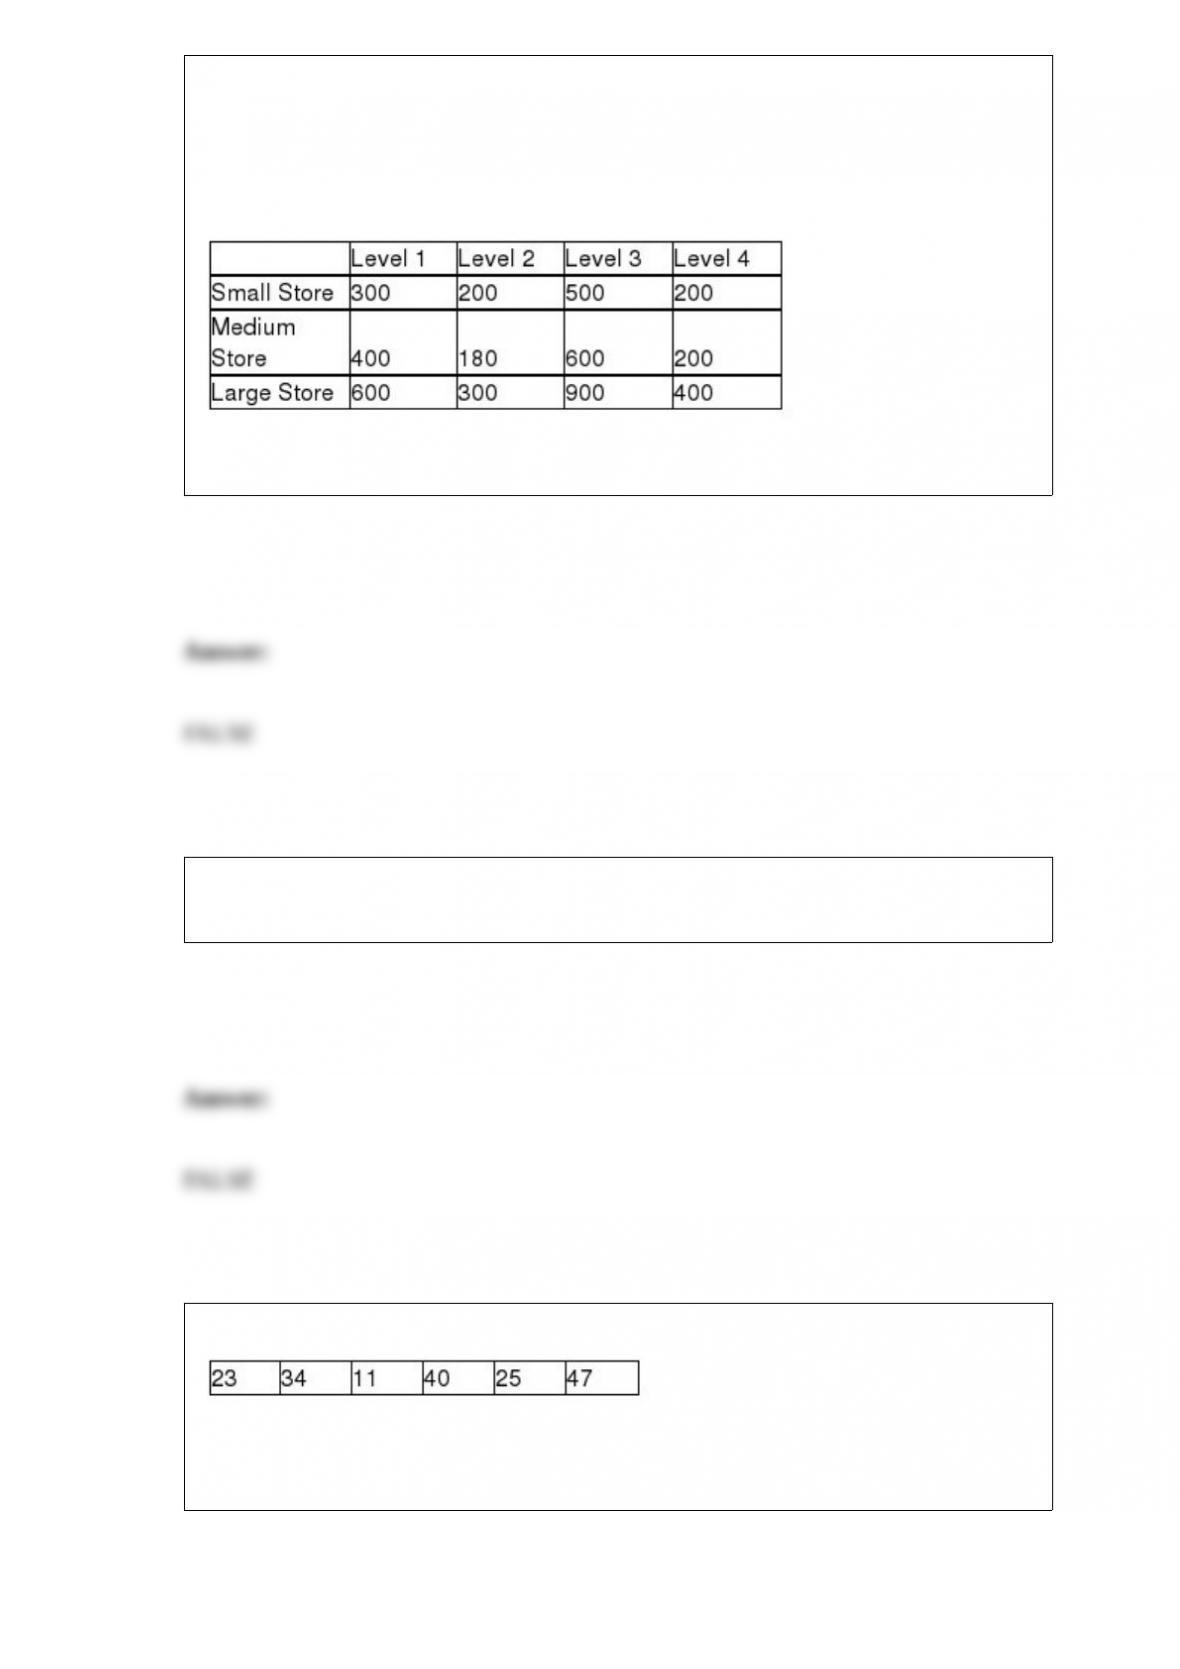
An advertising company is interested in determining if there is a difference in the mean
sales that will be generated for a soft drink company based on which shelf the soft
drinks are located. There are four possible shelf levels. The ad company wants to
control for store size. The following data reflect the sales for one week at each
combination of shelf level and store size.
Based on the experimental design, the number of treatments is two.
When choosing class boundaries for a frequency distribution, classes such as 60-70,
70-80, 80-90 would be acceptable.
You are given the following data:
Assuming that the data reflect the population of interest, the mean of the population is
36.00.

The reason for testing for the presence of autocorrelation in a regression-based trend
forecasting model is that one assumption of the regression analysis is that the residuals
are not correlated.
If a manager were interested in assessing the probability that a new product will be
successful in a New Jersey market area, she would most likely use relative frequency of
occurrence as the method for assessing the probability.
The Varden Packaging Company has a contract to fill 50-gallon barrels with gasoline
for use by the U.S. Army. The machine that Varden uses has an adjustable device that
allows the average fill per barrel to be adjusted as desired. However, the actual
distribution of fill volume from the machine is known to be normally distributed with a
standard deviation equal to 0.5 gallons. The contract that Varden has with the military
calls for no more than 2 percent of all barrels to contain less than 49.2 gallons of
gasoline. Suppose Varden managers are unwilling to set the mean fill at any level higher
than 50 gallons. Given that, in order to meet the requirements, they will need to
increase the standard deviation of fill volume.

A small engine repair shop tracks the number of customers who call each day. This
variable is a time-series variable and also ratio level.
When using the binomial distribution, the maximum possible number of success is the
number of trials.
The sample mean is an estimate of μ and may be either higher or lower than μ
depending on the sample.

Under the basic logic of one-way analysis of variance, if the within variation is large
relative to the between variation, it is an indication that the population means are likely
to be different.
Given a sample of size n = 15 and a sample correlation of r = 0.7, the value of the test
statistic for conducting a hypothesis test of the correlation is t = 3.53.
The F-distribution can only have positive values.
If we are interested in performing a one-tailed, upper-tail hypothesis test about a

population variance where the level of significance is .05 and the sample size is n = 20,
the critical chi-square value to be used is 30.1435.
In a report describing the number of people in the family of each of the 400 employees
at a manufacturing company, the frequency count at the value 3 was 220. This means
that the relative frequency at the 3 level is .44.
The distribution of dollars paid for car insurance by car owners in a major east coast
city is bell-shaped with a mean equal to $750 every six months and a standard deviation
equal to $100. Based on this information we should use Tchebysheff's theorem to
determine the conservative percentage of car owners that will pay between $550 and
$950 for car insurance.
If a state agency wishes to conduct on-site surveys of small businesses throughout the
state, cluster sampling could potentially be used to reduce the geographical area over

which the surveys would need to be conducted.
Harrison Hollow, an upscale eatery in Atlanta, tracks its sales on a daily basis. Recently,
the manager stated that sales over the past three weeks have been very cyclical. Given
the data she has, this statement is not a reasonable one to make.
The actual weight of 2-pound sacks of salted peanuts is found to be normally
distributed with a mean equal to 2.04 pounds and a standard deviation of 0.25 pounds.
Given this information, the probability of a sack weighing more than 2.40 pounds is
0.4251.
The difference between bar charts and histograms is that bar charts always show
percentage while histograms always show frequency.

In a study involving car owners, one question asked the owner for the number of miles
driven last year. A second question asked the owner for the age of the vehicle. A joint
frequency distribution would be useful for determining whether newer cars tend to be
driven more miles than older cars.
Special cause variation is variation in the output of a process that is naturally occurring
and expected and that may be the result of random causes.
The sum of the residuals in a least squares regression model will be zero only when the
correlation between the x and y variables is statistically significant.

In a two-factor ANOVA design with replication, if the null hypothesis pertaining to
interaction between factors A and B is rejected, then it is recommended that the
hypothesis tests for factor A and factor B individually should not be conducted because
the conclusions might be misleading.
The sales data for a company measured weekly for the past year would be considered
cross-sectional data since the sales values are computed from the entire company.
If an analyst computes statistics from a sample, the sample is by definition a statistical
sample.
One of the major automobile makers has developed two new engines. At question is
whether the two engines have the same variability with respect to miles per gallon. To

test this using a significance level equal to 0.10, the following information is available:
Based on this situation and the information provided, the critical value is F = 4.147 .
The random variable, number of customers entering a store between 9 AM and noon, is
an example of a discrete random variable.
If the R-square value for a simple linear regression model is .80, the correlation
between the two variables is known to be .64.

If the probability of a Type I error is set at 0.05, then the probability of a Type II error
will be 0.95.
If a two-tailed Wilcoxon Matched-Pairs Signed Rank test is conducted for a sample of n
= 8 and an alpha level equal to .05, the critical value is:
A) 4
B) 1.96
C) 30
D) 2
Which of the following statements is incorrect?
A) The expected value of a discrete probability distribution is the long-run average
value assuming the experiment will be repeated many times.
B) The standard deviation of a discrete probability distribution measures the average
deviation of the random variable from the mean.
C) The distribution is considered uniform if all the probabilities are equal.
D) The mean of the probability distribution is equal to the square root of the variance.

A consumer products company wants to interview customers regarding a new product.
If it wishes to adhere to a predetermined pattern of questions in the interview, which of
the following would likely be used?
A) Structured interview
B) Open-end questioning
C) Unstructured interview
D) Written questionnaire
The Wilson Company is interested in forecasting demand for its XG-667 product for
quarter 13 based on 12 quarters of data. The following shows the data and the double
exponential smoothing model results for periods 1-12 using alpha = 0.20 and beta =
0.40.
Based on this information, which of the following is the forecast for period 13?
A) About 1,345
B) Just under 1,300
C) Approximately 1,174
D) Nearly 1,225
Consider the following:
How many blocks were used in this study?
A) 10
B) 9
C) 7
D) 8
The probability function for random variable X is specified as:

The expected value of X is
A) 0.333
B) 0.500
C) 2.000
D) 2.333
It is assumed that the time failures for an electronic component are exponentially
distributed with a mean of 50 hours between consecutive failures. If one extra
component is installed as a backup, what is the probability of at least one of the two
components working for at least 60 hours?
A) About 0.51
B) About 0.09
C) About 0.06
D) About 0.70
Which of the following is a correct interpretation for the regression slope coefficient?
A) For a one-unit change in y, we can expect the value of the independent variable to
change by b1 units on average.

B) For each unit change in x, the dependent variable will change by b1 units.
C) The average change in y of a one-unit change in x will be b1 units.
D) The average change in x of a one-unit change in y will be b1 units.
The human resources department at a major high tech company recently conducted an
employee satisfaction survey of 100 of its 3,000 employees. Data were collected on
such variables as age, gender, marital status, current salary, level of overall satisfaction
on a scale from 1 to 5, number of years with the company, and job title. Which of the
following best describes the overall data set that was generated from the study?
A) Cross-sectional data
B) Time-series data
C) Nominal data
D) Quantitative data
In a chi-square goodness-of-fit test, by combining cells we guard against having an
inflated test statistic that could have caused us to:
A) incorrectly reject the H0.

B) incorrectly accept the H0.
C) incorrectly reject the H1.
D) incorrectly accept the H1.
Frequency distributions are specifically for analyzing discrete data.
A random sample of 340 people in Chicago showed that 66 listened to WJKT-1450, a
radio station in South Chicago Heights. Based on this sample information, what is the
point estimate for the proportion of people in Chicago that listen to WJKT-1450?
A) 340
B) About 0.194
C) 1450
D) 66
Of the last 100 customers entering a computer shop, 25 have purchased a computer. If
the classical probability assessment for computing probability is used, the probability
that the next customer will purchase a computer is:
A) 0.25
B) 0.50
C) 1.00
D) 0.75
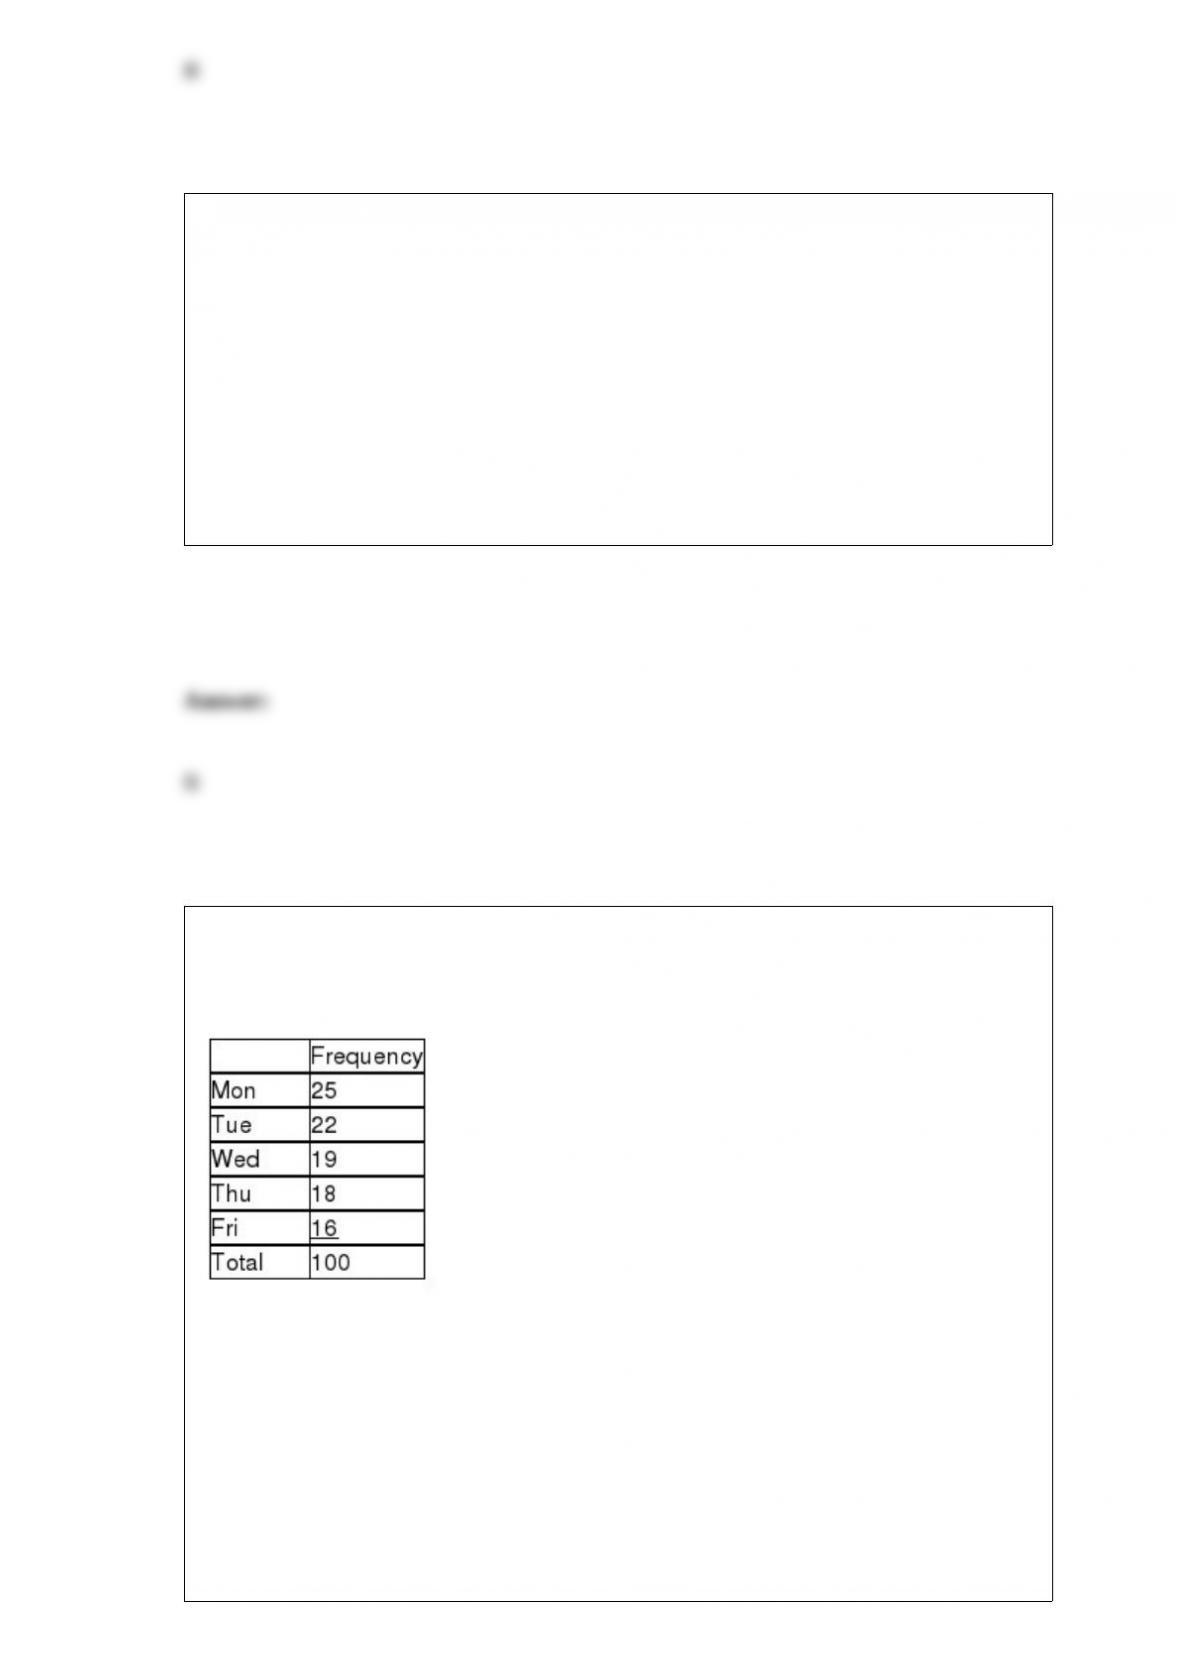
A walk-in medical clinic believes that arrivals are uniformly distributed over weekdays
(Monday through Friday). It has collected the following data based on a random sample
of 100 days.
Assuming that a goodness-of-fit test is to be conducted using a 0.10 level of
significance, the critical value is:
A) 9.4877
B) 11.0705
C) 7.7794
D) 9.2363
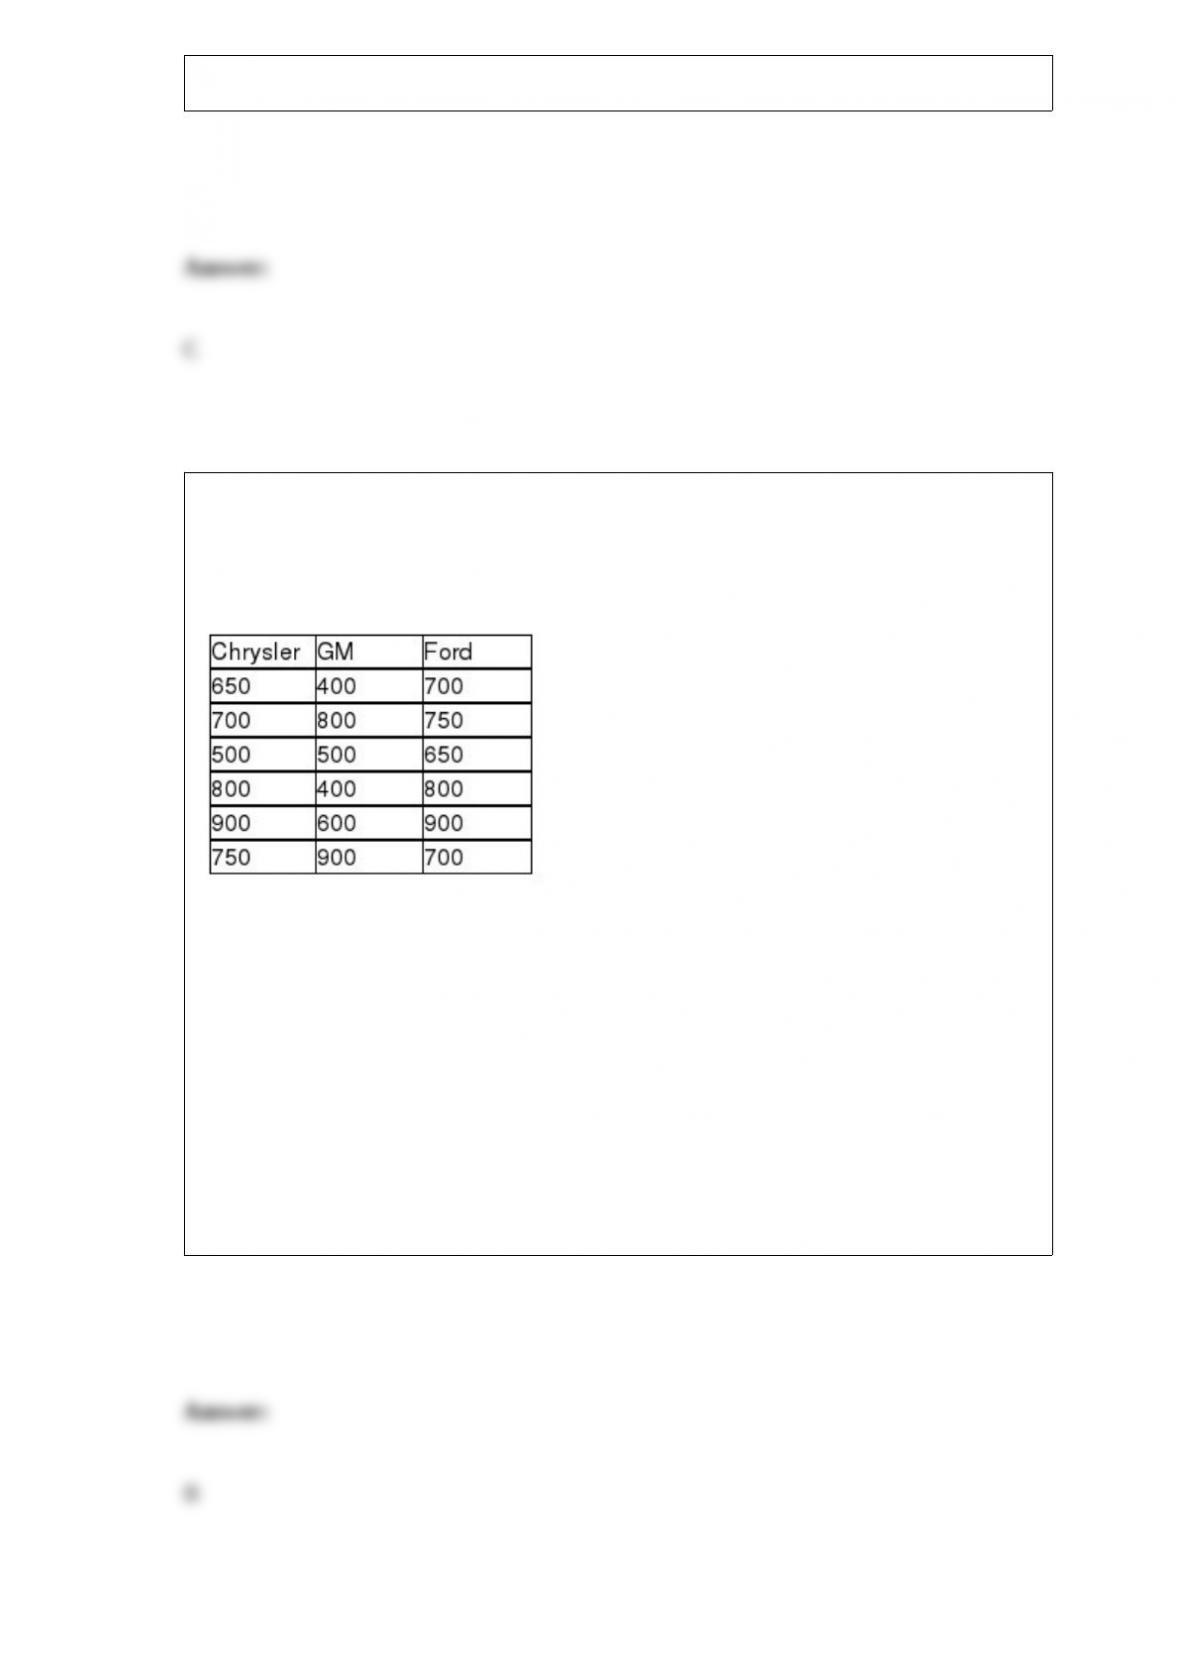
A survey was recently conducted in which random samples of car owners of Chrysler,
GM, and Ford cars were surveyed to determine their satisfaction. Each owner was
asked to rate overall satisfaction on a scale of 1 (poor) to 1000 (excellent). The
following data were recorded:
If the analysts are not willing to assume that the population ratings are normally
distributed and will use the Kruskal-Wallis test to determine if the three companies have
different median ratings, which company has the smallest sum of ranks?
A) Chrysler
B) GM
C) Ford
D) All three are equal.
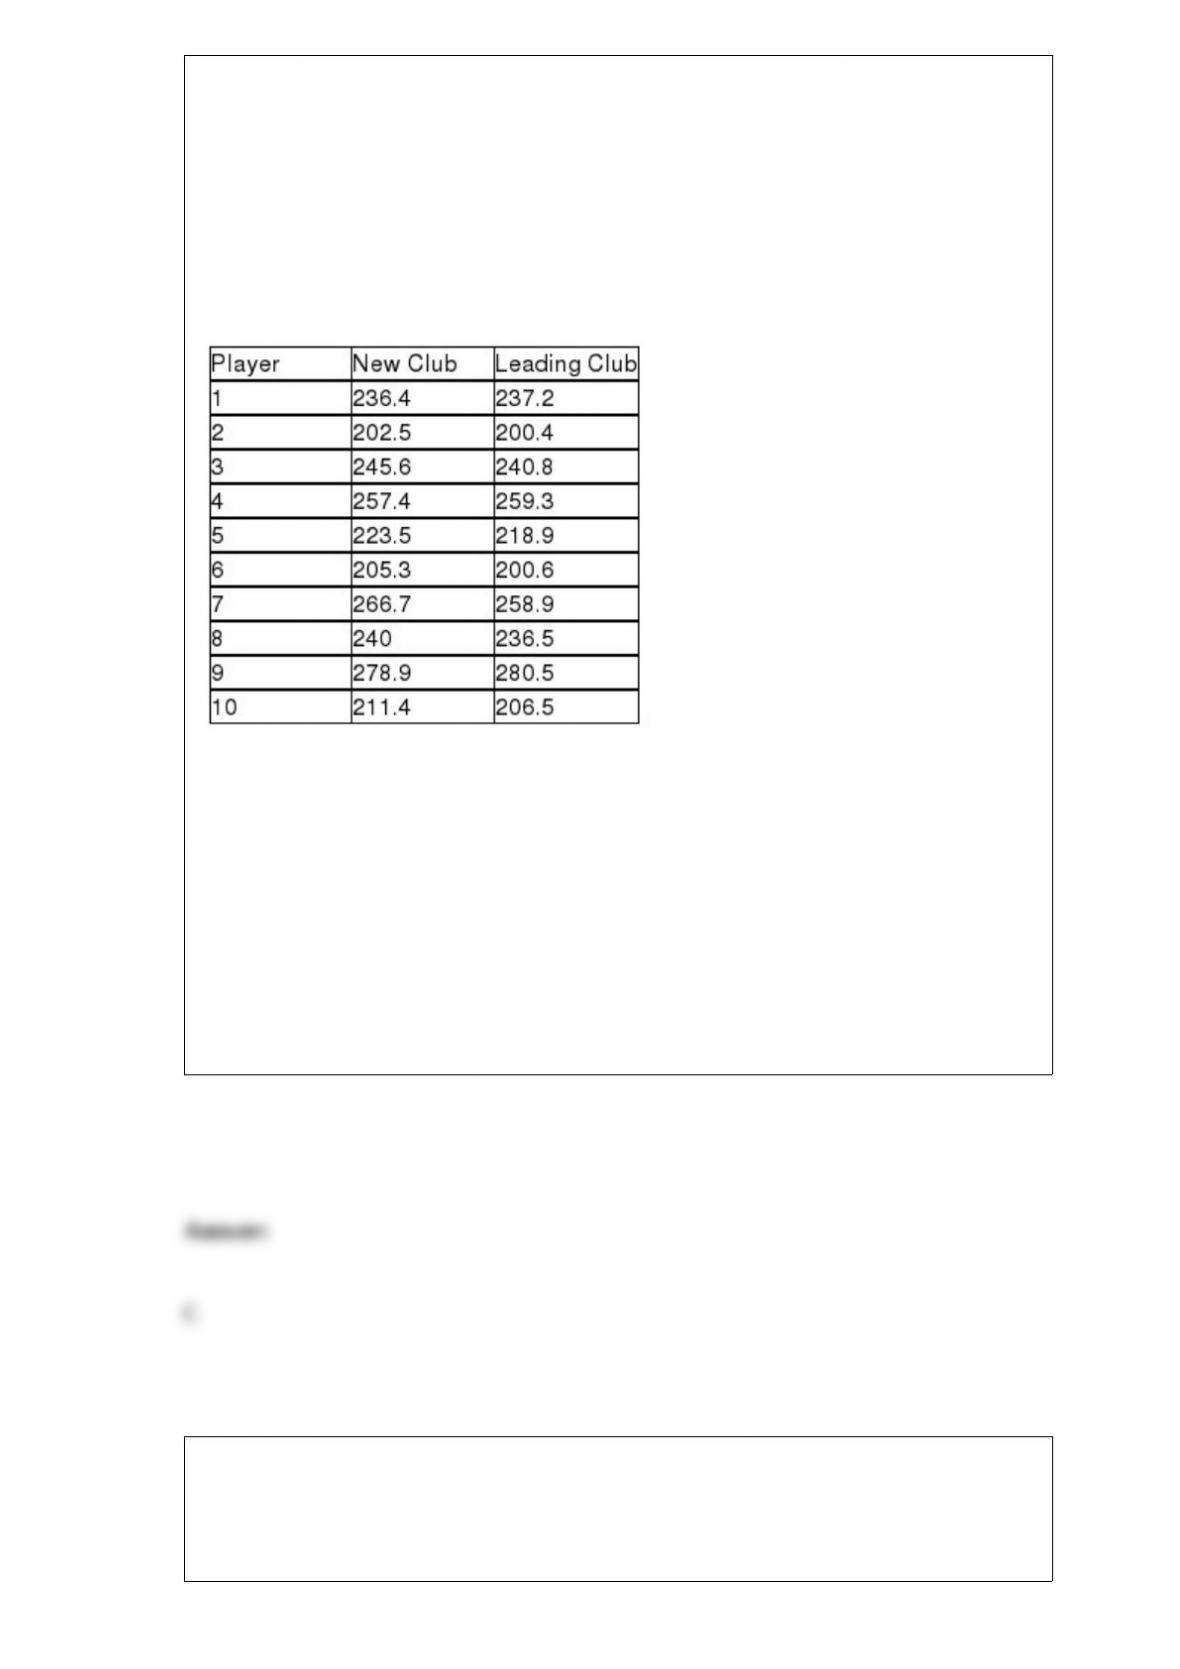
Most companies that make golf balls and golf clubs use a one-armed robot named "Iron
Mike" to test their balls for length and accuracy, but because of swing variations by real
golfers, these test robots don't always indicate how the clubs will perform in actual use.
One company in the golfing industry is interested in testing its new driver to see if it has
greater length off the tee than the best-selling driver. To do this, it has selected a group
of golfers of differing abilities and ages. Its plan is to have each player use each of the
two clubs and hit five balls. It will record the average length of the drives with each
club for each player. The resulting data for a sample of 10 players are:
What is the critical value for the appropriate hypothesis test if the test is conducted
using a 0.05 level of significance?
A) z = 1.645
B) t = 1.7341
C) t = 1.8331
D) t = 2.2622
A national car rental company recently conducted a study recently in which cars with
automatic and standard transmissions (factor A-Sample) were rented to male and female
customers (factor B-Columns). Three customers in each category were randomly
selected and the miles driven per day was recorded as follows:

Based on the design of this study, how many degrees of freedom will be associated with
the mean square for factor A?
A) 1
B) 2
C) 3
D) 8
Incomes in a particular market area are known to be right-skewed with a mean equal to
$33,100. In a report issued recently, a manager stated that at least 89 percent of all
incomes are in the range of $26,700 to $39,500, and this was based on Tchebysheff's
theorem. Given these facts, what is the standard deviation for the incomes in this
market area?
A) Approximately $6,400
B) Approximately $3,200
C) Approximately $2,133
D) Approximately $4266

Given the following information, calculate the degrees of freedom that should be used
in the pooled-standard deviation t-test.
A) df = 41
B) df = 39
C) df = 16
D) df = 25
If we are testing for the difference between the means of two paired populations with
samples of n1 = 20 and n2 = 20, the number of degrees of freedom is equal to:
A) 39
B) 38
C) 19
D) 18
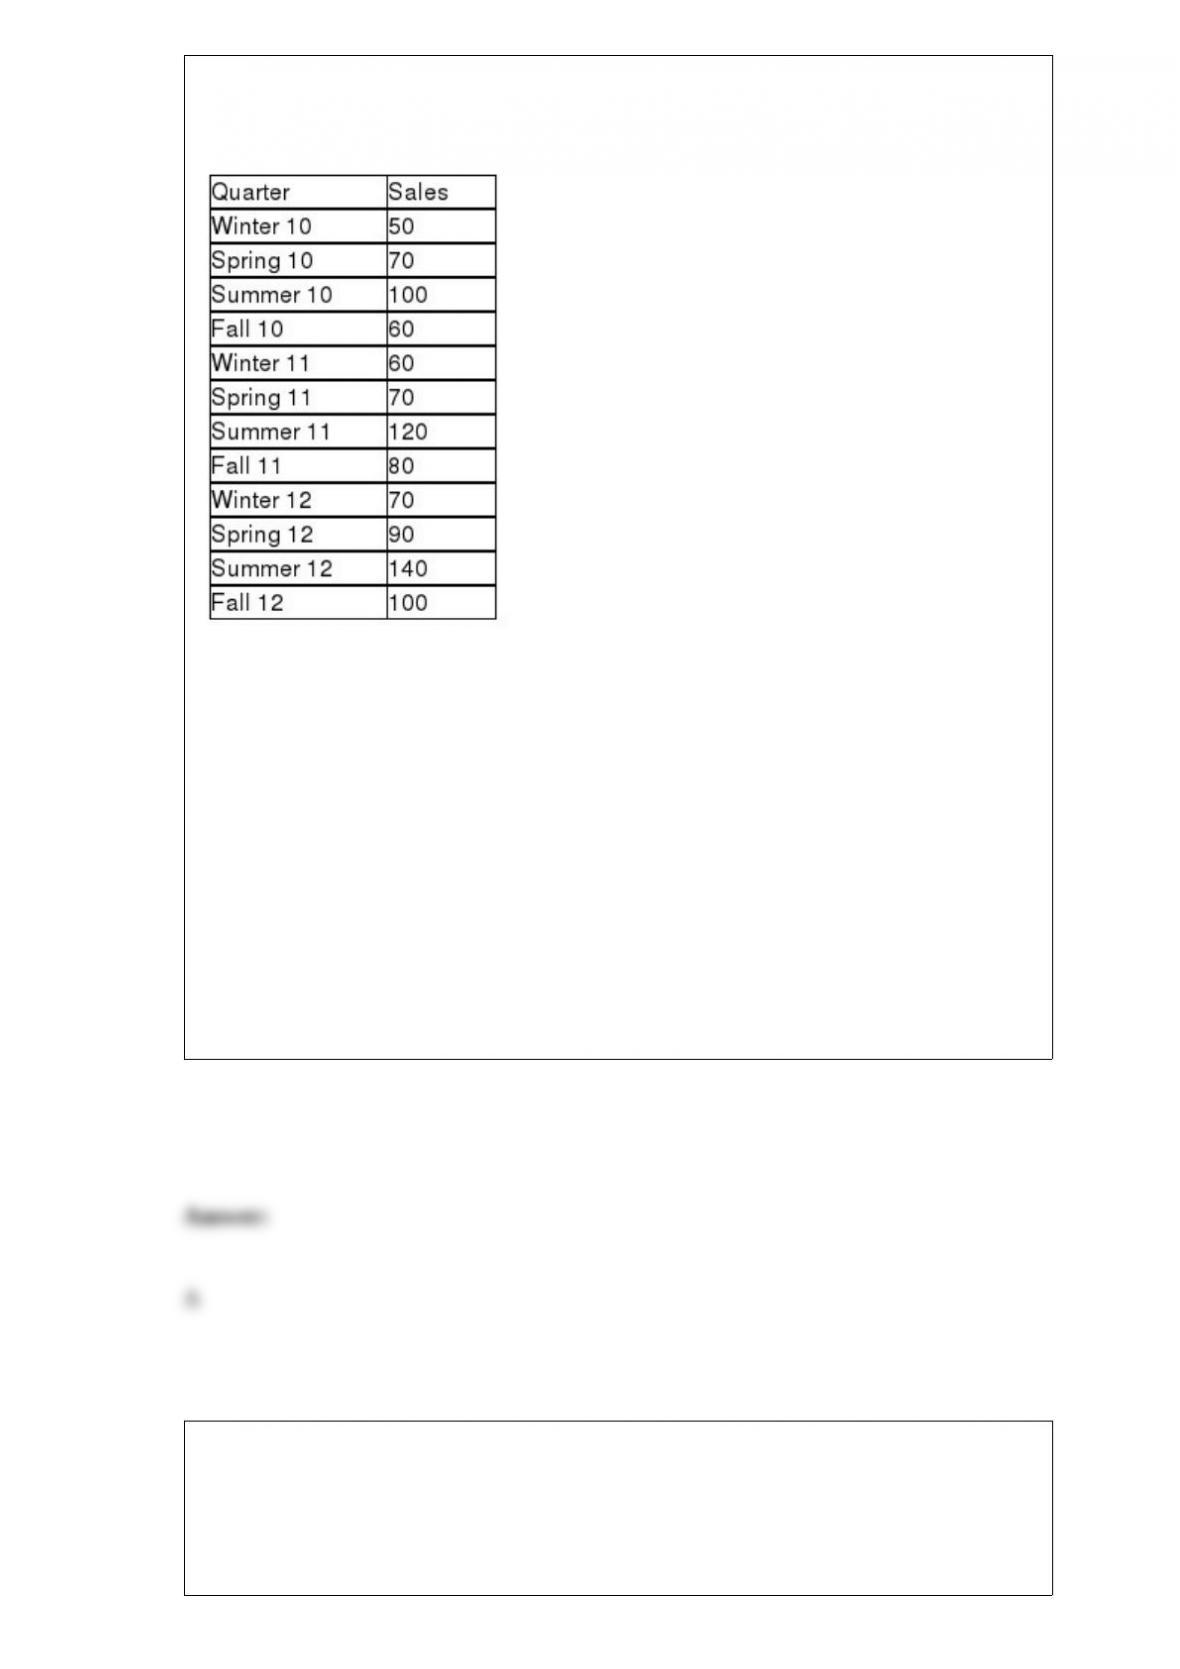
The Boxer Company has been in business since 1998. The following sales data are
recorded by quarter for the years 2010-2012.
The managers at the company wish to determine the seasonal indexes for each quarter
during the year. The first step in the process is to remove the seasonal and random
components. To do this, they will begin by computing a four-period moving average.
They then compute the centered moving average. What is the centered moving average
for Spring '01?
A) 97.5
B) 11.50
C) 89.0
D) 100
If a pair of variables have a strong curvilinear relationship, which of the following is
true?
A) The correlation coefficient will be able to indicate that curvature is present.

B) A scatter plot will not be needed to indicate that curvature is present.
C) The correlation coefficient will not be able to indicate the relationship is curved.
D) The correlation coefficient will be equal to zero.
If the population variances are assumed to be known in an application where a manager
wishes to estimate the difference between two population means, the 95 percent
confidence interval estimate can be developed using which of the following critical
values?
A) z = 1.645
B) z = 1.96
C) t value that depends on the sample sizes from the two populations
D) z = 2.575
A large orchard owner in the state of Washington is interested in determining whether
the mean number of bushels of peaches per acre is the same or different depending on
the type of tree that is used. He also thinks that production may be affected by the type
of fertilizer that is used. To test, he has set up a test in which a one-acre plot of peach
trees with a combination each of 5 varieties and 3 fertilizer types are studied. In this
case, the number of treatments is:
A) 5

B) 3
C) 15
D) Can't be determined without knowing how many trees are planted on each acre.
When estimating a confidence interval for the difference between 2 means using the
method where sample variances are pooled, which of the following assumptions is not
needed?
A) The populations are normally distributed.
B) The populations have equal variances.
C) The samples are independent.
D) The sample sizes are equal.
Which of the following is not among the most common sources of variation?
A) People
B) Materials
C) Methods

D) Quotas
An educational organization in California is interested in estimating the mean number
of minutes per day that children between the age of 6 and 18 spend watching television
per day. A previous study showed that the population standard deviation was 21.5
minutes. The organization selected a random sample of n = 200 children between the
age of 6 and 18 and recorded the number of minutes of TV that each person watched on
a particular day. The mean time was 191.3 minutes. If the leaders of the organization
wish to develop an interval estimate with 95 percent confidence, what will the margin
of error be?
A) Approximately 1.52 minutes
B) About 2.98 minutes
C) z = 1.96
D) Approximately 42.14 minutes
An educational organization in California is interested in estimating the mean number
of minutes per day that children between the age of 6 and 18 spend watching television
per day. A previous study showed that the population standard deviation was 21.5
minutes. The organization selected a random sample of n = 200 children between the
age of 6 and 18 and recorded the number of minutes of TV that each person watched on
a particular day. The mean time was 191.3 minutes. If the leaders of the organization
wish to develop an interval estimate with 98 percent confidence, what would be the
upper and lower limits of the interval estimate?

A) Approximately 187.76 minutes - 194.84 minutes
B) About 141.21 minutes - 241.40 minutes
C) Approximately 188.3 minutes - 194.3 minutes
D) None of the above
In an application to estimate the mean number of miles that downtown employees
commute to work roundtrip each day, the following information is given:
n = 20
= 4.33
s = 3.50
The point estimate for the true population mean is:
A) 1.638
B) 4.33 1.638
C) 4.33
D) 3.50
When using regression analysis for descriptive purposes, which of the following is of

importance?
A) The size of the regression slope coefficient
B) The sign of the regression slope coefficient
C) The standard error of the regression slope coefficient
D) All of the above
Which of the following statements is true?
A) If the confidence interval estimate for the regression slope coefficient crosses over
zero, the average change in y for a one-unit change in x may be zero.
B) If the regression slope coefficient is very close to zero, this means that the
relationship between the x and y variables is statistically insignificant.
C) A statistically significant regression slope coefficient indicates that for a one-unit
change in y there will be a positive change in x by an amount equal to the regression
slope coefficient.
D) It is acceptable to make predictions for y using x values that are outside the range of
the data that was used in the regression.
In the finding the critical value for the Wilcoxon signed rank test, what does "n"
represent?

A) The number of observations in the sample
B) The number of pairs
C) The number of nonzero deviations
D) The number of positive ranks


