It is possible for an interviewer to interject bias into the data collection project by the
way he or she asks the questions.
The prediction interval developed from a simple linear regression model will be at its
narrowest point when the value of x used to predict y is equal to the mean value of x.
The State Department of Forests has determined that annual tree growth in a particular
forest area is normally distributed with a mean equal to 17 inches and a standard
deviation equal to 6 inches. If 2 trees are randomly chosen, the probability that both
trees will have grown more than 20 inches during the year is approximately .037.
The bottlers of a new fruit juice daily select a random sample of 12 bottles of the drink
to estimate the mean quantity of juice in the bottles filled that day. On one such day, the
following results were observed: = 12.03; s = 0.12. Based on this information, the
upper limit for a 95 percent confidence interval estimate is approximately 12.106
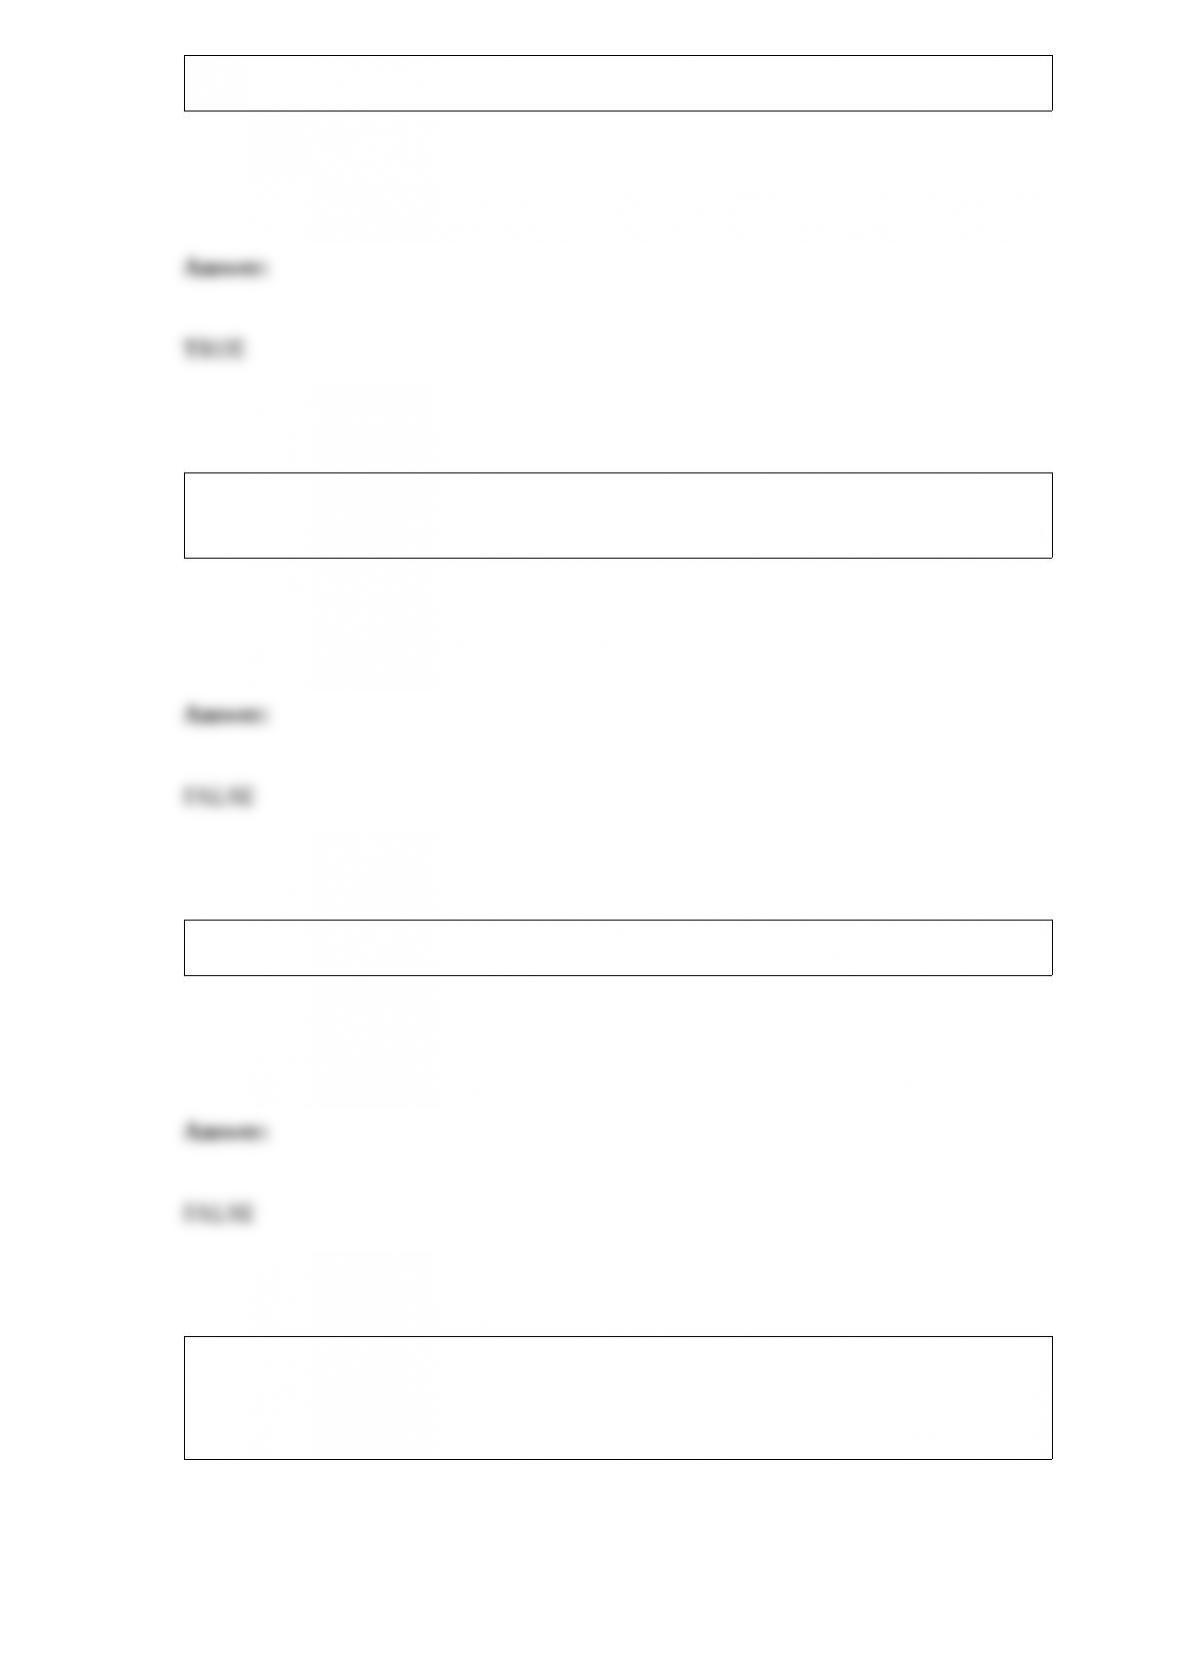
ounces.
One of the characteristics of the binomial distribution is that the probability of success
for each trial depends on whether the previous trial was a success or not.
A stem and leaf diagram is most similar to a bar chart.
From an annual time series of a company’s sales the linear trend model Ft = 127 + 54(t)
has been developed. This means that on average sales have been increasing by 127 per
year.
The Nationwide Motel Company has determined that 70 percent of all calls for motel
reservations request nonsmoking rooms. Recently, the customer service manager for the
company randomly selected 25 calls. Assuming that the distribution of calls requesting
nonsmoking rooms is described by a binomial distribution, the expected number of
requests for nonsmoking rooms is 14.
Residuals are calculated by e = y – .
Consider the following scatter plot:
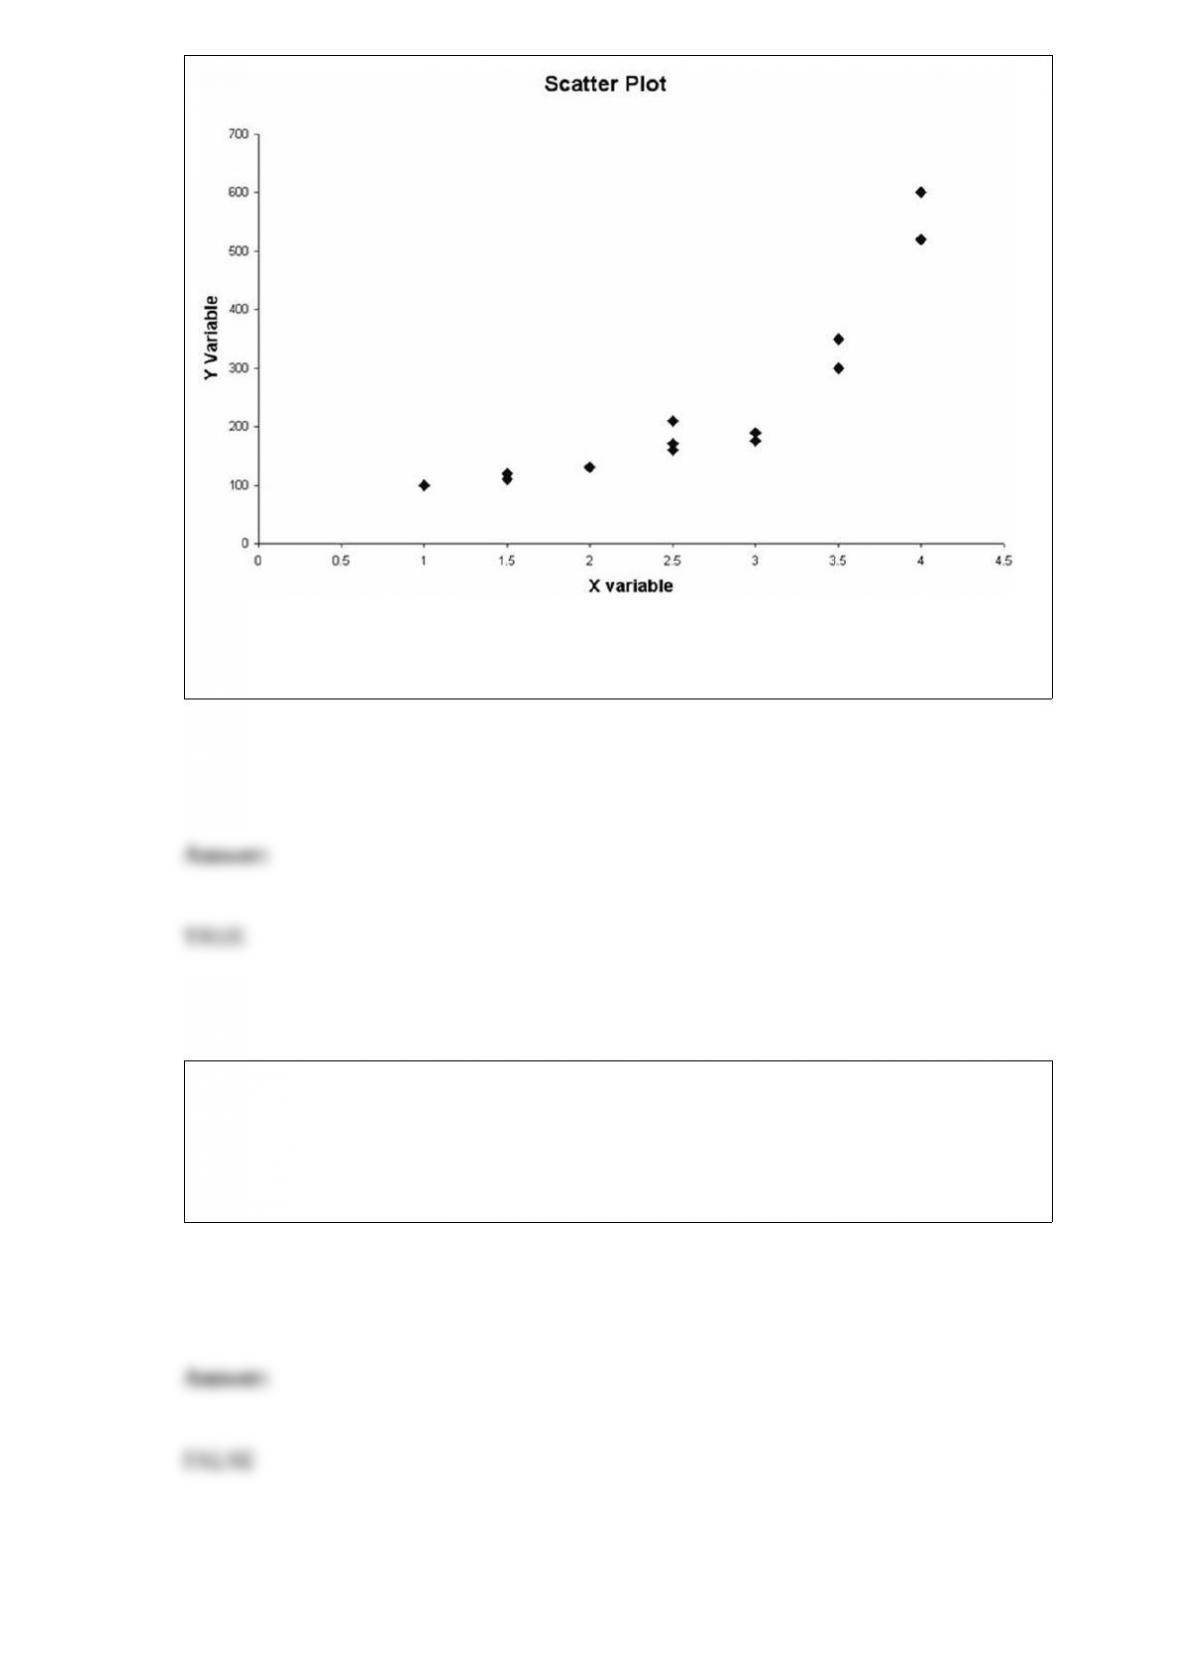
Given the apparent relationship between the x and y variable, a possible curvilinear
regression model to consider would be a second-order polynomial model.
A potato chip manufacturer has two packaging lines and wants to determine if the
variances differ between the two lines. They take samples of n1 = 10 bags from line 1
and n2 = 8 bags from line 2. To perform the hypothesis test at the 0.05 level of
significance, the critical value is F = 3.68.
When the median of a data set is 110 and the mean is 127, the percentile associated with
the mean must be higher than 50 percent.
In order for a time series to exhibit a seasonal component, the data must be measured in
periods as short or shorter than quarterly.
The reason that a decision maker might want to combine groups before performing a
goodness-of-fit test is to avoid accepting the null hypothesis due to an inflated value of
the test statistic.
A study was recently conducted by Major League Baseball to determine whether there
is a correlation between attendance at games and the record of home team’s opponent.
In this study, the dependent variable would be the record of the home team’s opponent.
If the R-squared value for a regression model is high, the regression model will
necessarily provide accurate forecasts of the y variable.
The method of data collection called direct observation is always associated with
gathering data from people.
When using the p-value method, the null hypothesis is rejected when the calculated
p-value > α.
A correlation coefficient computed from a sample of data values selected from a
population is called a statistic and is subject to sampling error.
The managers for a vegetable canning facility claim the standard deviation for the
ounces per can on the new automated line is less than for the older manual line. Given
this, the correct null and alternative hypotheses for performing the statistical test are:
H0 : σ1 = σ2
Ha : σ1 ≠ σ2
The multiple coefficient of determination measures the percentage of variation in the
dependent variable that is explained by the independent variables in the model.
The time it takes a parent to assemble a children’s bicycle has been shown to be
normally distributed with a mean equal to 295 minutes with a standard deviation equal
to 45 minutes. Given this information, the probability that it will take a randomly
selected parent more than 220 minutes is about 0.0475.
When the salesperson makes a sale, there are three possible sales levels: large, medium,
and small. The probability of a large sale is 0.20 and the chance of a medium sale is
0.60. If a salesperson makes two sales, the probability that at least one is large is 0.36.
Close-end questions provide the greatest opportunity to obtain ideas and thoughts on
the part of those surveyed but the resulting data are more difficult to analyze.
Process control charts are used to provide signals to indicate when the output of a
process is out of control.
A common underpinning of all statistical sampling techniques is the concept of random
selection.
We expect virtually all the data in a stable process to fall within 2 standard deviations of
the mean.
In employing the Mann-Whitney U test, the sample data from the two populations are
first combined and the ranks of the data are determined, but we keep track of which
population each ranked item came from.
The critical value for a one-tailed Mann-Whitney U test with sample sizes of n1 = 10
and n2 = 10 is 23 for a 0.05 level of significance.
A report recently published in a major business periodical stated that the average salary
for female managers is less than $50,000. If we were interested in testing this, the
following null and alternative hypotheses would be established:
H0 : μ ≥ 50,000
Hα : μ < 50,000
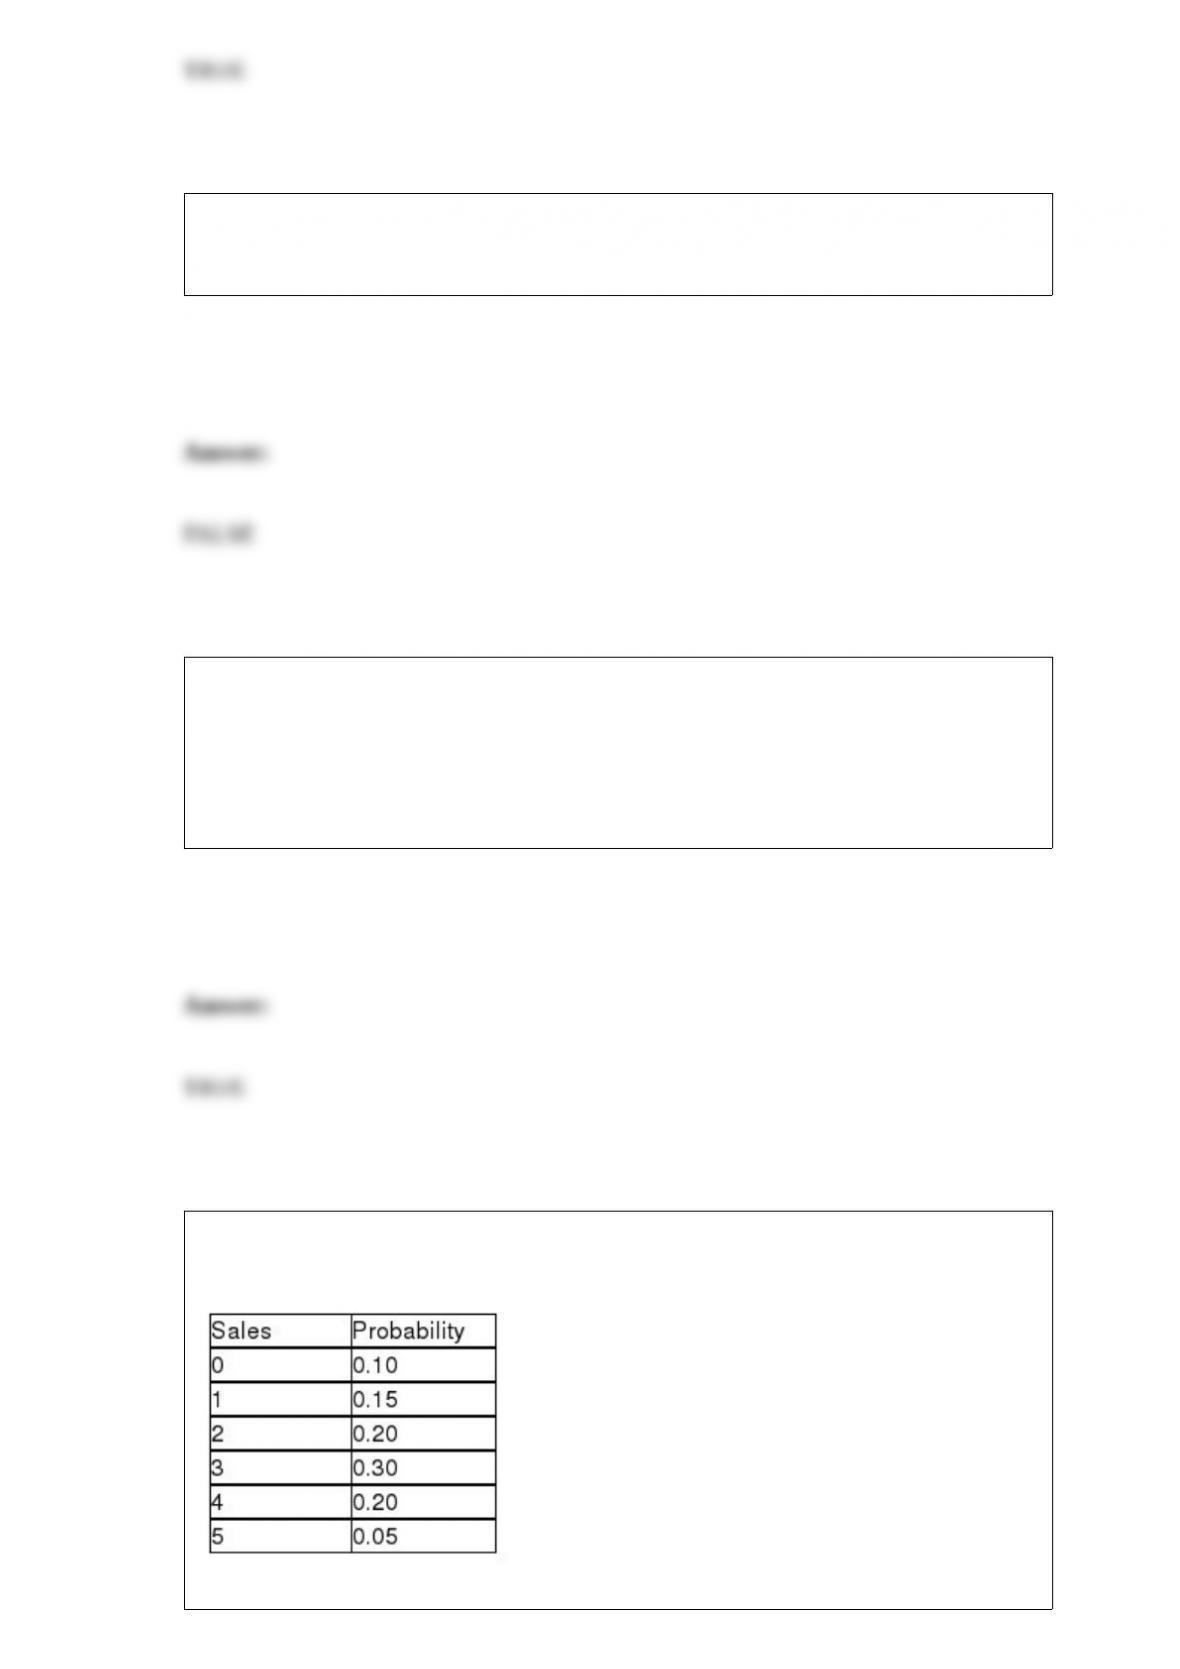
The following probability distribution was subjectively assessed for the number of sales
a salesperson would make if he or she made five sales calls in one day.
When the salesperson makes a sale, there are three possible sales levels: large, medium,
and small. The probability of a large sale is 0.20 and the chance of a medium sale is
0.60. The probability on a given day that the salesperson will make one sale and that it
is medium is 0.09.
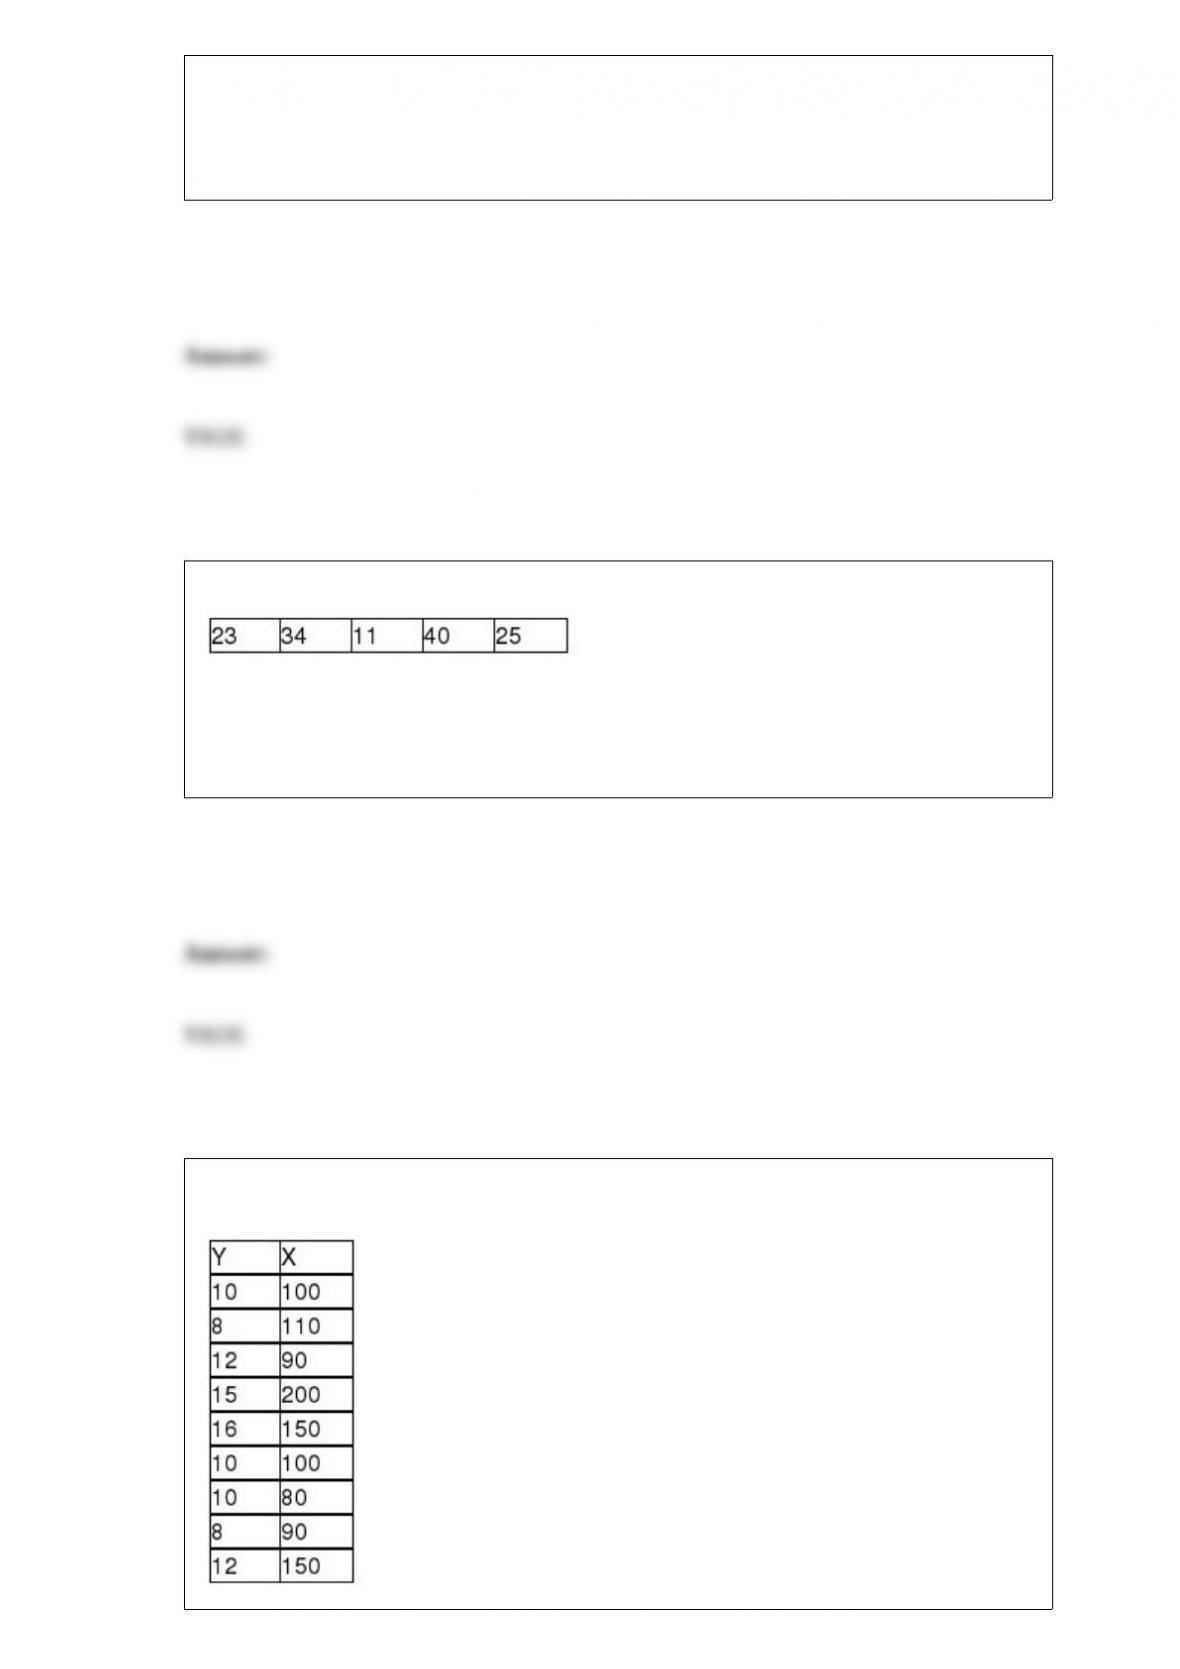
You are given the following data:
If these data were considered to be a population and you computed the mean, you
would get the same answer as if these data were considered to be a sample from a larger
population.
You are given the following sample data for two variables:
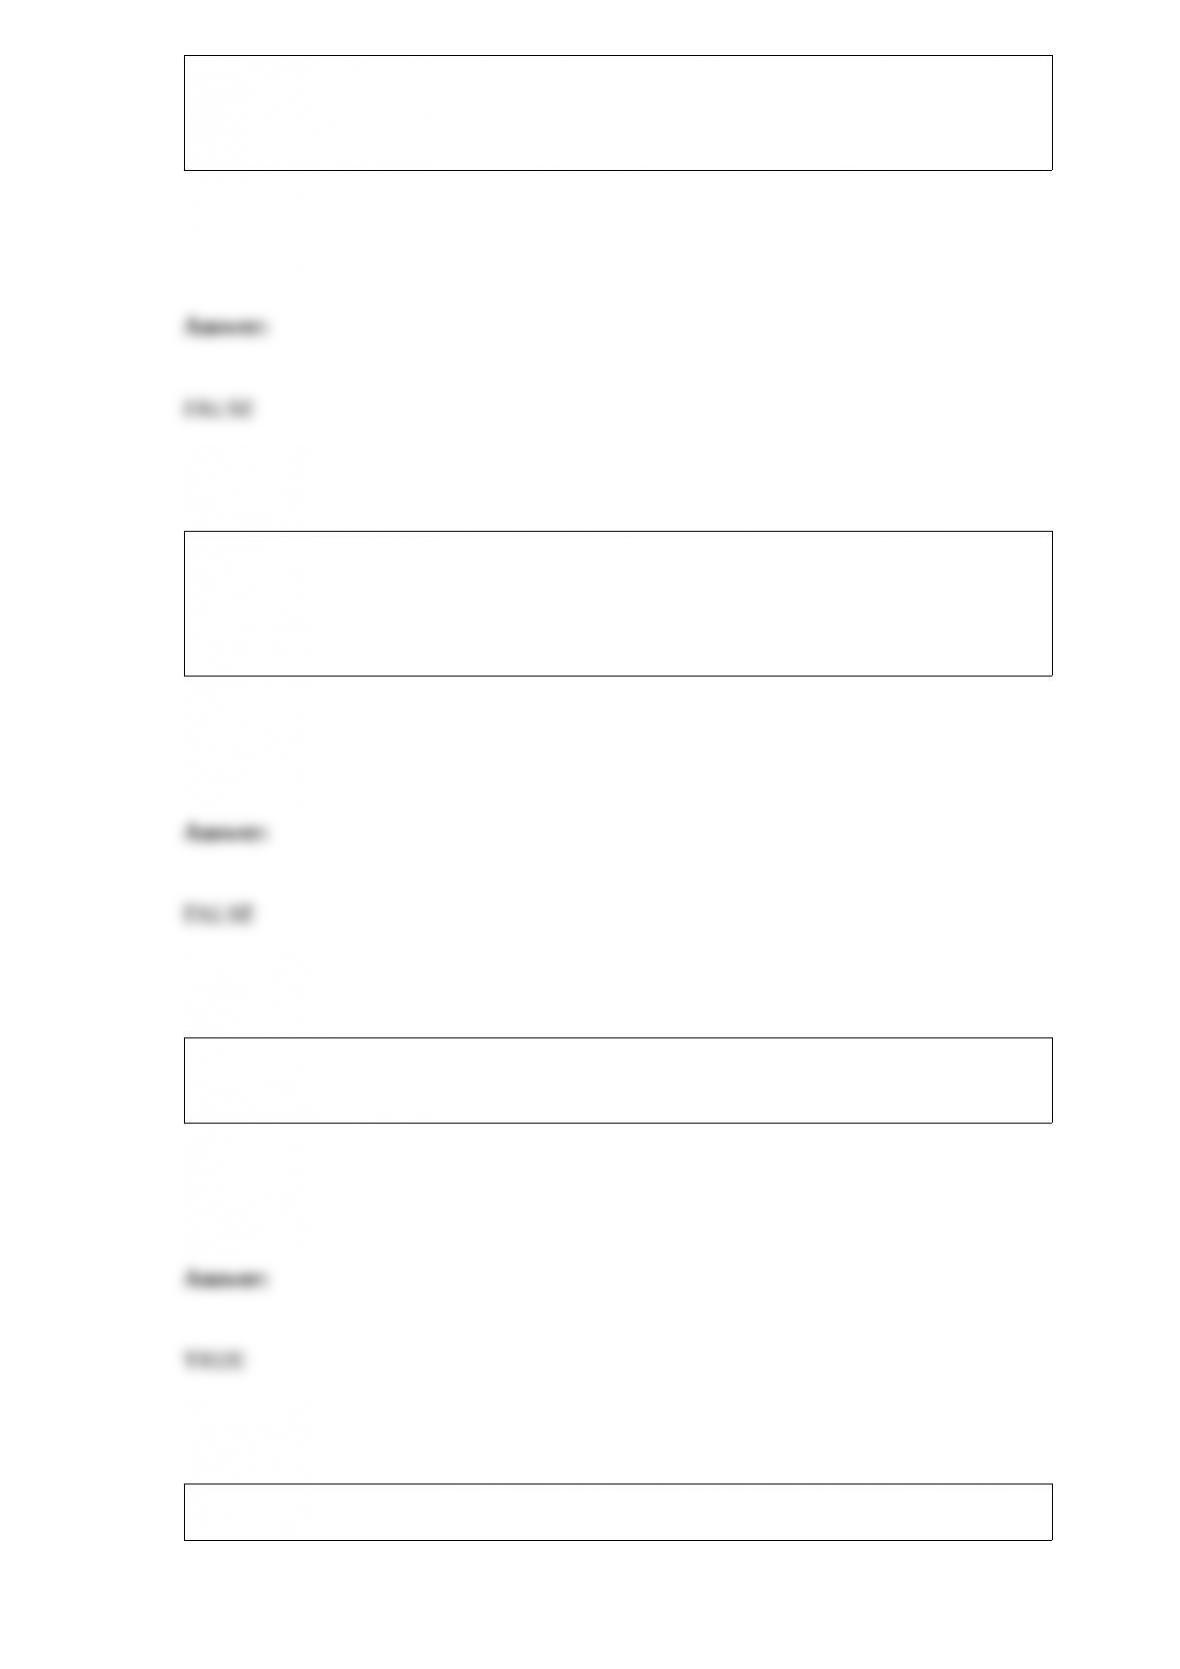
The regression model based on these sample data explains approximately 75 percent of
the variation in the dependent variable.
A major automobile manufacturer has developed a new model car that it claims will
average 25 mpg on the highway. A random sample of fifty of these cars was tested and
they averaged 24 mpg. This means that the claim made by the auto company is
incorrect.
Two confidence interval estimates were developed from the same sample of a
population. The wider interval will be the one that has the higher confidence level.
Another name for a joint frequency distribution is a cross-tabulation table.
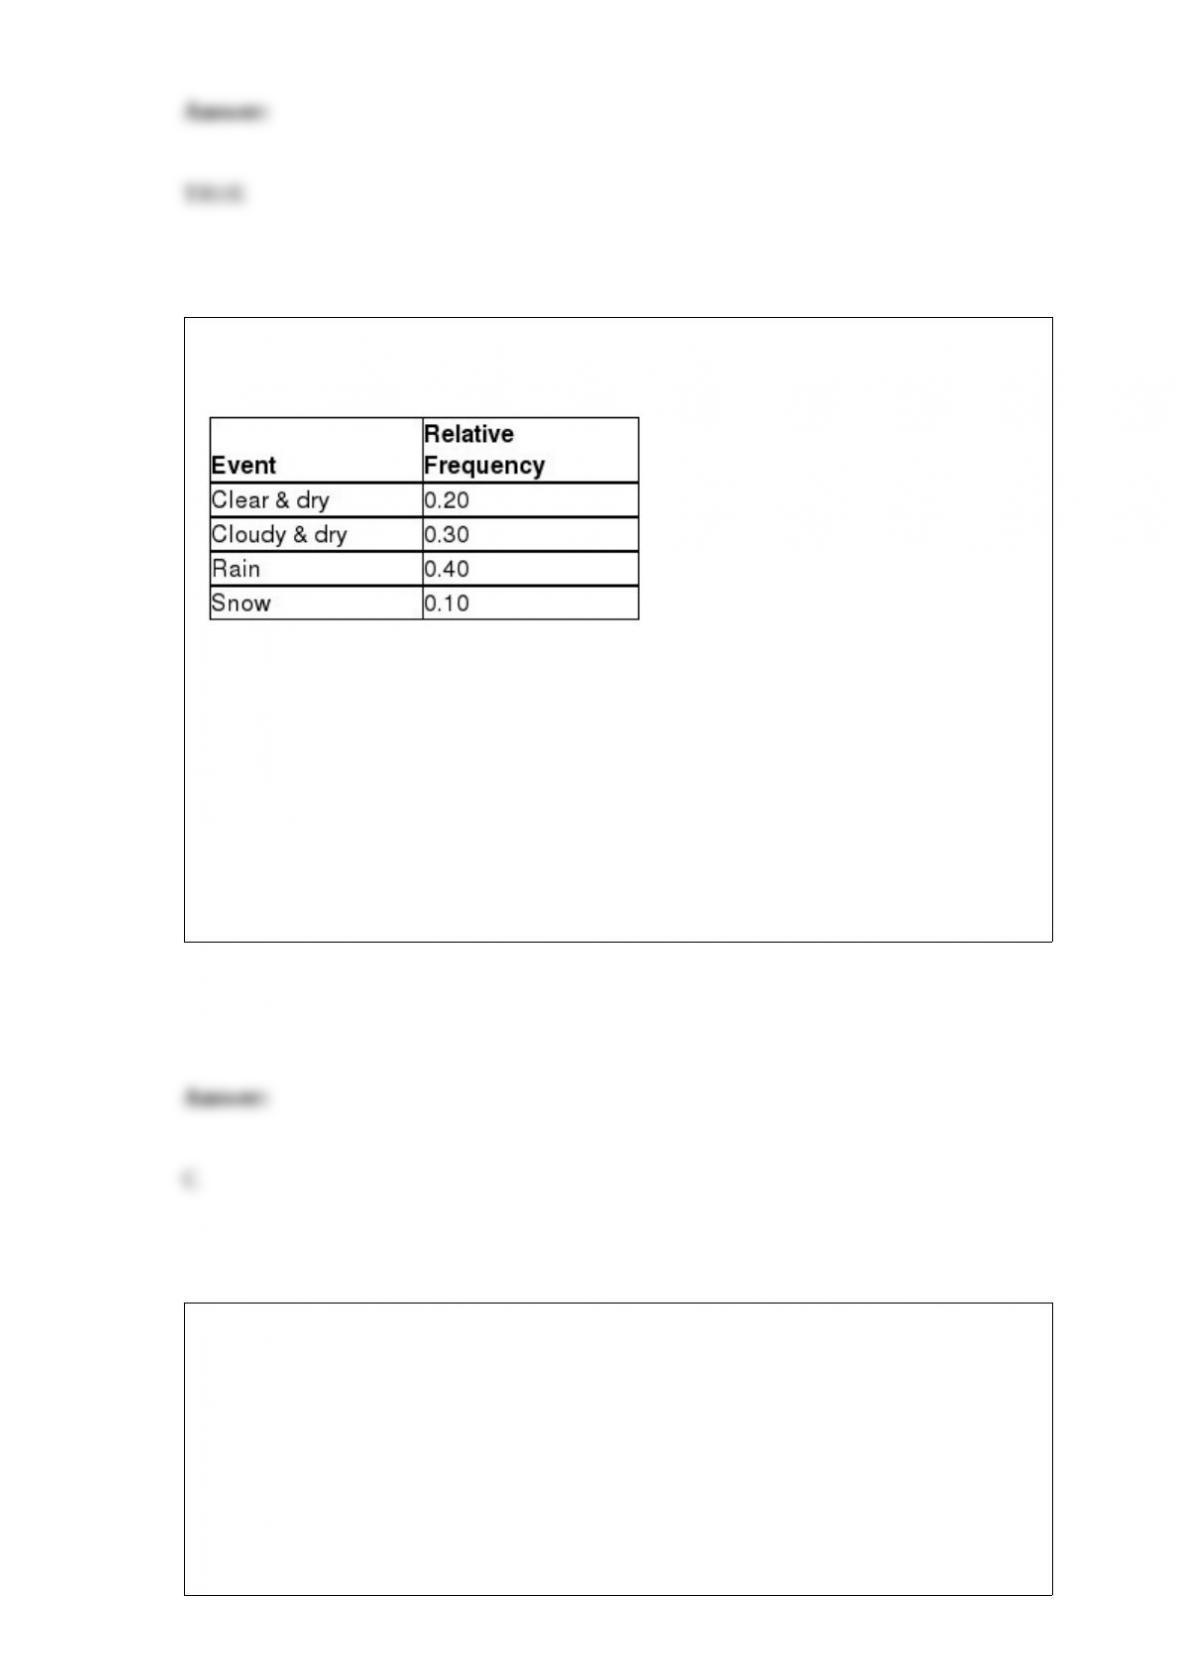
Based on weather data collected in Racine, Wisconsin, on Christmas Day, the weather
had the following distribution:
Supposing next Christmas is dry, determine the probability that it will also be cloudy.
A) 0.45
B) 0.50
C) 0.60
D) 0.70
The assumption that the errors or residuals are independent is best checked by:
A) looking at a normal probability plot of the residuals.
B) looking a scatter plot of each x versus y.
C) looking at a residual plot versus x and checking for curvature.
D) looking at a plot of the residuals versus time and checking for trends.

Which one of the following is not a source of variation?
A) People
B) Measurement
C) Materials
D) Control
Which of the following statements is true with respect to the sampling distribution of a
proportion?
A) An increase in the sample size will result in a reduction in the size of the standard
deviation.
B) As long as the sample size is sufficiently large, the sampling distribution will be
approximately normal.
C) The mean of the sampling distribution will equal the population proportion.
D) All of the above are true.
An educational organization in California is interested in estimating the mean number
of minutes per day that children between the age of 6 and 18 spend watching television
per day. A previous study showed that the population standard deviation was 21.5
minutes. The organization selected a random sample of n = 200 children between the
ages of 6 and 18 and recorded the number of minutes of TV that each person watched
on a particular day. The mean time was 191.3 minutes. If the leaders of the organization
wish to develop an interval estimate with 98 percent confidence, what critical value
should be used?
A) z = 1.645
B) t = 2.38
C) Approximately z = 2.33
D) Can’t be determined without knowing the margin of error.
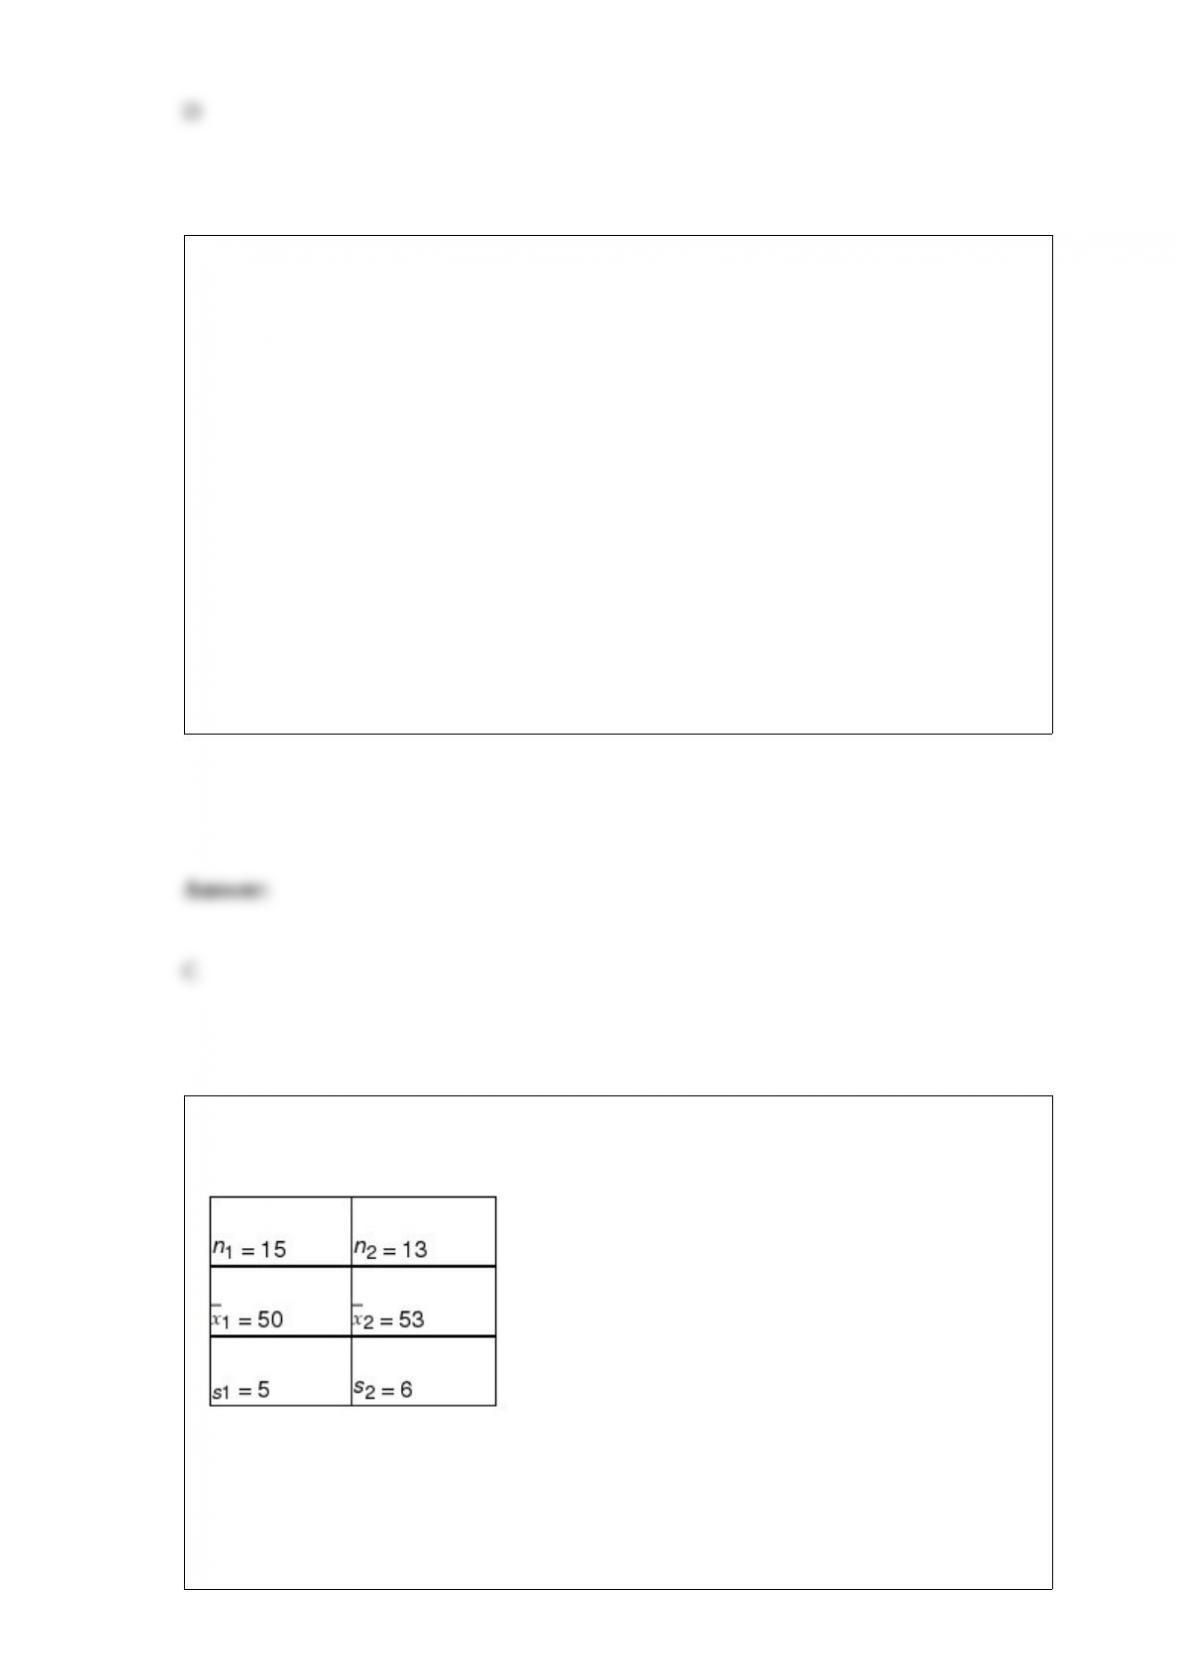
The following information is based on independent random samples taken from two
normally distributed populations having equal variances:
Based on the sample information, determine the 90% confidence interval estimate for
the difference between the two population means.
A) -6.54 ≤ (1 – 2) ≤ 0.54

B) -4.25 ≤ (1 – 2) ≤ 1.25
C) -5.98 ≤ (1 – 2) ≤ 1.88
D) -2.25 ≤ (1 – 2) ≤ 5.25
A major tire manufacturer wishes to estimate the mean tread life in miles for one of its
tires. It wishes to develop a confidence interval estimate that would have a maximum
sampling error of 500 miles with 90 percent confidence. A pilot sample of n = 50 tires
showed a sample standard deviation equal to 4,000 miles. Based on this information,
the required sample size is:
A) 124.
B) 246.
C) 174.
D) 196.
A randomly selected value from a normal distribution is found to be 2.1 standard
deviations above its mean. What is the probability that a randomly selected value from
the distribution will be greater than 2.1 standard deviations above the mean?
A) 0.0179

B) 0.0512
C) 0.0231
D) 0.0024
Because of the complex nature of the U.S. income tax system, many people have
questions for the Internal Revenue Service (IRS). Yet, an article published by the
Detroit Free Press entitled “Assistance: IRS Help Centers Give the Wrong Information”
discusses the propensity of IRS staff employees to give incorrect tax information to
tax-payers who call with questions. Then IRS Inspector General Pamela Gardiner told a
Senate subcommittee that “the IRS employees at 400 taxpayer assistance centers
nationwide encountered 8.5 million taxpayers face-to-face last year. The problem:
When inspector general auditors posing as taxpayers asked them to answer tax
questions, the answers were right 69% of the time.”
Suppose an independent commission was formed to test whether the 0.69 accuracy rate
is correct or whether it is actually higher or lower. The commission has randomly
selected n = 180 tax returns that were completed by IRS assistance employees and
found that 105 of the returns were accurately completed.
State the appropriate null and alternative hypotheses.
A) H0: p = 0.69 Ha : p ≠ 0.69
B) H0 : p = 0.58 Ha : p ≠ 0.58
C) H0 : p > 0.69 Ha : p ≤ 0.69
D) H0 : p > 0.58 Ha : p ≤ 0.58

For a standardized normal distribution, calculate P(-1.00 < z < 1.00).
A) 0.6826
B) 0.6667
C) 0.4572
D) 0.5521
Madam Helga claims to be psychic. A national TV talk personality plans to test her in a
live TV broadcast. The process will entail asking Madam Helga a series of 20
independent questions with yes/no answers. The questions would be of the nature that
she could not have any way of knowing the answer from prior knowledge. Suppose that
Madam Helga correctly answered 15 of the 20 questions, which of the following would
be a viable conclusion to reach?
A) Because the probability of guessing 15 or more correctly is 0.0207, it is unlikely that
she is guessing at the questions and may, in fact, have some special ability.
B) Because the probability of getting 15 or more correct is 0.0207, it is likely that she is
just guessing at the questions.
C) If she were guessing, 15 is within one standard deviation of the mean and therefore
she must not have any special psychic abilities.
D) Because the probability of guessing exactly 15 correct is 0.0148, she must just be
guessing.
When an administrator at a local hospital prepares a series of charts and graphs
pertaining to the patients that have stayed at the hospital during the past month, she is
using which general category of statistical analysis?
A) Quantitative statistics
B) Inferential statistics
C) Descriptive statistics
D) Random sampling
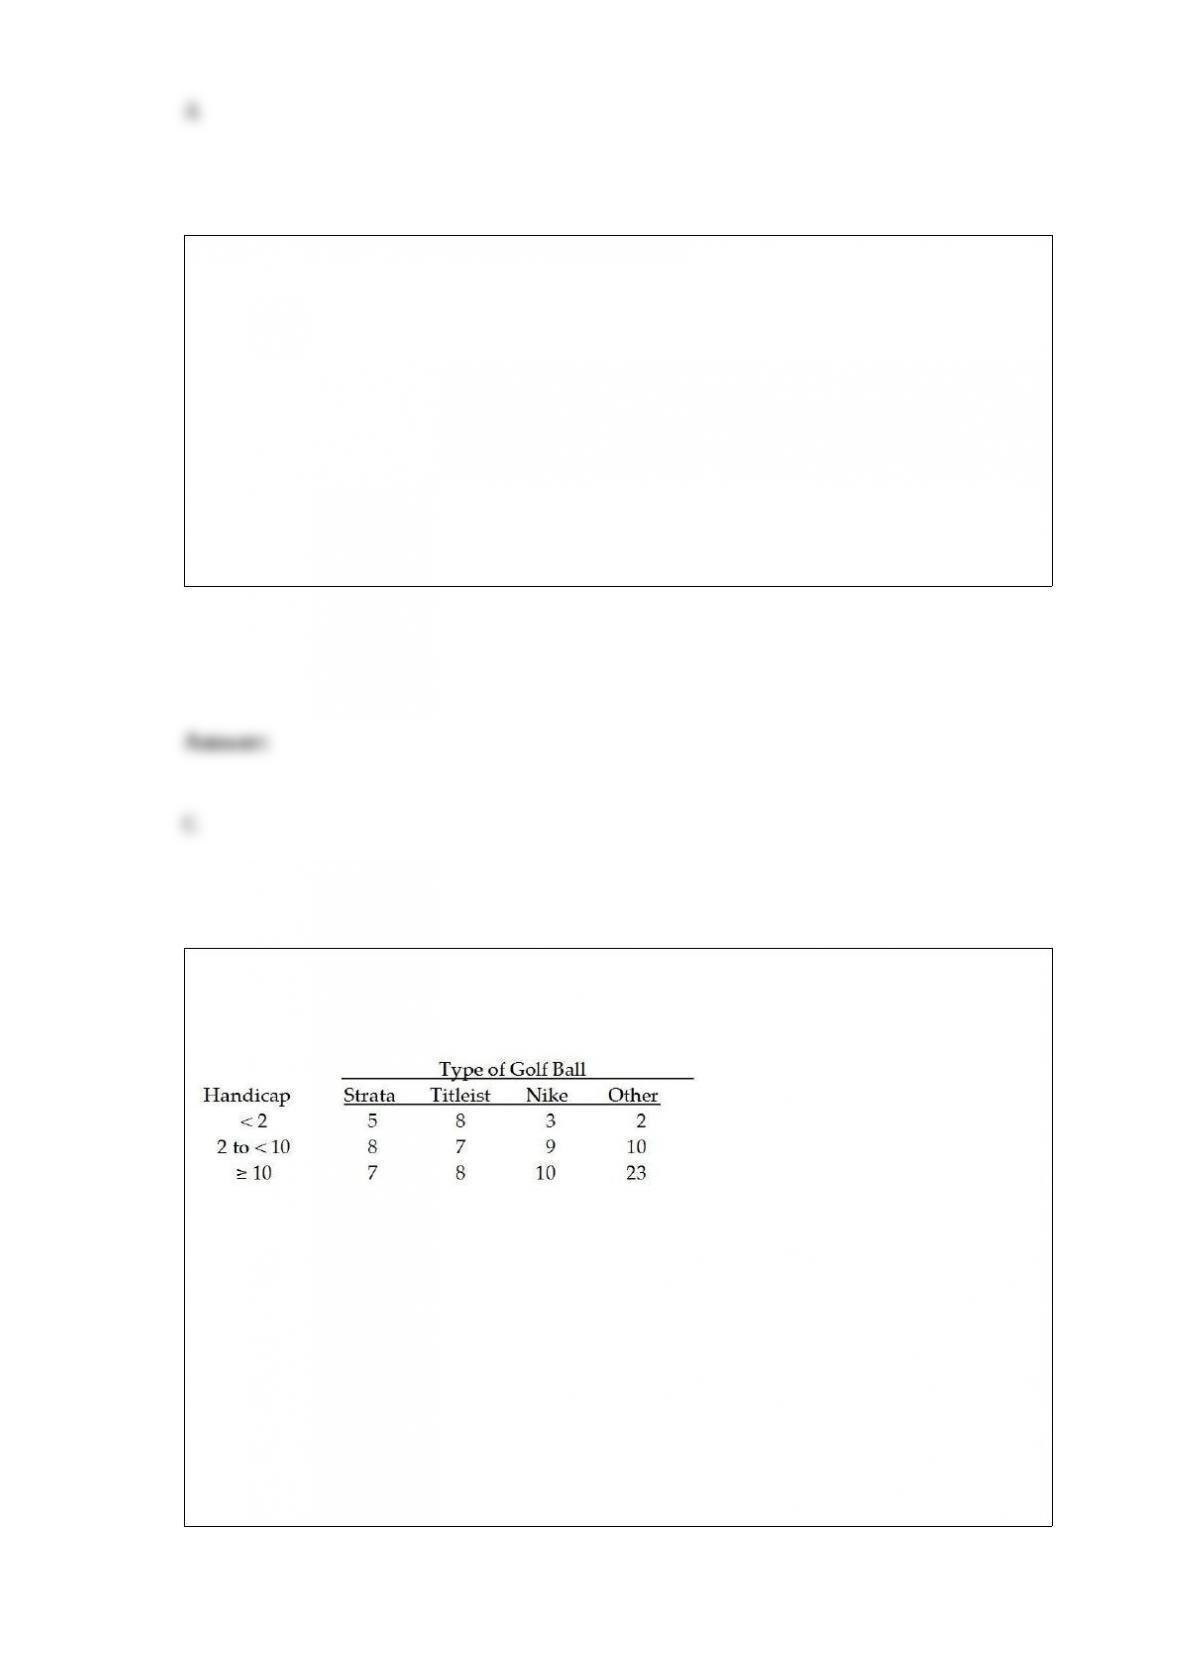
The managers of a local golf course have recently conducted a study of the types of golf
balls used by golfers based on handicap. A joint frequency table for the 100 golfers
covered in the survey is shown below:
Based on these data, if a player has a handicap that is 10 or more, the probability that he
or she will use a Nike golf ball is:
A) 0.21
B) 0.10
C) 0.45
D) 0.48

A common rule of thumb for determining how many classes to use when developing a
frequency distribution with classes is:
A) between 5 and 20 classes.
B) no fewer than 6 classes.
C) equal to 0.25 times the number of data values.
D) at least 10 classes.
The American College Health Association produced the National College Health
Assessment (Andy Gardiner, “Surfacing from Depression,” February 6, 2006). The
assessment indicates that the percentage of U.S. college students who report having
been diagnosed with depression has risen from 2000. The assessment surveyed 47,202
students at 74 campuses. It discovered that 10.3% and 14.9% of students indicated that
they had been diagnosed with depression in 2000 and 2004, respectively. Assume that
half of the students surveyed were surveyed in 2004.
Conduct a hypothesis test to determine if there has been more than a 0.04 increase in
the proportion of students who indicated they have been diagnosed with depression.
Use a significance level of 0.05 and a p-value approach to this test.
A) Since p-value = 0.065 > 0.05, do not reject H0. There is not sufficient evidence to
conclude that there has been more than a 0.04 increase in the proportion of students that
indicate they have been diagnosed with depression.
B) Since p-value = 0.025 < 0.05, reject H0. There is sufficient evidence to conclude that
there has been more than a 0.04 increase in the proportion of students that indicate they
have been diagnosed with depression.

C) Since p-value = 0.072 < 0.05, reject H0. There is sufficient evidence to conclude that
there has been more than a 0.04 increase in the proportion of students that indicate they
have been diagnosed with depression.
D) Since p-value = 0.071 > 0.05, do not reject H0. There is not sufficient evidence to
conclude that there has been more than a 0.04 increase in the proportion of students that
indicate they have been diagnosed with depression.
A homeowners association consists of 20 homes. The family in each home is considered
an automatic member of the association. Recently, one of the homes fell into a state of
disrepair. A survey was conducted of the homeowners both on the same street as the
house in question and on the second street. At issue was whether legal action should be
brought against the homeowner with the problem house. There are 8 homes on the same
street as the problem house and 6 of these called for legal action. The percentage of
houses on the second street that favored legal action is 50 percent. Which type of chart
might be most effective for conveying the information about percentage of residents
favoring legal action by street?
A) Histogram
B) Stem and leaf diagram
C) Bar chart
D) Pie chart
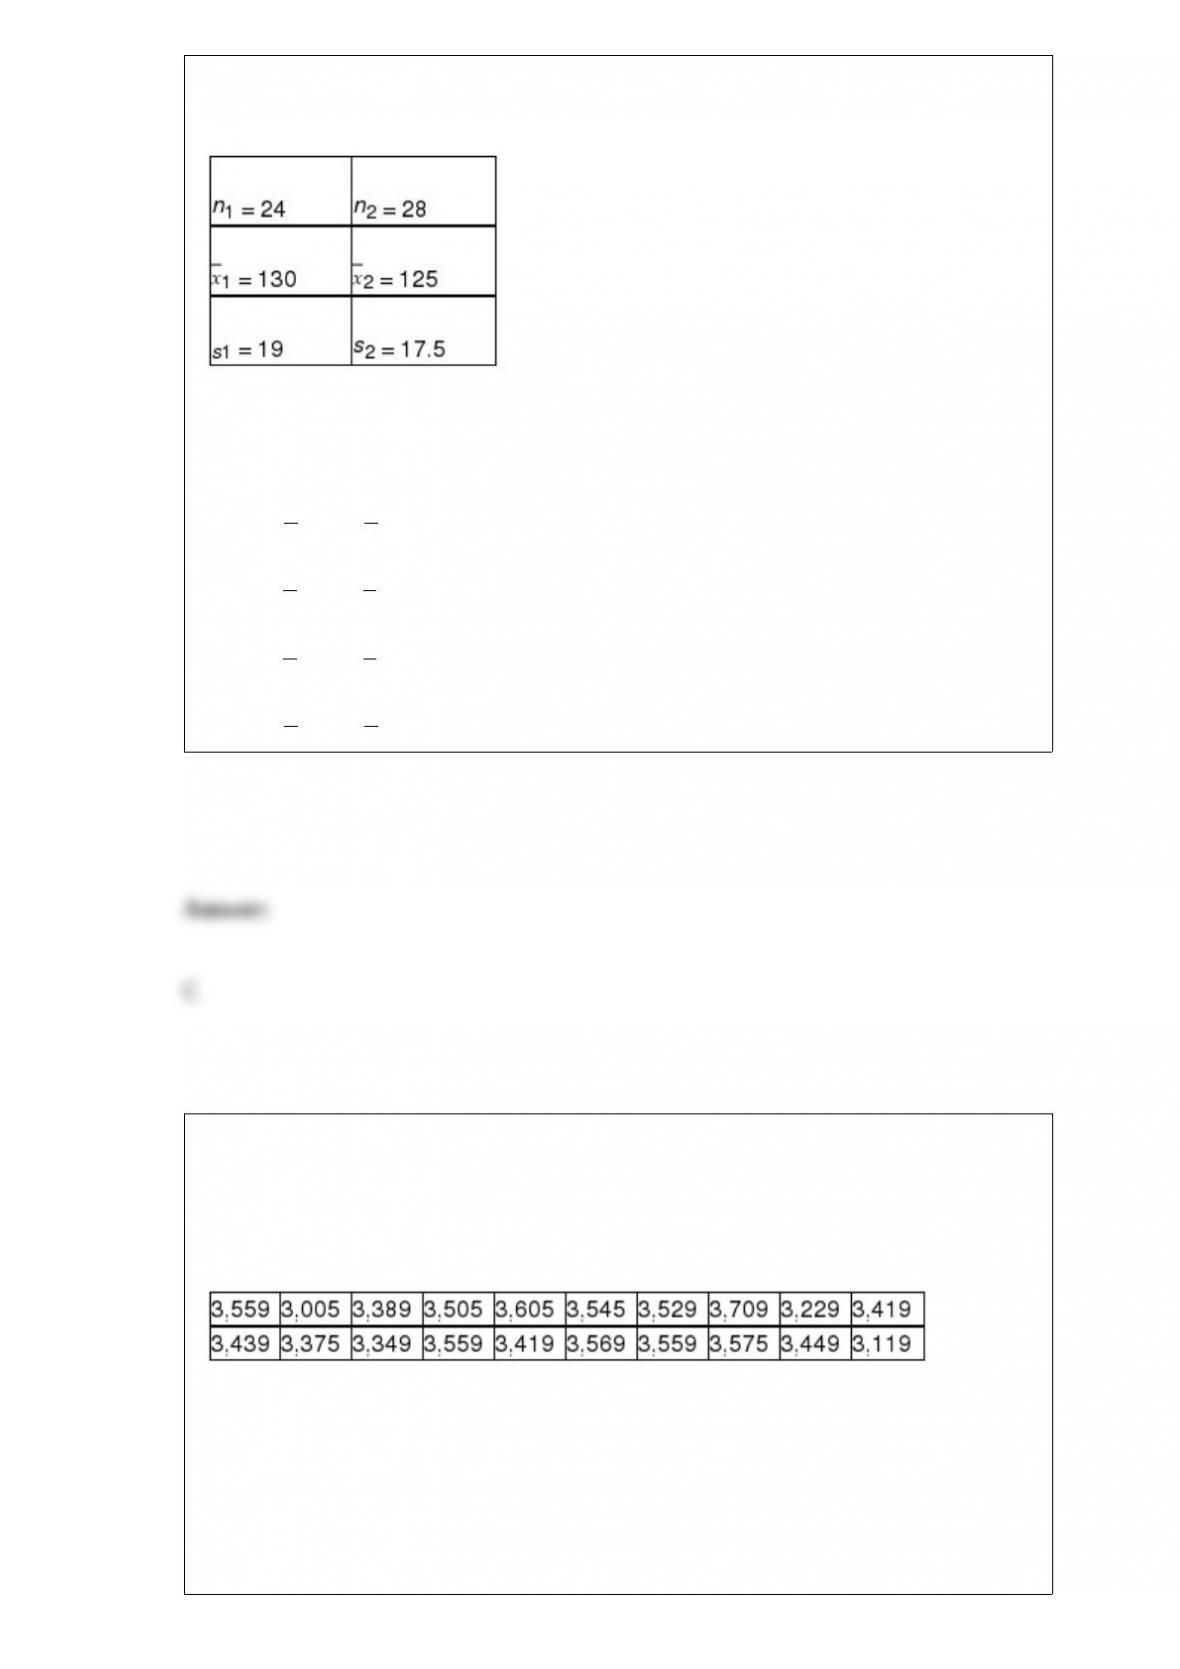
The following information is based on independent random samples taken from two
normally distributed populations having equal variances:
Based on the sample information, determine the 95% confidence interval estimate for
the difference between the two population means.
A) -6.23 < (1 – 2) < 14.23
B) -4.81 < (1 – 2) < 16.81
C) -5.17 < (1 – 2) < 15.17
D) -3.25 < (1 – 2) < 17.25
Princess Cruises recently offered a 16-day voyage from Beijing to Bangkok during the
time period from May to August. The announced price, excluding airfare, for a room
with an ocean view or a balcony was listed as $3,475. Cruise fares usually are quite
variable due to discounting by the cruise line and travel agents. A sample of 20
passengers who purchased this cruise paid the following amounts (in dollars):
Determine the sampling error for this sample.
A) -$29.70
B) -$51.12

C) -$21.71
D) -$31.74
The x-bar chart is based on the principles of which distribution?
A) t-distribution
B) Chi square distribution
C) F distribution
D) Normal distribution
Each evening, a nationwide retail chain randomly calls 100 of the customers who came
to their store that day to ask whether they were satisfied with the service they had
received. The customers respond yes or no. Suppose the company has found over time
that 8 percent of the customers are not satisfied (“no” answers). If they have established
a process control chart, what conclusion should be reached if the percentage of
customers surveyed tonight that say no is 14 percent?
A) This result indicates that a special cause situation exists.
B) Although this point is above the upper control limit, there is no cause for alarm if
this is the first time.
C) While this value is higher than “normal,” it is still within the range of common cause

variation and no action is needed.
D) This is outside the control limits and action should be taken
If the monthly electrical utility bills of all customers for the Far East Power and Light
Company are known to be distributed as a normal distribution with mean equal to
$87.00 a month and standard deviation of $36.00, which of the following would be the
largest individual customer bill that you might expect to find?
A) Approximately $811.00
B) About $195.00
C) Nearly $123.00
D) There is no way to determine this without more information.
When a marketing manager surveys a few of the customers for the purpose of drawing a
conclusion about the entire list of customers, she is applying:
A) inferential statistics.
B) descriptive statistics.
C) quantitative models.
D) numerical measures.

A chi-square test for goodness-of-fit is used to test whether or not there are any
preferences among 3 brands of peas. If the study uses a sample of n = 60 subjects, then
the expected frequency for each category would be:
A) 20
B) 30
C) 60
D) 33
In a multiple regression model, which of the following is true?
A) The coefficient of determination will be equal to the square of the highest correlation
in the correlation matrix.
B) Adding variables that have a low correlation with the dependent variable will cause
the R-square value to decline.
C) The sum of the residuals computed for the least squares regression equation will be
zero.
D) The adjusted R-square might be higher or lower than the value of the R-square.

A forecasting model of the following form was developed:
y = B0 + B1xj+ B2 + B3 + ε
Which of the following best describes the form of this model?
A) Quadratic model
B) 3rd degree polynomial model
C) 3rd level regression model
D) Tri-slope regression model
Beacon Hill Trees & Shrubs currently has an inventory of 10 fruit trees, 8 pine trees,
and 14 maple trees. It plans to give 4 trees away at next Saturday’s lawn and garden
show in the city park. The 4 winners can select which type of tree they want. Assume
they select randomly.
What is the probability that all 4 winners will select the same type of tree?
A) 0.0058
B) 0.0218
C) 0.0355
D) 0.0709

The St. Joe Company grows pine trees and the average annual increase in tree diameter
is 3.1 inches with a standard deviation of 0.5 inch. A random sample of n = 50 trees is
collected. What is the probability of the sample mean being less the 2.9 inches?
A) 0.4977
B) 0.0023
C) 0.9977
D) 0.9954
When testing a two-tailed hypothesis using a significance level of 0.05, a sample size of
n = 16, and with the population standard deviation unknown, which of the following is
true?
A) The null hypothesis can be rejected if the sample mean gets too large or too small
compared with the hypothesized mean.
B) The alpha probability must be split in half and a rejection region must be formed on
both sides of the sampling distribution.
C) The test statistic will be a t-value.
D) All of the above are true.
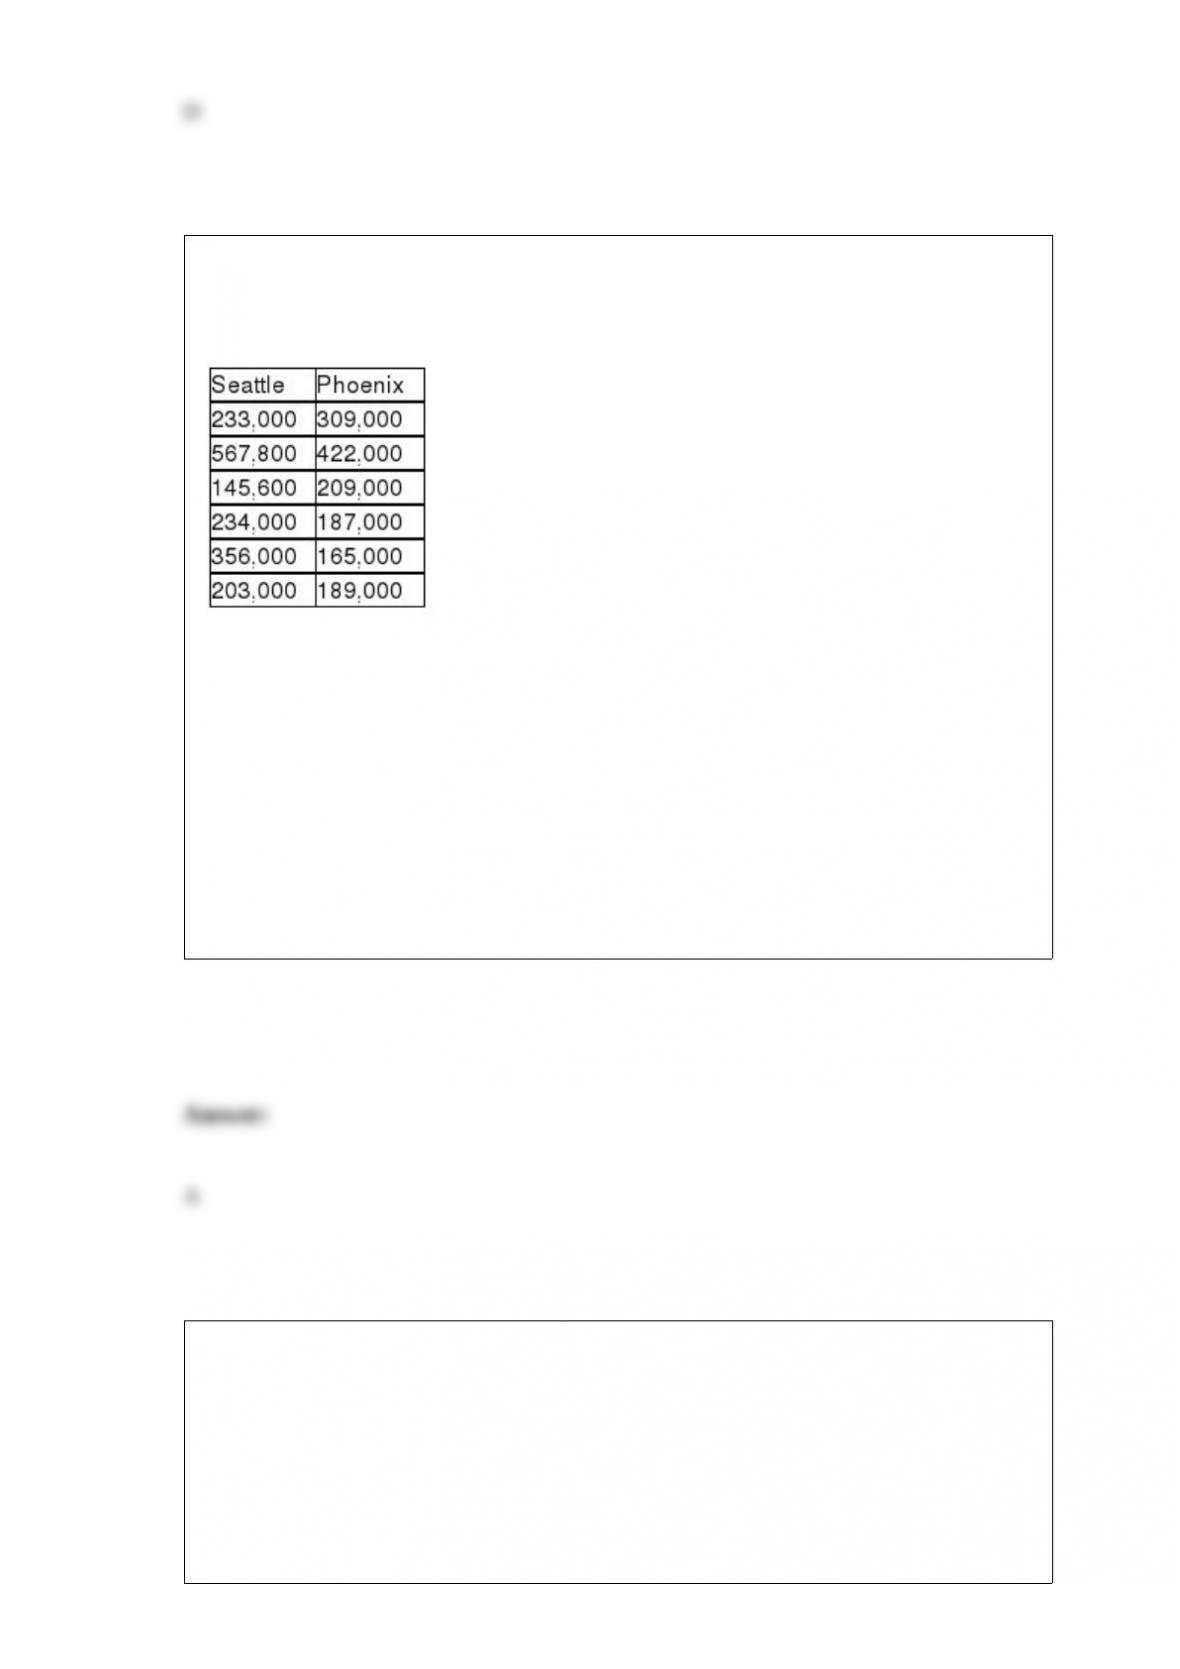
Consider the situation in which a study was recently conducted to determine whether
the median price of houses is the same in Seattle and Phoenix. The following data were
collected.
Given these data, if a Mann-Whitney U test is to be used, the sum of the ranks for
Seattle is:
A) 43
B) 35
C) 25.5
D) 40
In order to compute the mean and standard deviation, the level of data measurement
should be:
A) ratio or interval.
B) qualitative.
C) nominal.

D) ordinal.
A survey of 499 women for the American Orthopedic Foot and Ankle Society revealed
that 38% wear flats to work.
Use this sample information to develop a 99% confidence interval for the population
proportion of women who wear flats to work.
A) (0.324, 0.436)
B) (0.302, 0.458)
C) (0.368, 0.392)
D) 0.363, 0.397)