
The J.O. Supplies Company buys calculators from a non-US supplier. The probability
of a defective calculator is 10 percent. If 10 calculators are selected at random, what is
the probability that 3 or more of the calculators will be defective?
A. .0702
B. .2639
C. .0016
D. 0
When the constant variance assumption holds, a plot of the residual versus x
A. fans out.
B. funnels in.
C. fans out, but then funnels in.
D. forms a horizontal band pattern.
E. suggests an increasing error variance.
Using Chebyshev’sTheorem, find the interval that contains at least 93.75 percentof all
measurements when the mean = 2.549 and s = 1.828.

A. [−2.935, 8.033]
B. [−1.107, 6.205]
C. [−26.699, 31.797]
D. [2.435, 2.663]
E. [−4.763, 9.861]
A ____________ variable can have values that are numbers on the real number line.
A. qualitative
B. quantitative
C. categorical
D. nominative
At the end of their final exam, 550 students answered an additional question in which
they rated their instructor’s teaching effectiveness, with the following results.

What proportion of the students who rated their instructor as very or somewhat
effective received a B or better in the class?
A. 0.345
B. 0.254
C. 0.482
D. 0.898
E. 0.644
A ______________________ measures the strength of the relationship between a
dependent variable (Y) and an independent variable (X).
A. coefficient of determination
B. correlation coefficient
C. slope
D. standard error

In a statistics class, 10 scores were randomly selected with the following results: 74, 73,
77, 77, 71, 68, 65, 77, 67, 66.
What is the IQR?
A. 12.00
B. 5.25
C. 10
D. 5.00
E. 11.00
Adding any independent variable to a regression model will increase ____________.
A. adjusted or
B. s
C. MSE
D.
E. the length of all prediction intervals

Which of the following is a valid probability value for a discrete random variable?
A. .2
B. 1.01
C. −.7
D. All of the choices are correct.
If the errors produced by a forecasting method for 3 observations are +3, +3, and −3,
then what is the mean squared error?
A. 9
B. 0
C. 3
D. −3
E. 2

Two mutually exclusive events having positive probabilities are ______________
dependent.
A. always
B. sometimes
C. never
In the calculation of a mean for grouped data, ___________ are used.
A. total sample size and sum of the midpoints of each class
B. total sample size and sum of the weighted midpoints
C. sum of the frequency of each class and the sum of the midpoints of each class
D. sum of the frequency of each class and the sample midpoint
Joe is considering pursuing an MBA degree. He has applied to two different
universities. The acceptance rate for applicants with similar qualifications is 25 percent
for University A and 40 percent for University B.
What is the probability that Joe will be accepted at University A and rejected at
University B?
A. 0.10
B. 0.85

C. 0.15
D. 0.25
E. 0.65
When testing the difference between two population proportions using large
independent random samples, the __________ test statistic is used.
A. z
B. t
C. F
D. chi-square
E. None of the other choices is correct.
The utility curve given below represents the preferences of a _________________
decision maker.

A. risk-averse
B. risk-neutral
C. risk-seeking
D. None of the other choices is correct.
The population of lengths of aluminum-coated steel sheets is normally distributed with
a mean of 30.05 inches and a standard deviation of 0.2 inches. What is the probability
that a sheet selected at random will be less than 31 inches long?
A. 0.00
B. 1.00
C. .8289
D. .5987
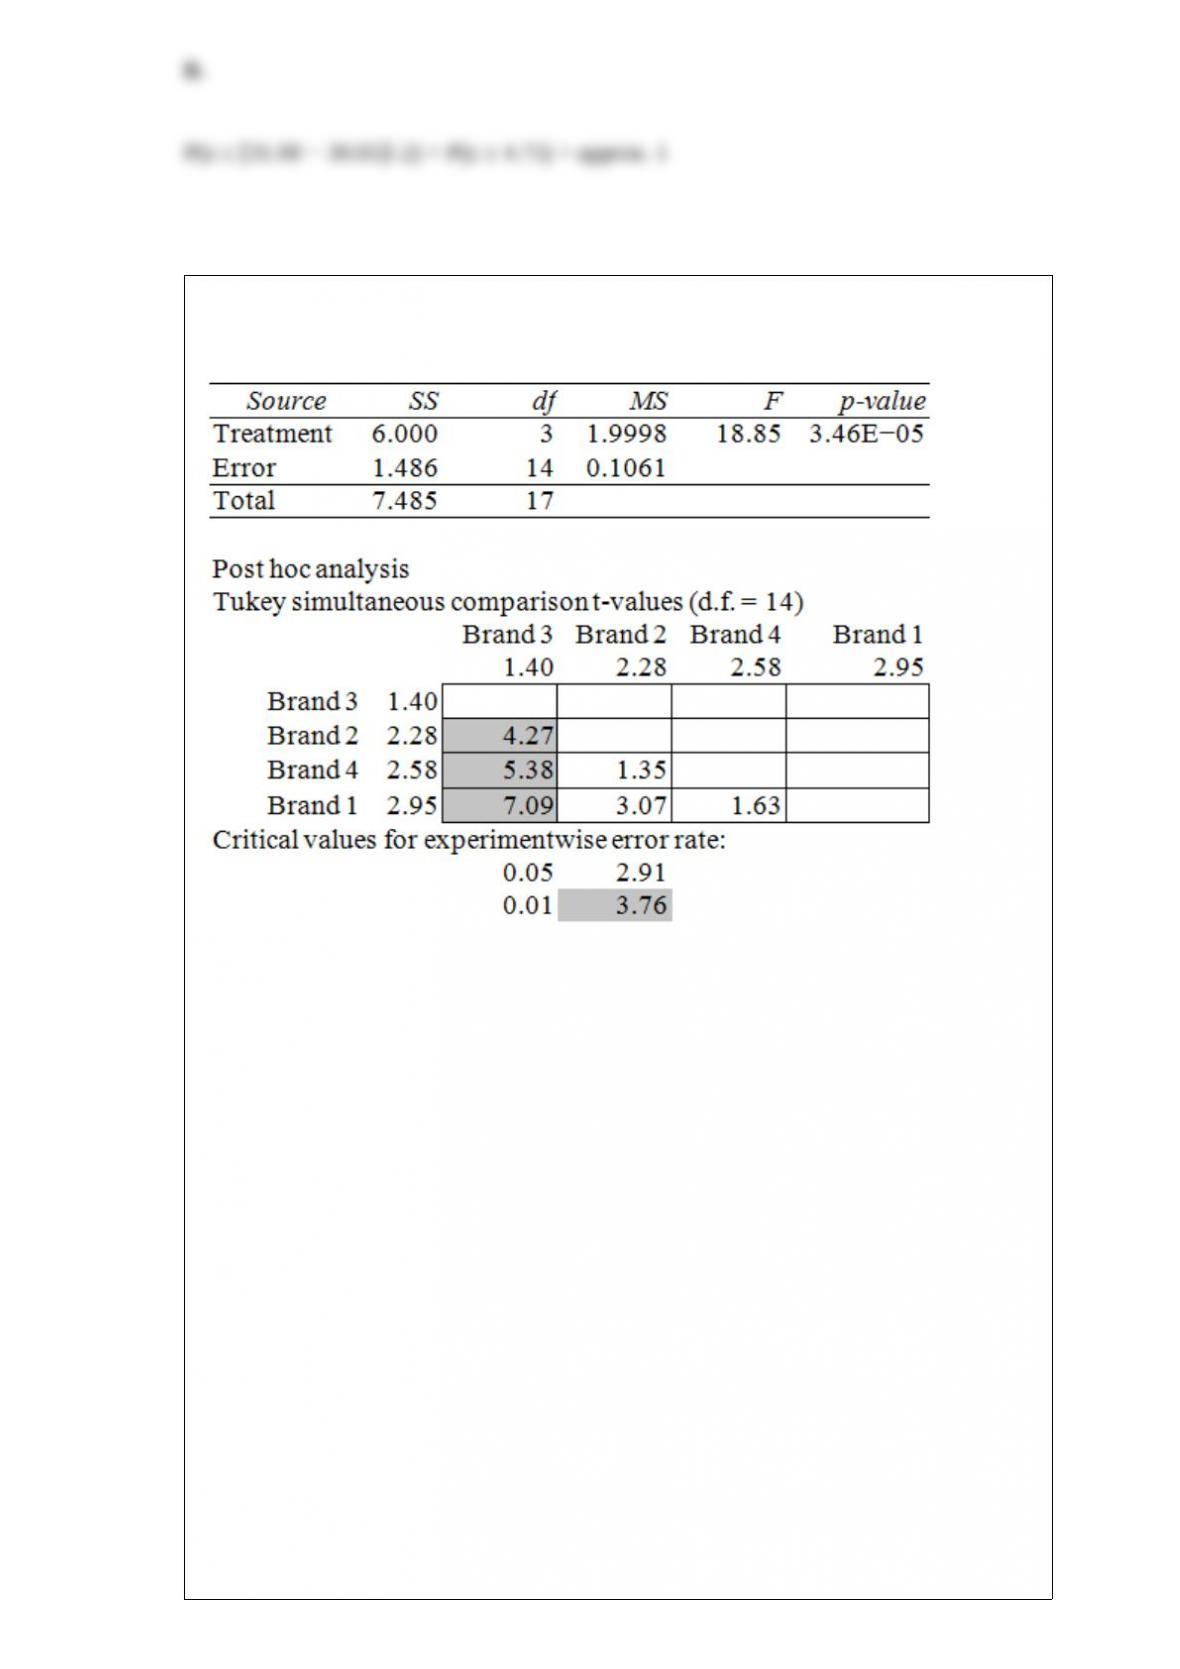
ANOVA table
The Excel/MegaStat output given above summarizes the results of a one-way analysis
of variance in an attempt to compare the performance characteristics of four brands of
vacuum cleaners. The response variable is the amount of time it takes to clean a specific
size room with a specific amount of dirt.
At a significance level of .05, the null hypothesis for the ANOVA F test is rejected.
Analysis of the Tukey simultaneous confidence intervals shows that at the significance
level (experimentwise) of .05, we would conclude that
A. all four brands of vacuum cleaners differ from each other in terms of their
performance.
B. brand 1 differs from brand 2, and brand 2 differs from brand 3, while the rest of the
vacuum cleaner pairs do not differ from each other in terms of their performance.
C. brand 1 differs from brand 2, and brand 3 differs from brands 1, 2, and 4, while the
rest of the vacuum cleaner pairs do not differ from each other in terms of their
performance.
D. only brand 3 differs from the other three brands (brands 1, 2, and 3), while the rest of
the vacuum cleaner pairs do not differ from each other in terms of their performance.

E. none of the four brands of vacuum cleaners differ from each other in terms of their
performance.
An insurance analyst working for a car insurance company would like to determine the
proportion of accident claims covered by the company. A random sample of 240 claims
shows that the insurance company covered 90 accident claims, while 150 claims were
not covered. Use a confidence interval of 95 percent and determine the margin of error.
A. .01513
B. .03125
C. .06125
D. .02965
A manufacturing company measures the weight of boxes before shipping them to the
customers. If the box weights have a population mean and standard deviation of 90 lb
and 24 lb, respectively, then based on a sample size of 36 boxes, what is the probability
that the average weight of the boxes will be less than 84 lb?
A. 16.87%
B. 93.32%
C. 43.32%
D. 6.68%

E. 84.13%
In simple regression analysis, the standard error is ___________ greater than the
standard deviation of y values.
A. always
B. sometimes
C. never
The internal auditing staff of a local manufacturing company performs a sample audit
each quarter to estimate the proportion of accounts that are more than 90 days overdue
(delinquent). The historical records of the company show that over the past 8 years, the
average has been that 13 percent of the accounts have been delinquent. For this quarter,
the auditing staff randomly selected 250 customer accounts. What is the probability that
no more than 40 accounts will be classified as delinquent?
A. 42.07%
B. 92.07%
C. 7.93%
D. 40.15%
E. 90.15%

If in a hypergeometric distribution r = 300, N = 600, and n = 30, estimate the binomial
probability of success.
A. 0.500
B. 0.333
C. 0.083
D. 0.250
The range for r2 is between 0 and 1, and the range for r is between ____________.
A. 0 and 1
B. −1 and 1
C. −1 and 0
D. There is no limit for r.

The Securities and Exchange Commission has determined that the number of
companies listed on the NYSE declaring bankruptcy is approximately a Poisson
distribution with a mean of 2.6 per month. Find the probability that exactly 4
bankruptcies occur next month.
A. .8774
B. .1414
C. .1557
D. .2176
Consider a Poisson distribution with an average of 3 customers per minute at the local
grocery store. If X = the number of arrivals per minute, find the probability of more
than 7 customers arriving within a minute.
A. .0216
B. .0081
C. .0108
D. .0118
During off hours, cars arrive at a tollbooth on the East-West toll road at an average rate
of 0.5 cars per minute. The arrivals are distributed according to a Poisson distribution.
What is the probability that during the next five minutes, three cars will arrive?
A. .2138
B. .1804
C. .0126
D. .0613
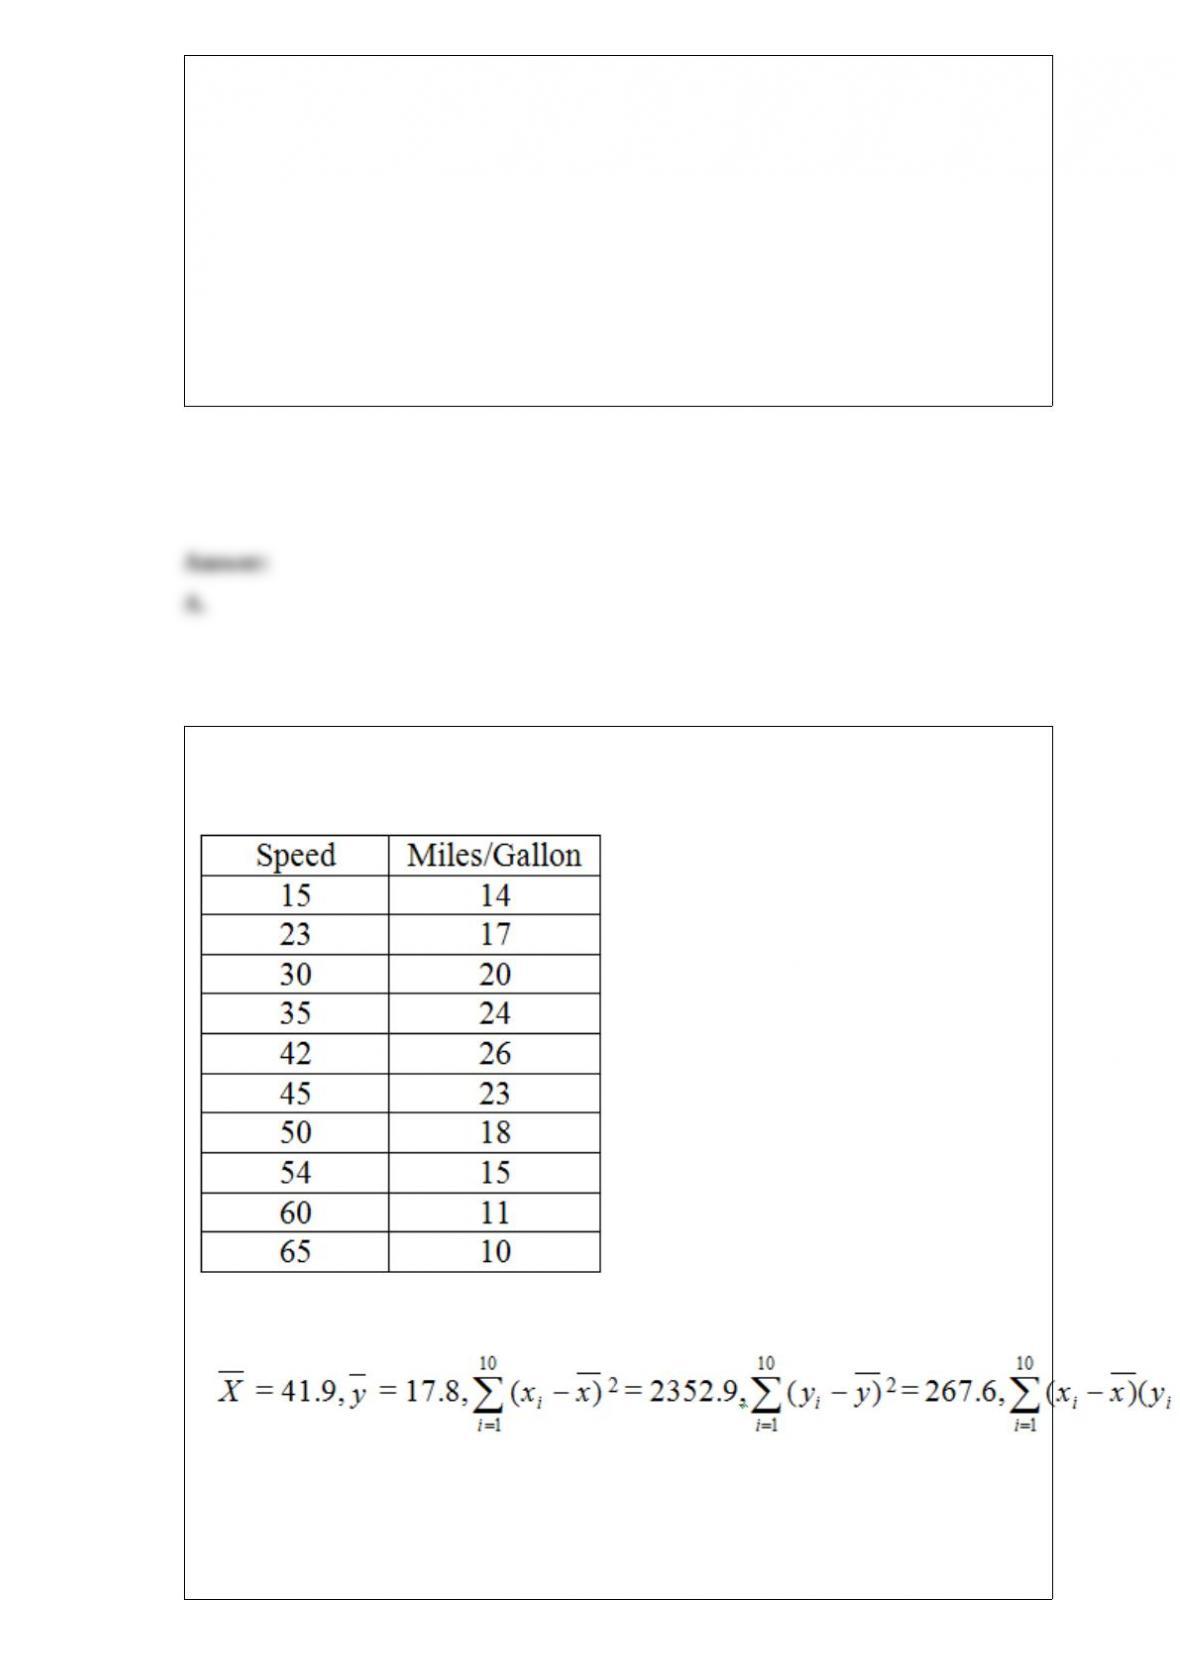
Researchers wish to study fuel consumption rates based on speed. The data from the
test car at 10 speeds are below.
It can be shown that for these data:
Calculate the sample covariance.
A. −270.2

B. −30.02
C. −27.02
D. −74.58
E. −82.86
A(n) ______ is a graph of a cumulative distribution.
A. histogram
B. scatter plot
C. ogive plot
D. pie chart
Given the following information about a hypothesis test of the difference between two
means based on independent random samples, what is the standard deviation of the
difference between the two means? Assume that the samples are obtained from
normally distributed populations having equal variances.
HA: μA > μB, = 12, = 9, s1 = 5, s2 = 3, n1 = 13, n2 = 10.
A. 1.792
B. 1.679
C. 2.823

D. 3.210
E. 1.478
A random sample of size 36 is taken from a population with mean 50 and standard
deviation 5. What is μx?
A. 50
B. 5
C. 8.33
D. 0.833
The general term for a graphical display of categorical data made up of vertical or
horizontal bars is called a(n) ___________.
A. pie chart
B. Pareto chart
C. bar chart
D. ogive plot
Let p1 represent the population proportion of U.S. senatorial and congressional (House
of Representatives) Democrats who are in favor of a new modest tax on junk food. Let
p2 represent the population proportion of U.S. senatorial and congressional Republicans
who are in favor of a new modest tax on junk food. Out of the 265 Democratic senators
and members of Congress, 106 of them are in favor of a junk food tax. Out of the 285
Republican senators and members of Congress, only 57 are in favor a junk food tax. At
α = .01, can we conclude that the proportion of Democrats who favor a junk food tax is
more than 5 percent higher than the proportion of Republicans who favor the new tax
(using critical value rules)?
Two coffee-vending machines are studied to determine whether they distribute the same
amounts. Samples are taken and the number of ounces is recorded for each machine.
Machine A Machine B
6.10 5.99
5.95 6.01
5.98 5.98
6.01 5.96
6.00 6.08

5.95 5.89
6.02 6.01
6.04 6.00
5.99 5.97
6.06 6.00
Calculate the values of TA and TB.
A. 116, 94
B. 131, 79
C. 55, 105
D. 105, 55
When sample size is 16, find t.001.
Last year, during an investigation of the time spent reading emails on a daily basis,
researchers found that on Monday the average time was 50 minutes. Office workers
claim that with the increased spam and junk mail, this time has now increased. To
conduct a test, a sample of 25 employees is selected, with the following results: sample
mean = 51.05 minutes and sample standard deviation = 4.42 minutes. Calculate the
appropriate test statistic to apply the critical value rule on the hypothesis that the time
has increased from last year.
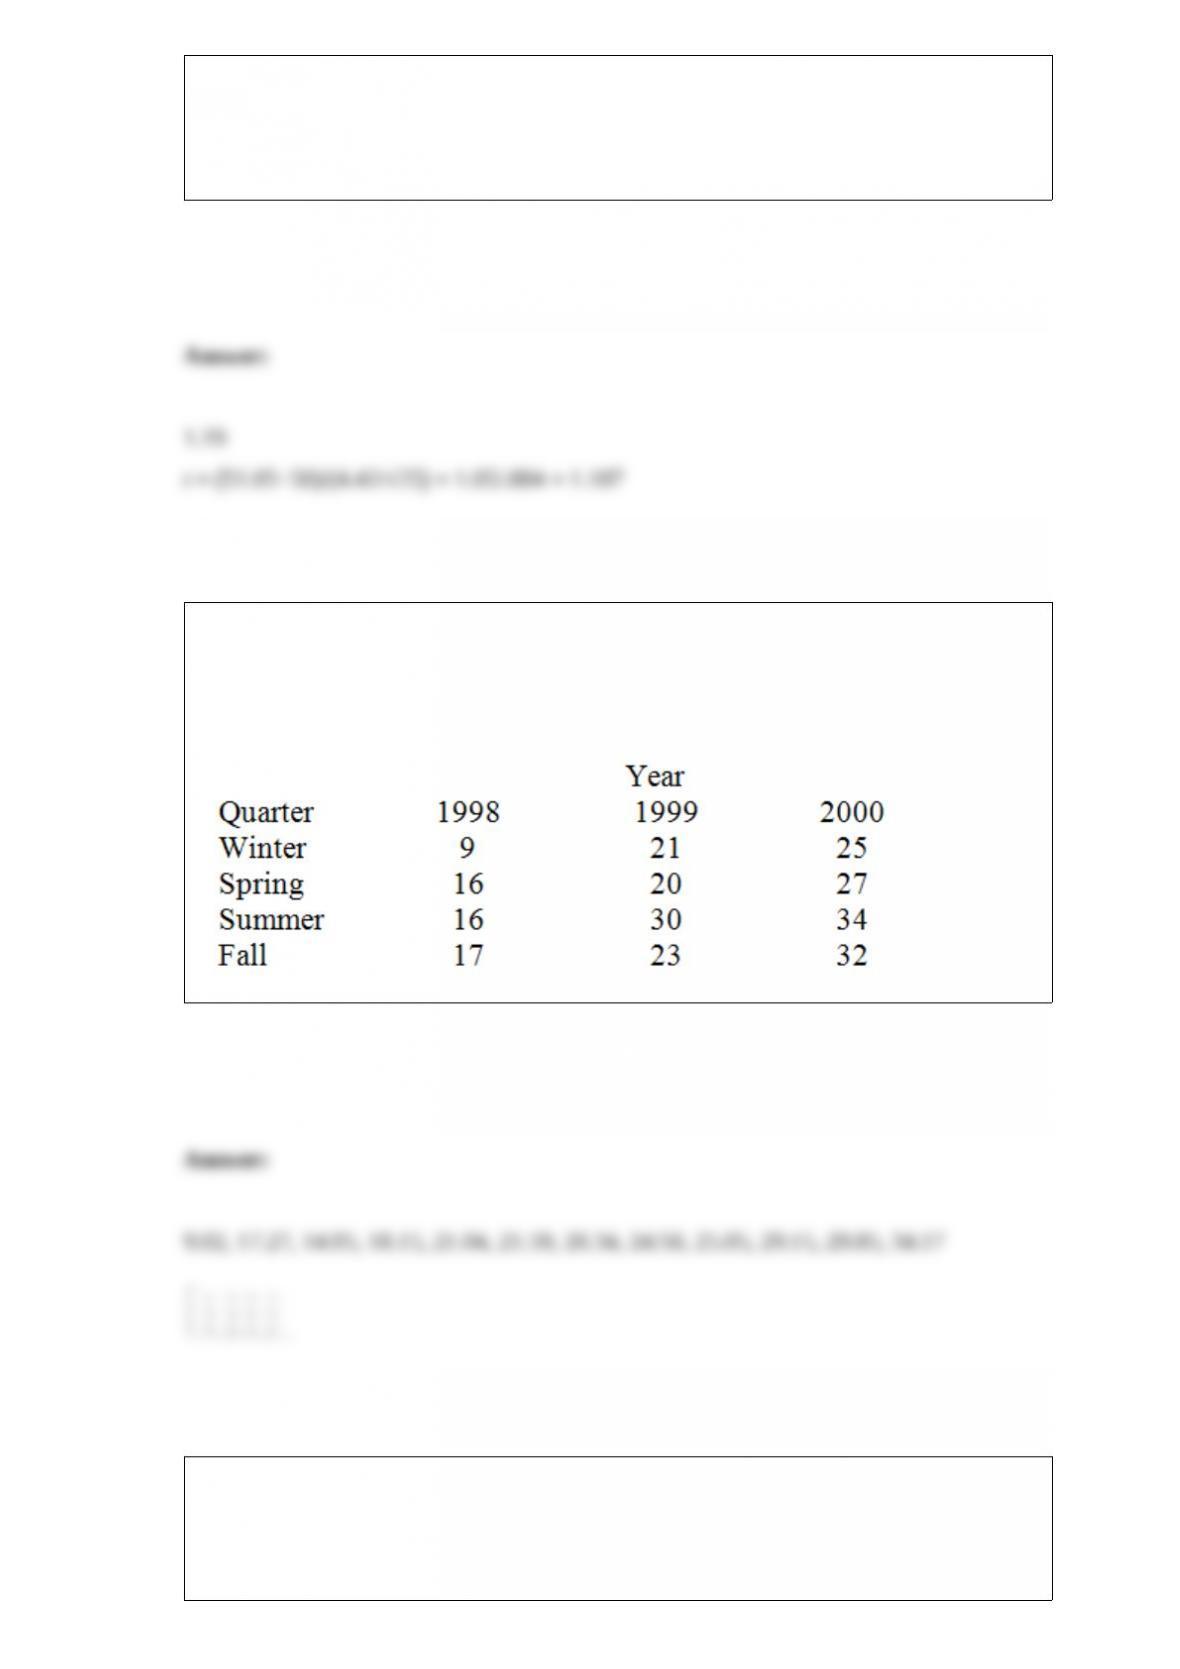
Consider the quarterly production data (in thousands of units) for the XYZ
manufacturing company below. The normalized (adjusted) seasonal factors are winter =
.9982, spring = .9263, summer = 1.139, and fall = .9365. Calculate the deseasonalized
production value for each observation in the time series.
Two hospital emergency rooms use different procedures for triage of their patients. We
want to test the claim that the mean waiting time of patients is the same for both
hospitals. The 40 randomly selected subjects from hospital A produce a mean of 18.3
minutes. The 50 randomly selected patients from hospital B produce a mean of 25.31
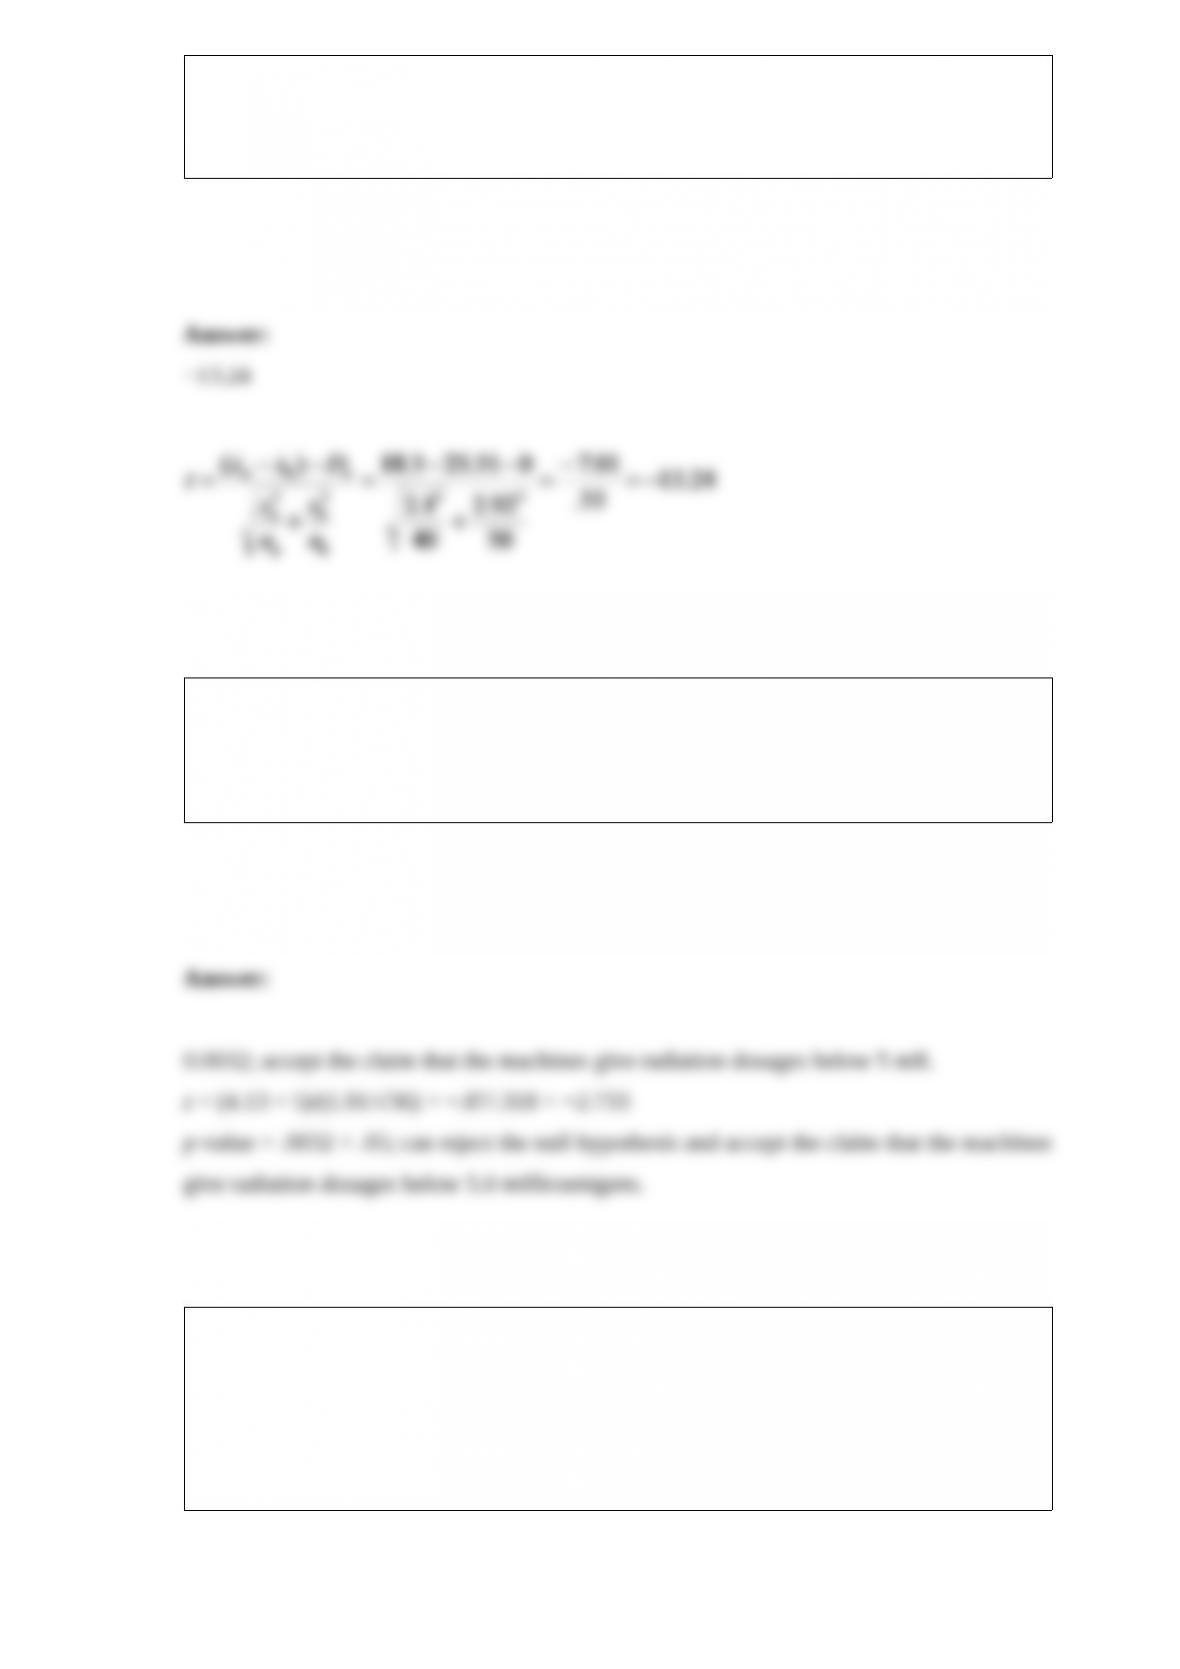
minutes. Assume sa = 2.1 minutes and sb = 2.92 minutes. Calculate the test statistic for
testing the hypothesis that there is a difference in the mean waiting time between the
two hospitals. Assume unequal variances.
Standard X-ray machines should give radiation dosages below 5.00 milliroentgens
(mR). To test a certain X-ray machine, a sample of 36 observations is taken, with a
mean of 4.13 mR and a population standard deviation of 1.91 mR. Calculate the p-value
for this test statistic and test the claim at α = .05 using the p-value rule.
The state highway department is studying traffic patterns on one of the busiest
highways in the state. As part of the study, the department needs to estimate the average
number of vehicles that pass an intersection each day. A random sample of 64 days
gives us a sample mean of 14,205 cars and a sample standard deviation of 1,010 cars.
What is the 98 percent confidence interval estimate of μ, the mean number of cars
passing the intersection?
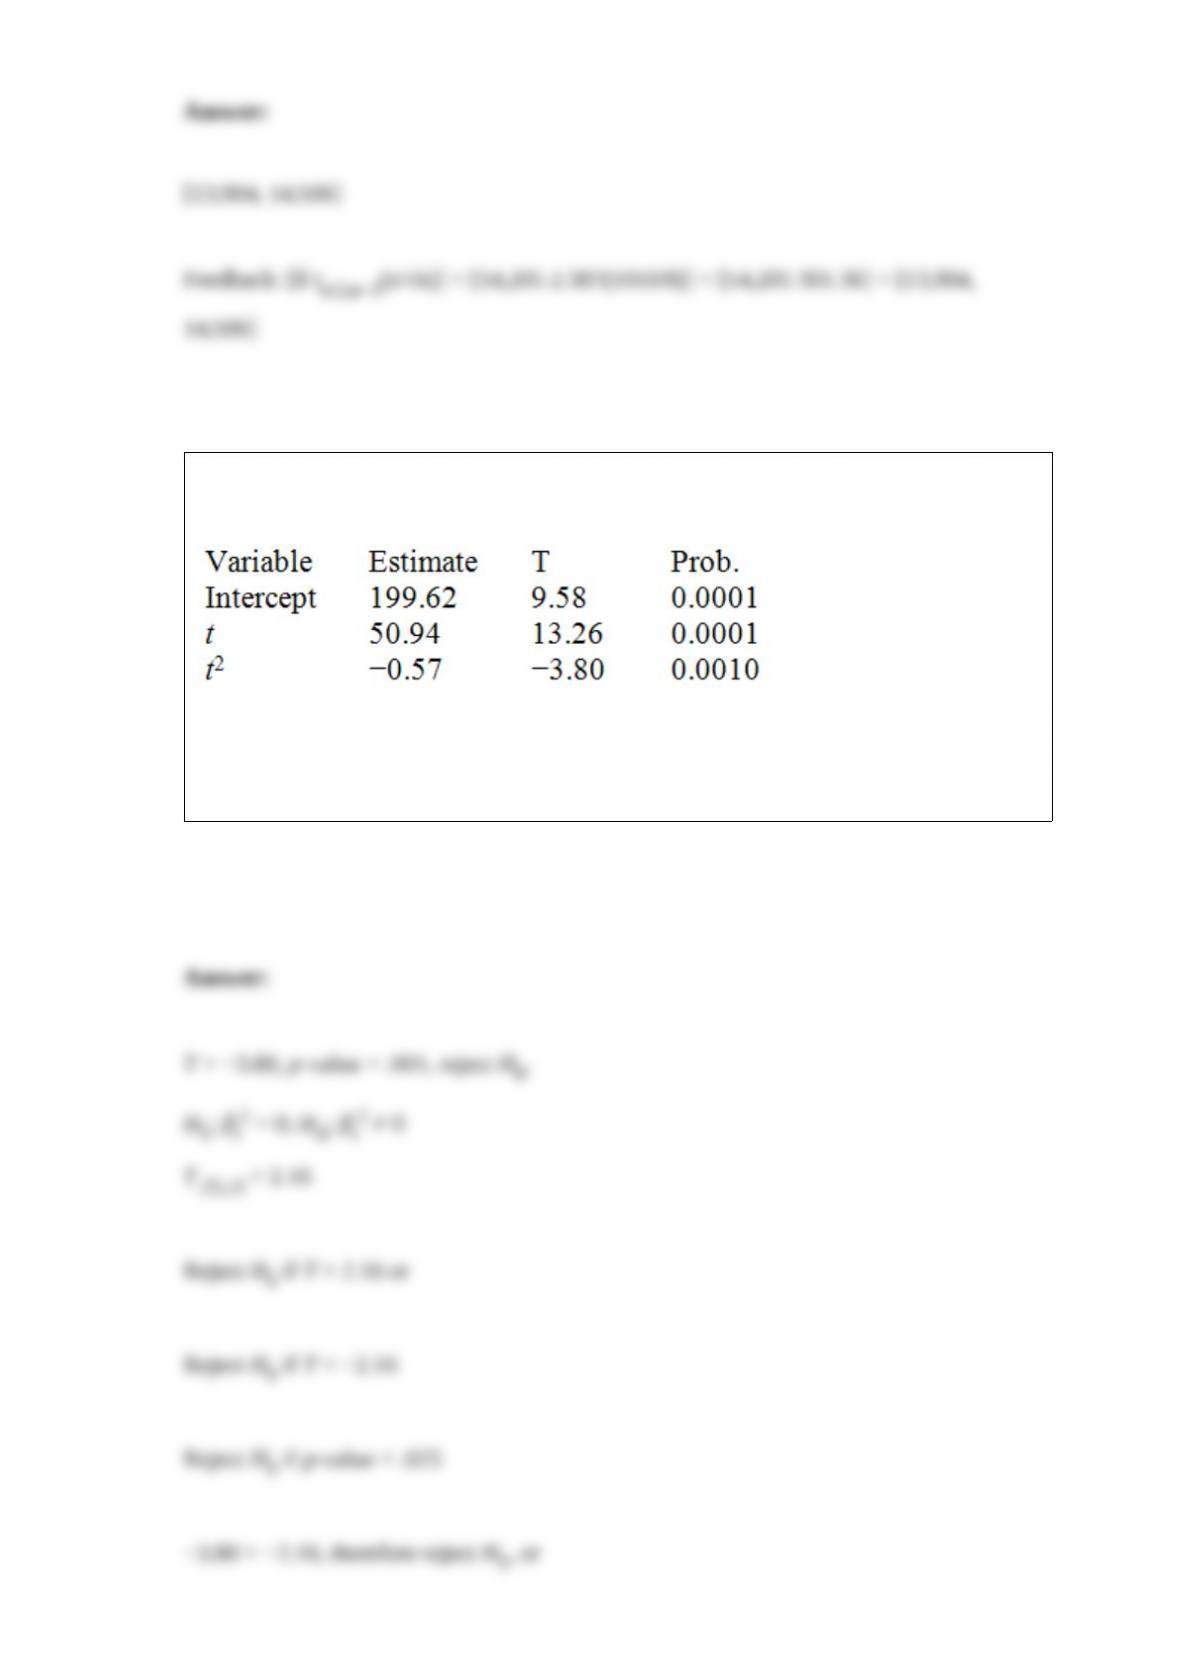
Consider a time series with 15 quarterly sales observations. Using the quadratic trend
model, the following partial computer output was obtained.
Test the significance of the t2 term at α =.05. State the critical T value (rejection point)
and the p-value. Make your decision using a two-sided null hypothesis.
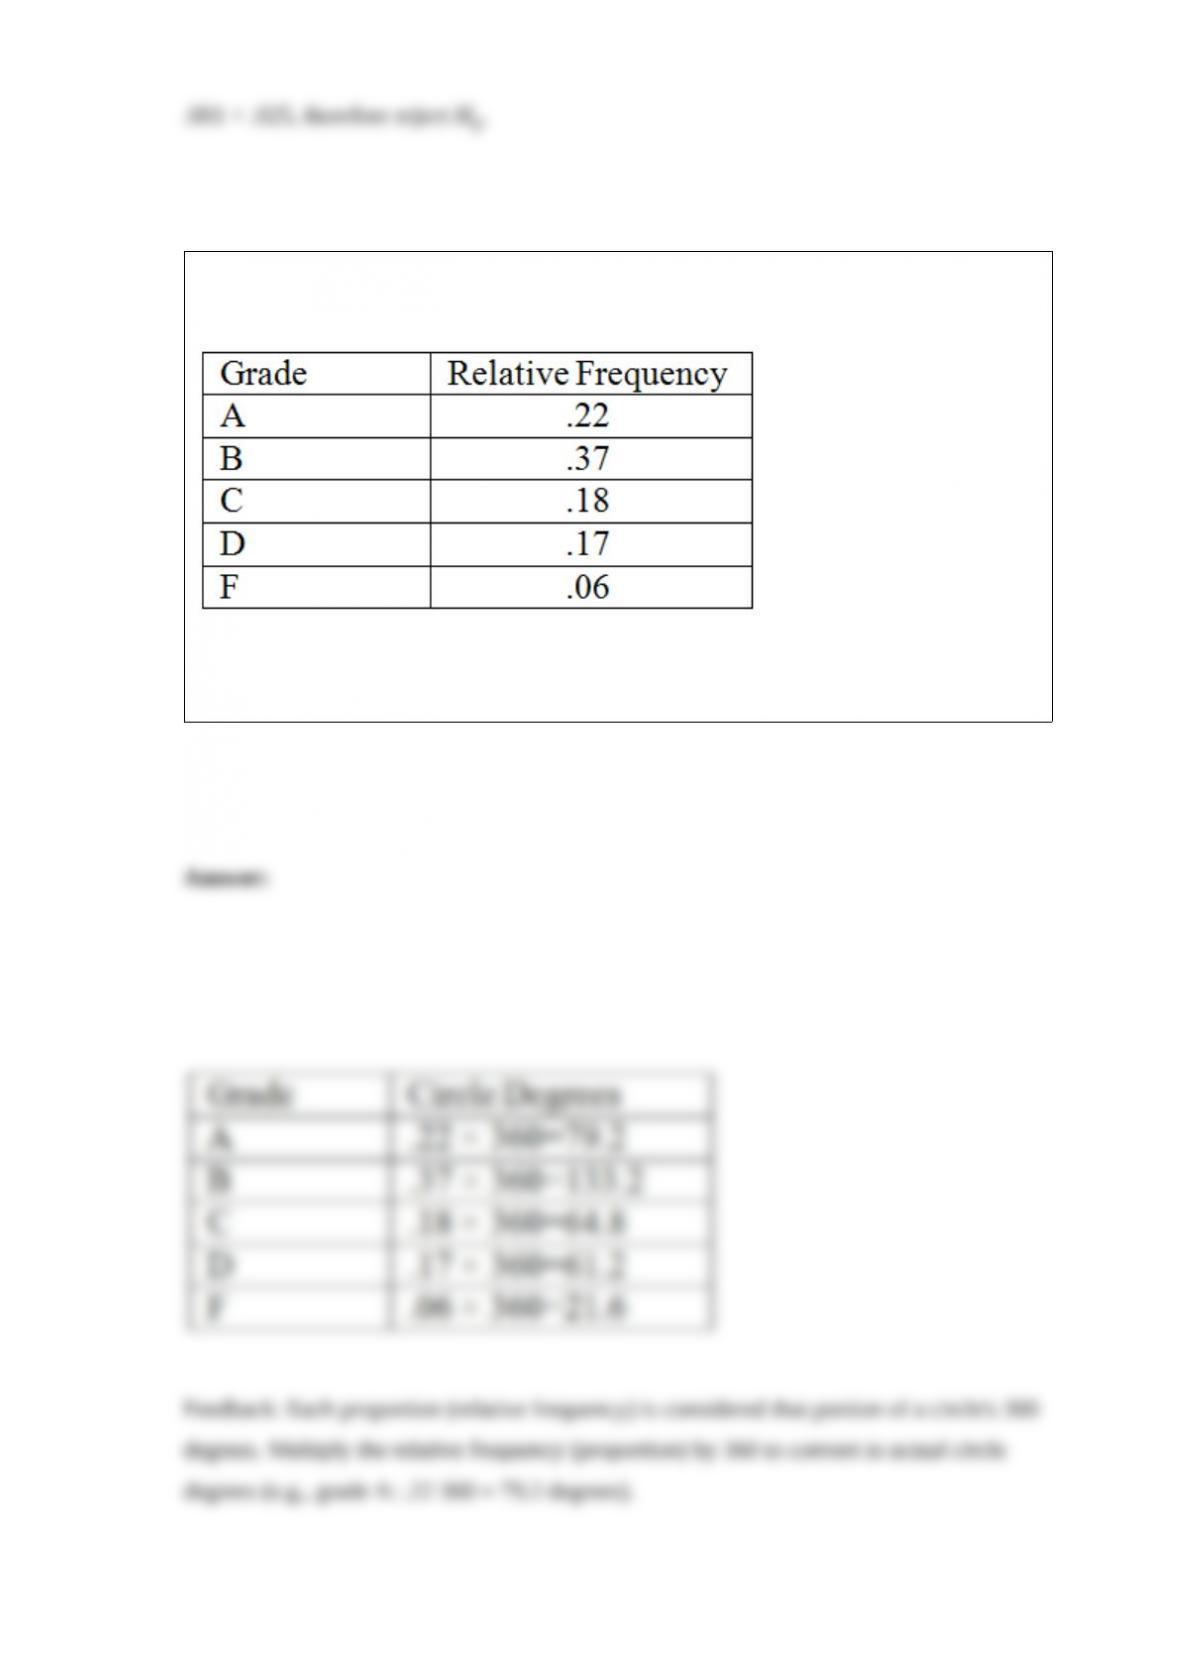
The following is a relative frequency distribution of grades in an introductory statistics
course.
If we wish to depict these data using a pie chart, find how many degrees (out of 360
degrees) should be assigned to each grade.
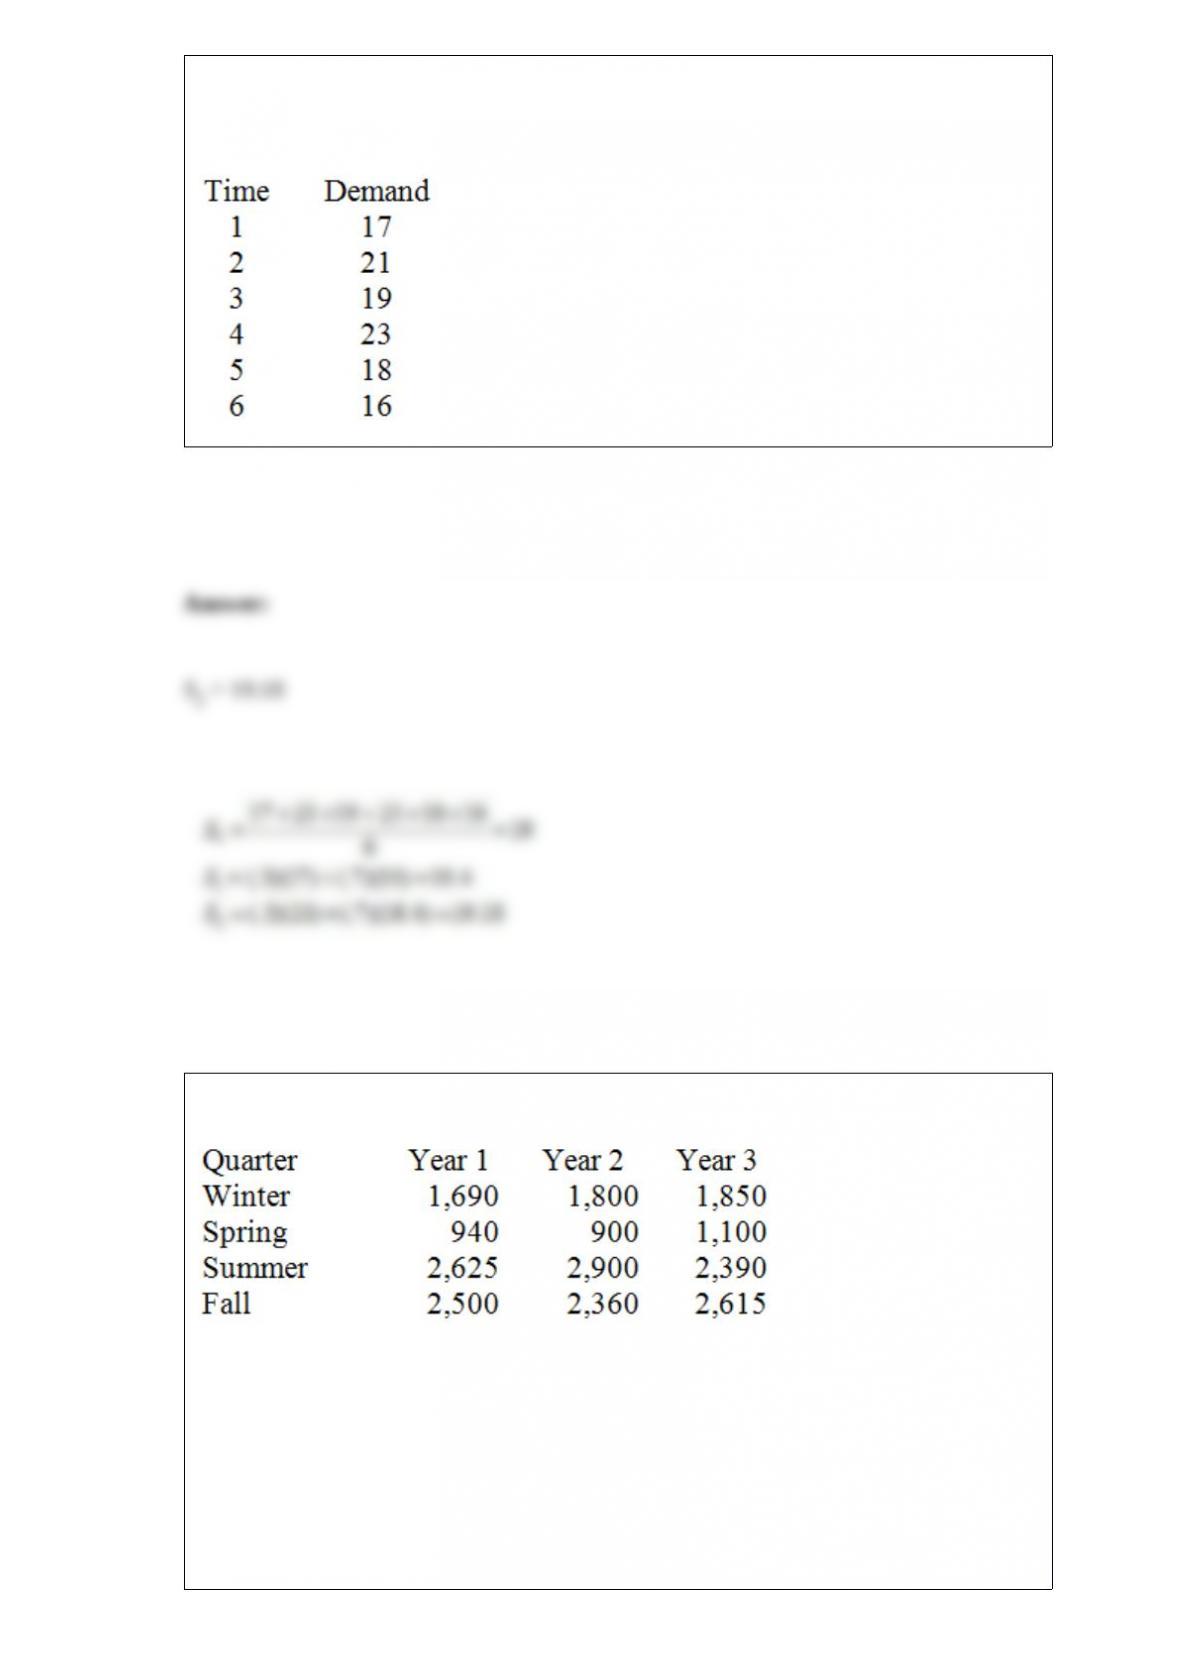
Consider the following data and calculate S2 using simple exponential smoothing and α
= 0.3.
Consider the following set of quarterly sales data, given in thousands of dollars.
The following dummy variable model that incorporates a linear trend and constant
seasonal variation was used: y(t) = B0 + B1t + BQ1(Q1) + BQ2(Q2) + BQ3(Q3) + Et. In
this model, there are 3 binary seasonal variables (Q1, Q2, and Q3), where Qi is a binary
(0,1) variable defined as:
Qi = 1, if the time series data is associated with quarter i;
Qi = 0, if the time series data is not associated with quarter i.
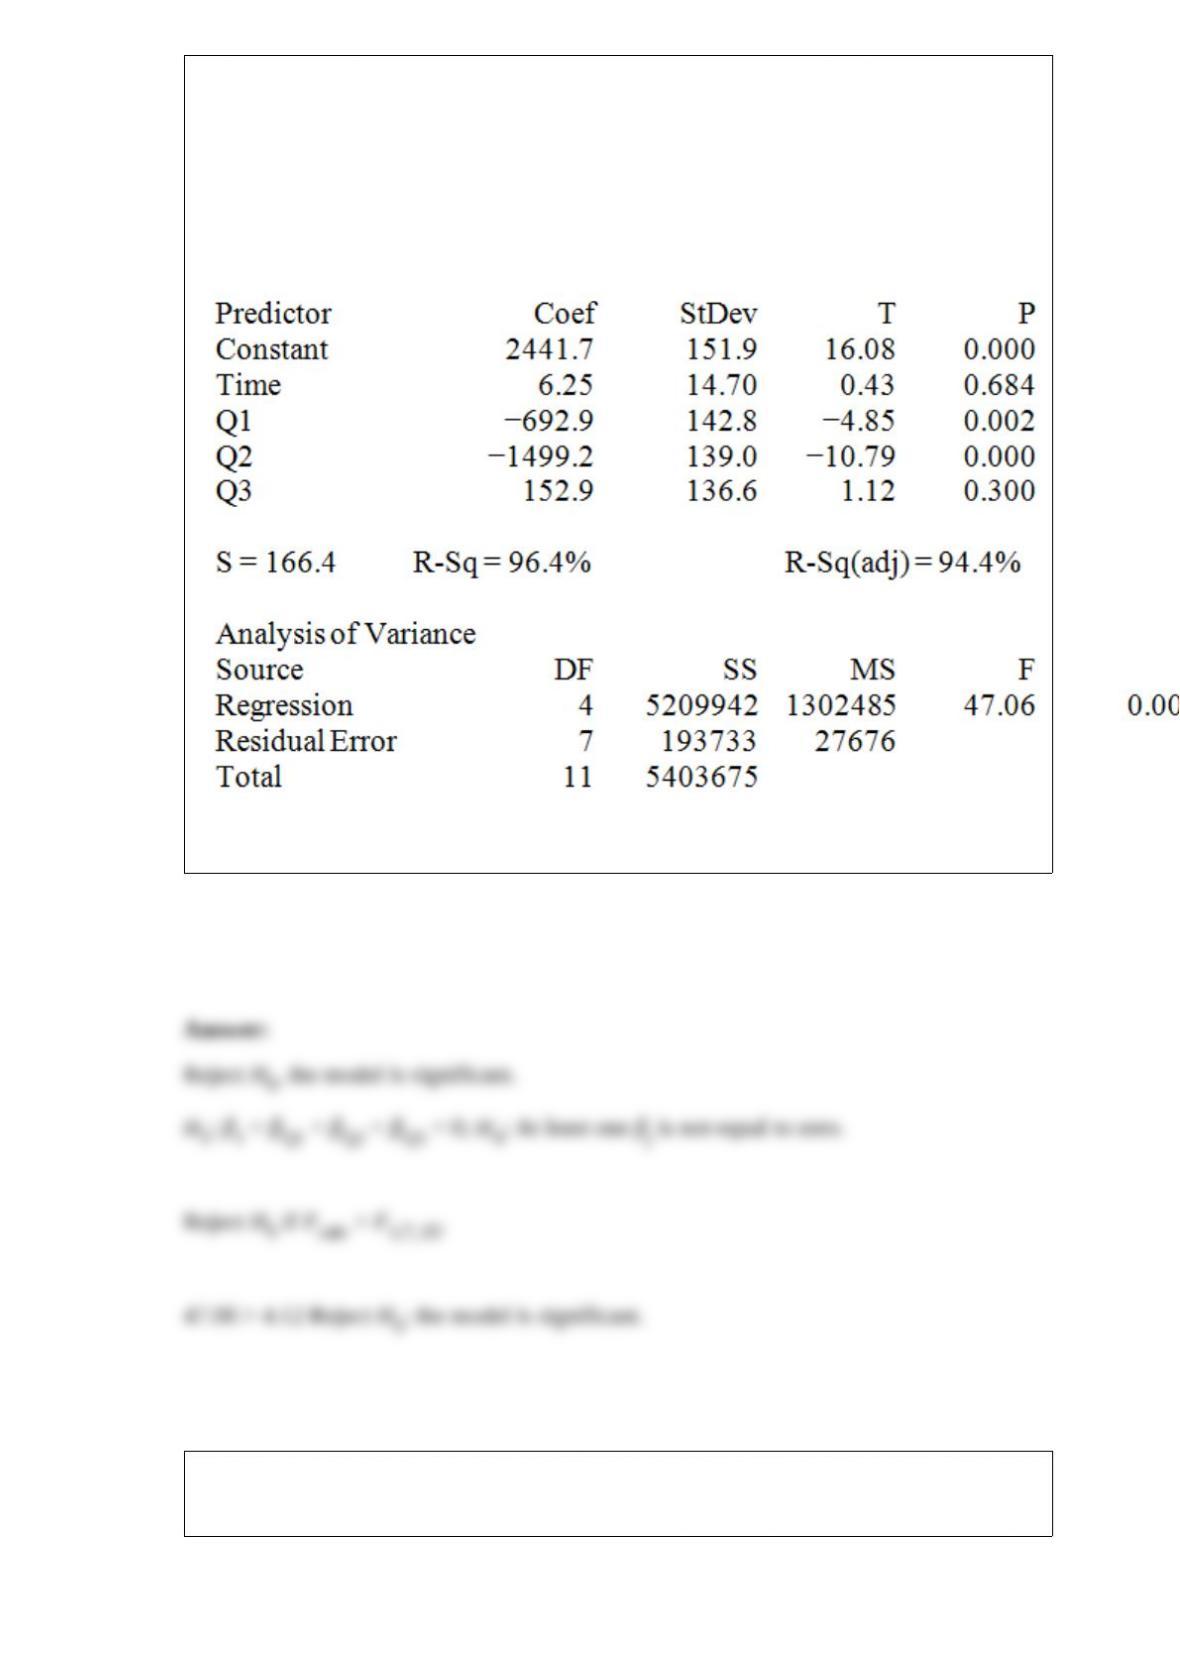
The results associated with this data and model are given in the following Minitab
computer output.
The regression equation is
Sales = 2442 + 6.2 Time − 693 Q1 − 1499 Q2 + 153 Q3
At α = .05, test the significance of the model.
Two forecasting models were used to predict the future values of a time series. The
forecasts are shown below with the actual values.
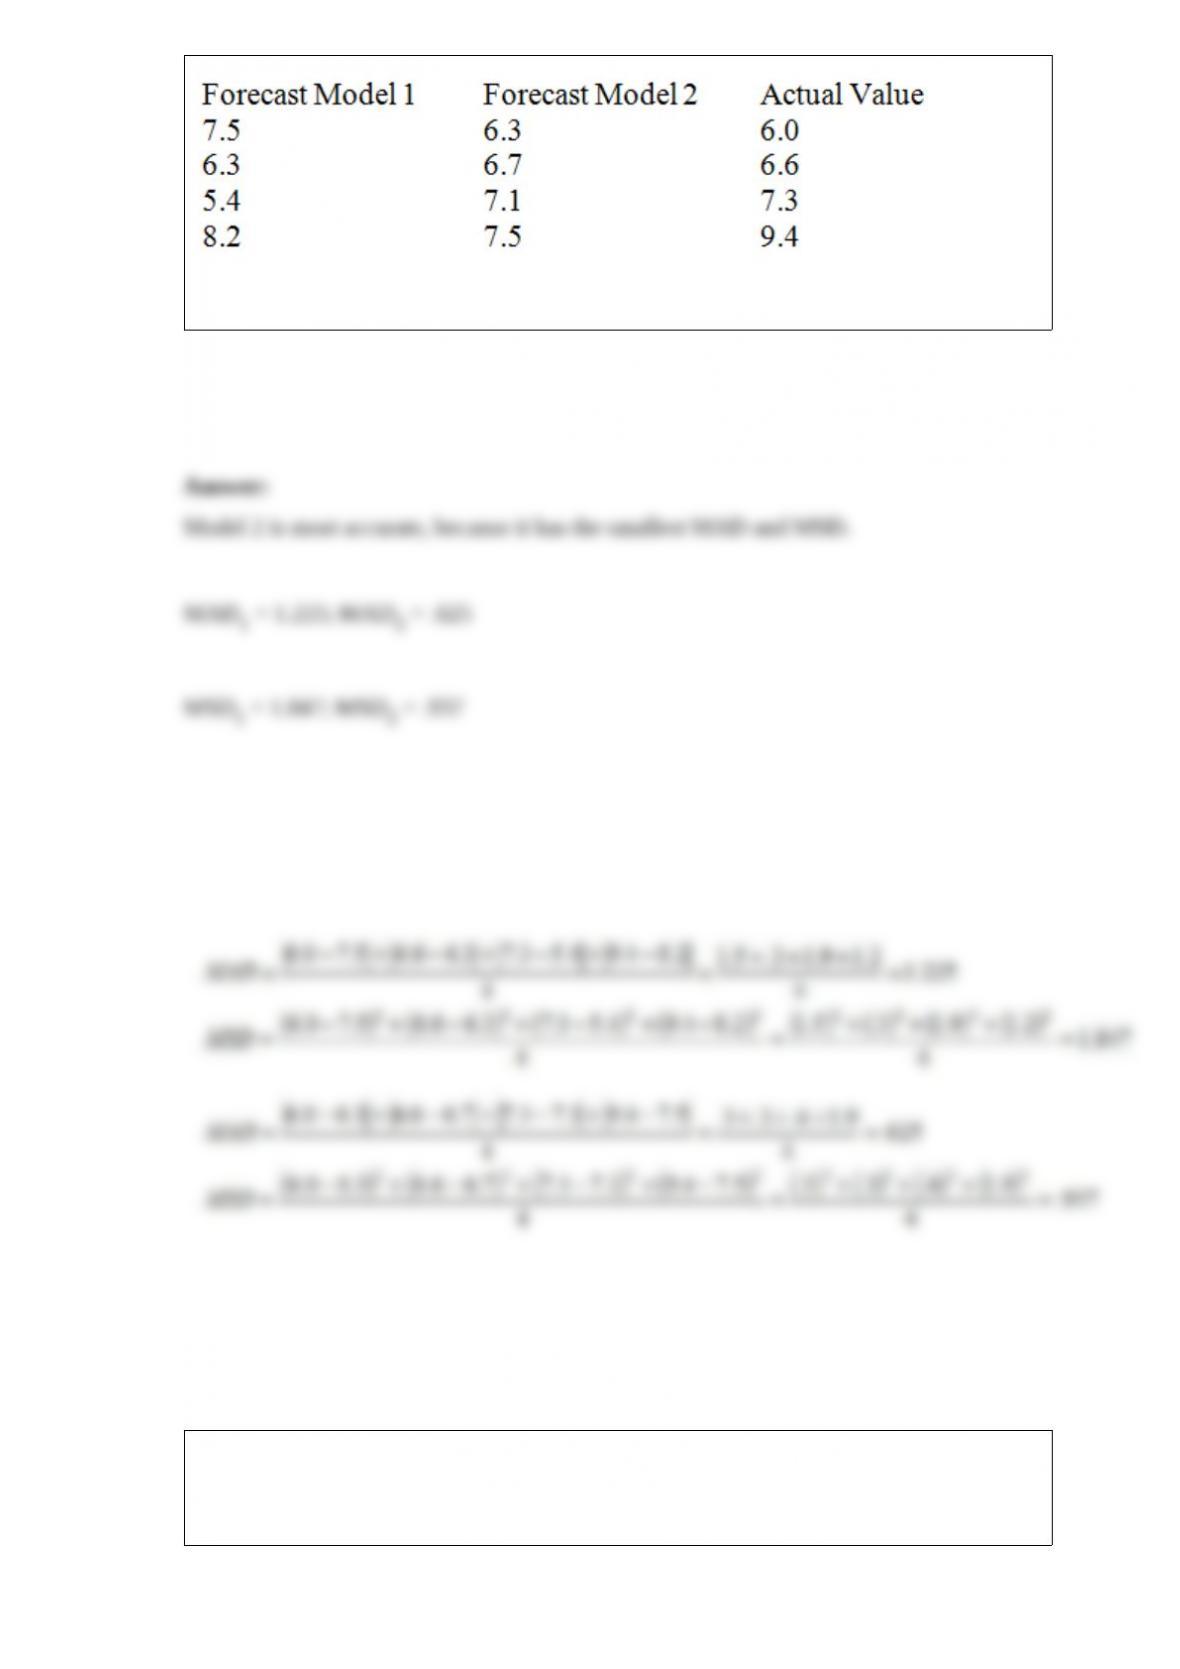
Which model is the most accurate? Why?
A paper presented at a recent meeting of higher education researchers compared the
type of college freshmen attend and the numbers who drop out. A random sample of
freshmen shows the following results.
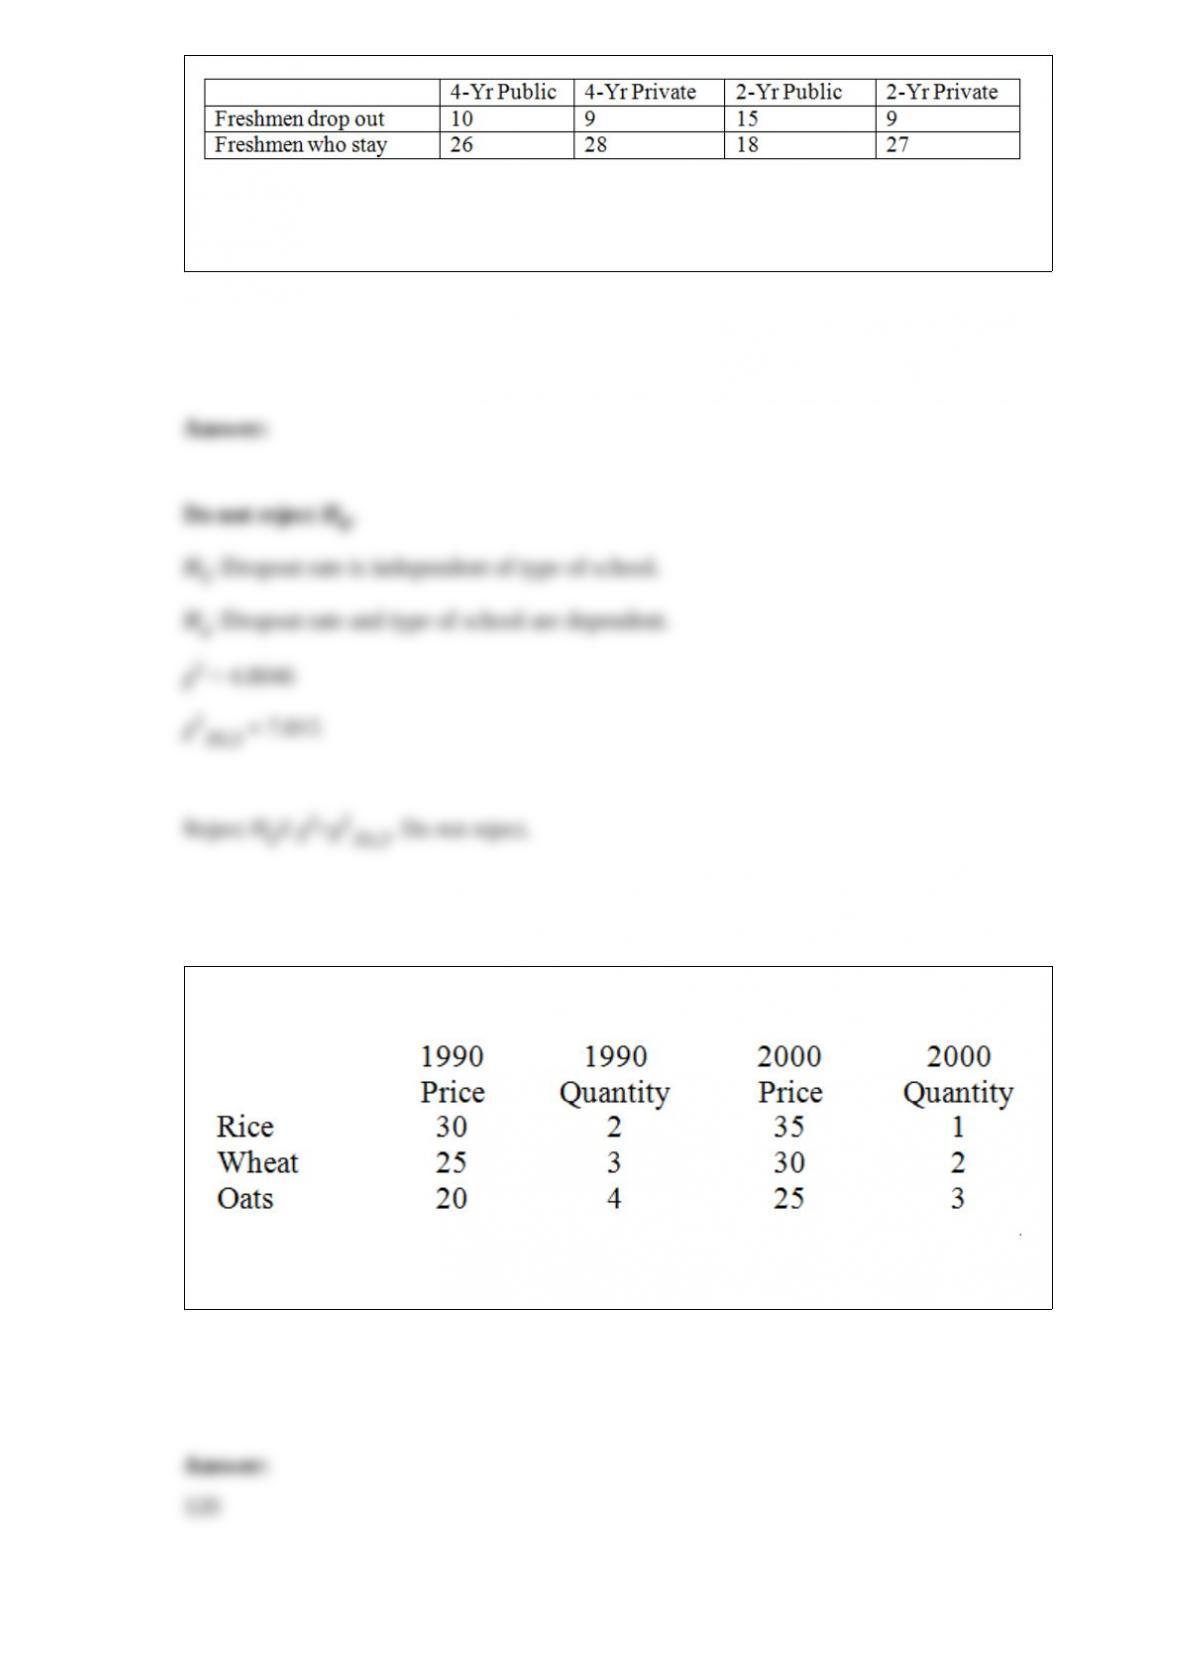
Use a significance level of .05 and determine if the type of school and the drop rate are
independent. (Null hypothesis is that dropout rate is independent of type of school.)
Use the following price information for three grains.
Calculate the aggregate price index.
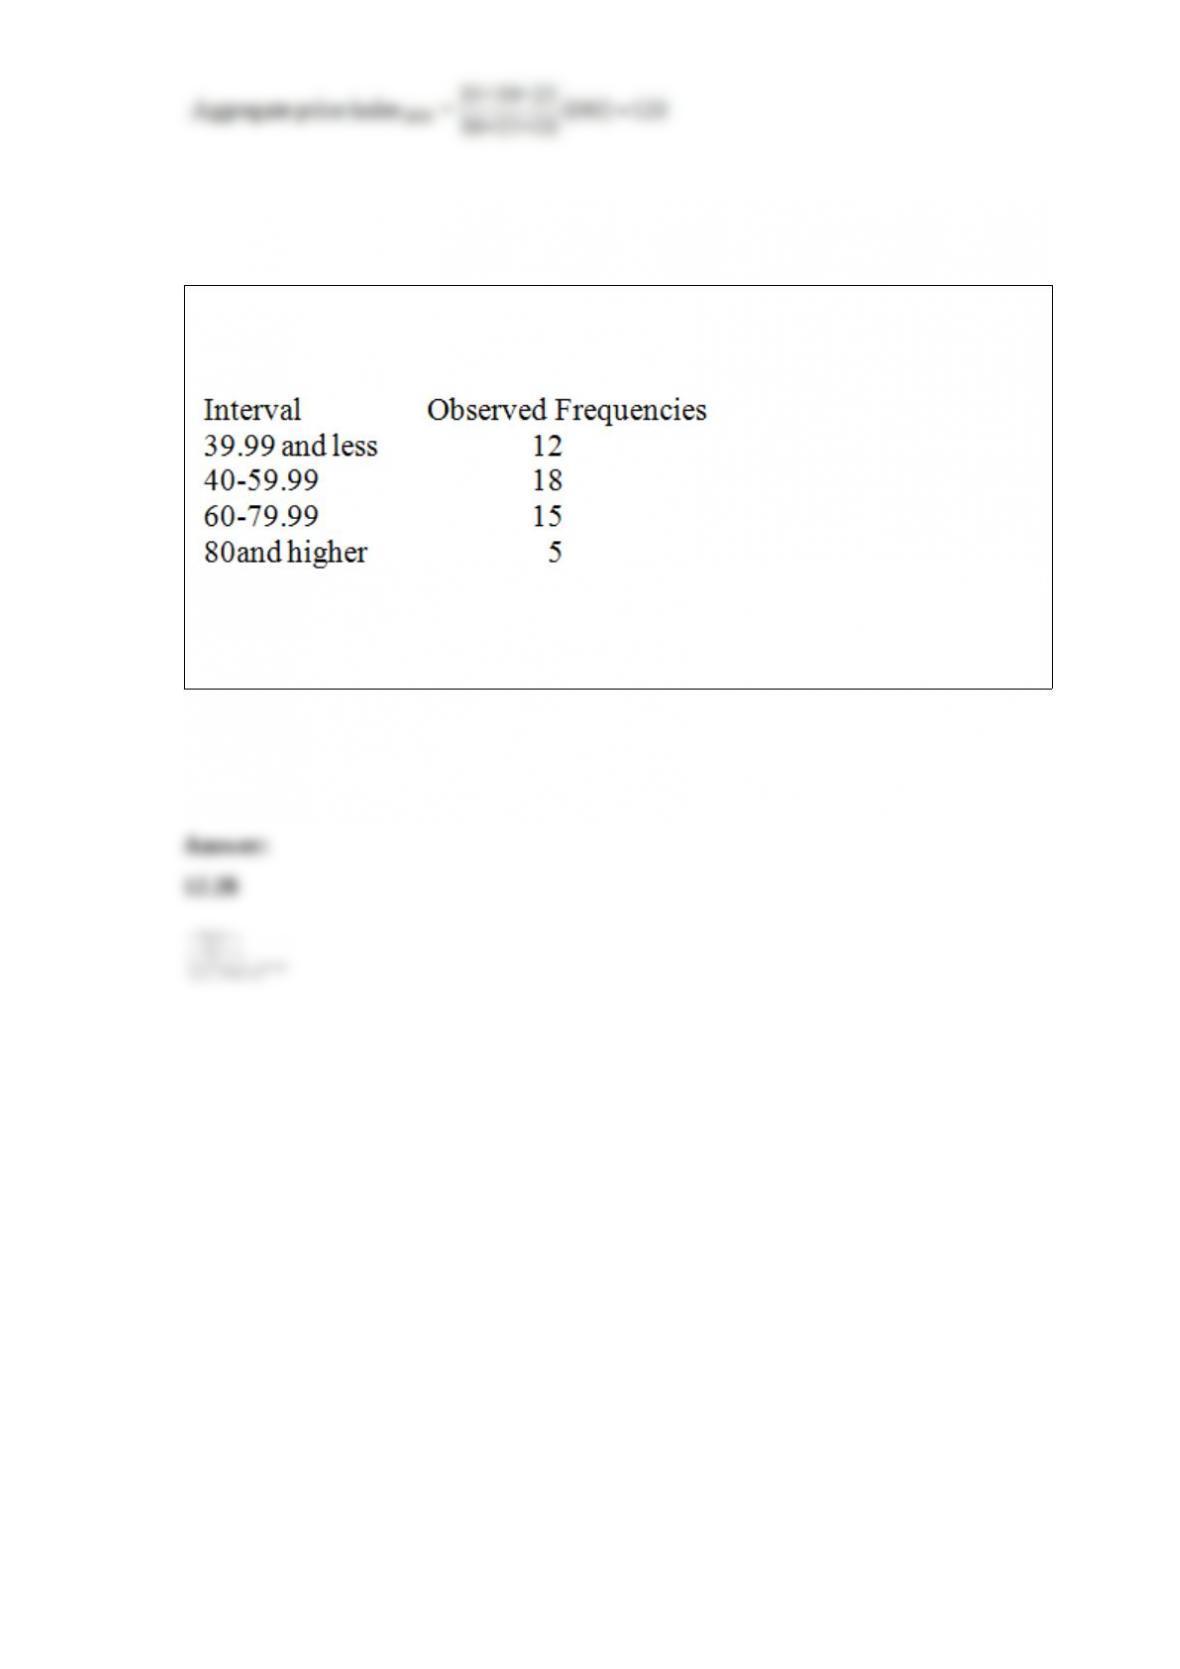
Consider a set of 50 measurements with mean 50.2 and standard deviation 18.7 and
with the following observed frequencies.
It is desired to test whether these measurements came from a normal population.
Calculate the expected frequency for the interval 60-79.99.