

In situations involving two or more variables, both histograms and bar charts can be
used for multiple variables on the same graph.
The variance inflation factor (VIF) provides a measure for each independent variable of
how much multicollinearity is associated with that particular independent variable.
Total process variation is made up of the sum of common cause variation and special
cause variation.
The advantage of using the interquartile range as a measure of variation is that it utilizes
all the data in its computation.


The Central Limit Theorem is of most use to decision makers when the population is
known to be normally distributed.
In an effort to estimate the mean length of stay for motel guests at a major national
motel chain, the decision makers asked for a 95 percent confidence, and a margin of
error of 0.25 days. Further, it was known that the population standard deviation is 0.50
days. Given this, the required sample size to estimate the mean length of stay is about
16 customers.
A useful method for determining whether a linear function is the appropriate function to
describe the relationship between the x and y variable is a residual plot in which the
residuals are plotted on the vertical axis and the independent variable is on the
horizontal axis.


In a single exponential smoothing model, one smoothing constant is used to weigh the
historical data, and the model is of primary value when the data do not exhibit trend or
seasonal components.
The six most common sources of variation are people, machines, materials, methods,
measurement, and environment.
In a study of employees at a local company, the human resource manager wants to
develop a multiple regression model to explain the difference in employee wage rates.
She is thinking of including a variable, degree status, in which the following categories
exist: no degree, H.S. degree, junior college degree, bachelor degree, graduate degree.
One appropriate approach for including this variable is to code the categories 1, 2, 3, 4,
and 5.


The size of the standard error of the sample proportion is dependent on the value of the
population proportion and the closer the population proportion is to .50, the larger the
standard error for a given sample size will be.
A point estimate for the population mean will always fall within the confidence interval
estimate.
The goodness-of-fit test is always a one-tail test with the rejection region in the upper
tail.
The population of incomes in a particular community is thought to be highly
right-skewed with a mean equal to $36,789 and a standard deviation equal to $2,490.
Based on this, if a sample of size n = 36 is selected, the sampling distribution would


have a mean equal to the population mean, but the standard deviation of the sampling
distribution will be one-sixth of the population standard deviation.
Recently, a study was done to determine whether the median speed on a section of
highway is the same for cars versus trucks. A sample of 12 cars (n1 = 12) and 15 trucks
(n2 = 15) was collected. If the Mann-Whitney U test is to be performed using an alpha =
.05 and if the U test statistic is calculated to be 68, the null hypothesis should be
rejected.
For the same data, a graph of a relative frequency distribution will look exactly the
same as a graph of the frequency distribution.
The number of customers who arrive at a fast food business during a one-hour period is
known to be Poisson distributed with a mean equal to 8.60. The probability that


between 2 and 3 customers inclusively will arrive in one hour is 0.0263.
After developing a frequency distribution for a quantitative variable, a histogram can be
developed with the horizontal axis representing the values of the variable and the
vertical axis representing the frequency of occurrence in each class or group.
In employing the Mann-Whitney U test, the sample data from the two populations are
first combined and the ranks of the data are determined, but we keep track of which
population each ranked item came from.
Mail questionnaires typically generate poor response rates.

If a stepwise regression approach is used to enter, one at a time, four variables into a
regression model, the resulting regression equation may differ from the regression
equation that occurs when all four of the variables are entered at one step.
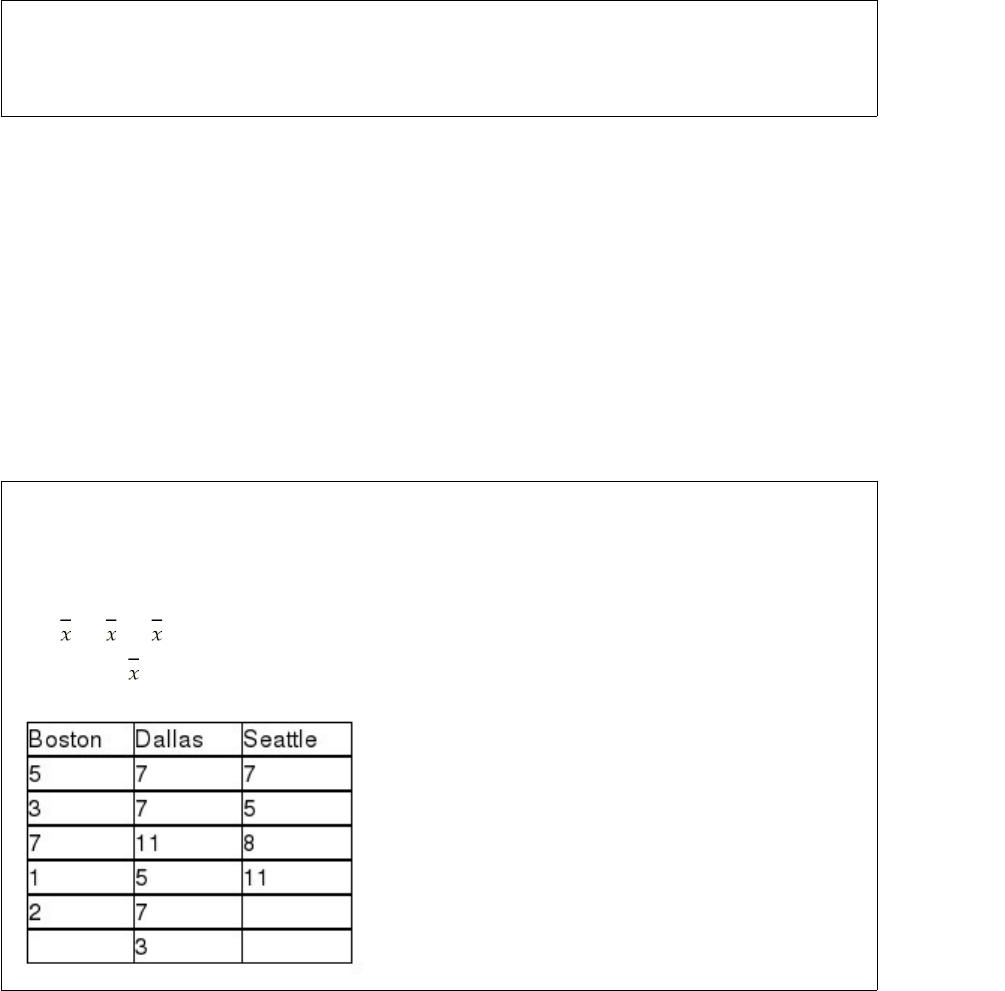
A national car rental agency is interested in determining whether the mean days that
customers rent cars is the same between three of its major cities. The following data
reflect the number of days people rented a car for a sample of people in each of three
cities. Given this information, the correct null and alternative hypotheses are:
H0 : 1 = 2 = 3
Ha : not all jare equal.


The goodness-of-fit test is essentially determining if the test statistic is significantly
larger than zero.
The Varden Packaging Company has a contract to fill 50-gallon barrels with gasoline
for use by the U.S. Army. The machine that Varden uses has an adjustable device that
allows the average fill per barrel to be adjusted as desired. However, the actual
distribution of fill volume from the machine is known to be normally distributed with a
standard deviation equal to 0.5 gallons. The contract that Varden has with the military
calls for no more than 2 percent of all barrels to contain less than 49.2 gallons of
gasoline. In order to meet this requirement, Varden should set the mean fill to
approximately 50.225 gallons.
The following is an appropriate statement of the null and alternate hypotheses for a test
of a population mean:
H0: μ < 50
HA : μ > 50


Interaction terms and polynomial terms should not be included in the same multiple
regression model.
If a polynomial model has a larger R-square than a linear model for the same set of
data, this is one indication that the polynomial model fits the data better than the linear
model.
Where there are two independent variables in a multiple regression, the regression
equation forms a plane.
If the correlation between two variables is known to be statistically significant at the
0.05 level, then the regression slope coefficient will also be significant at the 0.05 level.

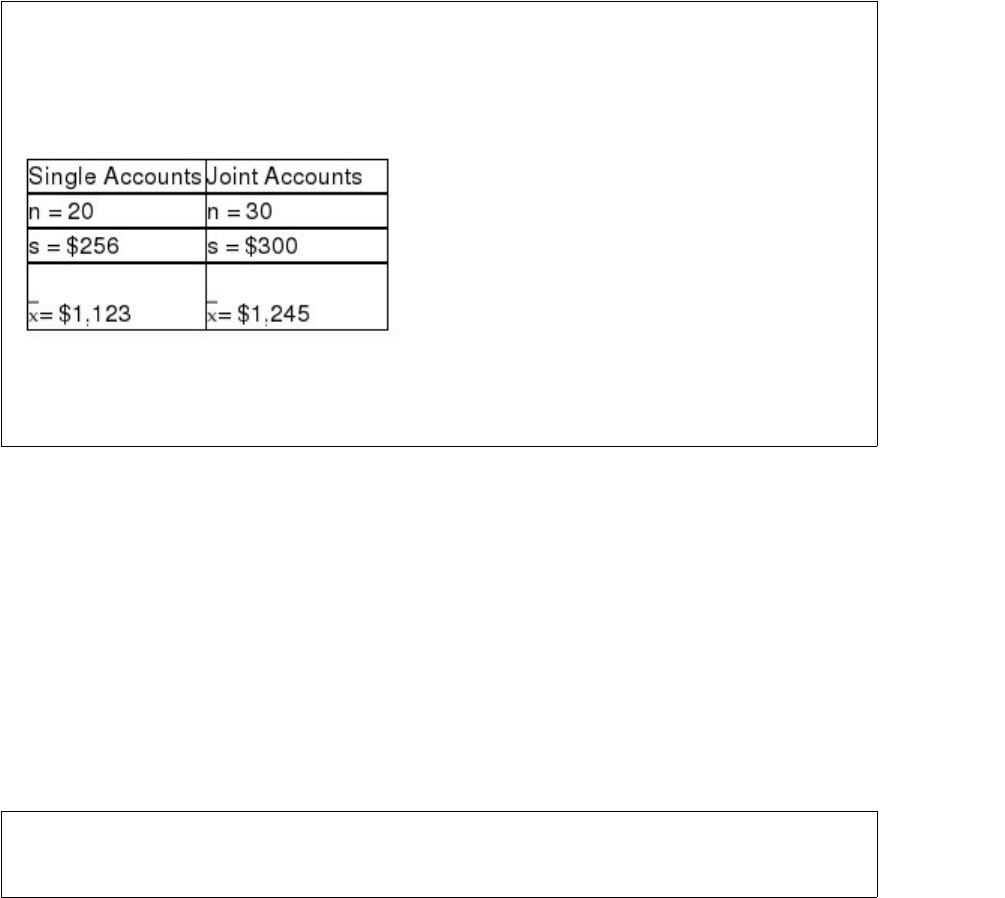
There is interest at the American Savings and Loan as to whether there is a difference
between average daily balances in checking accounts that are joint accounts (two or
more members per account) versus single accounts (one member per account). To test
this, a random sample of checking accounts was selected with the following results:
Based upon these data, the critical value from the t-distribution for testing the difference
between the two population means using a significance level of 0.05 is t = 1.6772.
All of the factors that are needed to determine the required sample size are within the
control of the decision maker.


The city council consists of 3 Democrats, 5 Republicans and 3 independents.
Subcommittees are supposed to be randomly assigned from the council. Suppose the
5-member planning and zoning subcommittee is composed of 3 Democrats and 2
Republicans. The probability of this happening by chance alone is approximately .4545.
The t-distribution is used for the critical value when estimating a population proportion
when the standard deviation of the population is not known.
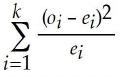
If the calculated chi-square statistic is large, this is evidence to suggest the fit of the
actual data to the hypothesized distribution is not good, and H0 should be rejected.
In a study involving car owners, one question asked the owner for the number of miles
driven last year. A second question asked the owner for the age of the vehicle. A
histogram would be useful for analyzing the relationship between miles driven and the
age of the vehicle.


Stepwise selection will always find the best regression model.
In developing a confidence interval estimate, the margin of error is directly dependent
on the value of the point estimate.
In estimating the difference between two population means based on small, independent
samples from the two populations, two important assumptions are that the populations
each be normally distributed and the populations have equal variances.


You are given the following null and alternative hypotheses:
If the true population mean is 1.25, calculate the power of the test. Assume the
population standard deviation is known to be 0.50 and the sample size is 60.
A) 0.49
B) 0.20
C) 0.96
D) 0.60
If a residual plot exhibits a curved pattern in the residuals, this means that:
A) the errors are not normally distributed.
B) there must be a curvilinear relation between x and y.
C) there is no significant relation between x and y.
D) there is a problem with constant variance.


A study was recently done in which the brand preference for breakfast cereal was
analyzed against the gender of the shopper. The study consisted of 200 male shoppers
and 300 female shoppers. Three different cereal brands were considered: A, B, and C. A
total of 250 female shoppers preferred brand A, 25 female shoppers preferred brand C.
A total of 100 shoppers preferred brand B. The number of male shoppers that preferred
brand B was:
A) 25.
B) 100.
C) 75.
D) 50.
Sales data measured each week for the past twenty weeks are examples of time-series
data.
Which of the following statements is true in simple linear regression?
A) The standard error of the estimate is equal to the standard error of the slope.
B) The total degrees of freedom are (n-2).
C) The coefficient of determination is equal to the correlation of x and y.

D) The p-value of the F test will equal the p-value of the t-test of the slope.
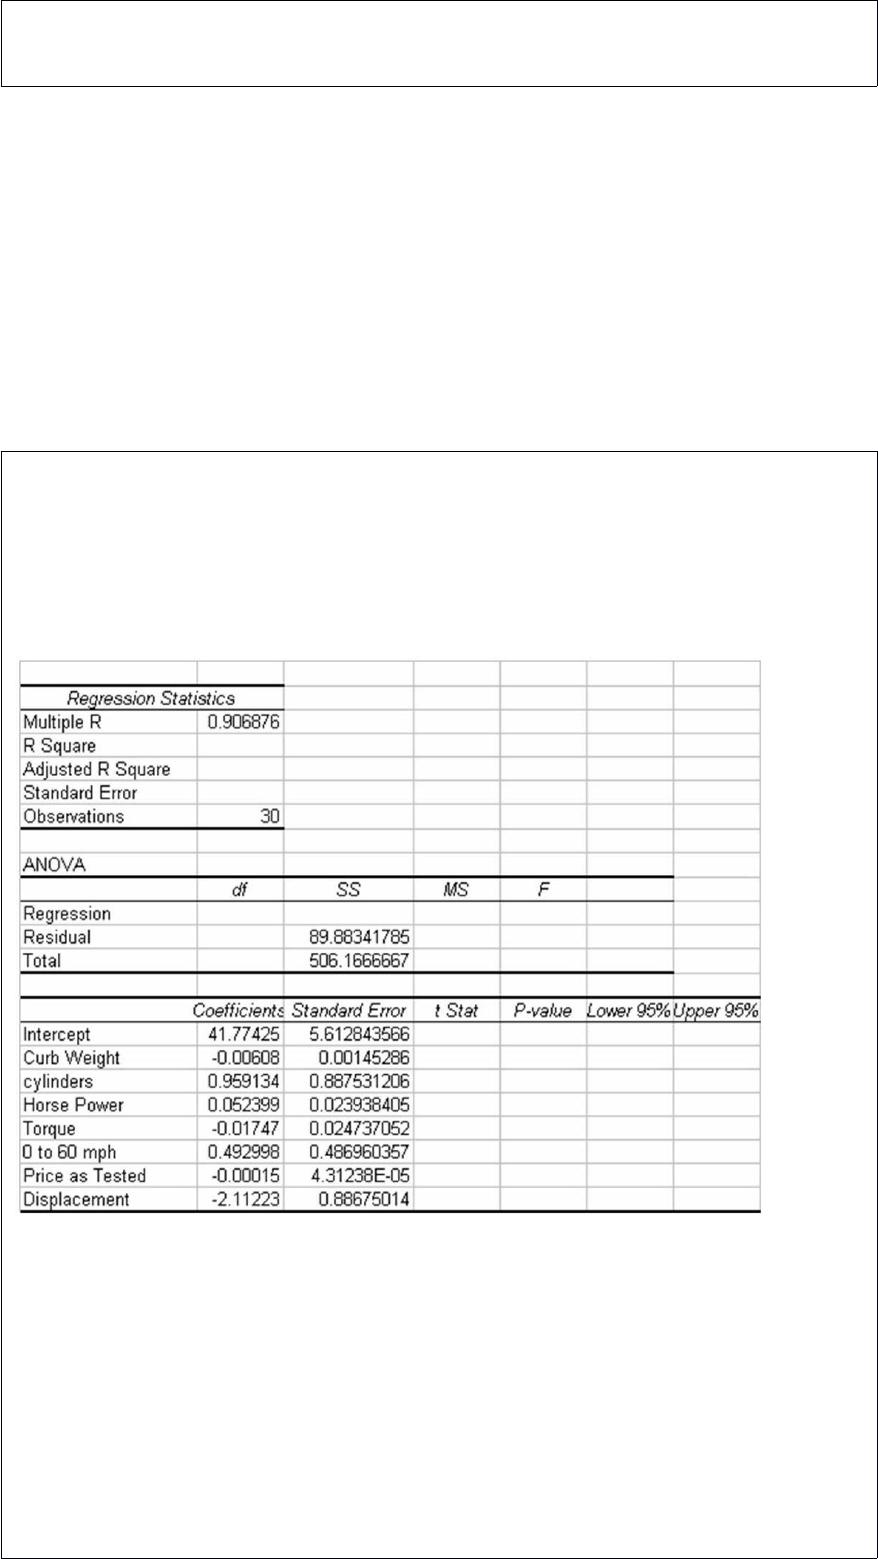
The editors of a national automotive magazine recently studied 30 different automobiles
sold in the United States with the intent of seeing whether they could develop a multiple
regression model to explain the variation in highway miles per gallon. A number of
different independent variables were collected. The following regression output (with
some values missing) was recently presented to the editors by the magazine’s analysts:
Based on this output and your understanding of multiple regression analysis, how many
degrees of freedom are associated with the Residual in the ANOVA table?
A) 19
B) 22
C) 7
D) 29


The Vardon Exploration Company is getting ready to leave for South America to
explore for oil. One piece of equipment requires 10 batteries that must operate for more
than 2 hours. The batteries being used have a 15 percent chance of failing within 2
hours. The exploration leader plans to take 15 batteries. Assuming that the conditions of
the binomial apply, the probability that the supply of batteries will contain enough good
ones to operate the equipment is:
A) 0.0449
B) 0.9832
C) 0.0132
D) 0.9964
A hypothesis test for the difference between two means is considered a two-tailed test
when:
A) the population variances are equal.
B) the null hypothesis states that the population means are equal.
C) the alpha level is 0.10 or higher.
D) the standard deviations are unknown.


The Cresswell Company updates its annual sales forecast every month as new sales data
becomes available. The one-month update is called:
A) the planning horizon.
B) the forecast period.
C) the forecast interval.
D) the forecasting horizon.
The Bradfield Container Company makes “cardboard” boxes for commercial use (i.e.,
pizza boxes). One of the big issues for the company is the set-up time required to
change over from one order to the next. At one particular machine, the set-up time is
thought to be uniformly distributed between 10 and 21 minutes. To test whether this is
true or not, a random sample of 180 set-ups on this machine was selected with set-up
time rounded to the nearest two-minute intervals. The following results occurred:
Set-up Time Frequency
10-11 minutes 13
12-13 minutes 23
14-15 minutes 40
16-17 minutes 44
18-19 minutes 40


20-21 minutes 20
a. What are the appropriate null and alternative hypothesis to be tested?
b. Based on the null and alternative hypotheses stated in part a, determine the expected
frequencies for each set-up time category.
c. Assuming that we wish to conduct the hypothesis test at the .05 level, what is the
critical value that should be used?
d. Compute the test statistic and carry out the hypothesis test.


Which of the following is not a type of commonly used process control chart?
A) x-bar chart
B) R-chart
C) p-chart
D) n-chart
A local FedEx/Kinkos has three black-and-white copy machines and two color copiers.
Based on historical data, the chances that each black-and-white copier will be down for
repairs is 0.10. The color copiers are more of a problem and are down 20% of the time
each.
Based on this information, what is the probability that if a customer needs a color copy,
both color machines will be down for repairs?
A) 0.04
B) 0.96
C) 0.47
D) 0.42

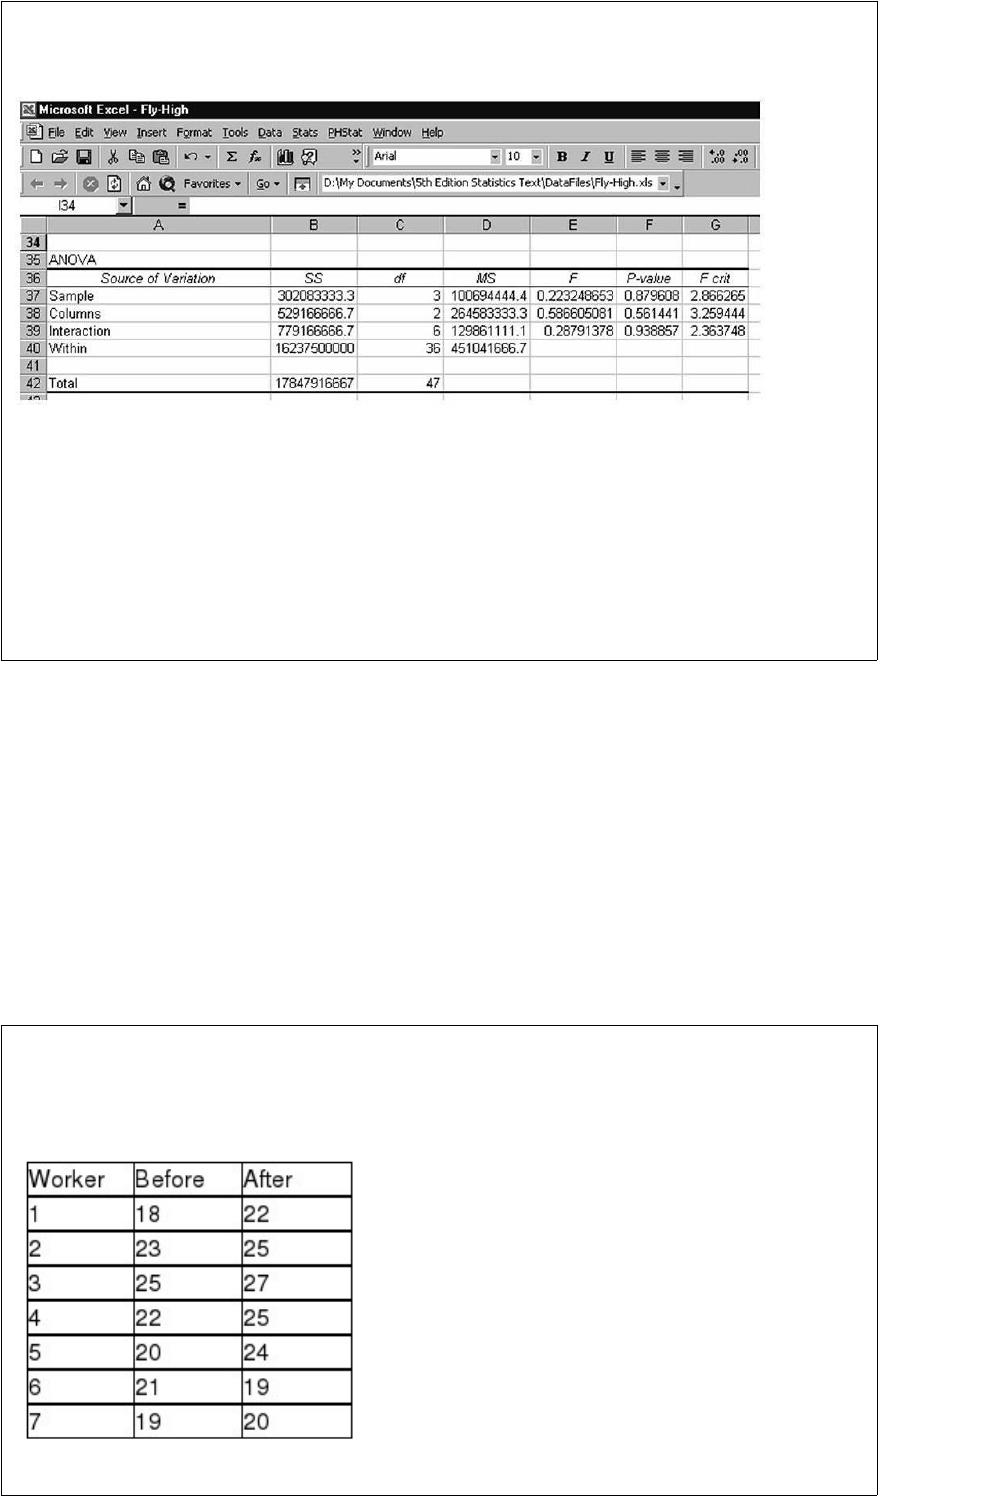
Considering the following printout from a two-factor ANOVA design, how many levels
of factor A (Sample) were there in this study?
A) 4
B) 3
C) 2
D) 6
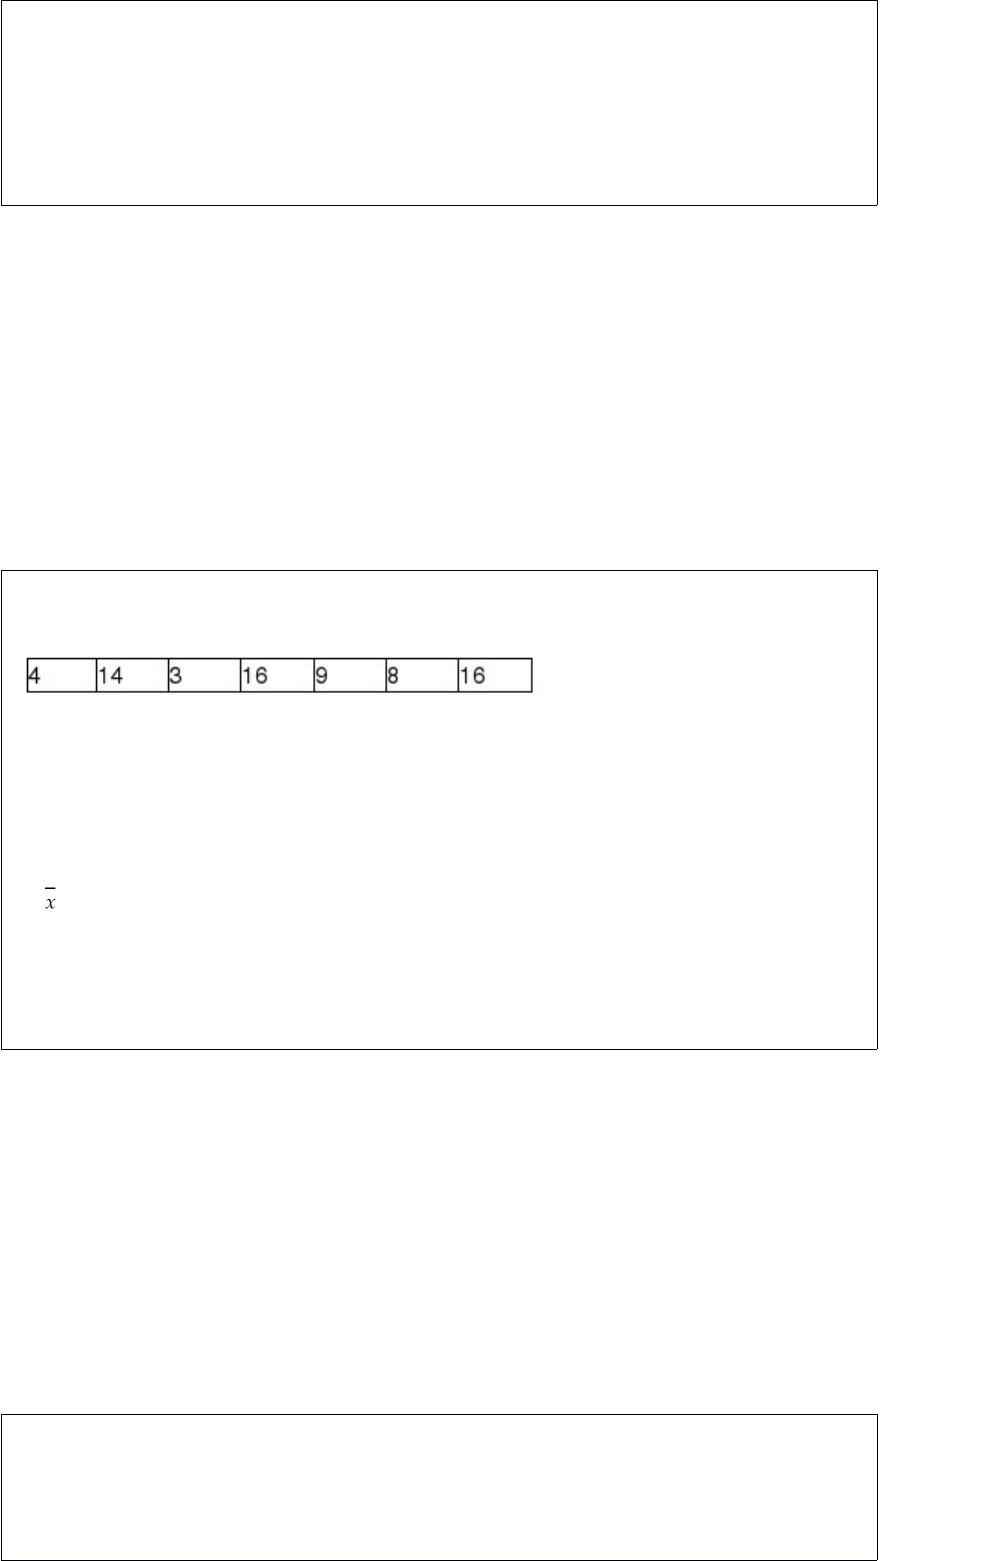
To increase productivity, workers went through a training program. The management
wanted to know the effectiveness of the program. A sample of seven workers was taken
and their daily production rates before and after the training are shown below.


Based on the data, the training program is:
A) effective.
B) ineffective.
C) neither effective nor ineffective.
D) None of the above
Students who have completed a speed reading course have reading speeds that are
normally distributed with a mean of 950 words per minute and a standard deviation
equal to 220 words per minute. Based on this information, what is the probability of a
student reading at more than 1400 words per minute after finishing the course?
A) 0.0202
B) 0.5207
C) 0.4798
D) 0.9798
When sampling from a population, the sample mean will:
A) typically exceed the population mean.


B) likely be different from the population mean.
C) always be closer to the population mean as the sample size increases.
D) likely be equal to the population mean if proper sampling techniques are employed.
When discussing variation in the output of a process, which of the following is not true?
A) Variation is natural.
B) No two products or services are exactly the same.
C) With a fine enough measurement gauge, all things can be seen to differ.
D) Common cause variation can be eliminated.
A p-chart is useful for:
A) analyzing whether a process for a measurable variable is in or out of control.
B) analyzing processes which yield attribute data.
C) determining what the most likely cause of defects is.
D) All of the above


The following data reflect the number of customers who test drove new cars each day
for a sample of 20 days at the Redfield Ford Dealership.
Given these data, what is the variance?
A) 0.69
B) Approximately 3.08
C) Approximately 9.52
D) Approximately 181
In testing for differences between the means of two paired populations, an appropriate
null hypothesis would be:
A) H0 : μD = 2
B) H0 : μD = 0
C) H0 : μD < 0
D) H0 : μD > 0


The power of a test is measured by its capability of:
A) rejecting a null hypothesis that is true.
B) not rejecting a null hypothesis that is true.
C) rejecting a null hypothesis that is false.
D) not rejecting a null hypothesis that is false.
What does the term expected cell frequencies refer to?
A) The frequencies found in the population being examined
B) The frequencies found in the sample being examined
C) The frequencies computed from H0
D) the frequencies computed from H1


Which of the following statements about the Durbin-Watson d statistic is true?
A) It can assume any value between 0 and 4.
B) It may assume any value between -4 and + 4.
C) It may assume any positive value.
D) It has a maximum value of 2.
Which of the following is not considered to be a stepwise regression technique?
A) Forward selection regression
B) Optimal variable entry and removal regression
C) Backward elimination
D) Standard stepwise regression
In a large sample Mann-Whitney U test in which the sample size from the first
population is 30 and the sample size from the second population is 40, which of the
following is the expected U value if the null hypothesis of equal median values is true?
A) 1,200

B) 70
C) 35
D) 600
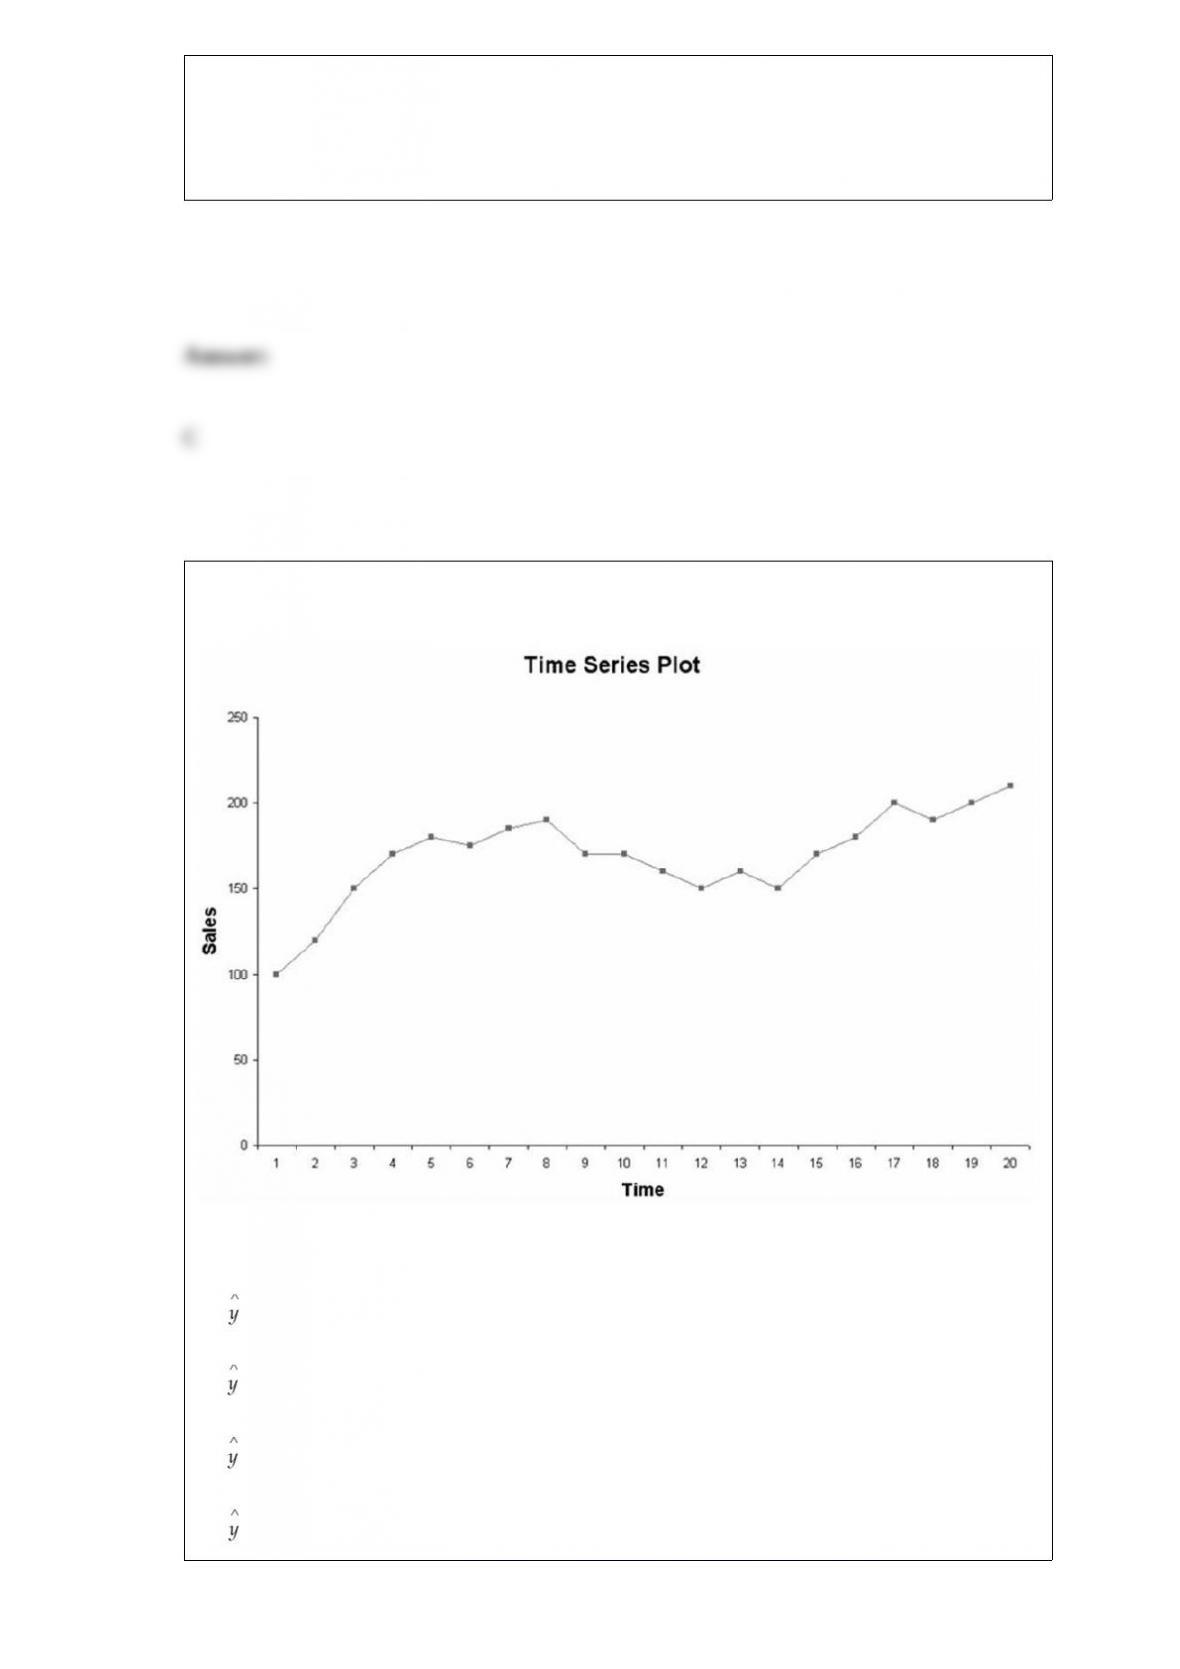
A small company has 7 employees. The numbers of years these employees have worked
for this company are shown as follows:
Based upon this information, the mean number of years that employees have been with
this company is:
A) 16
B)
C) 8.40
D) 10
If a sample of n = 30 people is selected and the sample correlation between two
variables is r = 0.468, what is the test statistic value for testing whether the true
population correlation coefficient is equal to zero?


A) About t = 2.80
B) About t = -.3.01
C) t = 2.0484
D) Can’t be determined without knowing the level of significance for the test.
You are given the following null and alternative hypotheses:
Calculate the probability of committing a Type II error when the population mean is
505, the sample size is 64, and the population standard deviation is known to be 36
A) 0.1562
B) 0.5997
C) 0.3426
D) 0.8888
According to the most recent Labor Department data, 10.5% of engineers (electrical,
mechanical, civil, and industrial) were women. Suppose a random sample of 50
engineers is selected. How likely is it that the random sample will contain fewer than 5


women in these positions?
A) 0.4522
B) 0.3124
C) 0.5121
D) 0.5512
Beacon Hill Trees & Shrubs currently has an inventory of 10 fruit trees, 8 pine trees,
and 14 maple trees. It plans to give 4 trees away at next Saturday’s lawn and garden
show in the city park. The 4 winners can select which type of tree they want. Assume
they select randomly.
What is the probability that all 4 winners will select the same type of tree?
A) 0.0058
B) 0.0218
C) 0.0355
D) 0.0709
There have been complaints recently from homeowners in the north end claiming that
their homes have been assessed at values that are too high compare with other parts of


town. They say that the mean increase from last year to this year has been higher in
their part of town than elsewhere. To test this, the assessor’s office staff plans to select a
random sample of north end properties (group 1) and a random sample of properties
from other areas within the city (group 2) and perform a hypothesis test. The following
sample information is available:
Assuming that the null hypothesis will be tested using an alpha level equal to 0.05, what
is the critical value?
A) z = 1.578
B) t = 1.7011
C) t = 0.2388
D) t = 2.0484
A population with a mean of 1,250 and a standard deviation of 400 is known to be
highly skewed to the right. If a random sample of 64 items is selected from the
population, what is the probability that the sample mean will be less than 1,325?
A) 0.8981
B) 0.8141
C) 0.7141
D) 0.9332


An analyst plans to test whether the standard deviation for the time it takes bank tellers
to provide service to customers exceeds the standard of 1.5 minutes. The correct null
and alternative hypotheses for this test are:
A) H0 : σ > 1.5
HA : σ ≥ 1.5
B) H0 : σ ≤ 1.5
HA : σ > 1.5
C) H0 : σ2 ≤ 2.25
HA : σ2 > 2.25
D) H0 : σ2 > 2.25
HA : σ2 ≤ 2.25
You are given the following null and alternative hypotheses:
If the true population mean is 4,345, calculate the power of the test. Assume the
population standard deviation is known to be 200 and the sample size is 100.
A) 0.1766
B) 0.3876
C) 0.0808
D) 0.9686
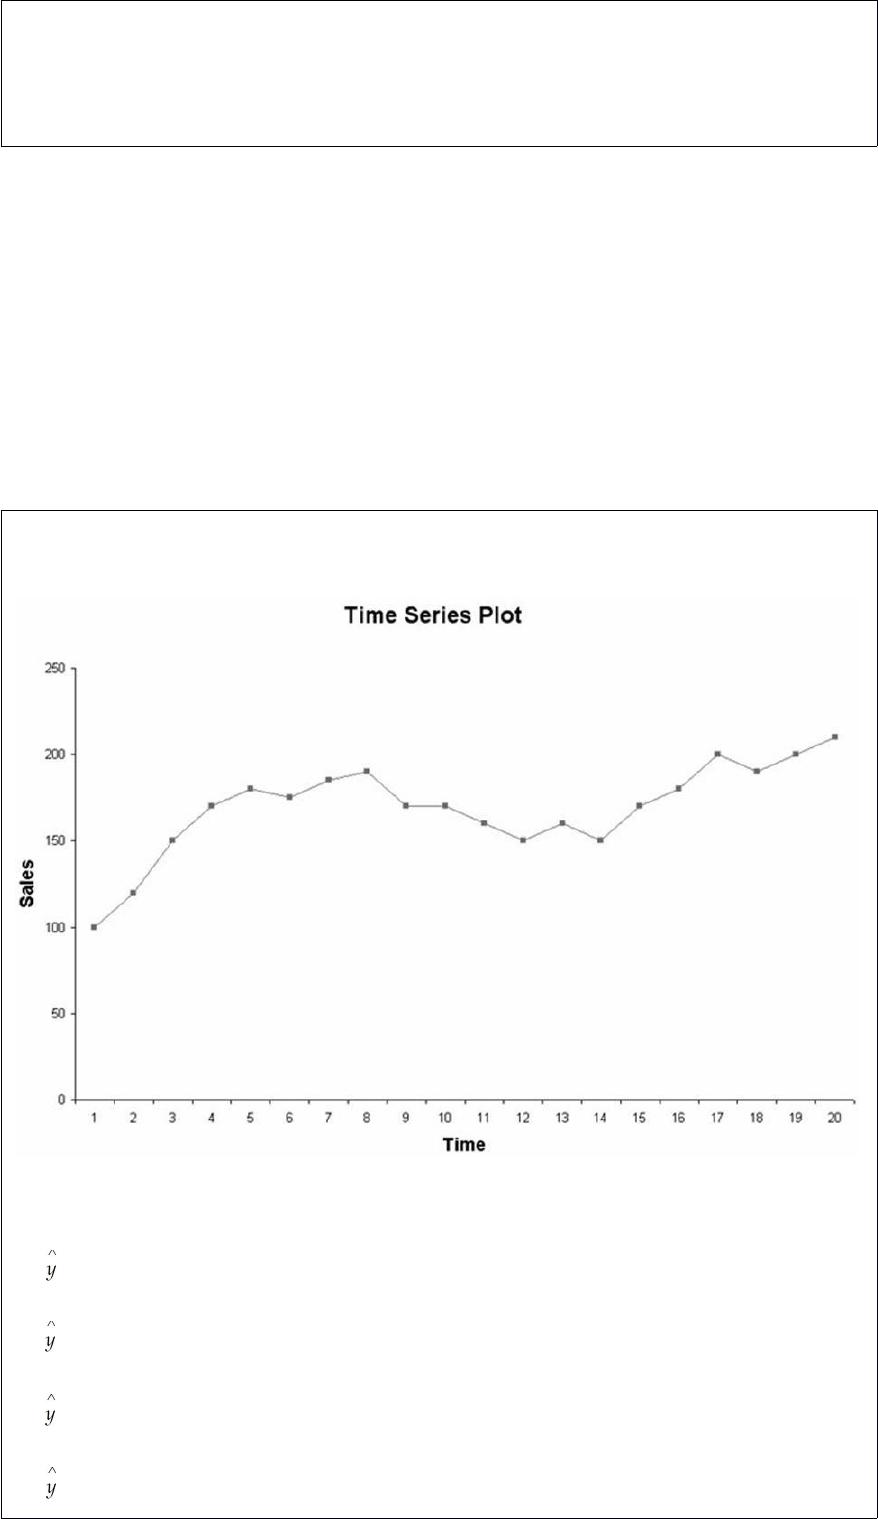
Assume that a time-series plot takes the form of that shown in the following graph:
Given this plot, which of the following models would likely give the best fit?
A) = b0b1 + b1t
B) = b0 + b1t + b1t2 + b1t3
C) = b0 + b1t + b1t2
D) = b0 + b1t + b1t2 + b3t3 + b4t4


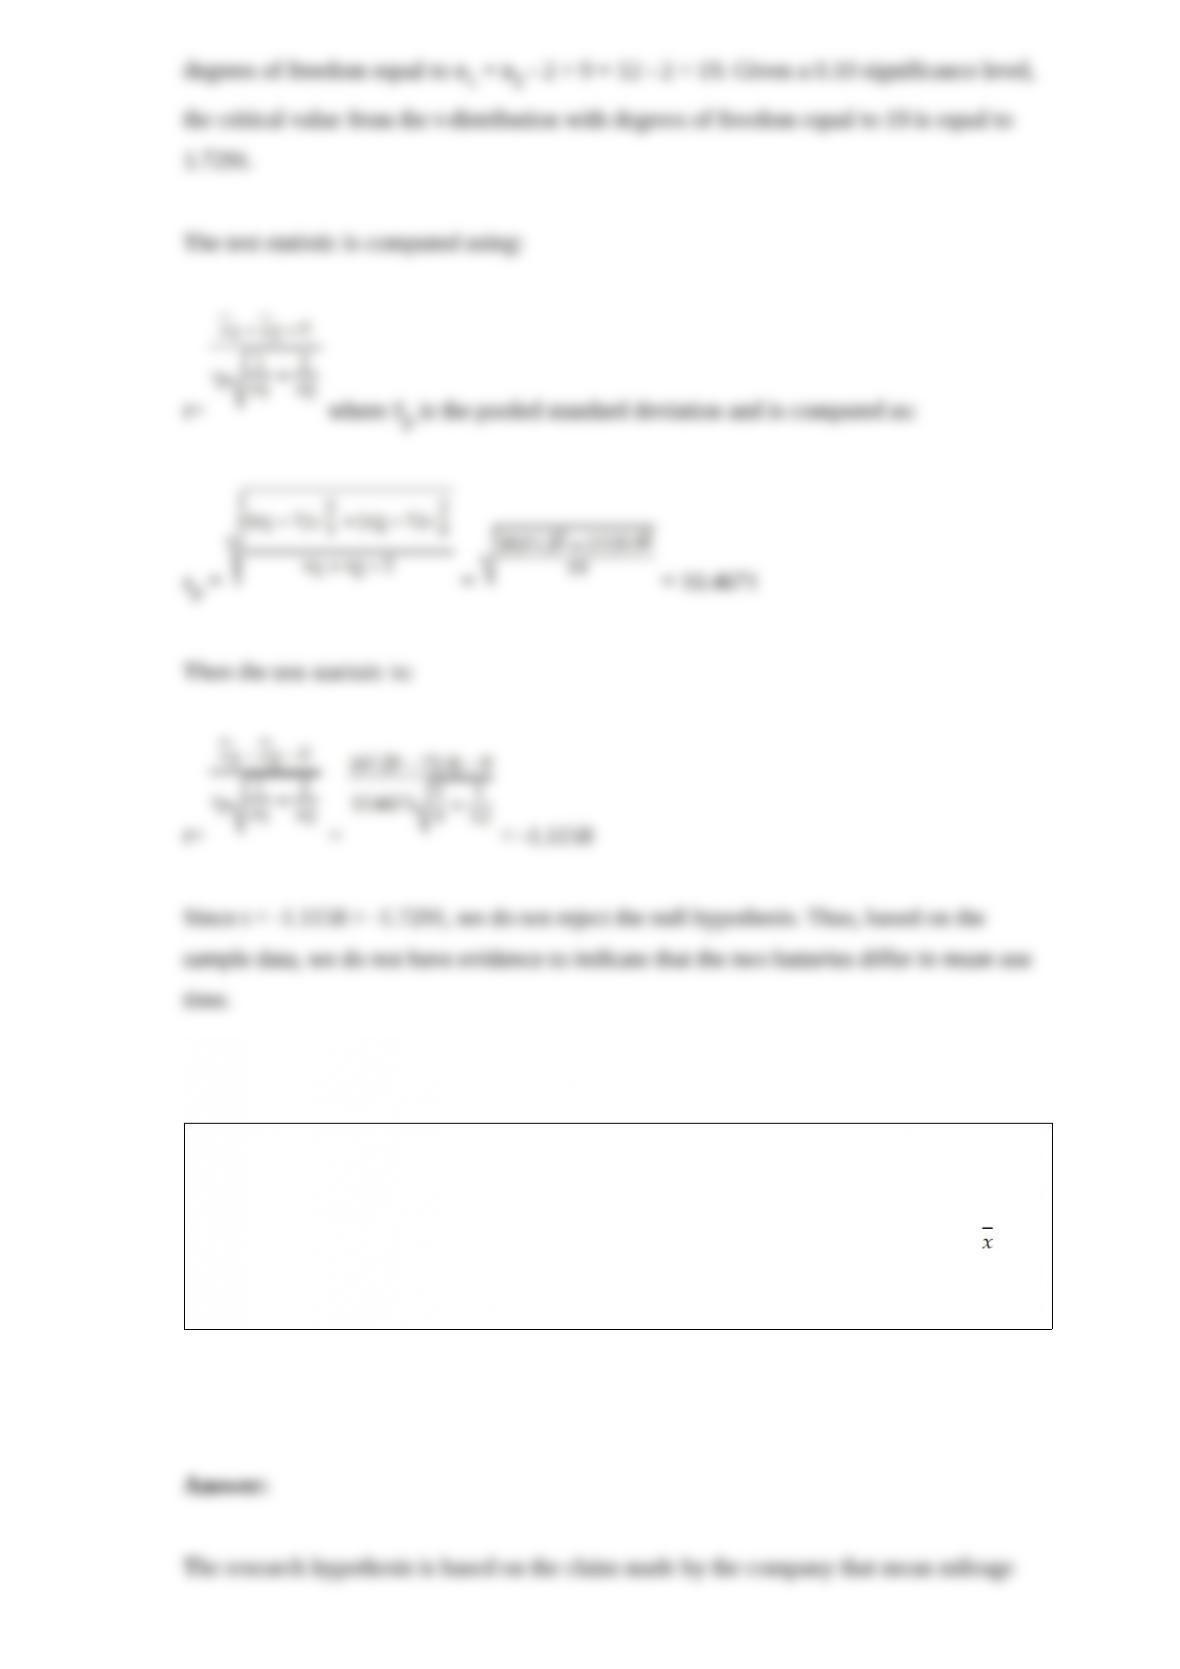
A PC company uses two suppliers for rechargeable batteries for its notebook computers.
Two factors are important quality features of the batteries: mean use time and variation.
It is desirable that the mean use time be high and the variability be low. Recently, the
PC maker conducted a test on batteries from the two suppliers. In the test, 9 randomly
selected batteries from Supplier 1 were tested and 12 randomly selected batteries from
Supplier 2 were tested. The following results were observed:
Supplier 1 Supplier 2
n1 = 9 n2 = 12
1 = 67.25 min. 2 = 72.4 min.
S1= 11.2 min S2 = 9.9 min
Based on these sample results, can the PC maker conclude that a difference exists
between the two batteries with respect to the population mean use time? Test using a
0.10 level of significance.
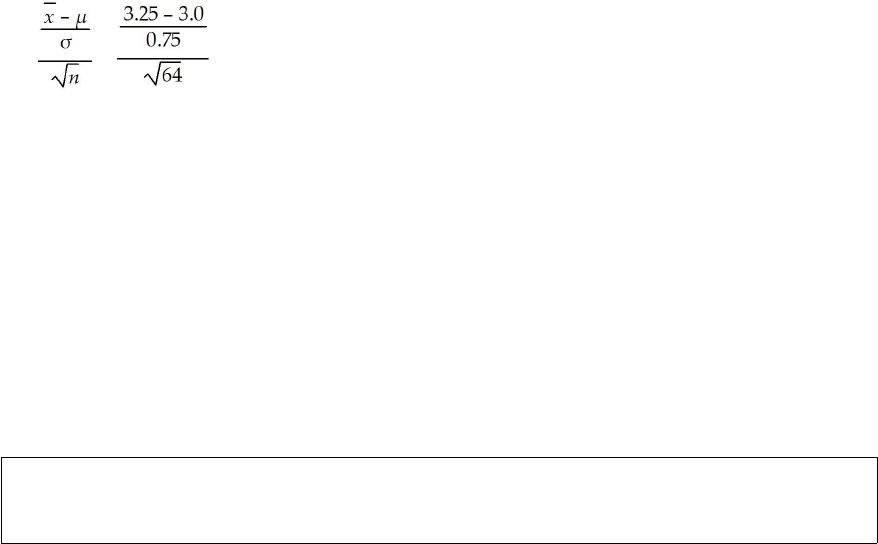
A company makes a device that can be fitted to automobile engines to improve the
mileage. The company claims that if the device is installed, owners will observe a mean
increase of more than 3.0 mpg. Assuming that the population standard deviation of
increase is known to be 0.75 mpg, and a sample of size 64 cars is selected with an =
3.25 mpg, use the p-value approach to test the null hypothesis using a significance level
of 0.05.
Explain why it is important to construct scatter plots prior to conducting regression
analysis.


Explain why a relative frequency histogram is sometimes preferable to a regular
frequency histogram.
In a survey, what is meant by demographic questions and why might we want to include
demographic questions in survey?
Assume that a standard deck of 52 playing cards is randomly shuffled and the first 2


cards are dealt to you. What is the probability that you have a blackjack? A blackjack is
where one card is an ace and the other card is worth 10 points. The 10-point cards are
kings, queens, jacks and 10’s.
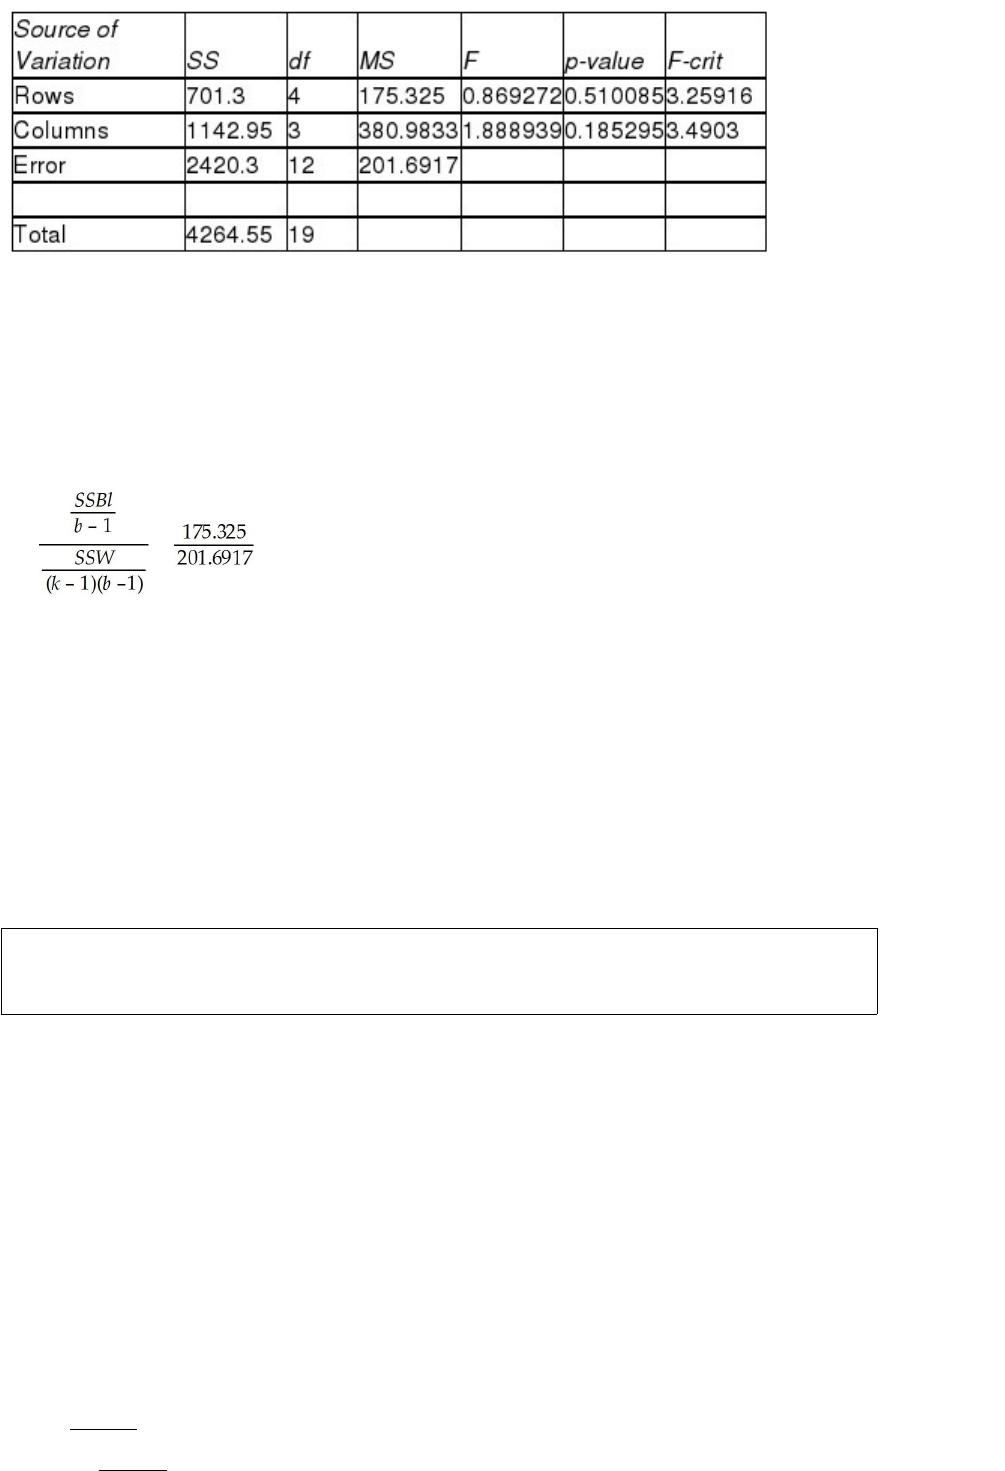
Under what circumstances would you use a randomized complete block analysis of
variance design instead of a one-way analysis of variance?


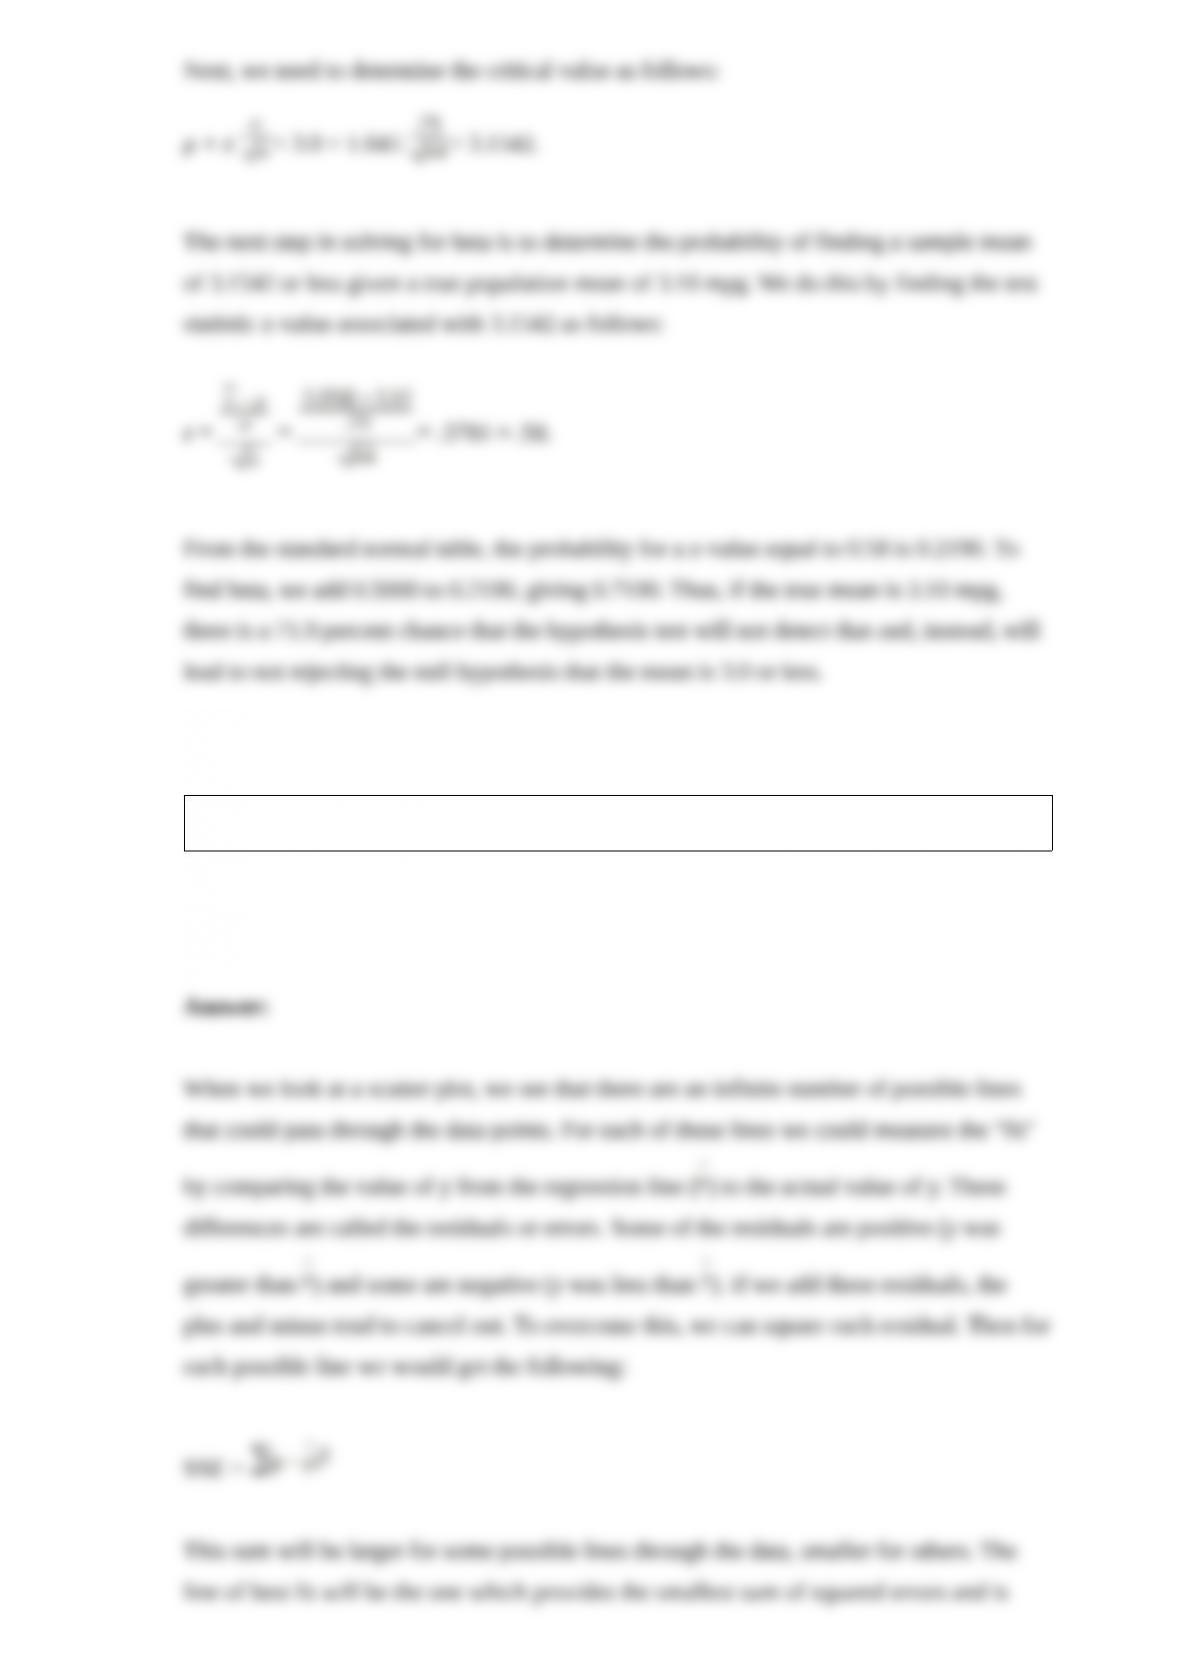
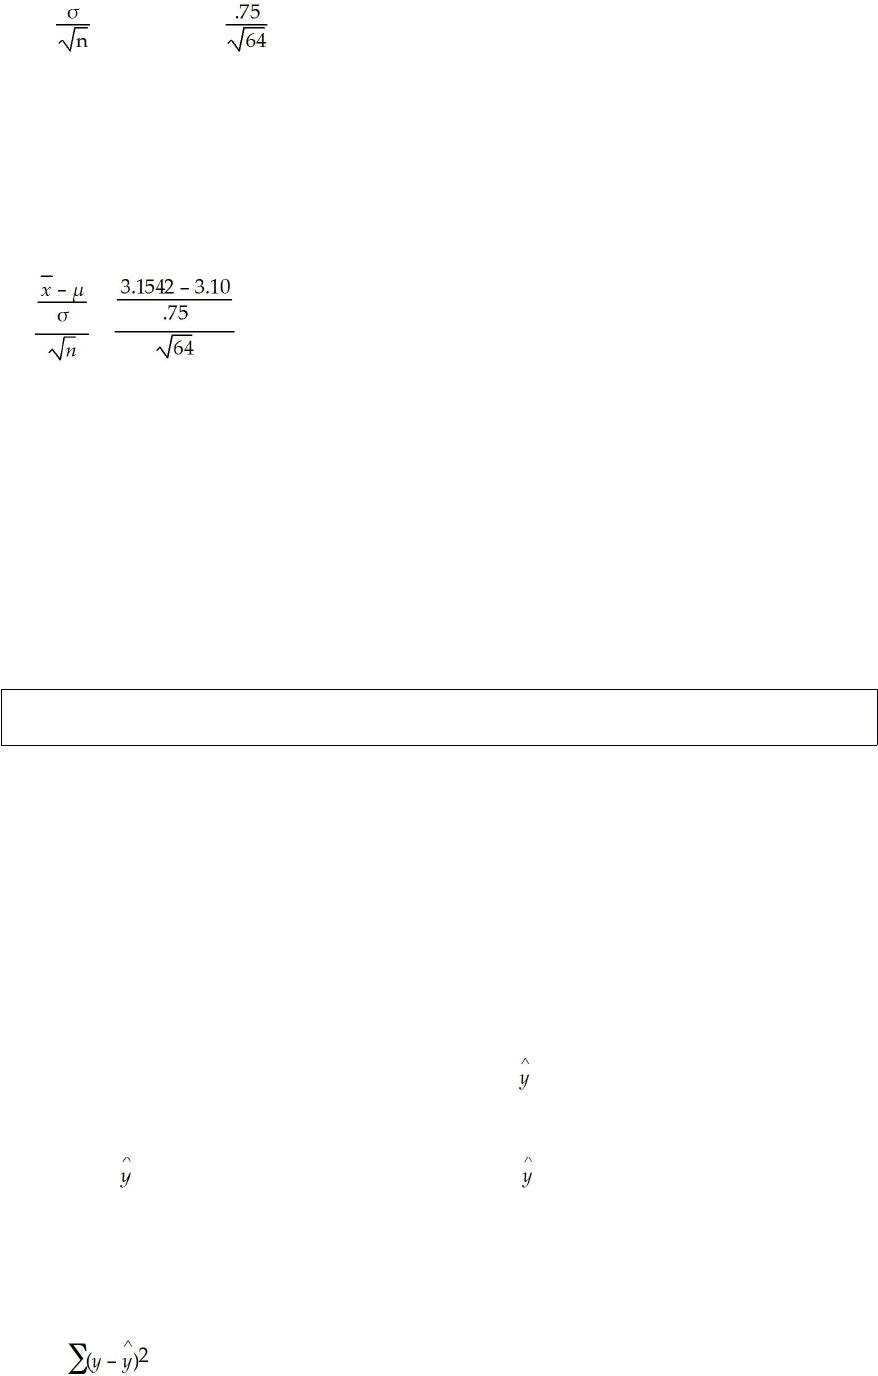
A company makes a device that can be fitted to automobile engines to improve the
mileage. The company claims that if the device is installed, owners will observe a mean
increase of more than 3.0 mpg. Assuming that the population standard deviation of
increase is known to be 0.75 mpg, and a sample of size 64 cars is selected, what is the
probability of “accepting” the null hypothesis if the true population mean is 3.10 mpg
increase? Assume that the test will be performed using a 0.05 level of significance.
Explain what is meant by the term least squares regression model.
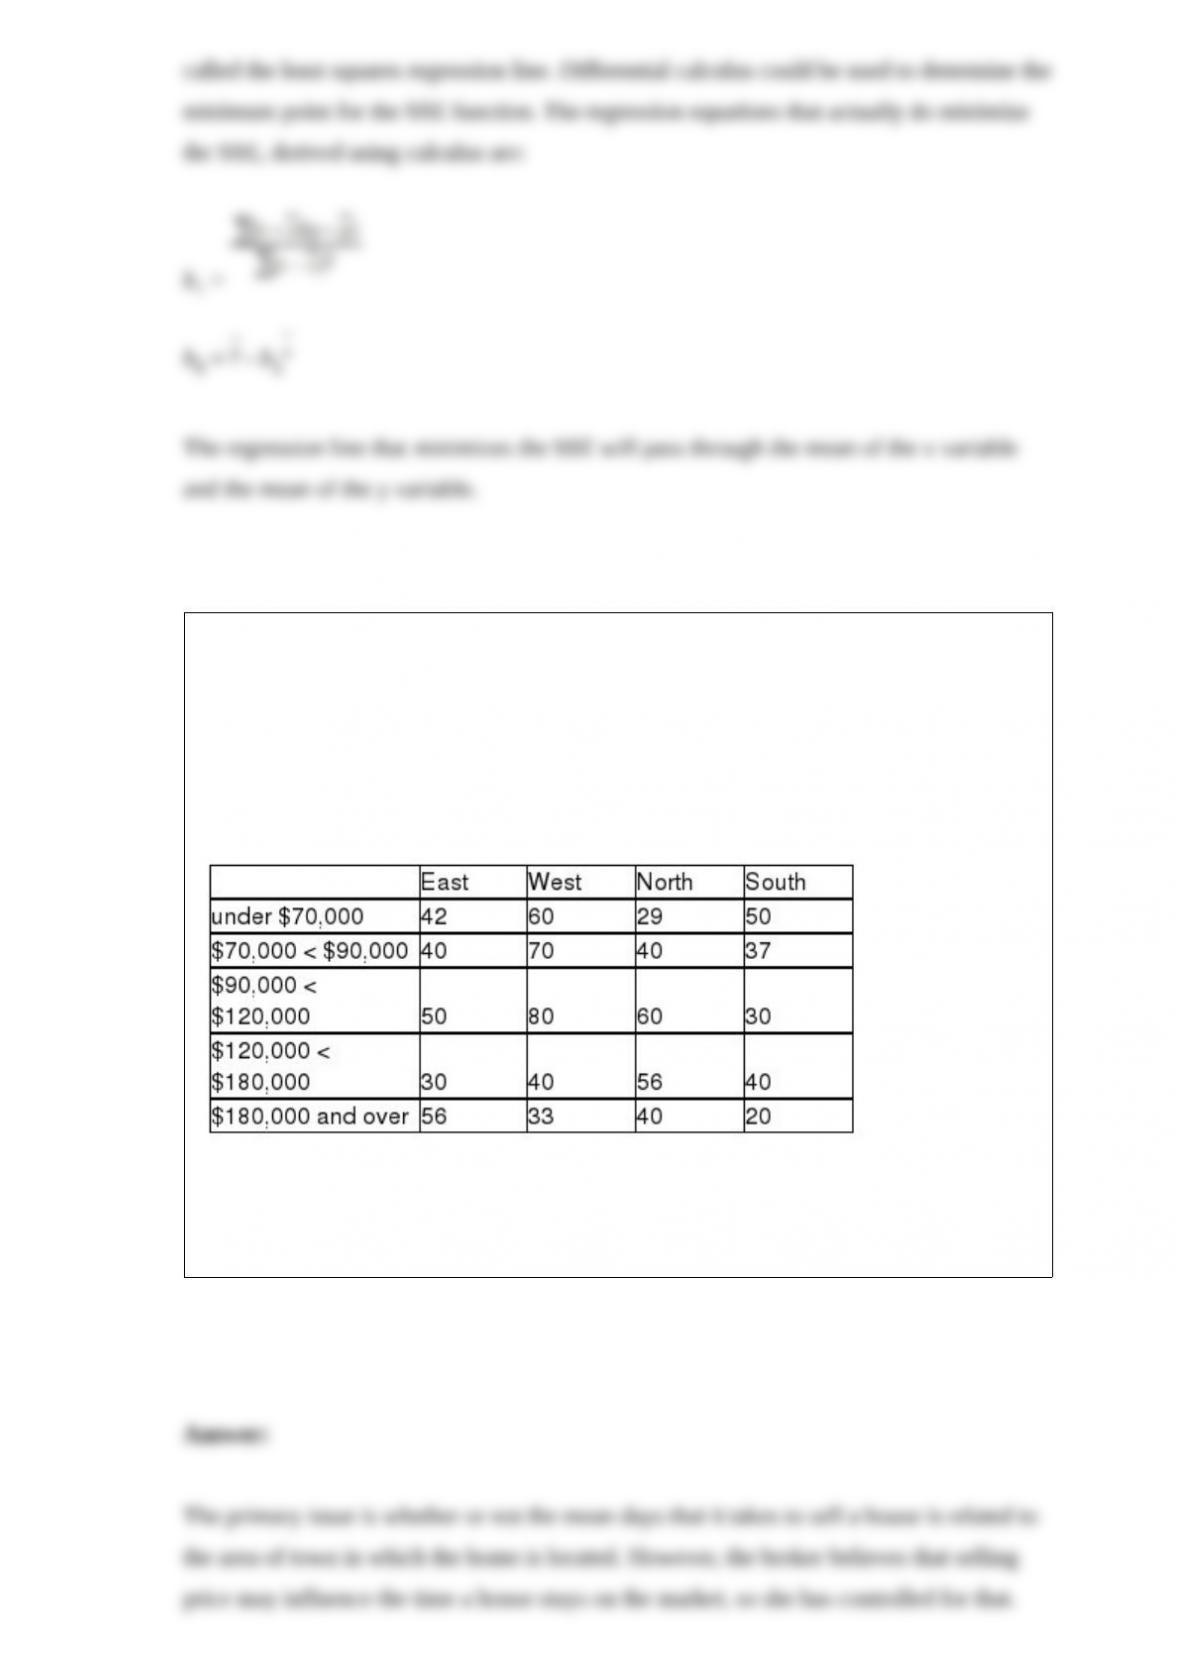
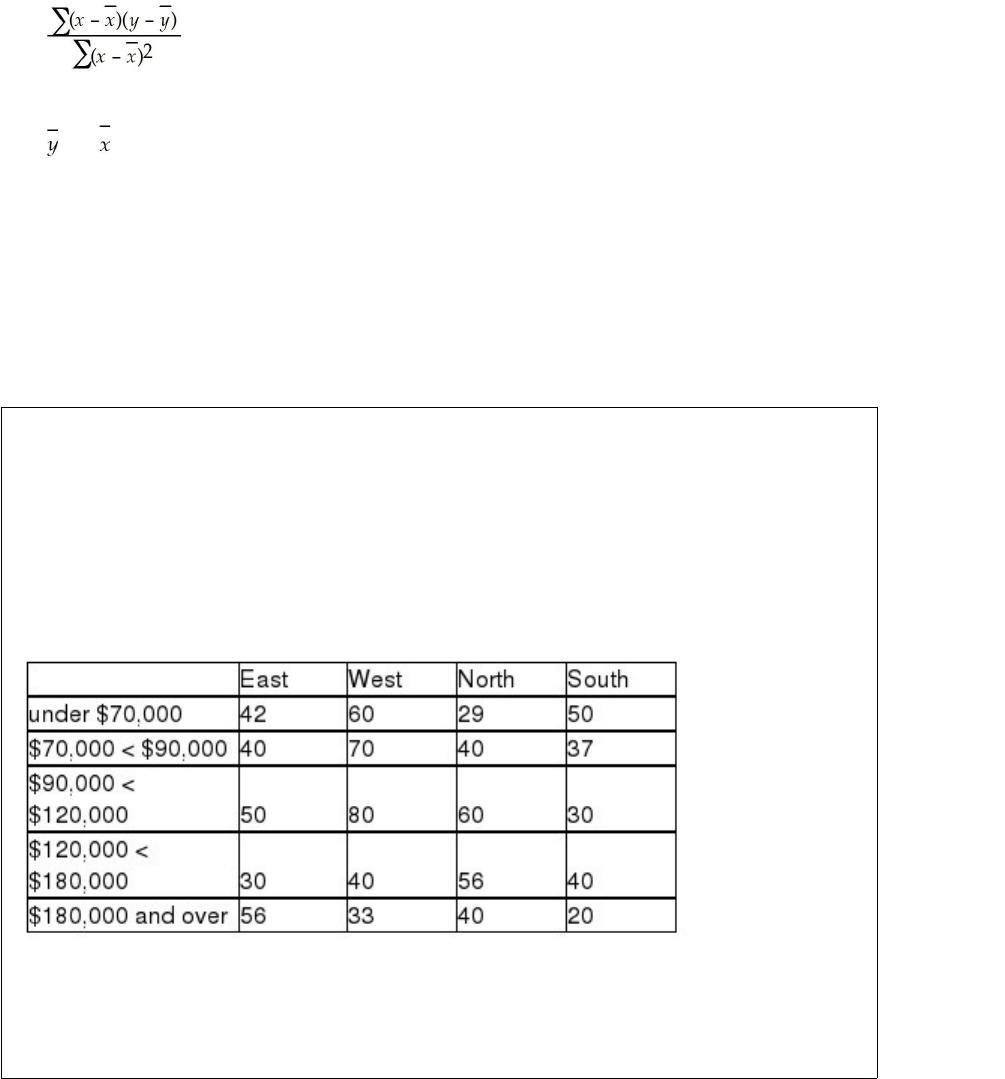
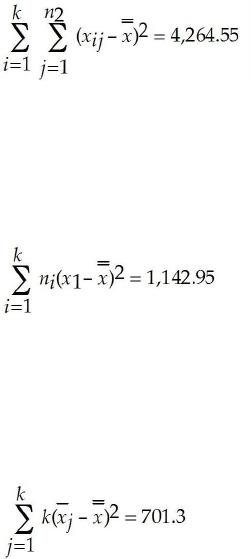
A real estate broker is interested in determining whether there is a difference in the
mean number of days a home stays on the market before selling based on which area of
the city it is located in. However, she is also concerned that the price of the house may
be an issue in determining how long it takes to sell a house, so she wants to control for
this. To carry out the test, she plans to randomly select one house from each part of the
city in each price range. The following data show the number of days for the sample of
houses selected.
Using a significance level equal to 0.05, determine whether the broker was justified in
controlling for house prices. Be sure to indicate what type of statistical test should be
used and why.

Explain how Tchebysheff’s theorem can be used to help describe data in a population or
a sample.


The Gordon Beverage Company bottles soft drinks using an automatic filling machine.
When the process is running properly, the mean fill is 12 ounces per can. The machine
has a known standard deviation of 0.20 ounces. Each day, the company selects a
random sample of 36 cans and measures the volume in each can. They then test to
determine whether the filling process is working properly. The test is conducted using a
0.05 significance level. What is the critical value in ounces?


Explain what is meant by the term mutually exclusive events. Cite an example.
Discuss the steps that you would use to manually construct a histogram for the salaries
of the 1,124 employees in the Ferris Steel Company.
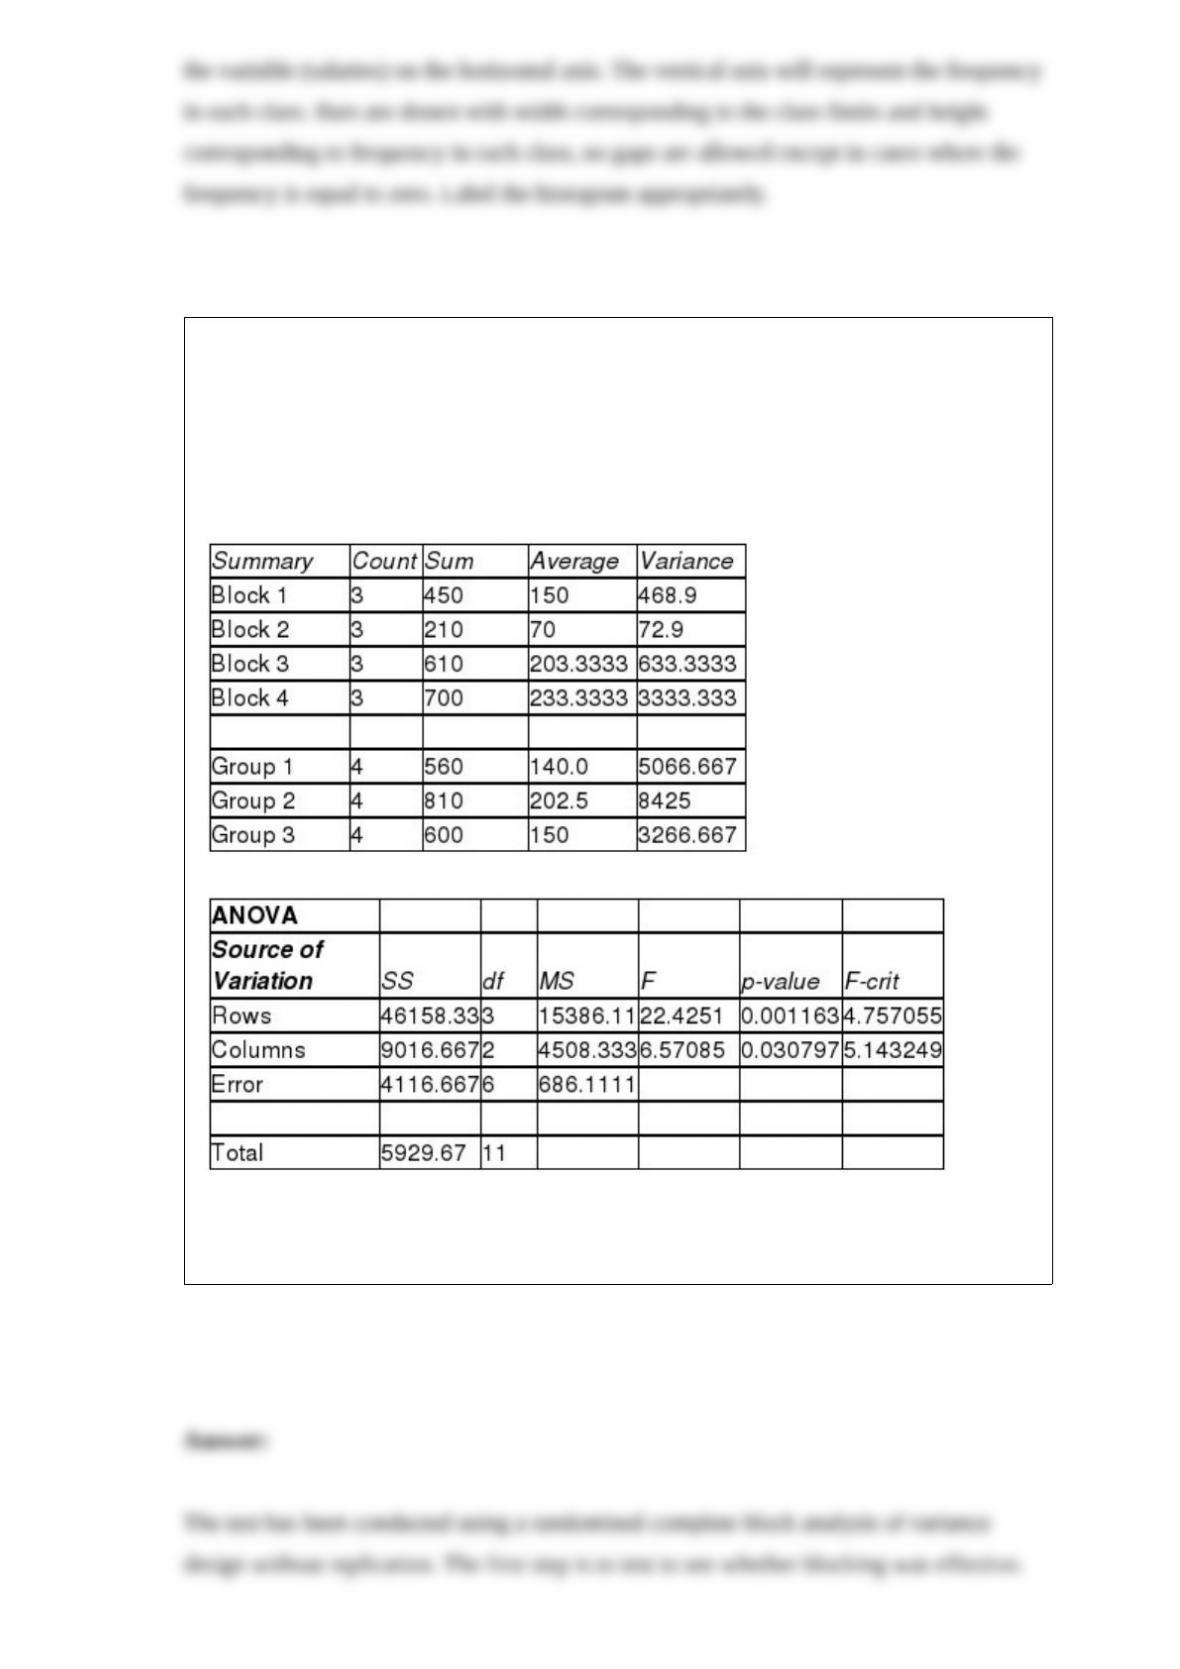
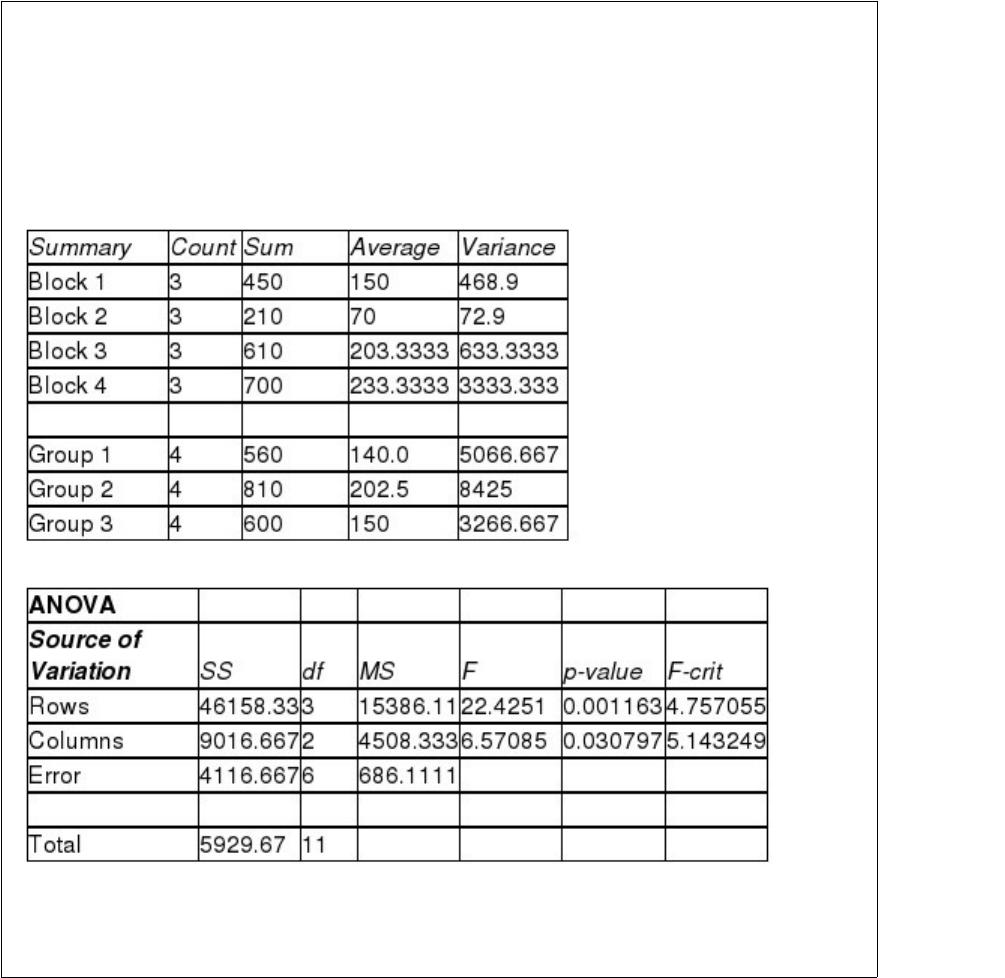
Suppose that you have just performed an experiment using the randomized complete
block analysis of variance design and the output from Excel is shown as follows. The
primary null hypothesis to be tested involves whether the means of the three groups are
equal.
ANOVA: Two-Factor Without Replication
Using a significance level of 0.05, what conclusions should be made about the three
groups? Which groups have different means? Discuss.


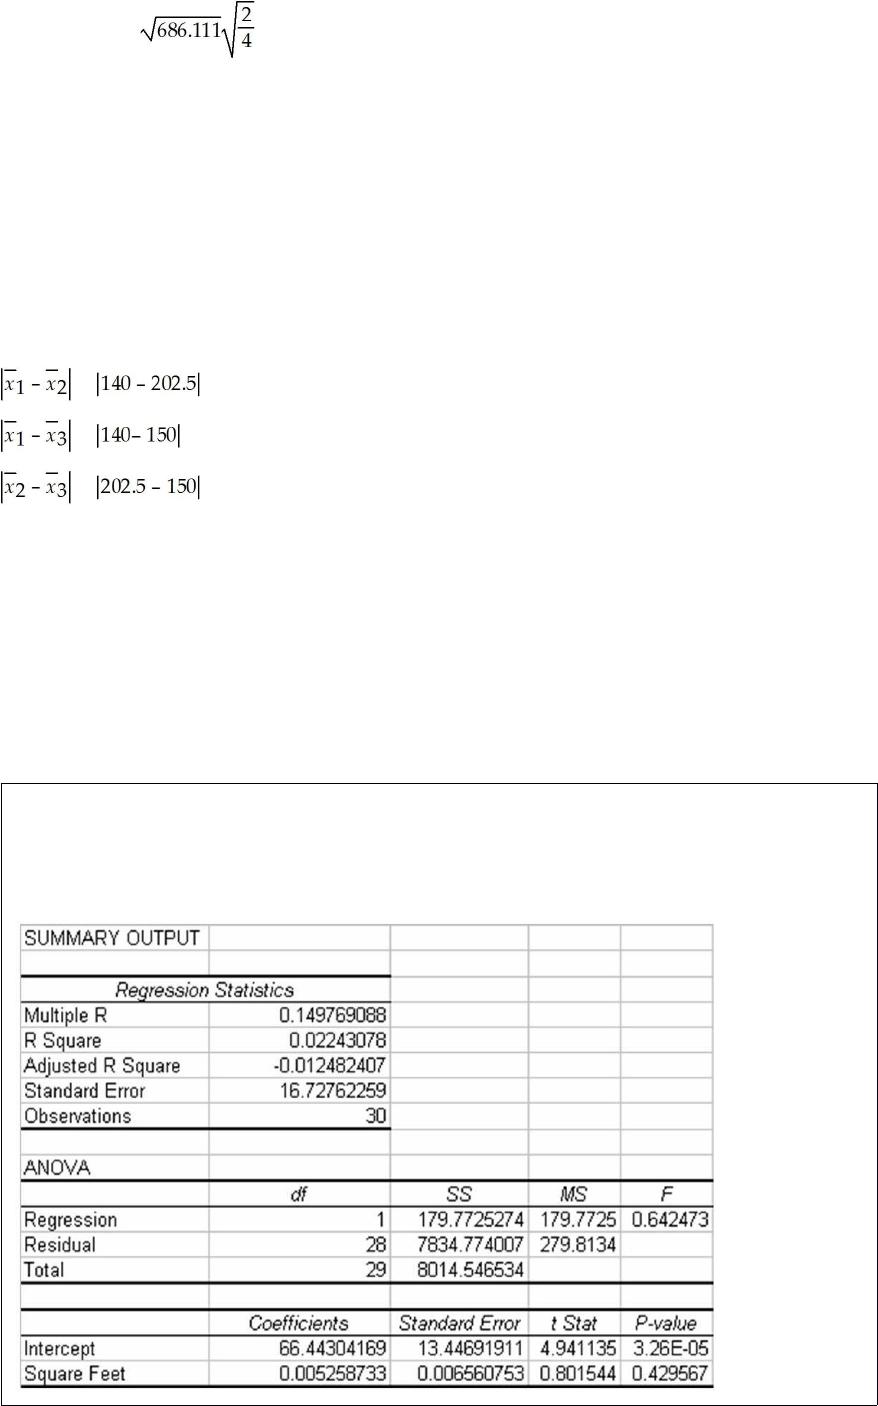
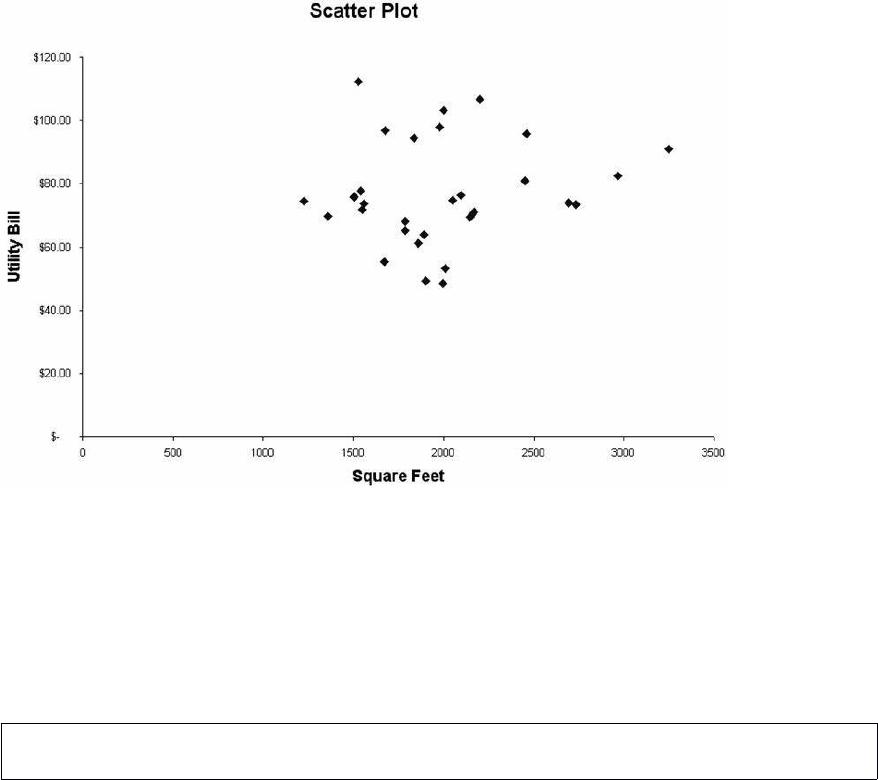
The Public Utility Commission in a southern state is interested in describing the
relationship between household monthly utility bills and the size of the house. A recent
study of 30 randomly selected household resulted in the following regression results:


Based on the information provided, indicate what, if any, conclusions can be reached
about the relationship between utility bill and the size of the house in square feet.

Explain what the expected value of a discrete random variable measures.