The expected value of sample information is the mean of a discrete probability
distribution when the discrete random variable is expressed in terms of dollars.
Positive autocorrelation is present in a time series when we observe a pattern of positive
or negative residuals in succession.
Two samples are independent of one another when the results you observe when
sampling from one population have no impact on the results you observe when
sampling from the second population.
If the slope of the simple regression equation is equal to zero, the scatter plot for the
ordered pairs will be a vertical straight line indicating that there is no relationship
between the independent and dependent variables.

Testing whether a part is defective or not defective after it has been manufactured
would be best described using a binomial probability distribution.
The total sum of squares (SST) measures the amount of variation between each data
value and the grand mean.
The sign test can be used to perform a hypothesis test for a population mean.
Randomized block ANOVA should not be used to test the significance of the blocking
factor. Under these circumstances, a two-way ANOVA procedure is more appropriate.
When comparing two samples, the smaller coefficient of variation indicates more
consistency (or less variability) within the sample or population.
The Spearman rank-order correlation coefficient is a nonparametric procedure measures
the strength and direction of the relationship between two variables.
The continuity correction factor allows us to approximate the binomial distribution with
the exponential distribution by adding and subtracting the value 0.5 to create the
interval of interest.

Analysis of variance only tests to see if any pair of population means are different. To
find out which population mean pairs are different, we need to perform a multiple
comparisons test.
A frequency distribution is a table that shows the number of data observations that fall
into specific intervals.
An event represents all of the possible outcomes of an experiment.

Continuous random variables are outcomes that take on any numerical value in an
interval as a result of conducting an experiment.
In a quality control setting, the sample mean provides enough evidence to determine if a
process is working properly.
In a multiple regression model, a dependent variable explains the variation in the
independent variables.
According to the empirical rule, we would expect approximately 68, 95, and 99.7
percent of the values to fall within one, two, and three standard deviations above and
below the mean respectively for all distributions.

If the size for each sample is the same for the one-way ANOVA, the Tukey-Kramer
critical range for all pairs would be the same.
A Type II error is known as the consumer’s risk because, when it occurs in quality
control settings, the customer is getting a product from a process that is not performing
properly.
All analysis of variance procedures require that the observations are either ordinal or
interval data.
Negative autocorrelation is rarely observed in a time series.
If the data set does not have a mode, Data Analysis ToolPak in Excel displays “#N/A”
in the spreadsheet cell.
The standard error of the regression coefficient measures the variation in the regression
coefficient among several samples.
The random component is not part of the forecasting equation for multiplicative
decomposition because randomness, by definition, cannot be predicted.

The Spearman rank-order correlation coefficient requires the data be at the nominal
level of measurement.
All else being equal (the same sample size, same level of significance, and so on), the
parametric procedure will result in a higher probability of your correctly rejecting the
null hypothesis.
Adding additional independent variables to the regression equation will always
decrease the coefficient of determination.

The sampling distribution for the difference in proportions is the result of subtracting
one sampling distribution for the proportion from a second sampling distribution for the
proportion.
When the order of objects is important, use permutations.
A decision tree is a tree-shaped diagram that shows the alternatives, states of nature,
probabilities, and payoffs for making decisions under uncertainty.
The following graph shows the square footage of 10 homes along with their
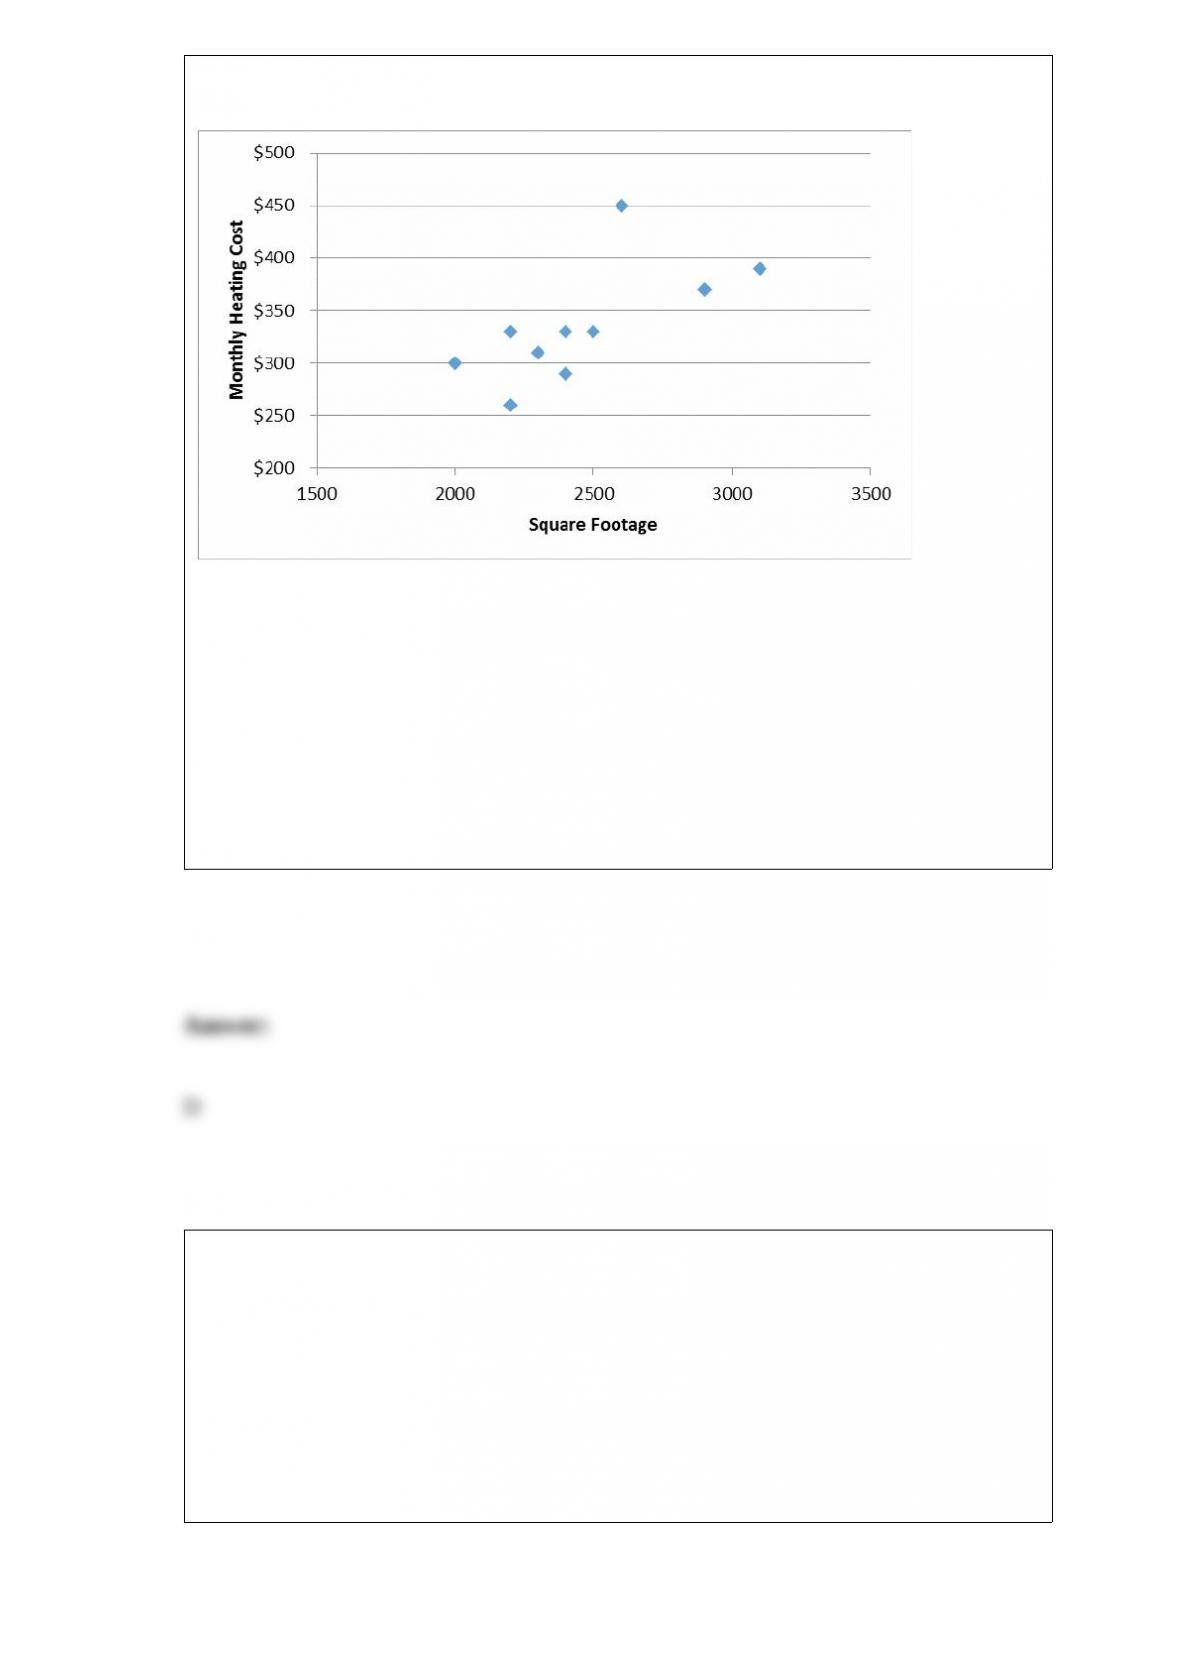
corresponding heating cost for the most recent month.
This graph is an example of a _____________.
A) line chart
B) horizontal bar chart
C) Pareto chart
D) scatter plot
Data that describe a characteristic about a sample is known as a ________.
A) population
B) survey
C) statistic
D) parameter

Because each observation from a sample for the sign test must be assigned a plus or
minus sign, this sampling distribution can be said to follow the _____________
probability distribution.
A) Student’s t
B) exponential
C) Poisson
D) binomial
Use the following information to answer the question(s) below.
The National Football League has developed a regression model to predict the number
of wins during a season for a team using the following independent variables:
•Average points per game during the season (PPG)
•Average number of penalties committed per game during the season (PEN)
•Turnover differential during the season (TO)
Turnover differential is defined as the number of times the team took the ball away from
their opponent with a turnover minus the number of times the team gave the ball away to
their opponent with a turnover. For example, if TO = +5, the team had five more
takeaways than giveaways. If TO = “7, the team had seven more giveaways than
takeaways during the season.
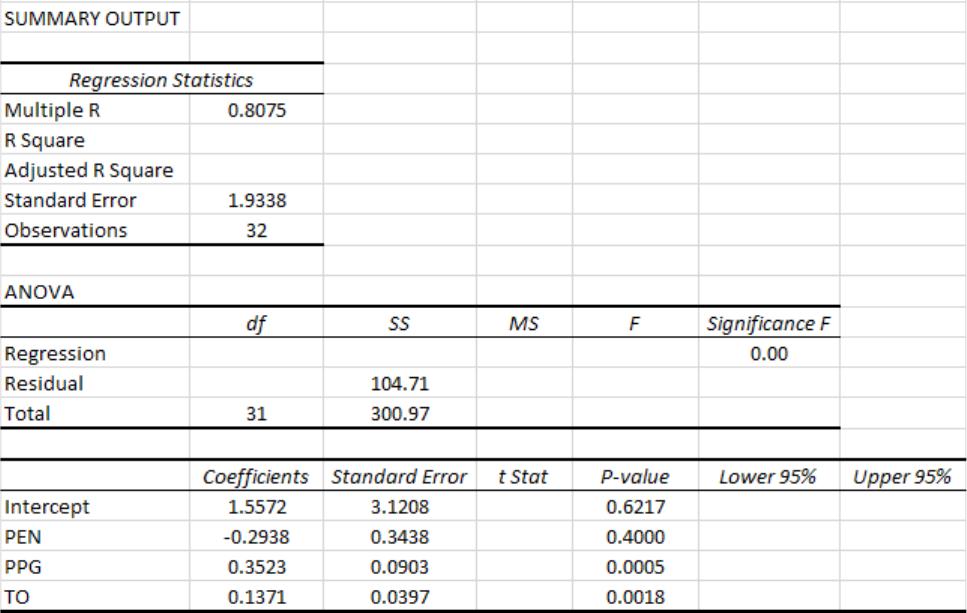
The following Excel output shows the partially completed regression output from a
random season.
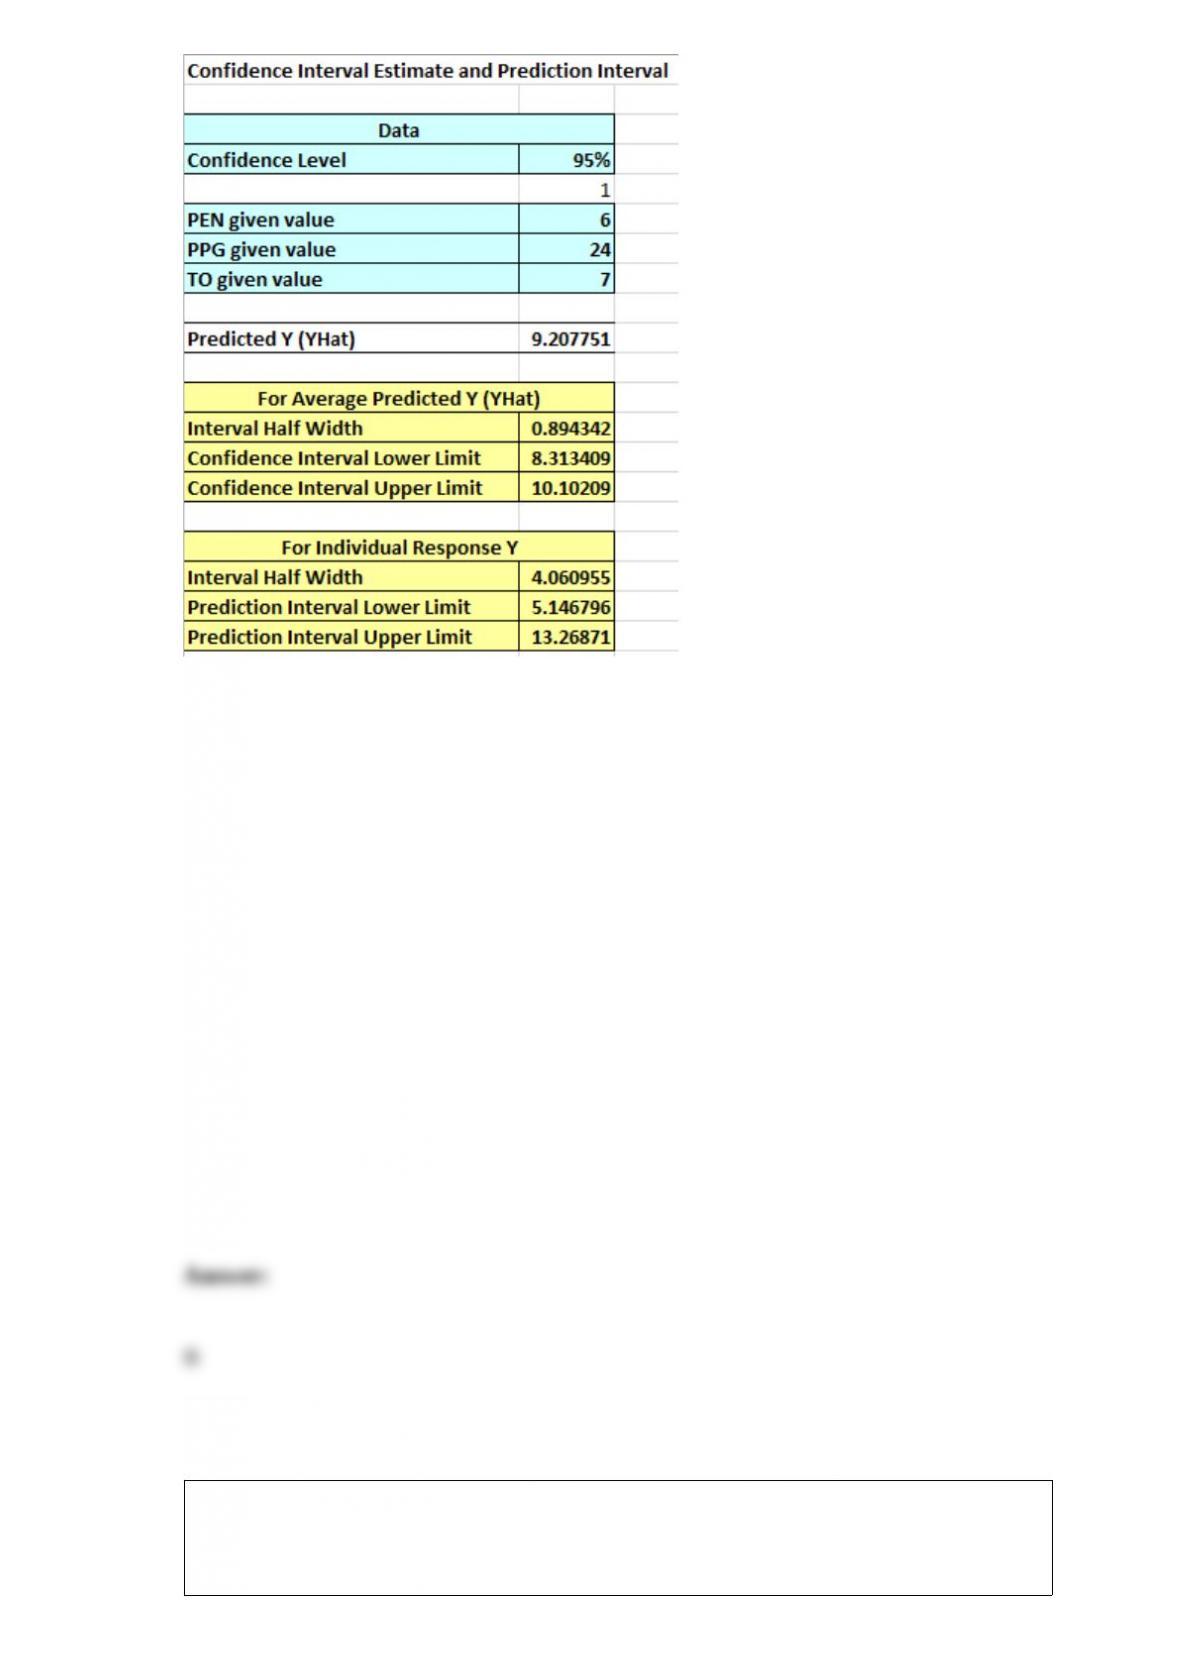
The 95% confidence interval for the regression coefficient for the TO variable is
________.
A) (0.062, 0.212)
B) (0.056, 0.218)
C) (“0.108 0.382)
D) (“0.340,0.614)
State University offers several sections of a Business Statistics course in an in-class and
online format. Both formats are administered the same final exam each year. You have
been assigned to test the hypothesis that the median final exam score of in-class
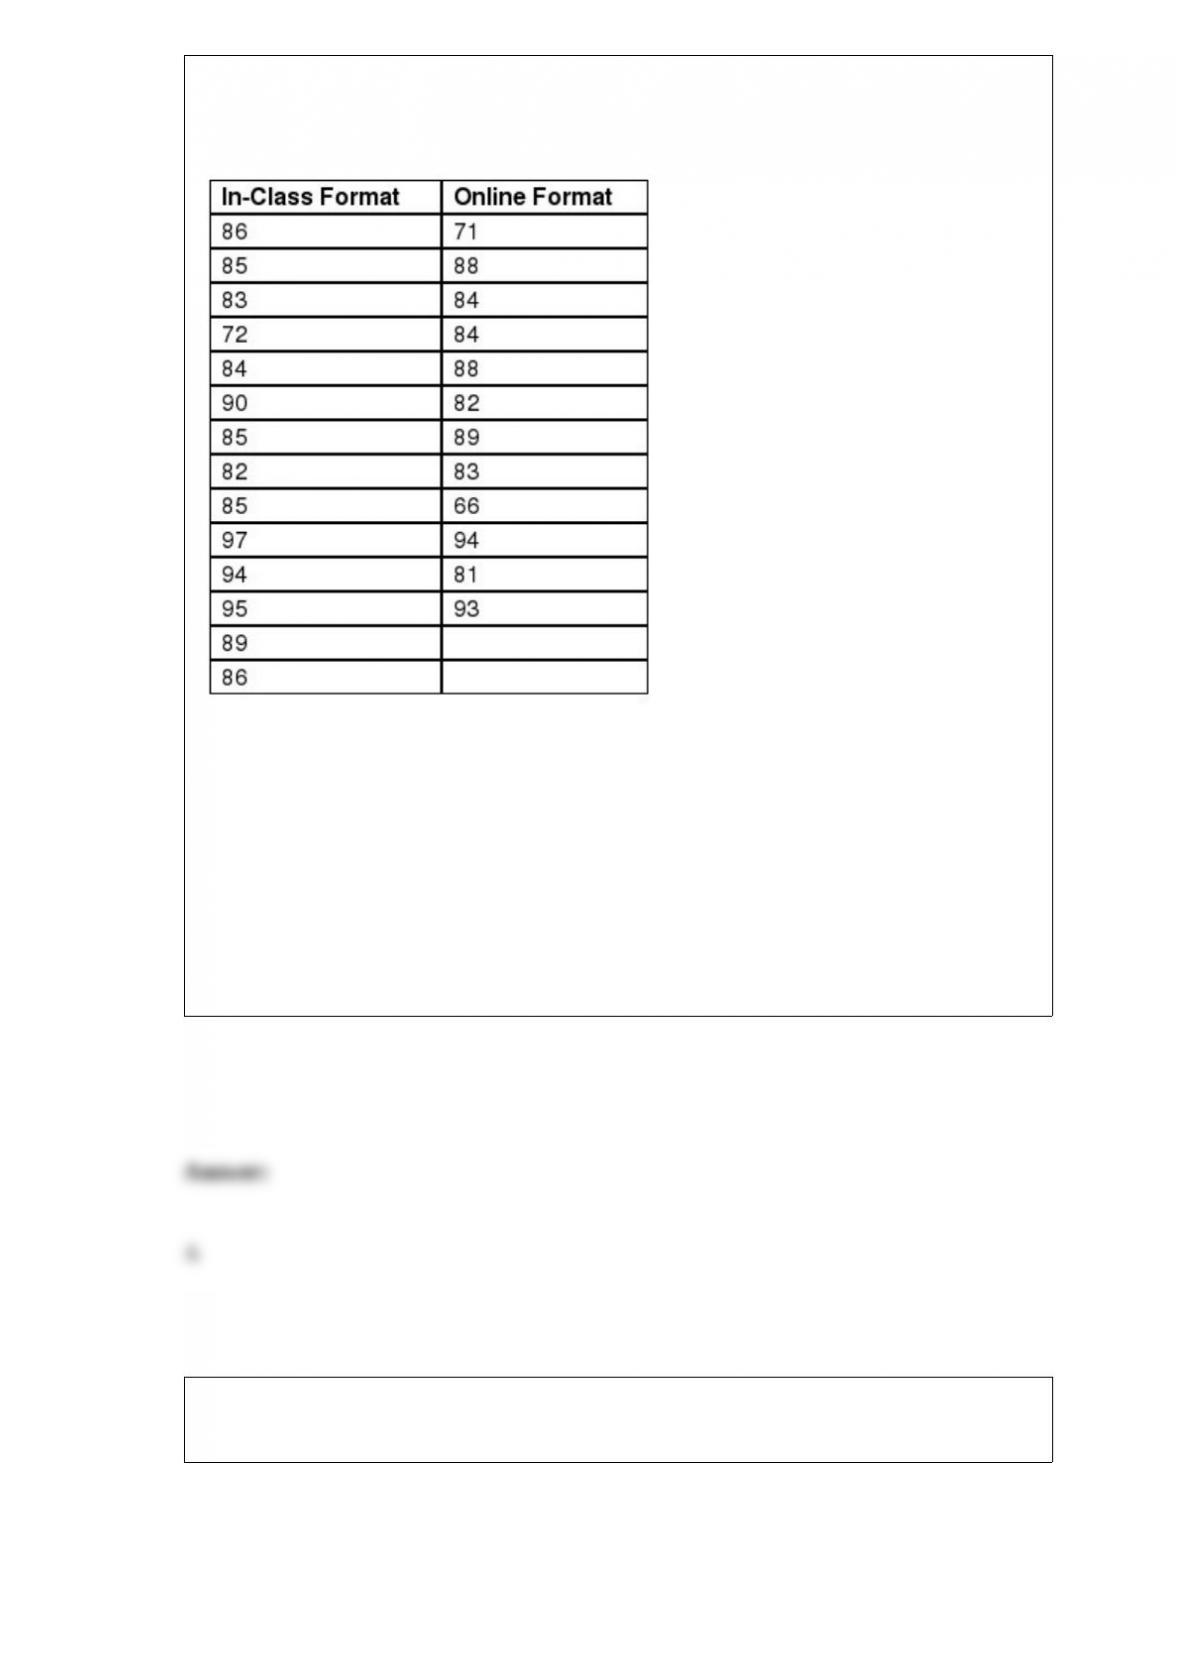
students is higher than the median final exam score of online students. The following
table shows the exam scores for a random sample of students from both classes.
The test statistic for this hypothesis test is ________.
A) “1.13
B) 1.54
C) “2.07
D) 2.20
The following table shows the number of pieces of junk mail that arrives in my mailbox
each day.
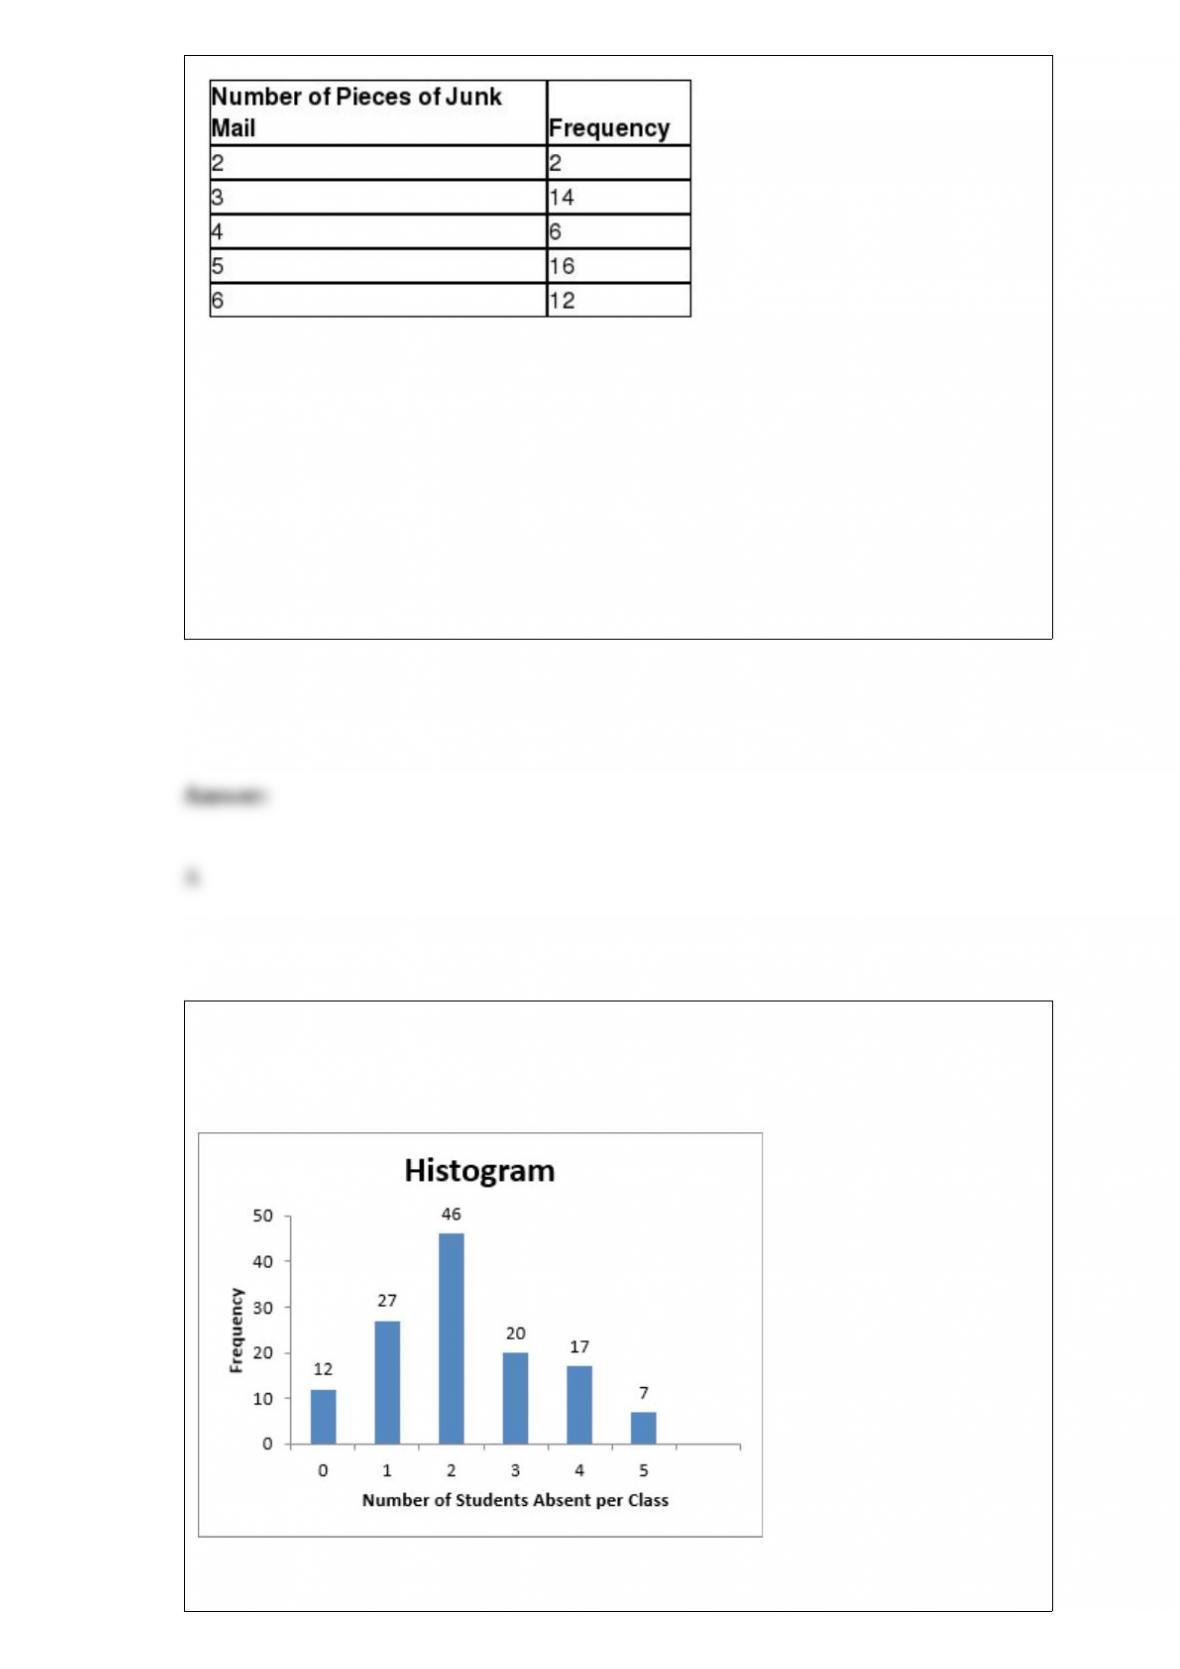
What is the probability that 3 or fewer pieces of junk mail will be received today?
A) 0.32
B) 0.45
C) 0.56
D) 0.62
A statistics professor kept attendance records and recorded the number of absent
students per class. This data is displayed in the following histogram with the frequency
of each number of absent students shown above the bars.
How many total classes do these data represent?
A) 46
B) 100
C) 129
D) 150
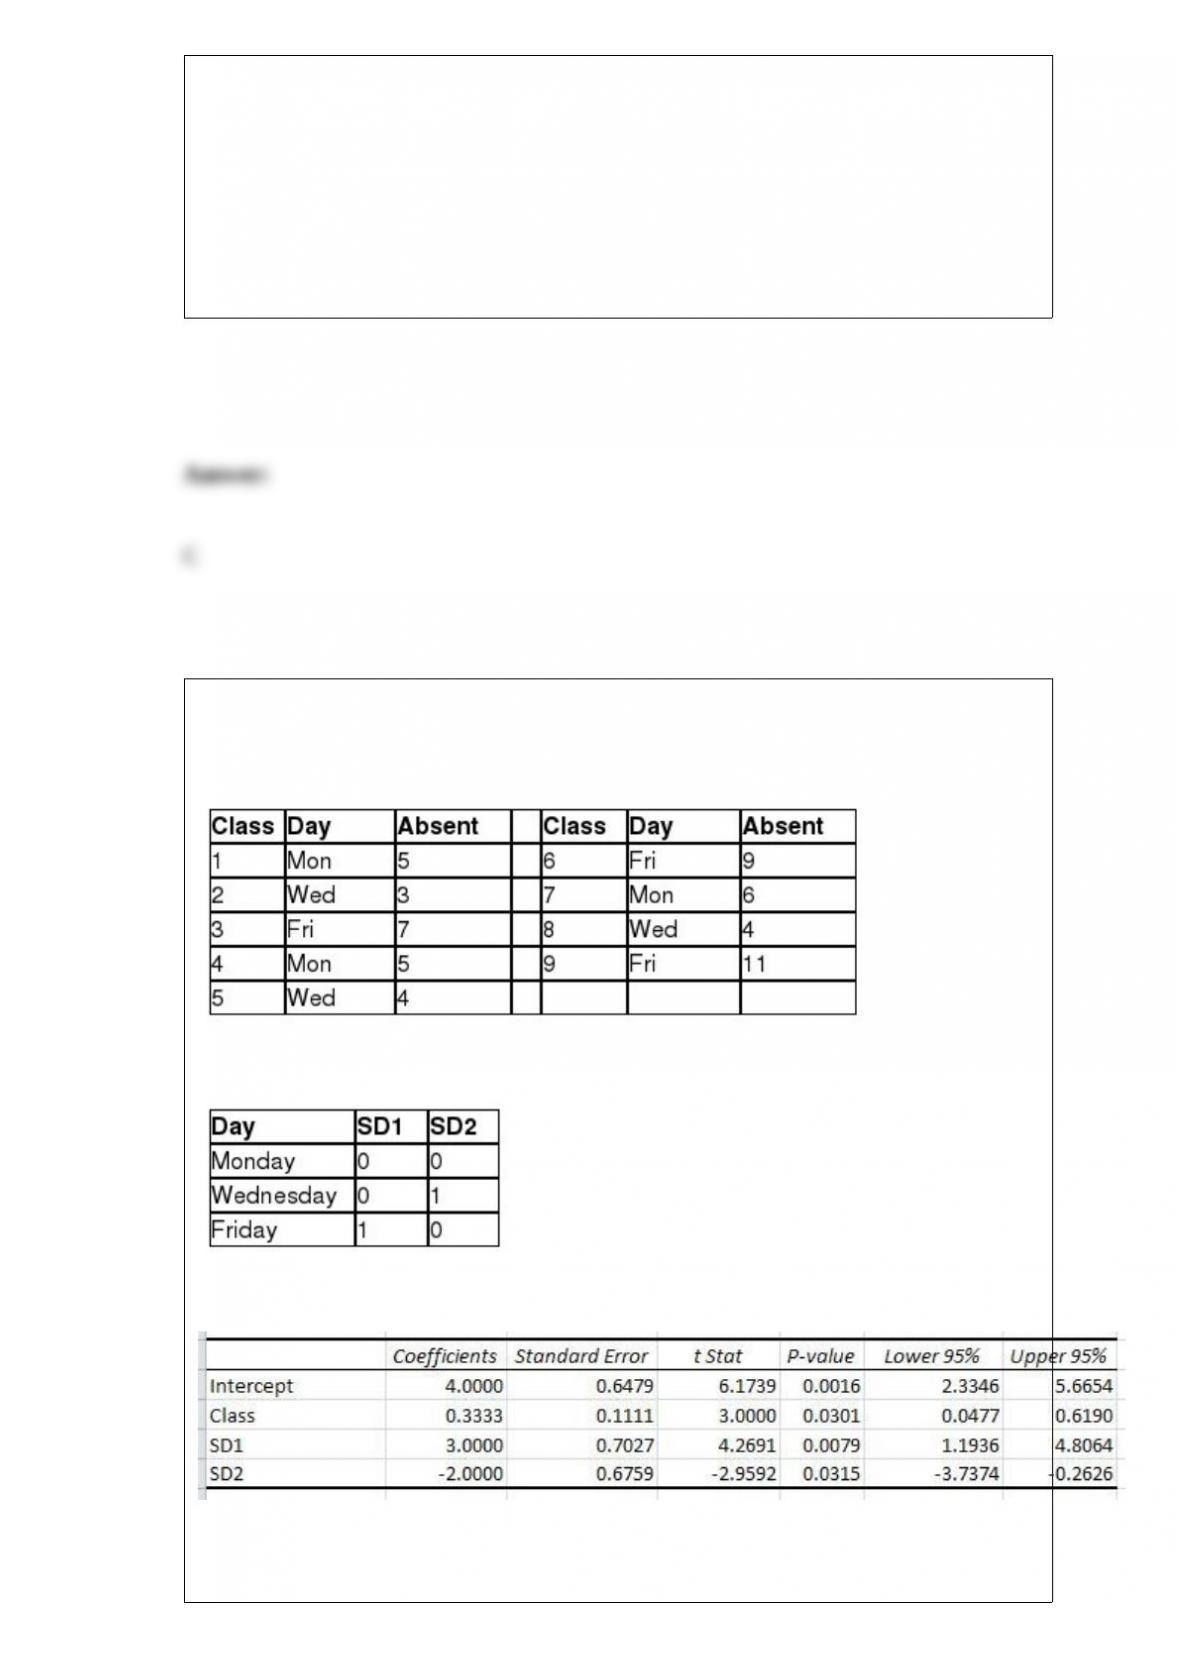
A large statistics class meets on Monday, Wednesday and Friday each week during the
semester. The following data shows the number of absent students for the last nine
classes.
The following dummy variables were created:
The regression results are shown in the table below.
The mean absolute deviation for forecasting for the number of absent students using
this model is ________.

A) 0.27
B) 0.51
C) 1.09
D) 1.56
________ totalsthe proportion of observations that are less than or equal to the class at
which you are looking.
A) Frequency distributions
B) Cumulative relative frequency distributions
C) Relative frequency distributions
D) Histograms
A camera manufacturer just shipped a batch of 36 digital cameras to local retailers and
seven of the cameras have a defective sensor. Cutler Electronics received eight of these
digital cameras. What is the probability that three or four of the cameras shipped to
Cutler are defective?
A) 0.1649

B) 0.2366
C) 0.3417
D) 0.4782
A survey conducted last year asked employed adults from age 25 to 70 if they plan to
keep a foot in the working world after retirement. Thirty-three percent of the
respondents answered “very likely”. A random sample of 75 adults from this age group
was asked the same question. Using the normal approximation to the binomial
distribution, what is the probability that 20, 21, 22, or 23 adults from this sample would
very likely plan to keep a foot in the working world after retirement?
A) 0.1510
B) 0.3821
C) 0.4560
D) 0.6539
Rejecting the null hypothesis for interaction in a two-way ANOVA procedure
_______________________.
A) indicates the presence of interaction between Factors A and B which interferes with
the interpretation of the impact of Factors A and B on the population mean
B) indicates the presence of interaction between Factors A and B which does not
interfere with the interpretation of the impact of Factors A and B on the population
mean
C) indicates the absence of interaction between Factors A and B which interferes with
the interpretation of the impact of Factors A and B on the population mean
D) indicates the absence of interaction between Factors A and B which does not
interfere with the interpretation of the impact of Factors A and B on the population
mean
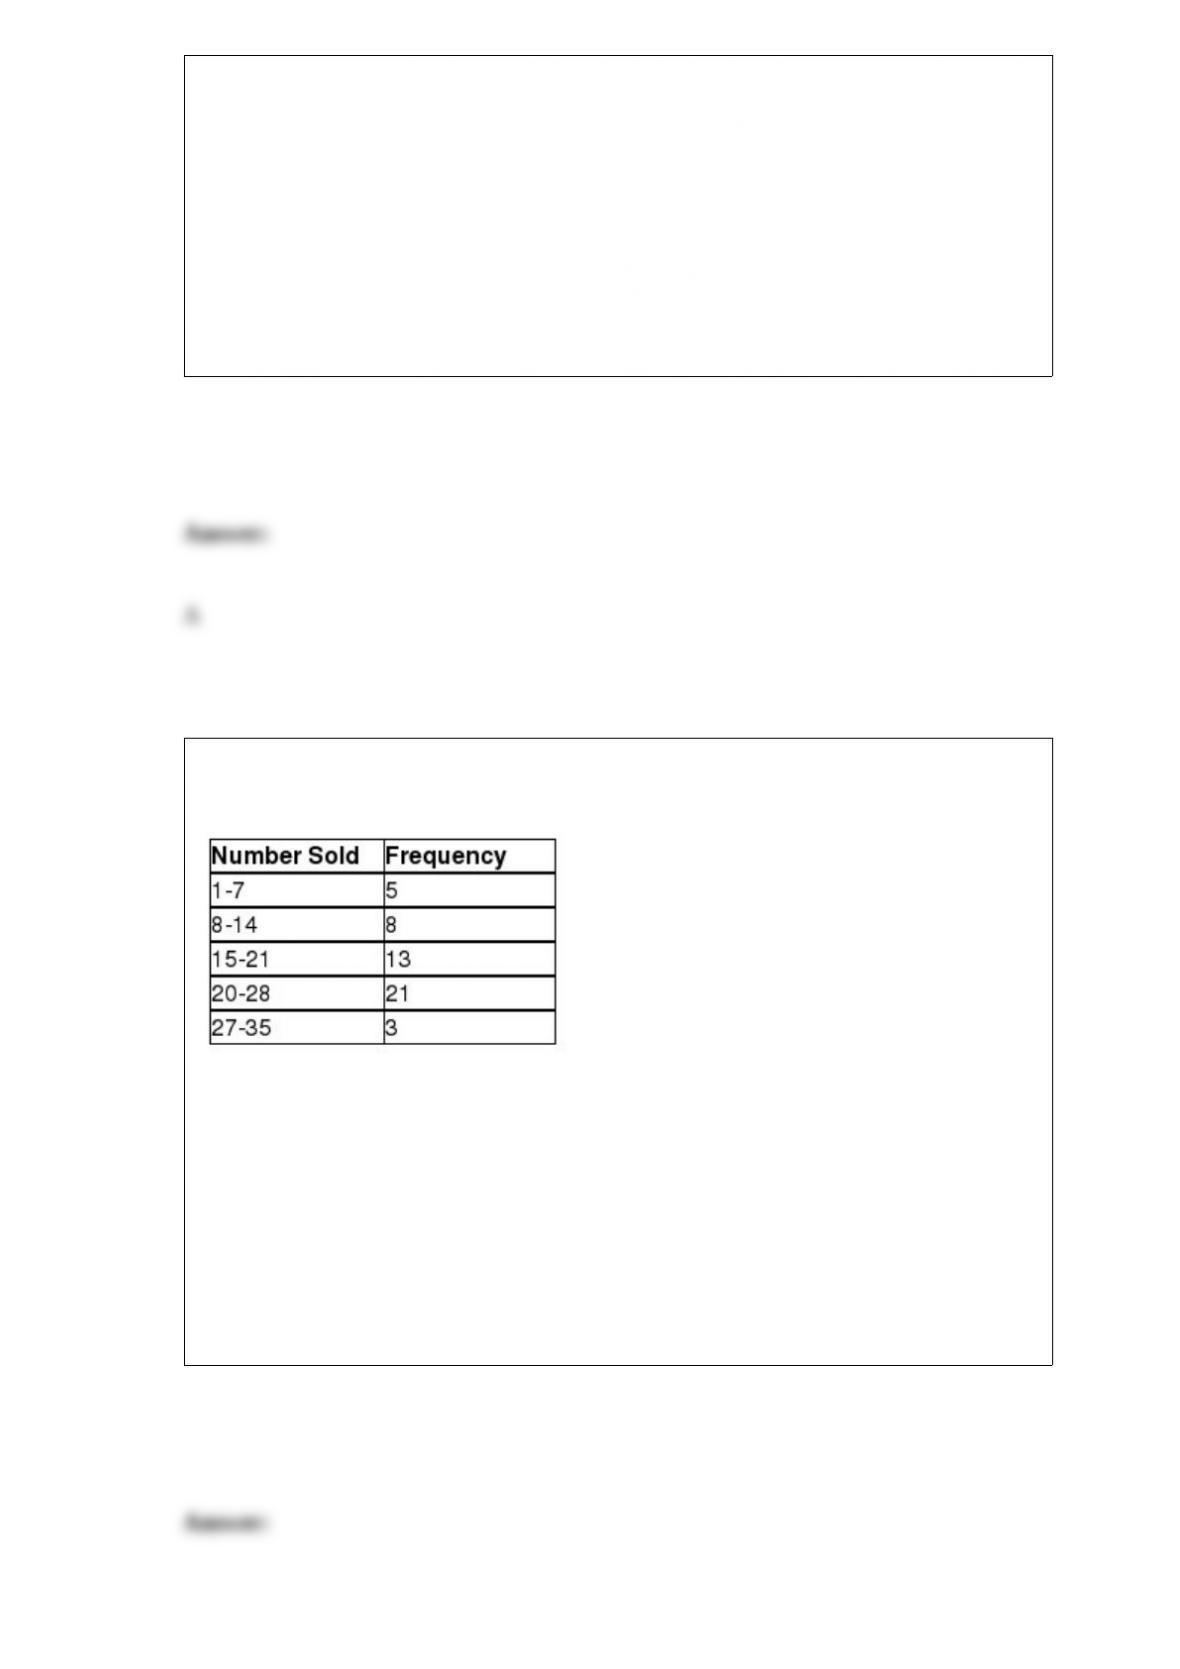
The following frequency distribution displays the daily sales of muffins at Avalon
Bakery.
What is the probability that 21 or fewer muffins will be sold tomorrow?
A) 0.52
B) 0.66
C) 0.80
D) 0.92

Jeff sells the New York Times Sunday newspaper at a city corner near several churches.
He sells each newspaper for $6.50 after purchasing them for $4.00. Any unsold
newspaper can be returned to the New York Times for a $0.75 credit. Jeff expects
demand on Sunday to be 75, 100, 125, or 150 newspapers and would like to order one
of these four quantities from the New York Times. If the Jeff uses the minimax regret
criterion, how many newspapers will he order?
A) 75
B) 100
C) 125
D) 150
Use the information below to answer the following question(s).
The following decision tree is partially completed for a company that is deciding to
build a large or small facility for a new product that will face demand that is strong or
weak. The company has an option to perform a market survey that will cost $4,000 that
will predict a strong or weak market. The payoffs for each combination of facility size
and demand are also shown.
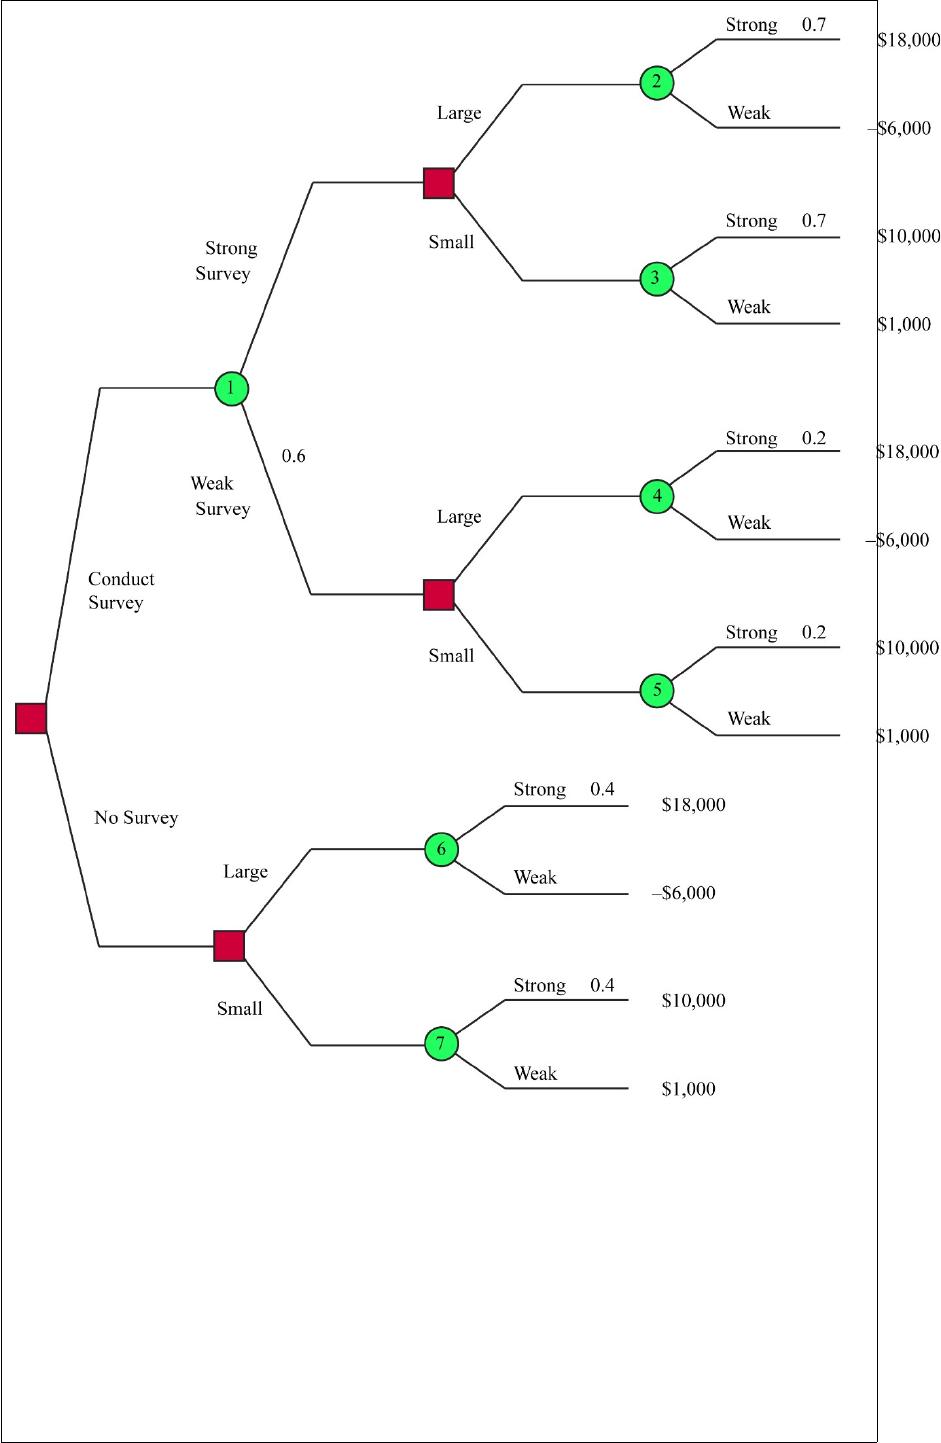
Given the survey will predict a strong market, the expected monetary value of building
a small facility is ________.
A) $2,800
B) $7,300
C) $10,800
D) $12,300
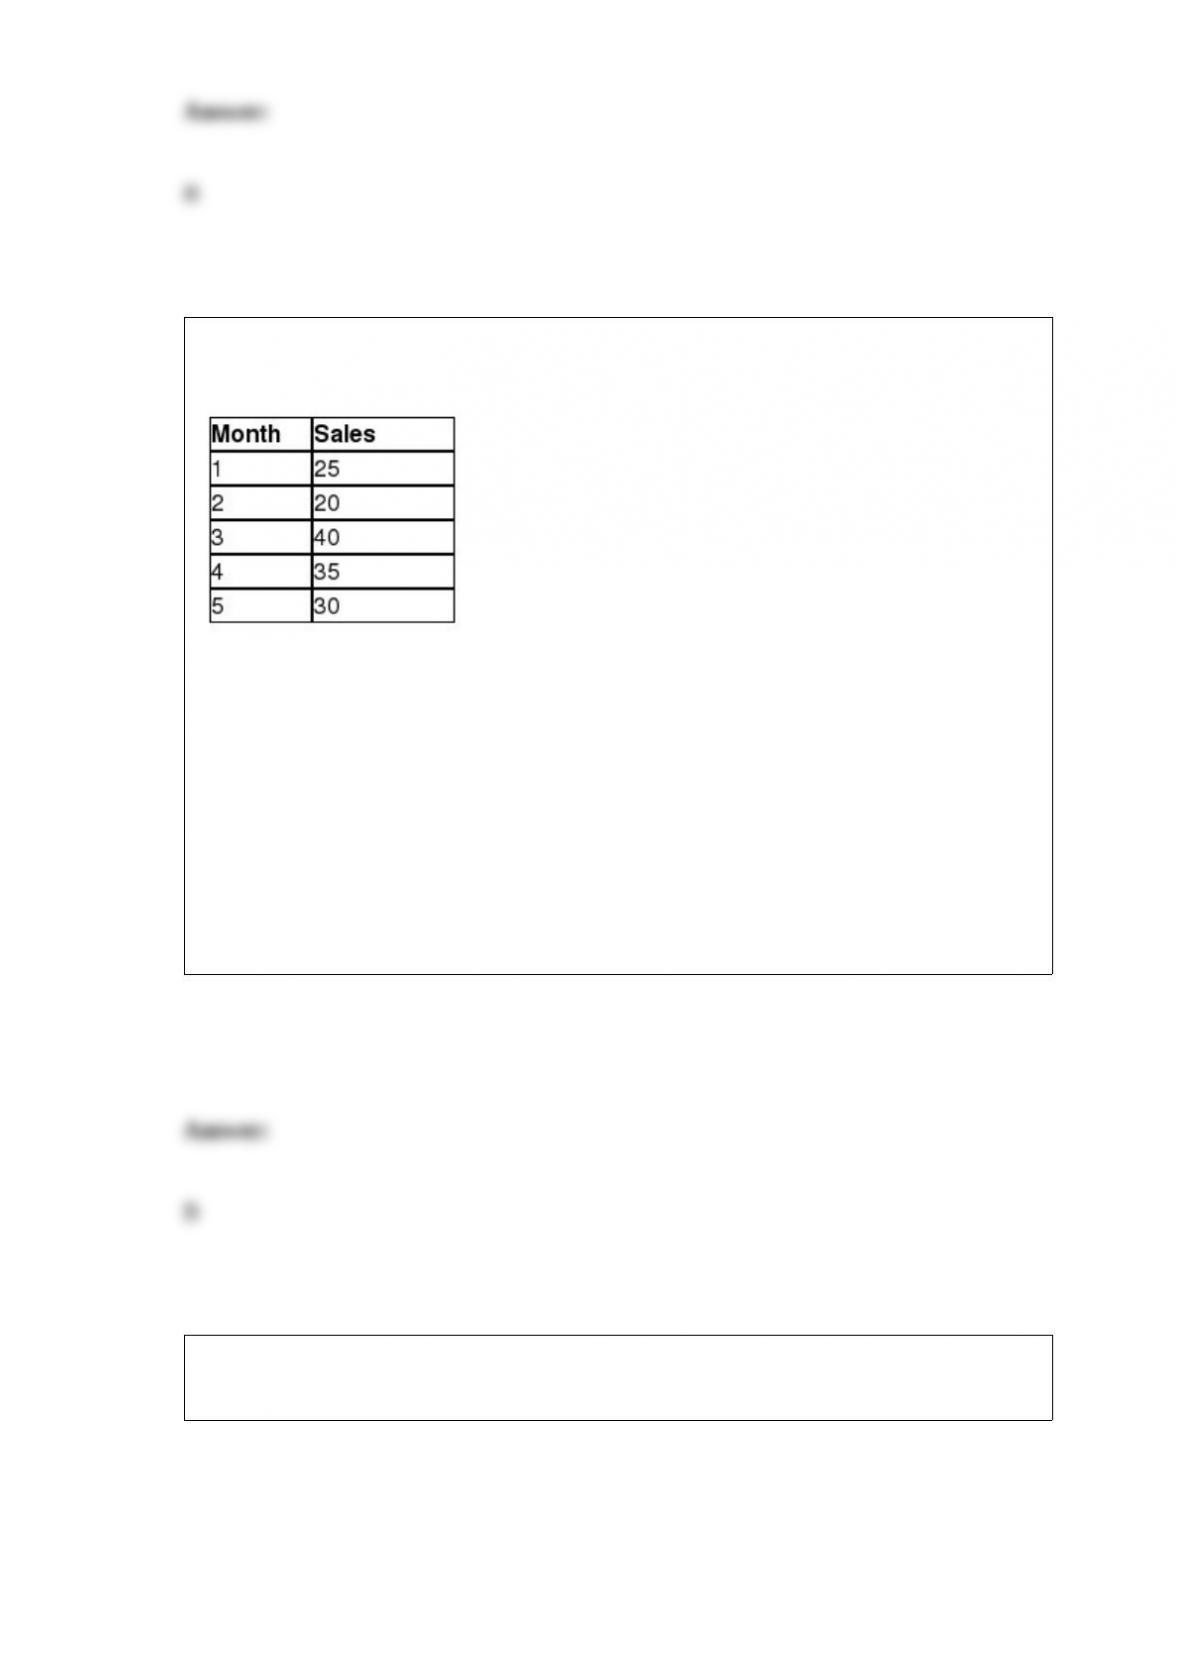
The following data represent the number of refrigerators sold for each of the past five
months for Templeton Appliances.
Using an exponential smoothing with trend adjustment technique with alpha equal to
0.6 and beta equal to 0.2, the mean absolute deviation is ________.
A) 6.2
B) 7.7
C) 10.4
D) 12.0
The table below shows the numbers of two- to five-bedroom houses in the Belmont
neighborhood.
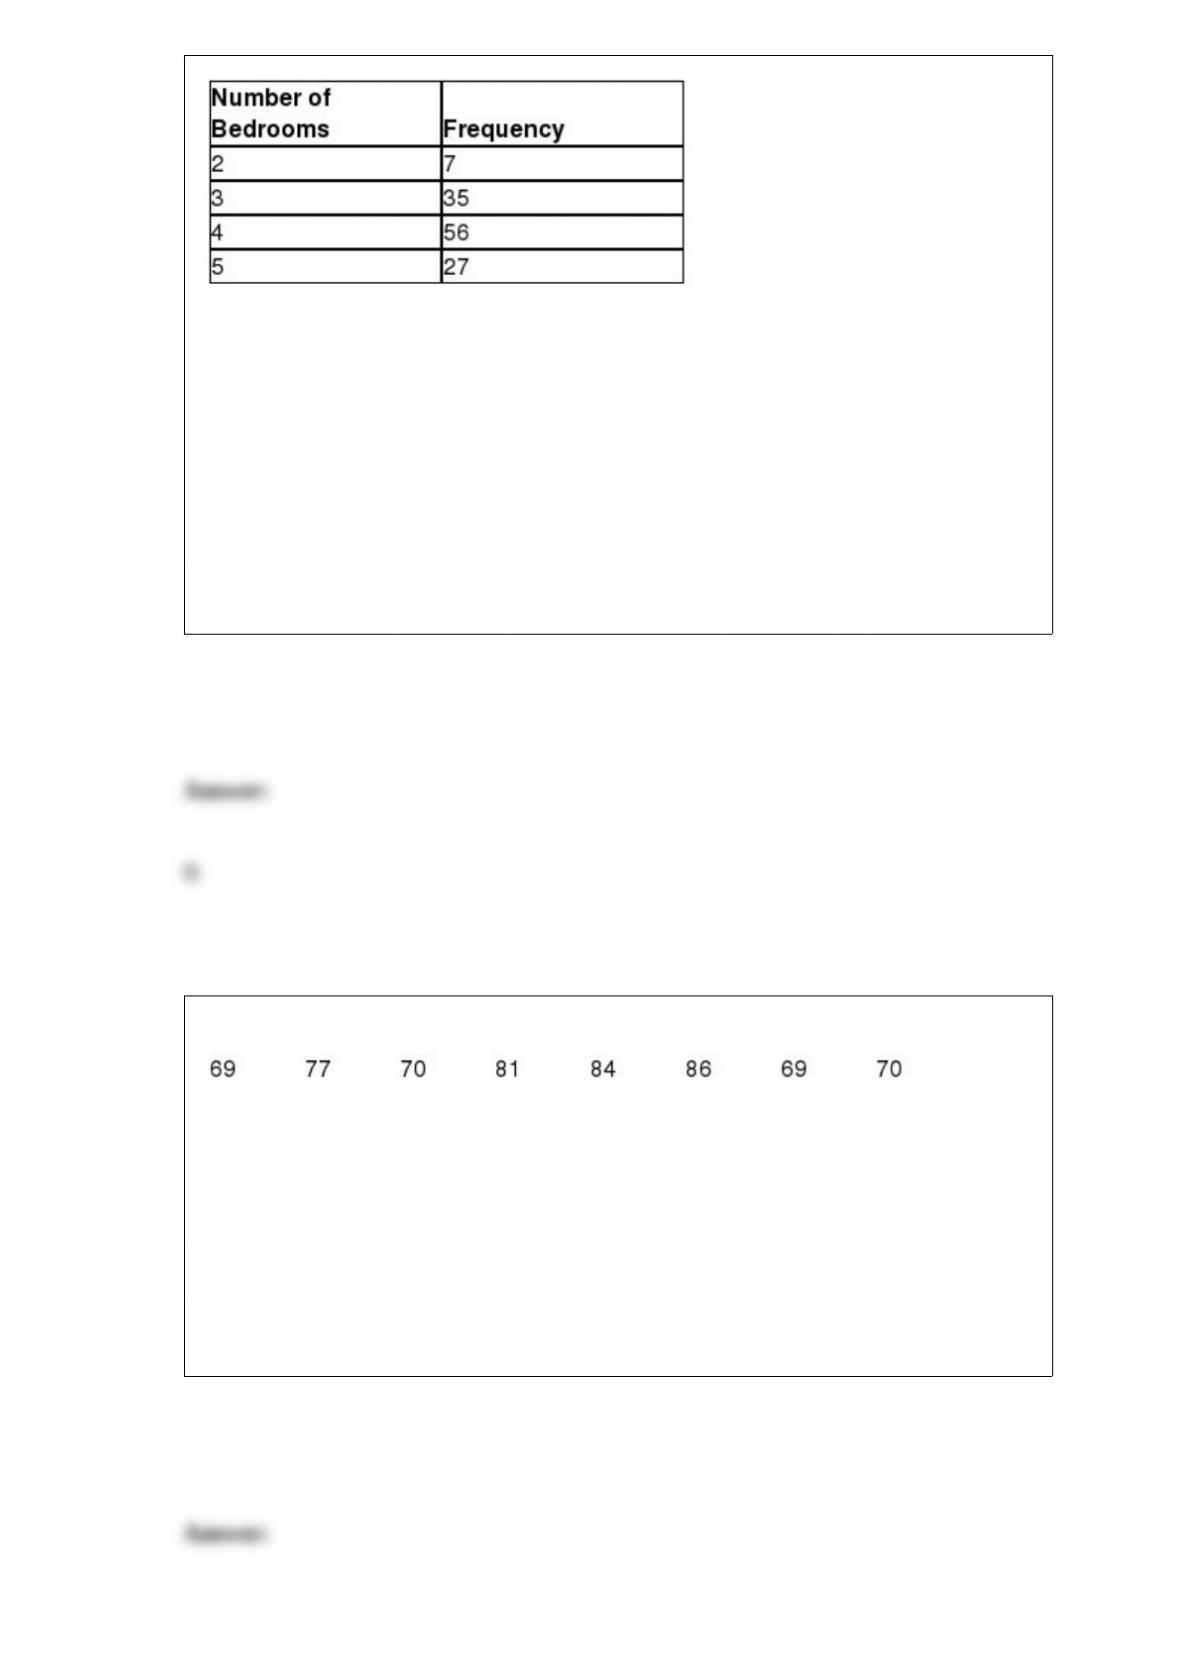
What is the standard deviation for the number of bedrooms in a house in this
neighborhood?
A) 0.700
B) 0.830
C) 1.137
D) 1.722
The daily high temperature in Philadelphia over an eight-day period is shown below.
The mode for this data set is ________.
A) 69
B) 70
C) 69 and 70
D) There is no mode for this data set.

Use the following information to answer the question(s) below.
The National Basketball Association (NBA) would like to develop a multiple regression
model that would predict the number of wins for a team during the season. The
following independent variables were considered for the model: field goal percentage
(FG%), three-point percentage (3PT%), free throw percentage (FT%), turnovers per
game (TO), rebounds per game (REB), assists per game (ASSISTS), and steals per
game (STEALS). The following table shows the results of a general stepwise regression
procedure with “p-value to enter” and “p-value to remove” set to 0.05.
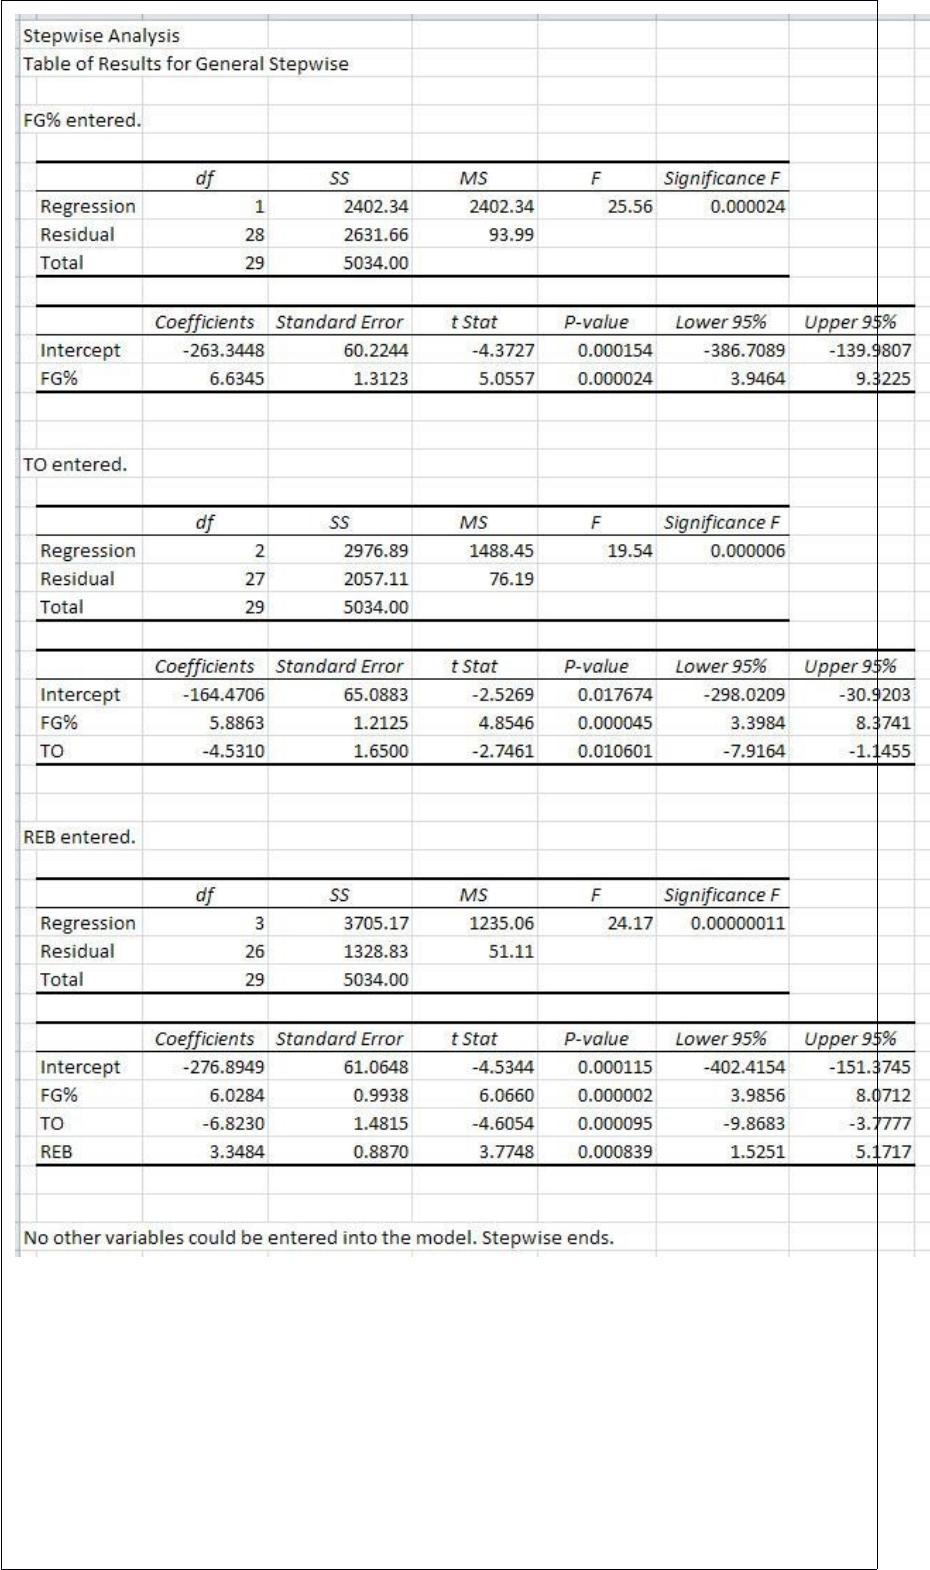
Which one of the following statements are true about the final regression model?
A) For every additional turnover per game, the average number of wins per season will
decrease by 6.8230.
B) For every additional turnover per game, the average number of wins per season will
decrease by 4.5310.
C) For every additional percent in field goal percentage, the average number of wins
per season will increase by 6.6345.
D) For every additional rebound per game, the average number of wins per season will
decrease by 3.3484.
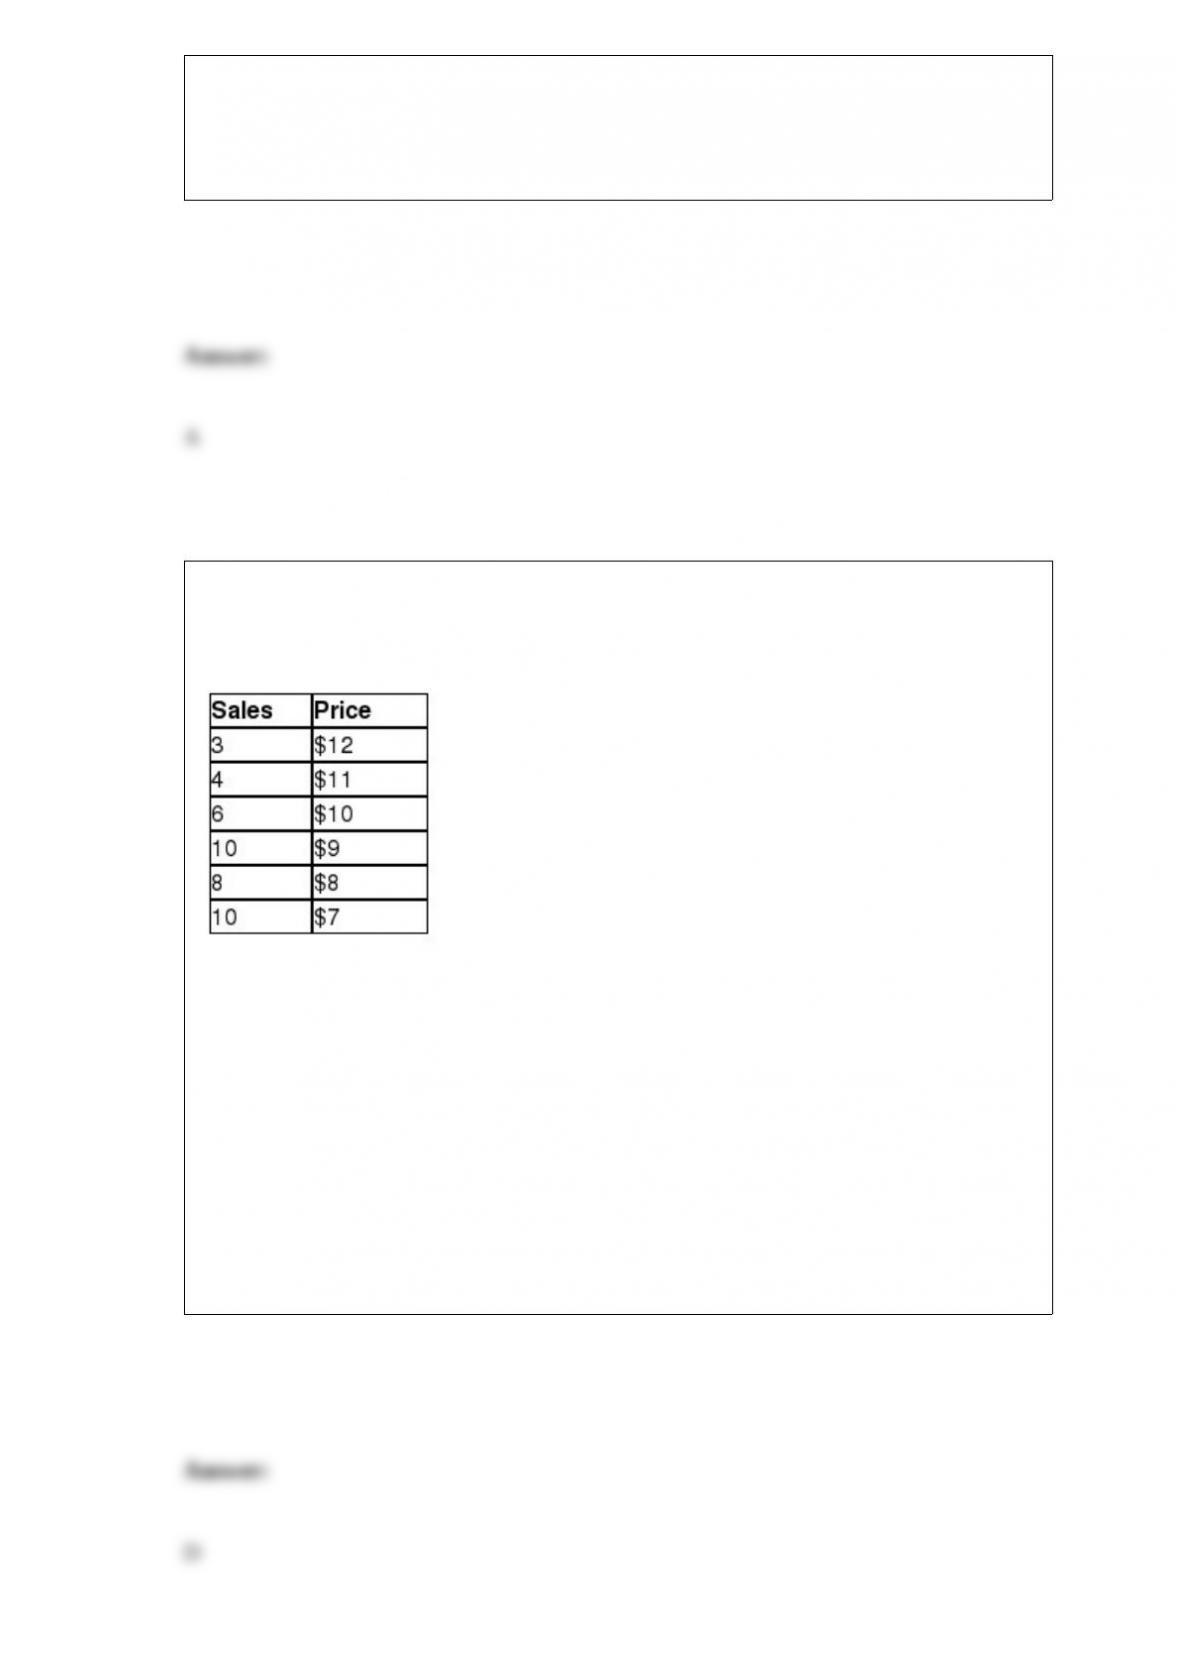
Costco sells paperback books in their retail stores and wanted to examine the
relationship between price and demand. The price of a particular novel was adjusted
each week and the weekly sales were recorded in the table below.
Management would like to use simple regression analysis to estimate weekly demand
for this novel using the price of the novel. The test statistic for testing that the
population slope is not equal to zero is ________.
A) 1.44
B) “1.17
C) “2.65
D) “4.42
________ probability is used when we rely on experience and intuition to estimate the
likelihood of an event.
A) Classical
B) Simple
C) Empirical
D) Subjective
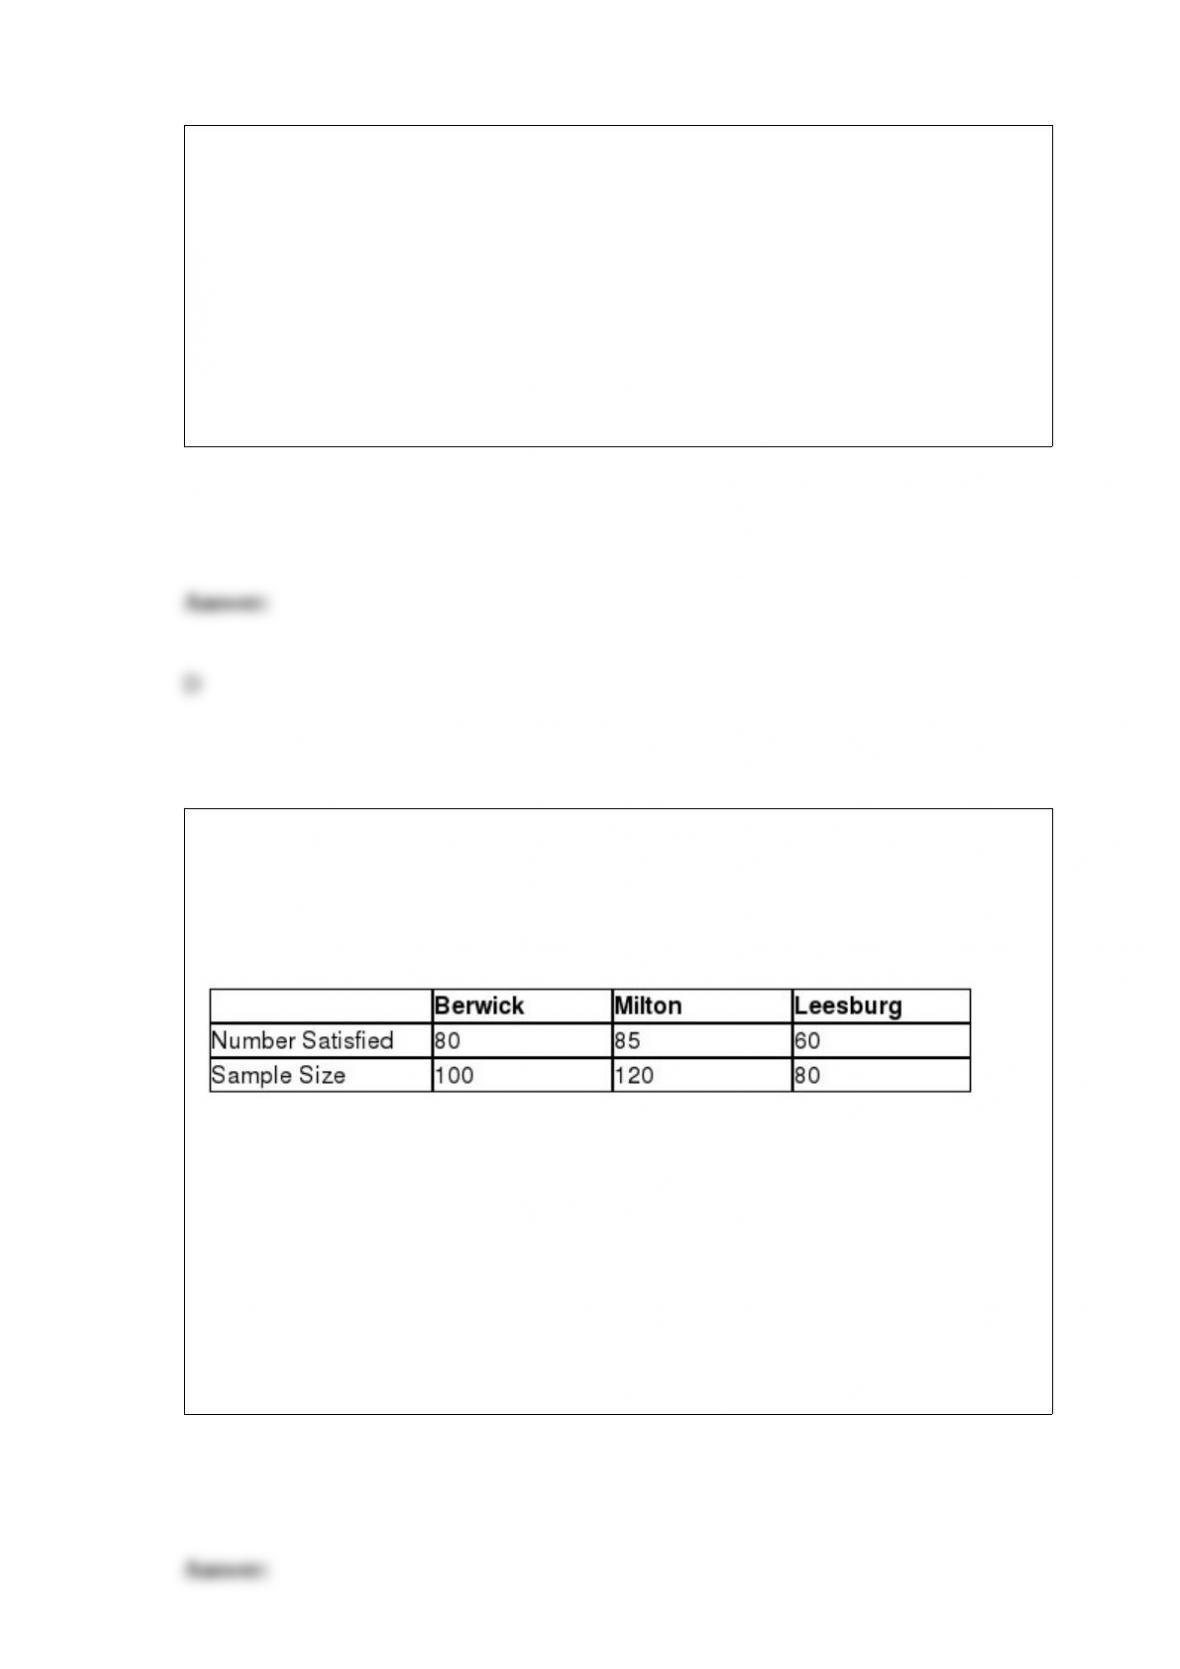
Lisa is a regional manager for a restaurant chain that has locations in the towns of
Berwick, Milton, and Leesburg. She would like to investigate if a difference exists in
the proportion of customers who rate their experience as satisfactory or better between
the three locations. The following data represent the number of customers who
indicated they were satisfied from random samples taken at each location.
The expected frequency of satisfied customers from the Milton sample is ________.
A) 60
B) 75
C) 80
D) 90

Use the following information to answer the question(s) below.
The National Football League has developed a regression model to predict the number
of wins during a season for a team using the following independent variables:
•Average points per game during the season (PPG)
•Average number of penalties committed per game during the season (PEN)
•Turnover differential during the season (TO)
Turnover differential is defined as the number of times the team took the ball away from
their opponent with a turnover minus the number of times the team gave the ball away to
their opponent with a turnover. For example, if TO = +5, the team had five more
takeaways than giveaways. If TO = “7, the team had seven more giveaways than
takeaways during the season.
The following Excel output shows the partially completed regression output from a
random season.
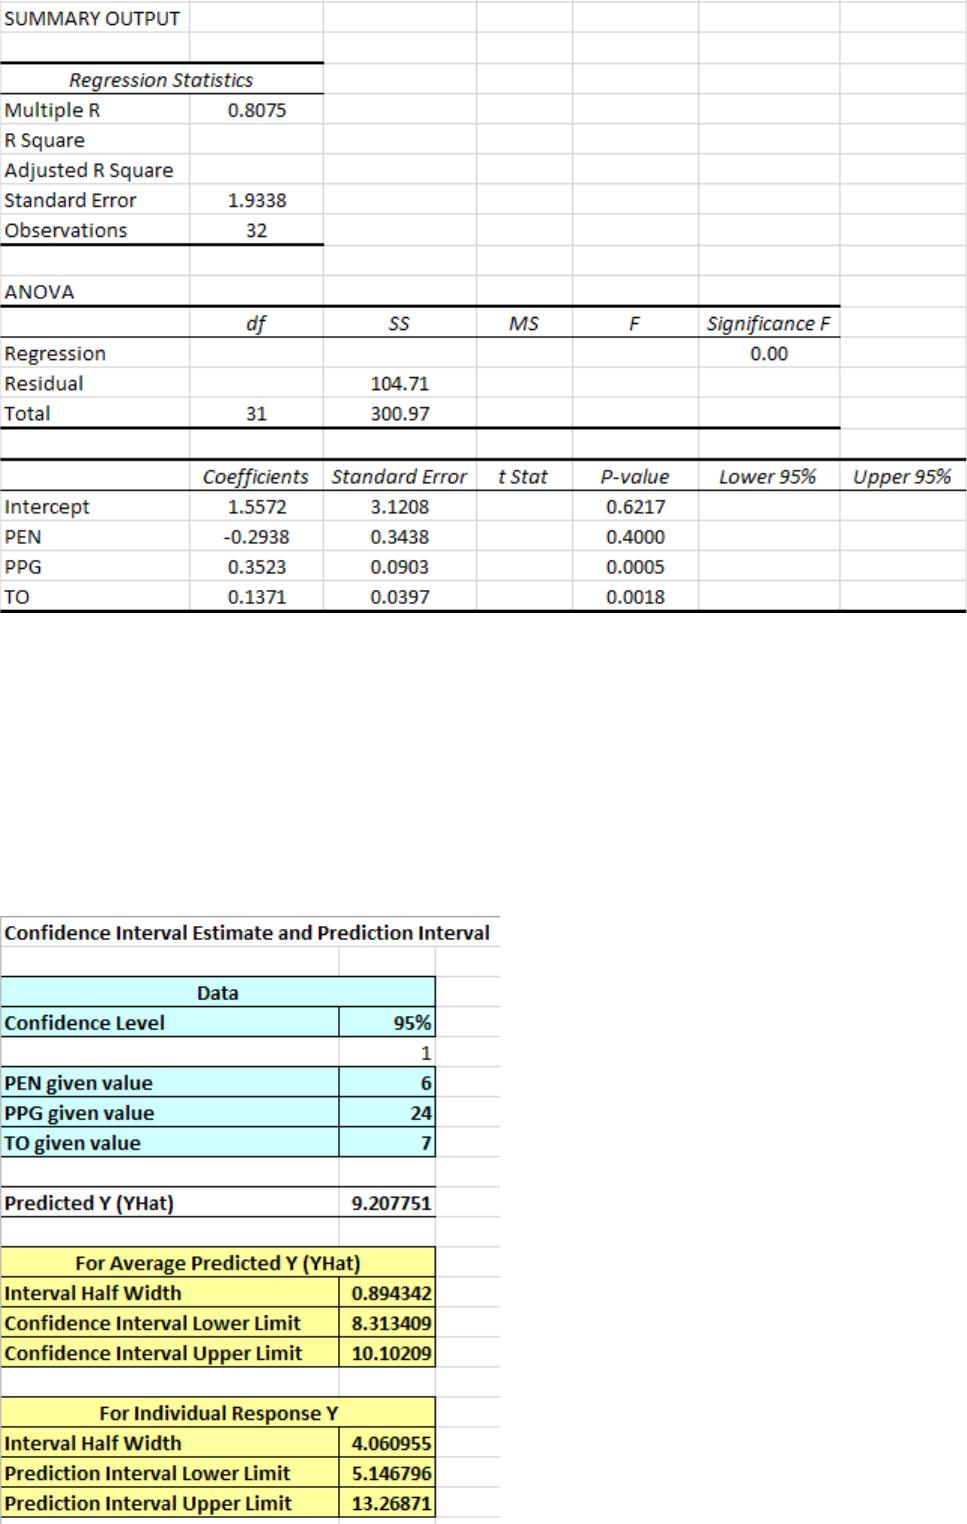
The mean square error for this model is ________.
A) 196.26
B) 65.42
C) 17.49
D) 3.74
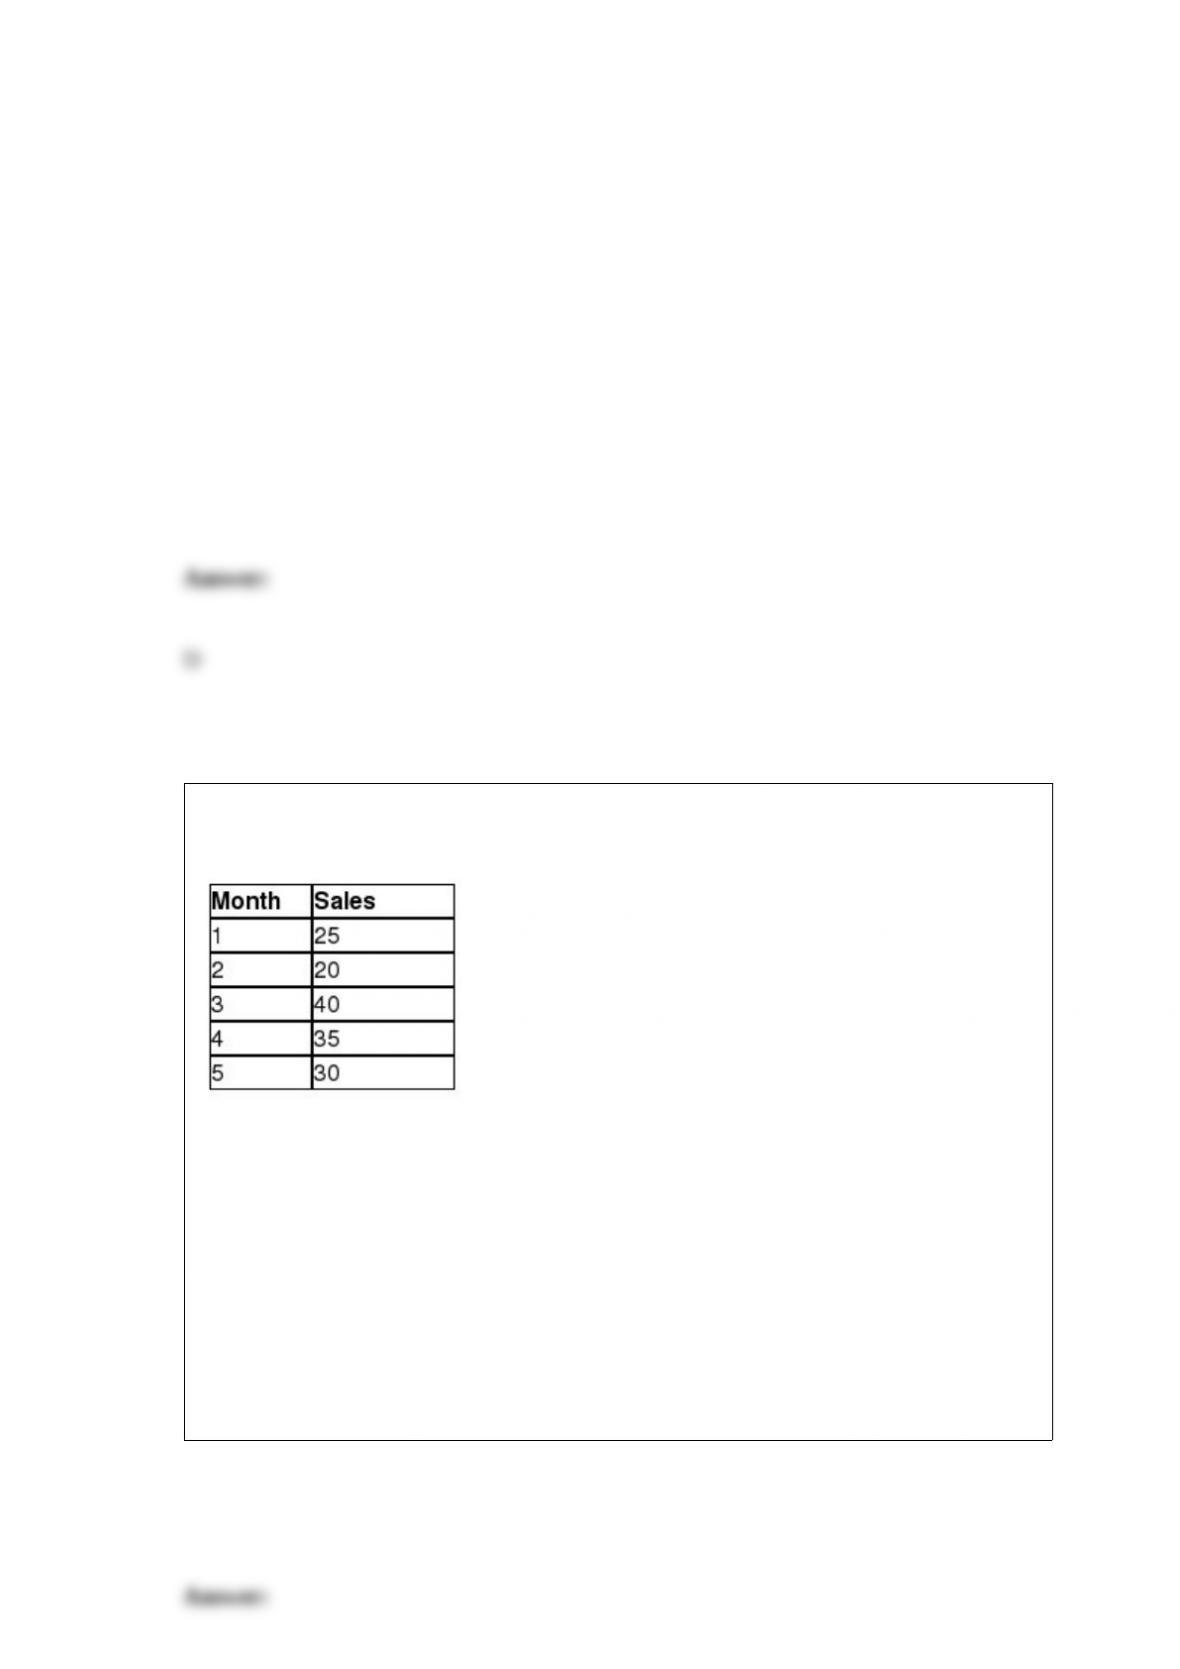
The following data represent the number of refrigerators sold for each of the past five
months for Templeton Appliances.
Using a two-period simple moving average, the forecasting error for Month 3 is
________.
A) 2.5
B) -5.0
C) -7.5
D) 17.5
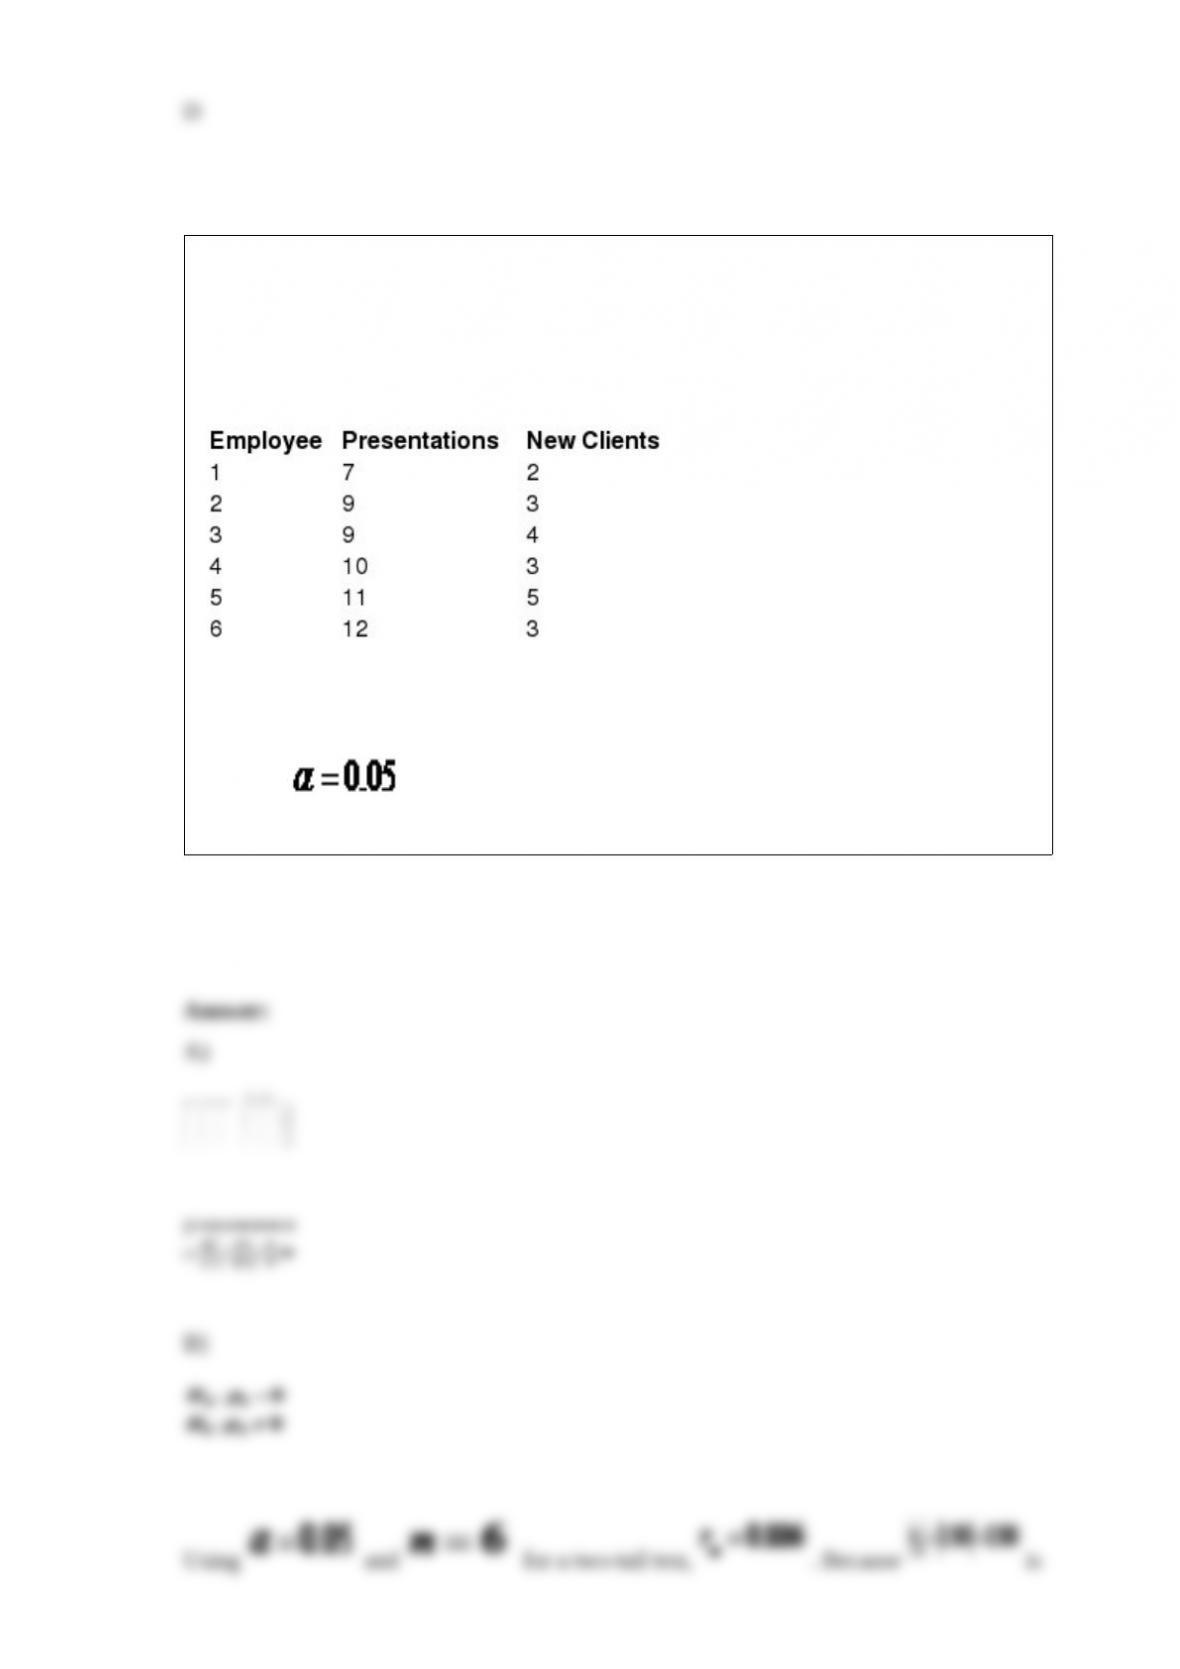
Sarah is the office manager for a group of financial advisors who provide financial
services for individual clients. She would like to investigate whether a relationship
exists between the number of presentations made to prospective clients in a month and
the number of new clients per month. The following table shows the number of
presentations and corresponding new clients for a random sample of six employees.
A) Calculate the Spearman rank-order correlation coefficient.
B) Using , perform a hypothesis test to determine if the population rank
correlation is different than zero.
The ________ represents the probability that any given confidence interval will not
contain the true population mean.
A) margin of error
B) confidence level
C) significance level
D) confidence interval
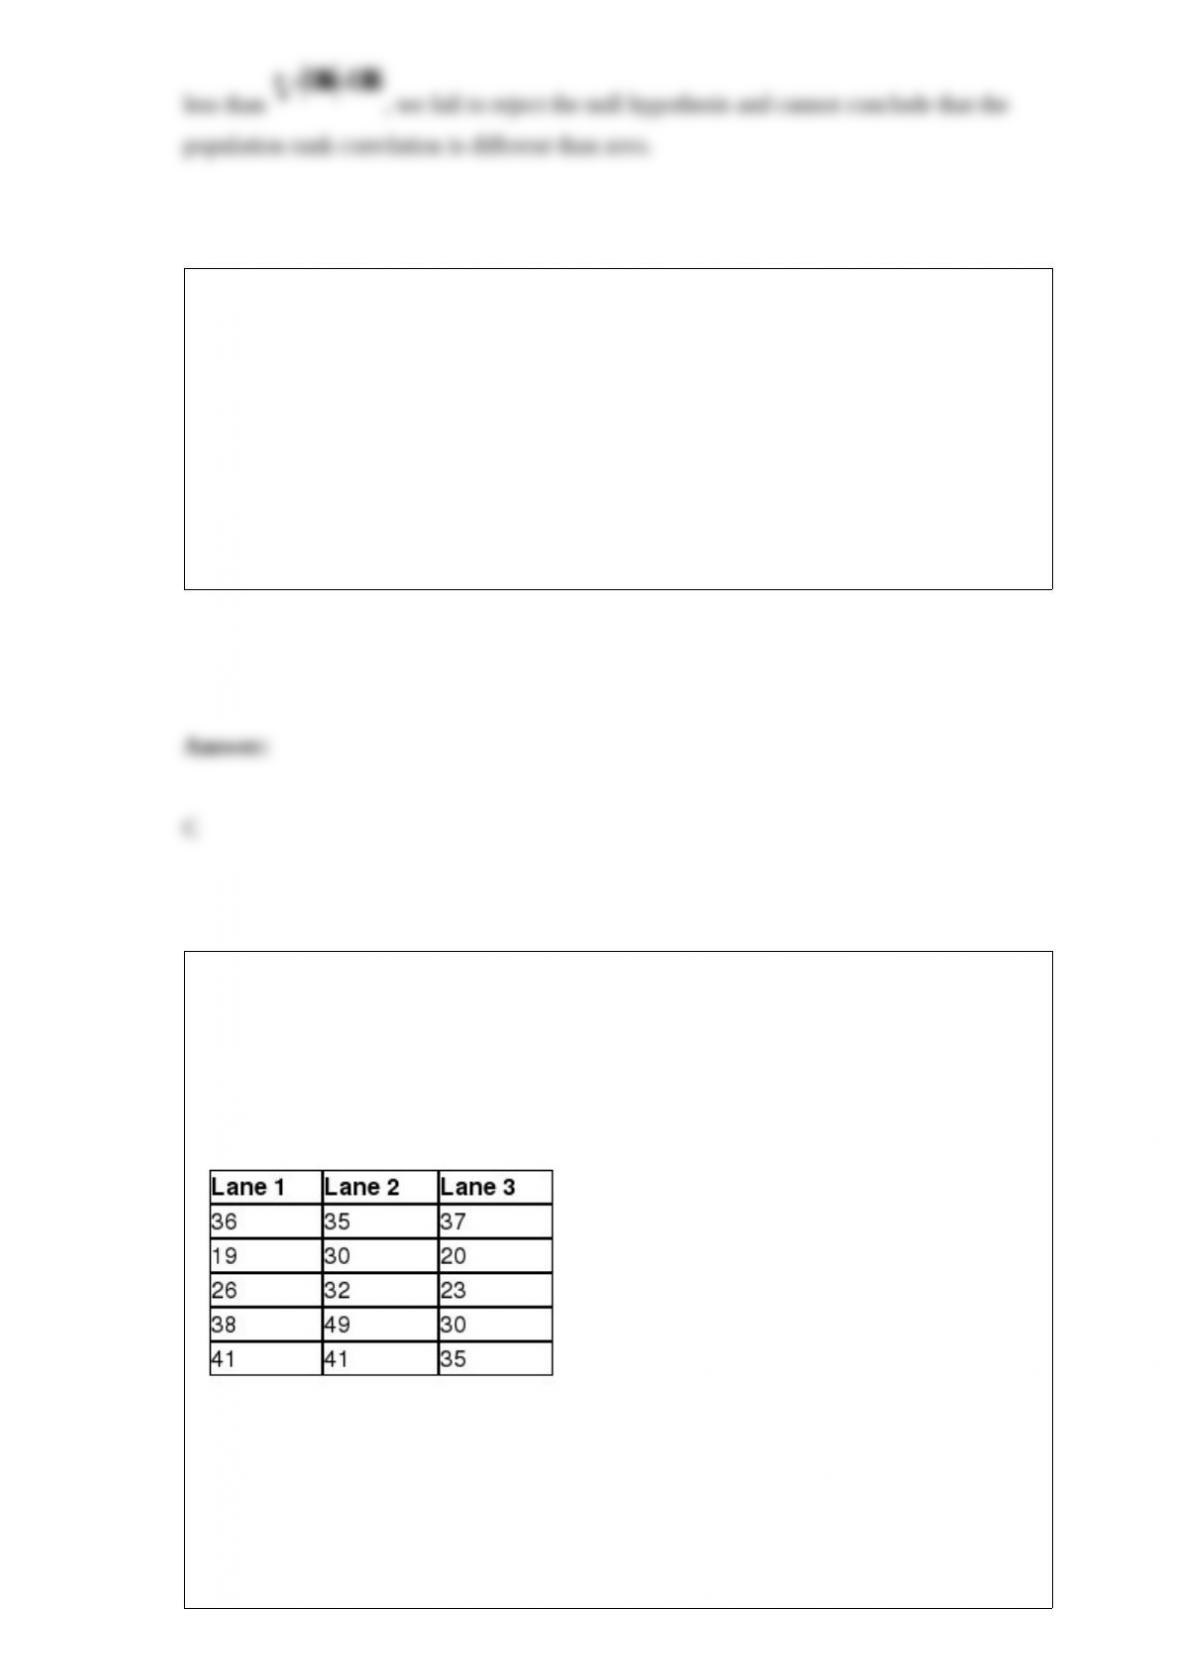
In Delaware, cars are inspected each year using state-operated inspection centers. The
Wilmington center has three drive-through lanes where cars are inspected in a sequence
of steps and would like to test to determine if a difference exists in the median wait time
between lanes. The following data show the number of minutes that a random sample of
drivers spent waiting and having their cars inspected in the three lanes each day of the
week.
The appropriate nonparametric procedure for this analysis is the _________________
test.
A) Wilcoxon signed-rank
B) Kruskal-Wallis

C) Wilcoxon rank-sum
D) sign
The sampling distribution of the proportion follows the normal distribution when the
values np and nq are greater than or equal to ________.
A) 5
B) 20
C) 30
D) 50
Consider the partially completed two-way ANOVA summary table.
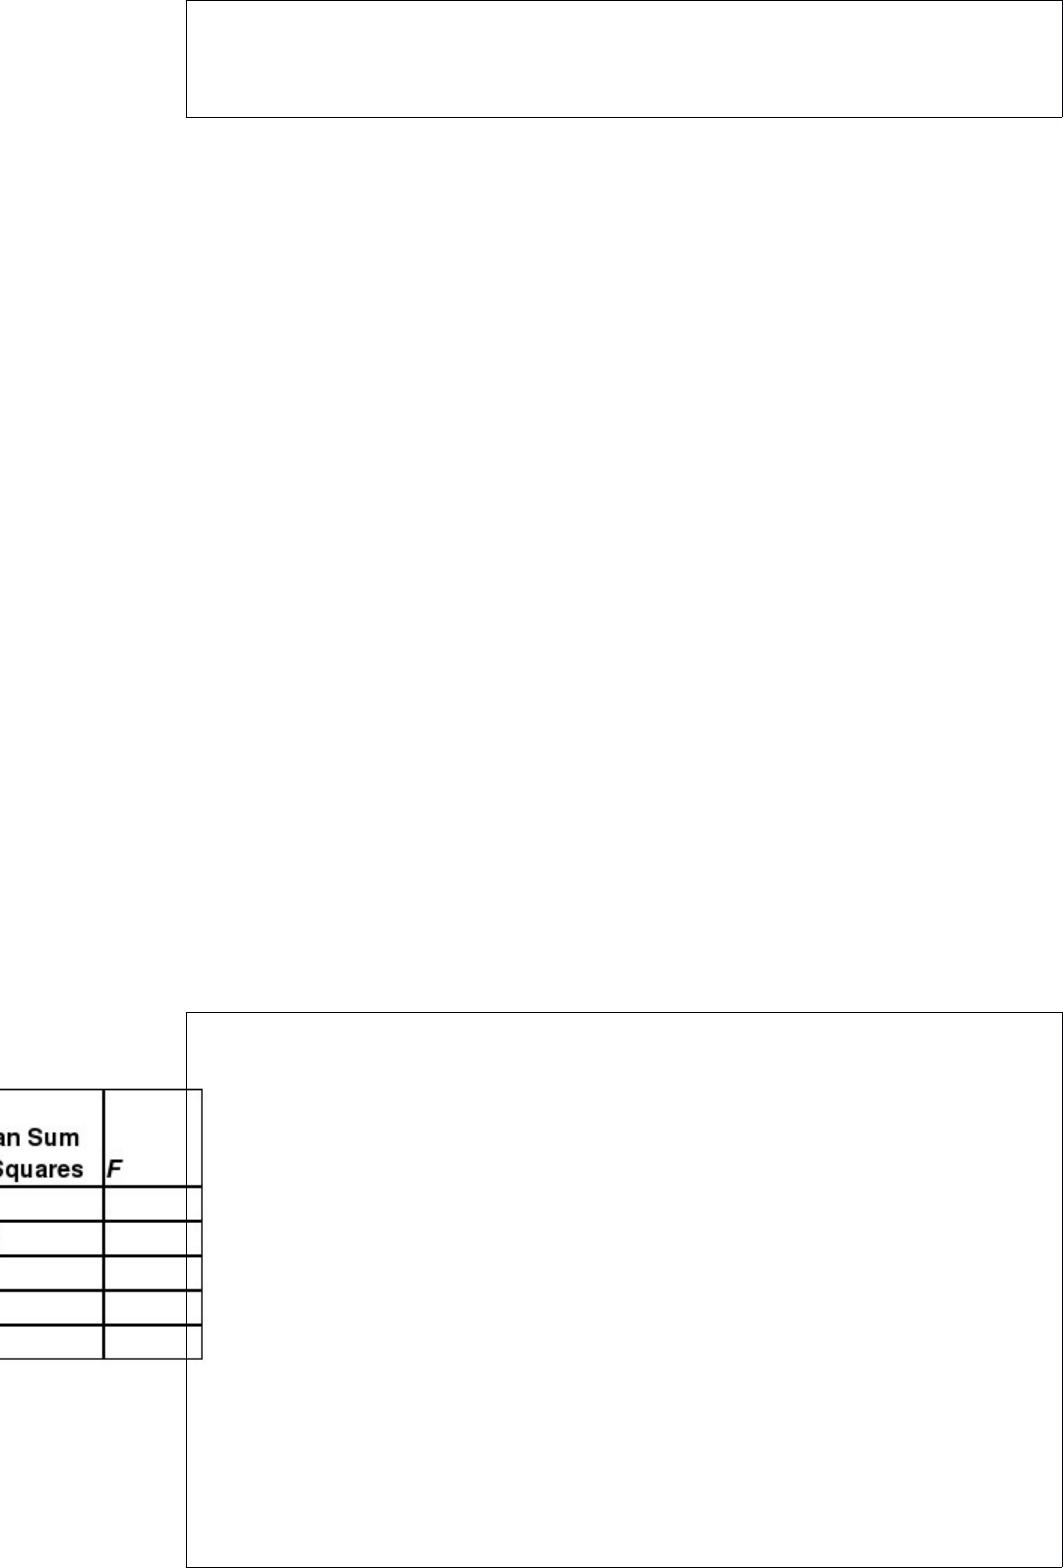
Using α = 0.05, a conclusion for this ANOVA procedure would be that because the
Factor B test statistic is
.____________________________________________________________________
A) more than the critical value, we can reject the null hypothesis and conclude that there is
a difference in average means for the Factor A populations
B) less than the critical value, we can reject the null hypothesis and conclude that there is
no difference in average means for the Factor A populations
C) less than the critical value, we cannot reject the null hypothesis and conclude that there
is no difference in average means for the Factor A populations
D) more than the critical value, we cannot reject the null hypothesis and conclude that
there is a difference in average means for the Factor A populations
Answer:cpmembership[
You have been assigned to test the hypothesis that the median number of cars waiting in
line for the drive-thru window during lunch hour differs between Chick-fil-A, Wendy’s,
and McDonald’s. The following data show the number of cars in line during randomly
selected times during the lunch hour at all three chains.
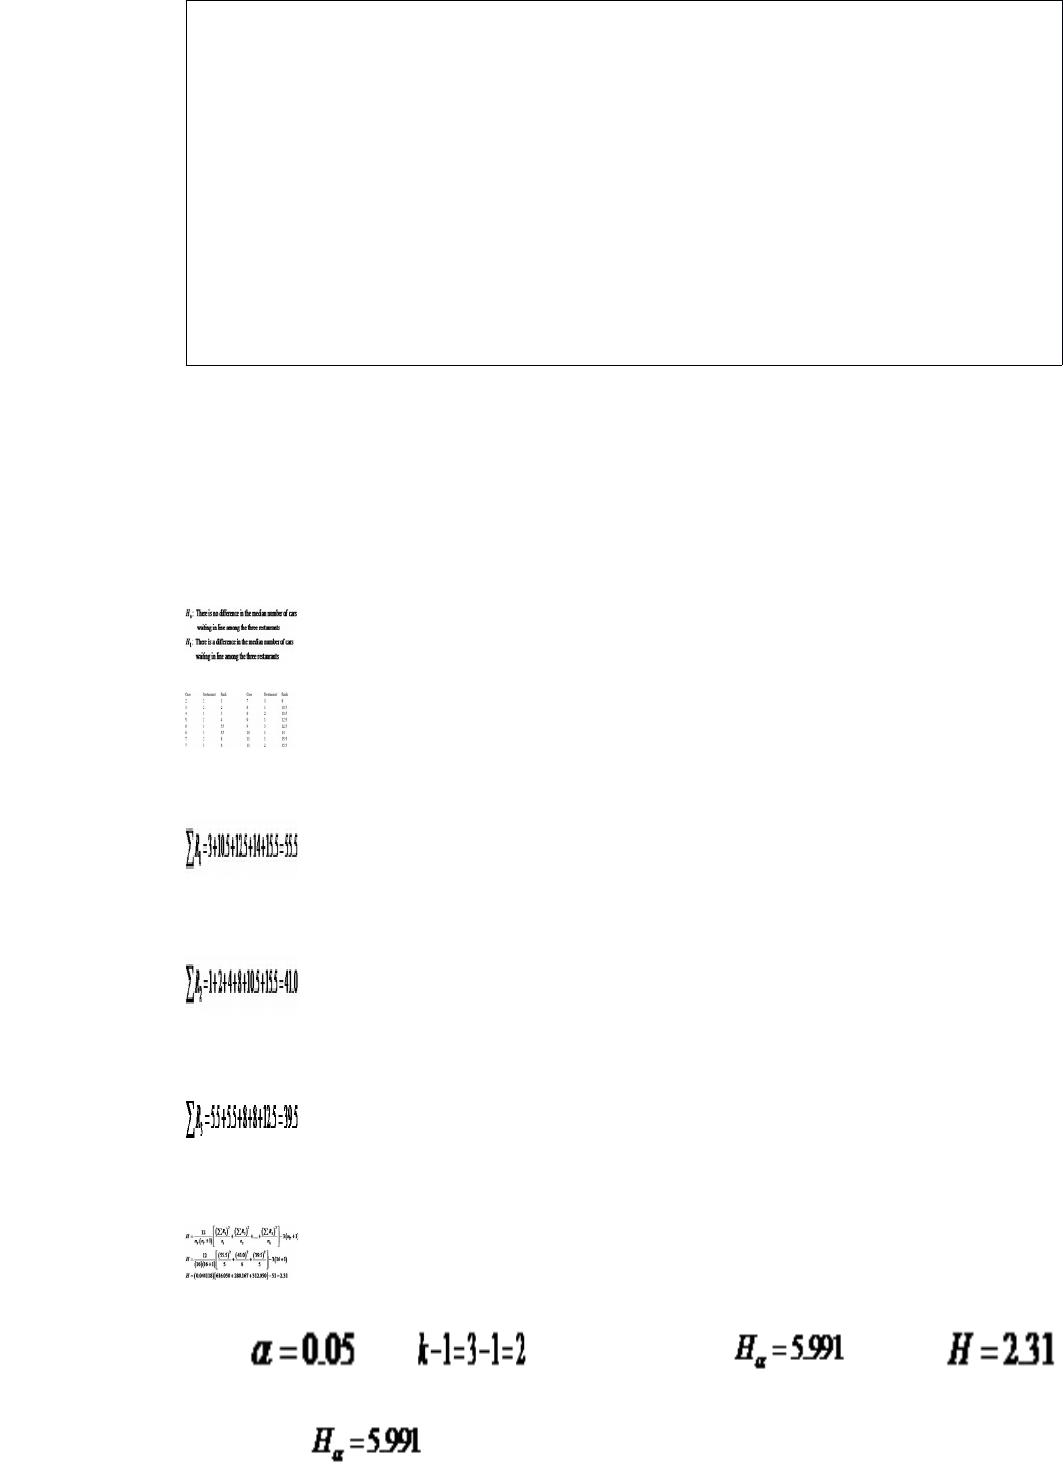
Perform this hypothesis test using α = 0.05 .
Answer:cpmembership[
The following table shows the number of spam e-mails that arrive in my inbox each
day.
What is the mean number of spam e-mails received per day ?
Answer:cpmembership[
The following data set represents the number of cars sold a month by Steve at Concord
Motors over the last nine months.
20 7 8 23 8 25 7 20 8
Describe the shape of this distribution as symmetrical, left-skewed, or right-skewed .
Answer:cpmembership[
Suppose Nielsen would like to test the hypothesis that people spend an average of 156
hours a month watching traditional TV. A random sample of 32 people watched an
average of 140.7 hours of TV last month with a sample standard deviation of 32.1
hours. Test this hypothesis using α = 0.02 with the p-value approach .
Answer:[cpmembership level=”2,3,4,5[“
The p-value is between 0.01 and 0.02. Because the p-value < α, we reject the null
hypothesis. Therefore, Nielsen can conclude that people do not spend an average of 156
hours a month watching traditional TV.[/cpmembership[
Use the following information to answer the question(s) below.

The following data provides the monthly Comcast cable bill for a random sample of 20
households along with the number of televisions in the household (TV), the number of
people living in the household (People), and the number of years that household has
been a Comcast customer (Years.(
Conduct the hypothesis test, showing the calculations, used to test the significance of
the overall regression model for predicting a Comcast cable bill using α = 0.05 .
Answer:[cpmembership level=”2,3,4,5[“
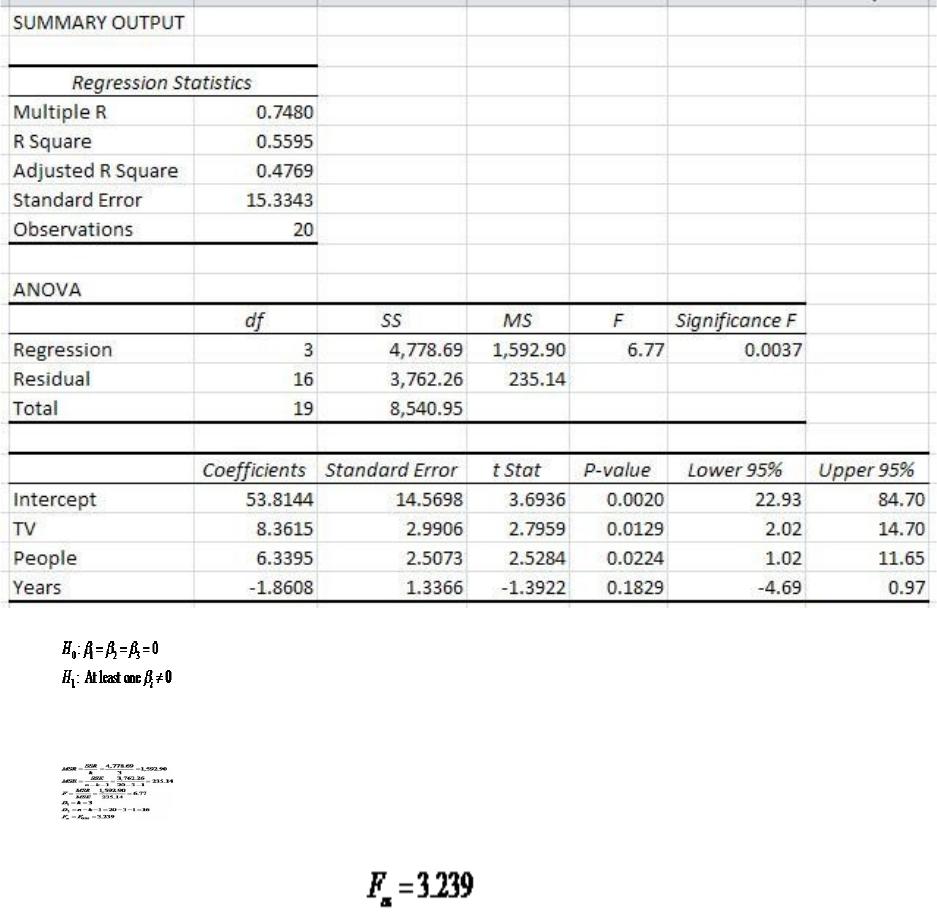
Because F=6.77 is greater than , we reject H0 and conclude that at least one of
the population coefficients for our independent variables is not equal to zero. In other
words, you can use this regression model to predict the monthly Comcast cable bill for a
household based on the number of televisions in the household, the number of people
living in the household and the number of years that household has been a Comcast
customer.[/cpmembership[