

For any distribution, there are an equal number of values above and below the mean.
The central limit theorem states that if the sample size, n, is sufficiently large, the
sampling distribution of the means will be approximately normal, even when the
population is skewed or uniform.
A scatter diagram is a graph that portrays the correlation between a dependent variable
and an independent variable.
Multiple regression analysis is used when one independent variable is used to predict
values of two or more dependent variables.

When doing research, knowing the population mean and other population parameters is
essential.
According to the Empirical Rule, about 95% of the observations lie within plus and
minus 2.00 standard deviations.

The arithmetic mean is the sum of the quantitative observations divided by the total
number of observations.
If the sampling distribution of the sample means approximates a normal distribution,
then the population is normally distributed.
A dot plot is useful for quickly graphing frequencies in a small data set.

A box plot shows the skewness of a distribution.
A scatter diagram is used to illustrate a relationship between gender and the preference
for Coke or Pepsi.
A pie chart is similar to a relative frequency distribution.
A sample is a portion or part of the population of interest.

Data measured on a nominal scale can only be classified into categories.
Nonparametric tests require no assumptions about the shape of the population
distribution.
In regression analysis, error is defined as .


If a confidence interval for the difference between a pair of treatment means includes 0,
then we reject the null hypothesis that there is no difference in the pair of treatment
means.
The alternative hypothesis used in ANOVA is H1: All population means are equal.
The coefficient of determination is the square root of the coefficient of correlation.


Extremely high or low scores affect the value of the median.
In the sampling distribution of the sample means, the standard error of the mean will
vary according to the size of the sample. As the sample size, n, gets larger, the
variability of the sampling distribution of the means gets larger.
A student scored in the 85th percentile on a standardized test. This means that the
student scored lower than 85% of all students who took the test.

In a sample of 10 people, 3 persons earn $8 an hour, 6 earn $9 an hour, and 1 earns $12
an hour. The weighted mean hourly wage is $9.
A p-value is a probability.
In an ANOVA table, k represents the total number of sample observations and n
represents the total number of treatments.

When computing probabilities for the sampling distribution of the sample mean, the
z-statistic is computed as .
An interval estimate is a range of values used to estimate a population parameter.
The standard normal distribution is a special normal distribution with a mean of 0 and a
standard deviation of 1.


The standard error of the mean is directly related to the sample size.
The values of a and b in the regression equation are called the regression coefficients.
Categorizing voters as Democrats, Republicans, and Independents is an example of
interval level measurement.
Within plus and minus one standard deviation of the mean, the area under any normal
curve is about 68%.
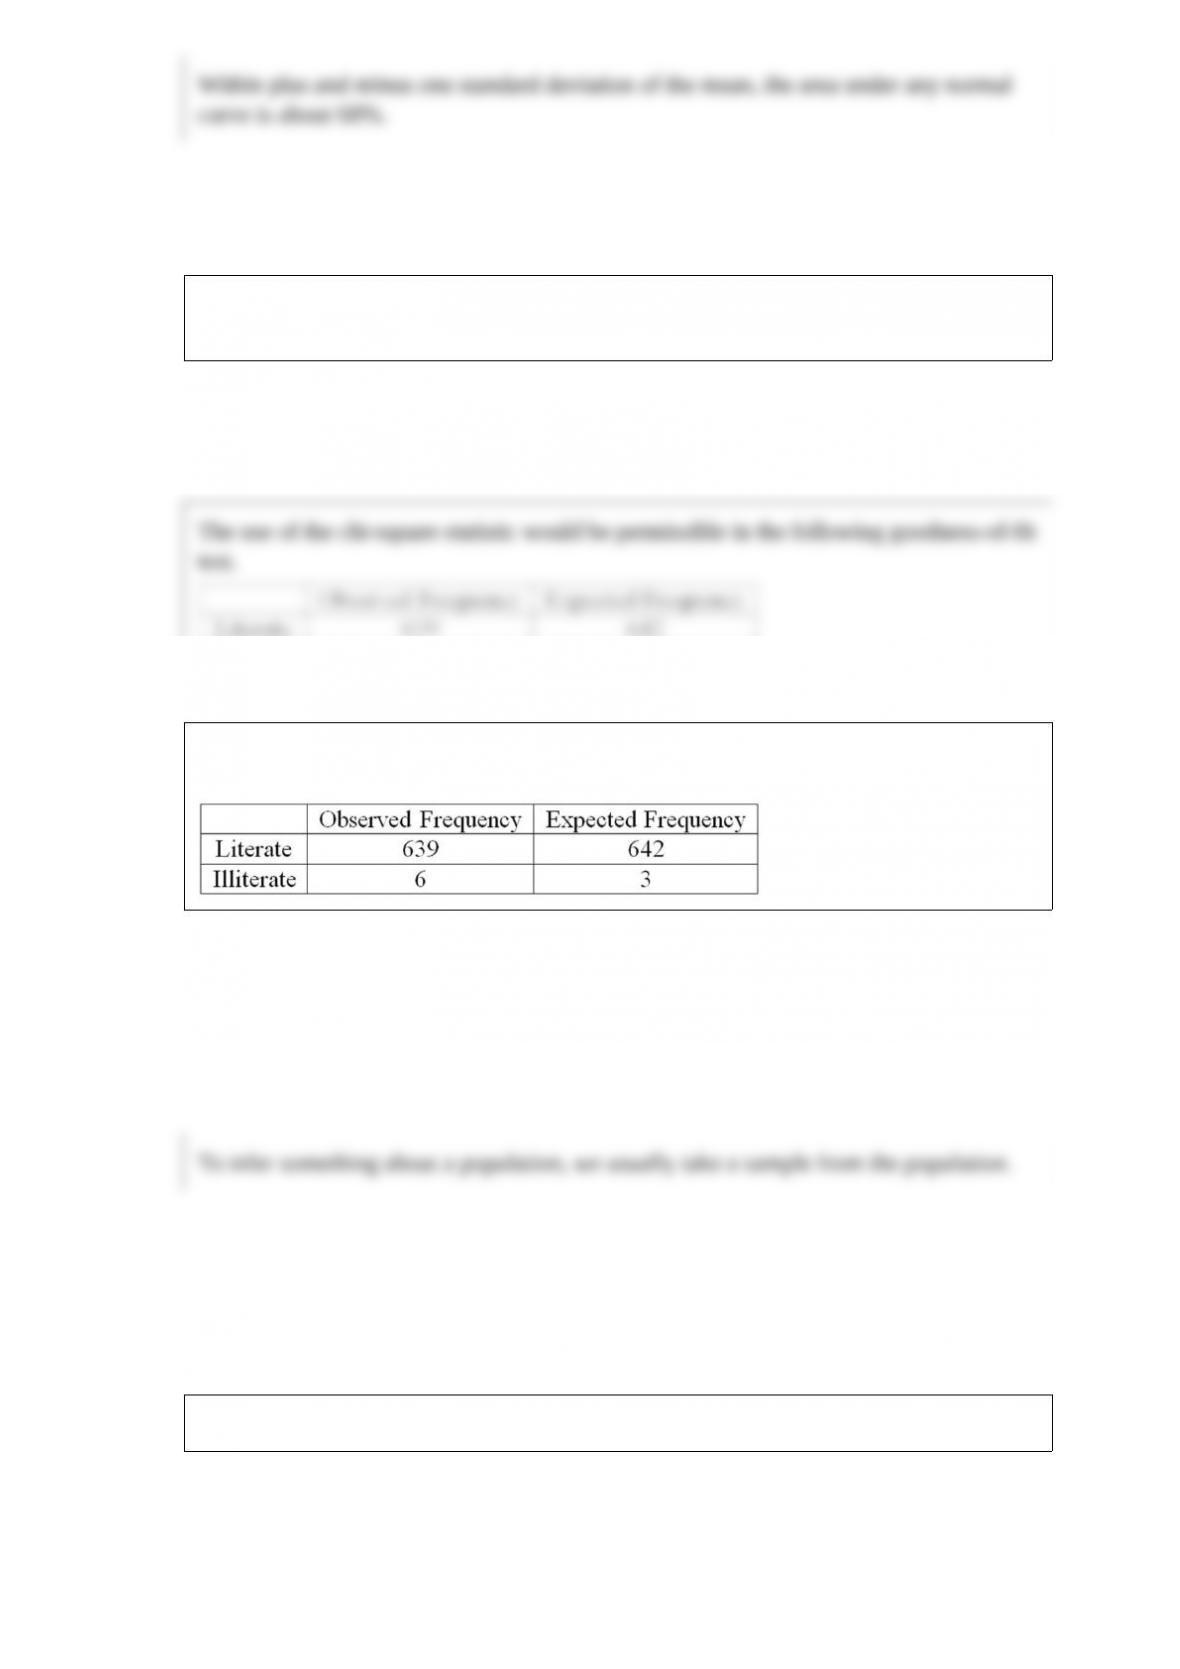
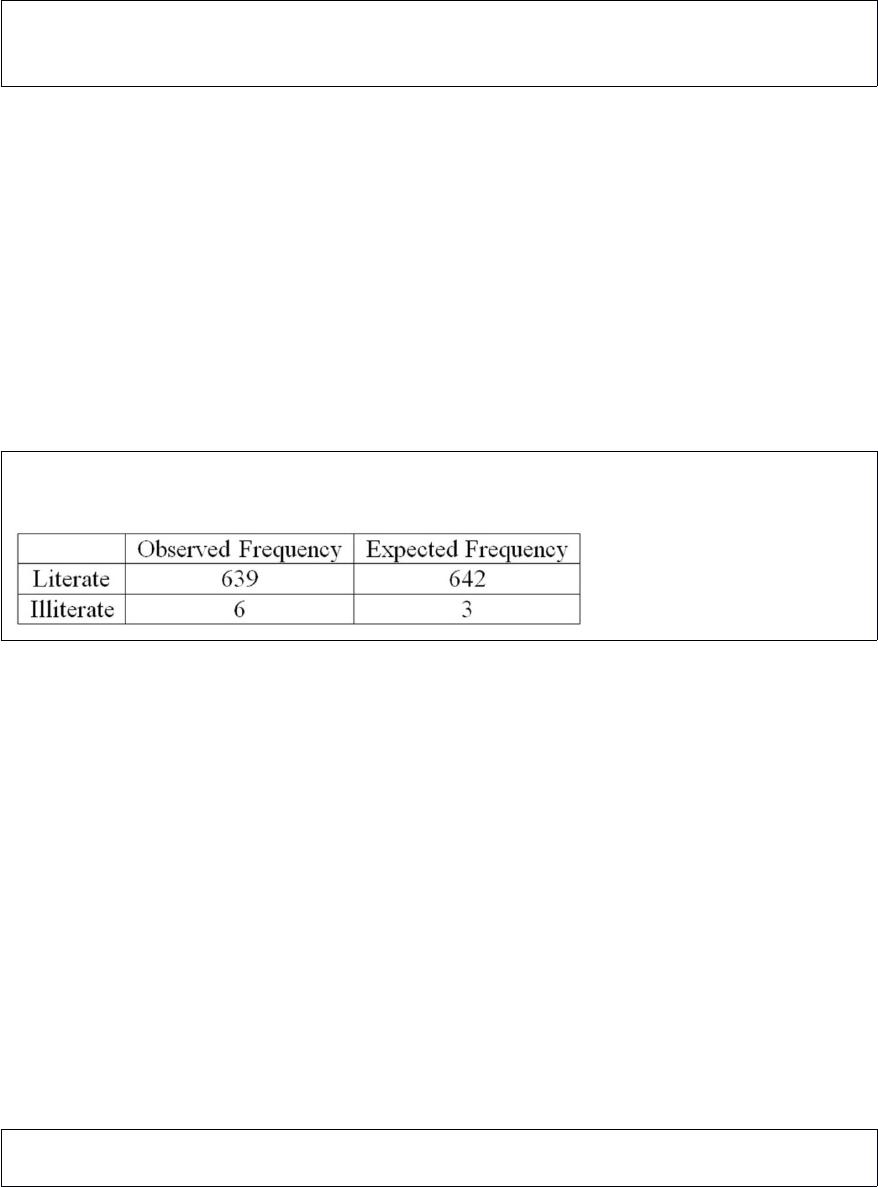
The use of the chi-square statistic would be permissible in the following goodness-of-fit
test.
To infer something about a population, we usually take a sample from the population.


The CIA World Factbook cited these numbers for the United States:
– The birthrate is 14.14 births per 1,000 population.
– The average life expectancy for females is 80 years.
– Approximately 290 million persons reside in the United States.
Each of these numbers is referred to as a statistic.
A value that is typical or representative of the data is referred to as a measure of central
location.
A combination of a set of objects is defined by the order of the objects.
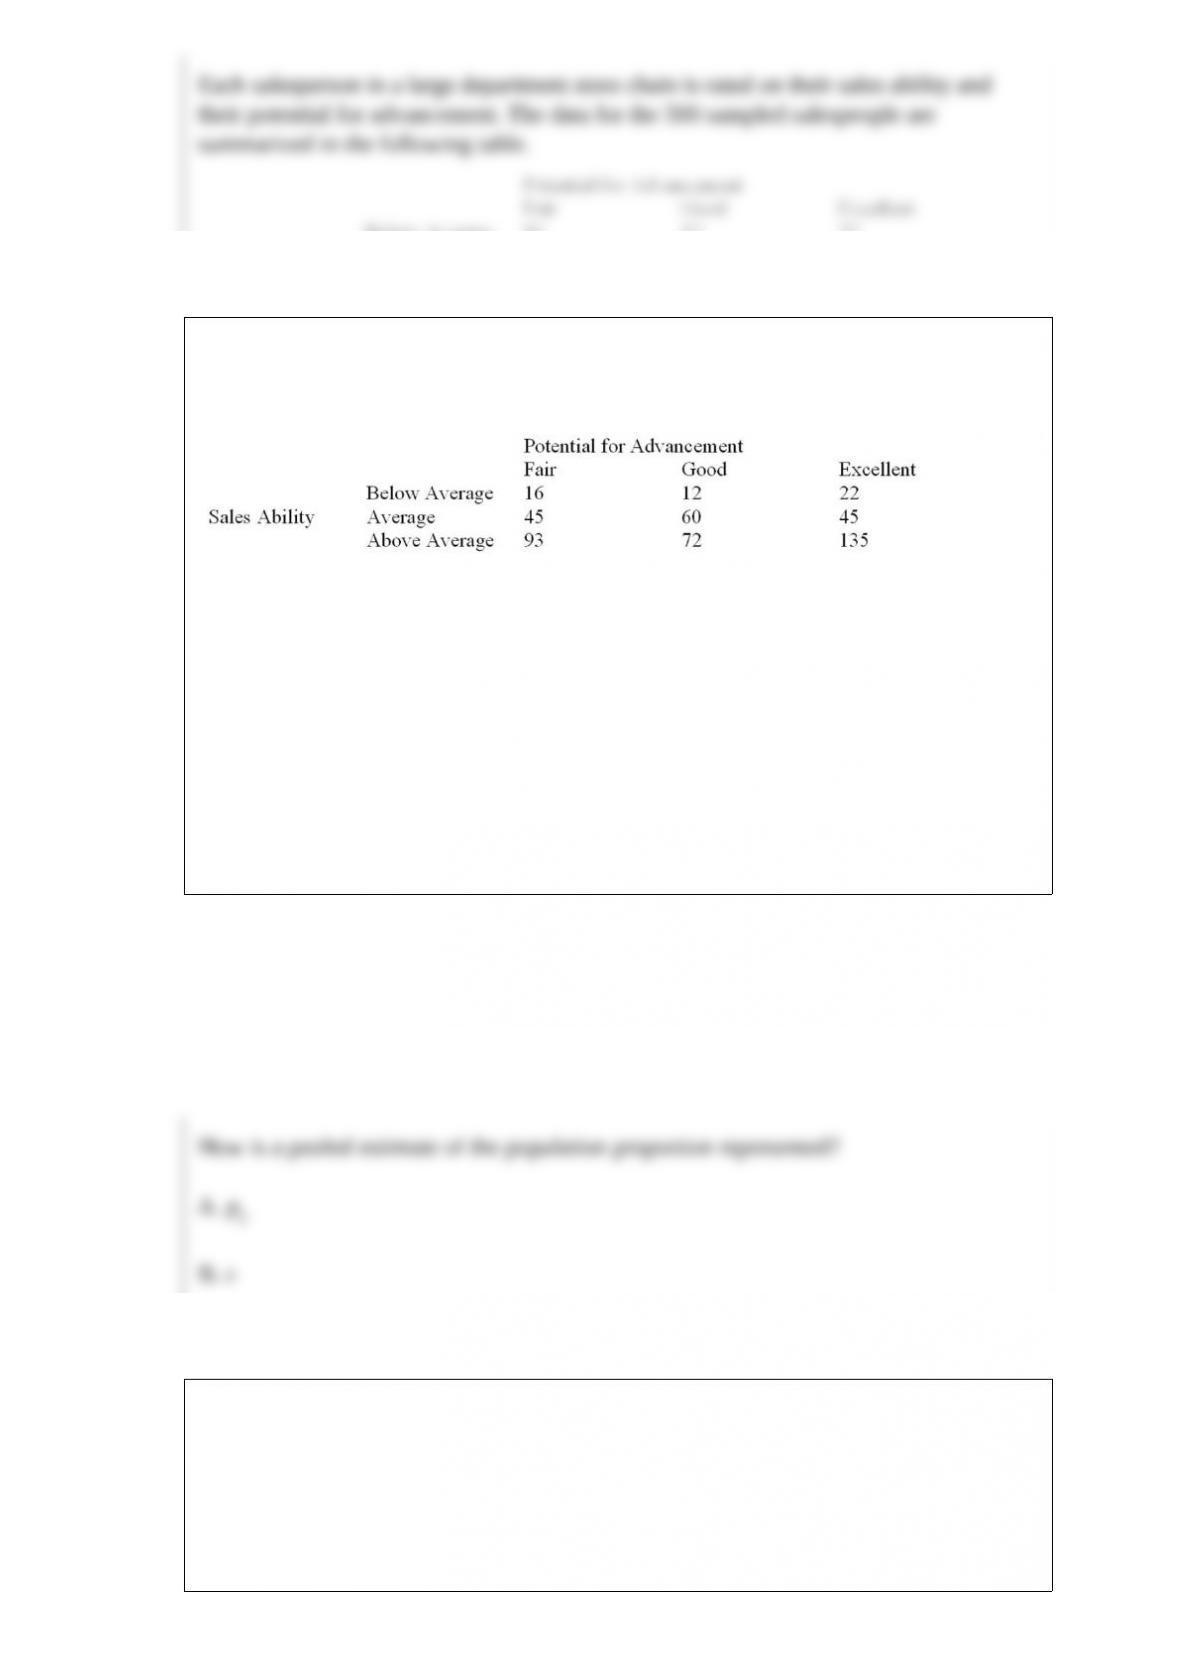
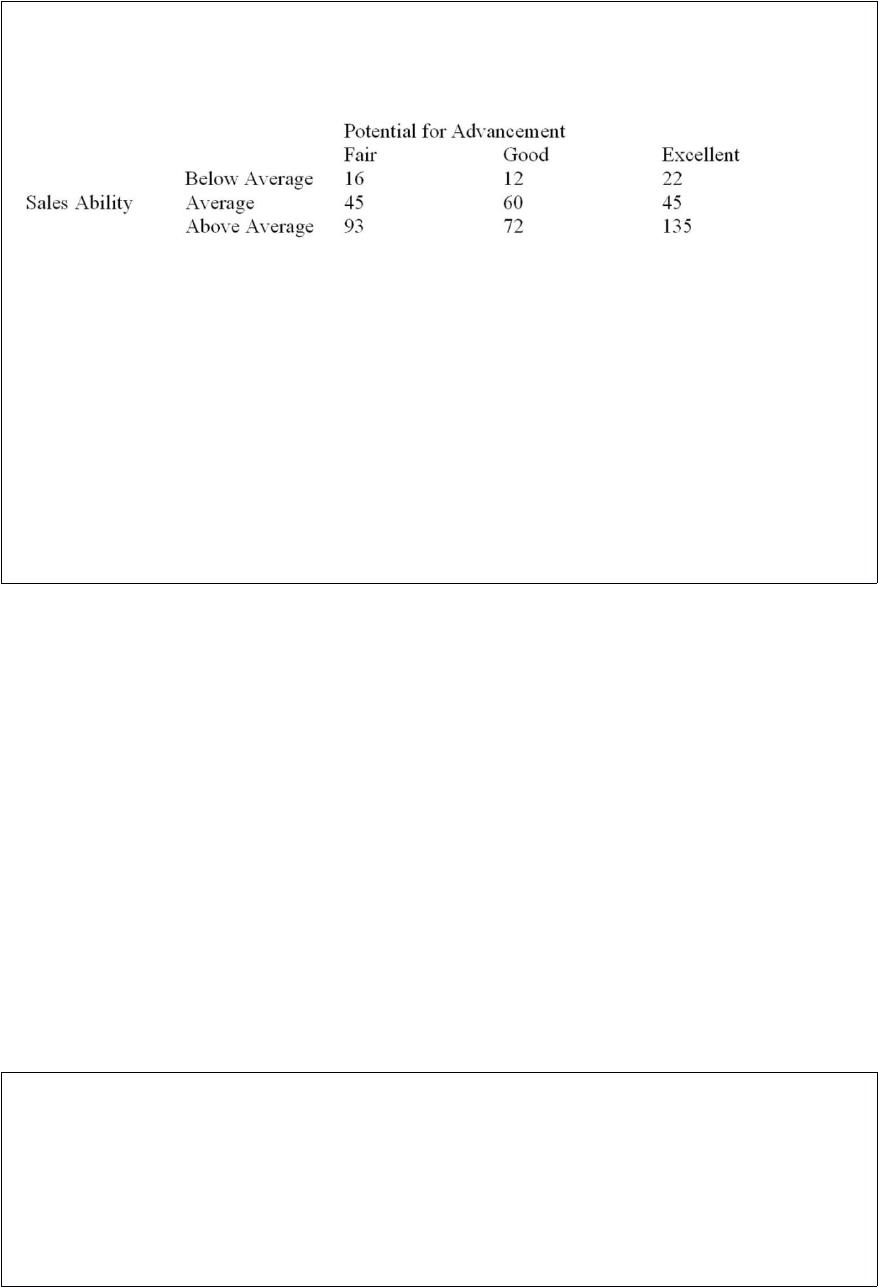
Each salesperson in a large department store chain is rated on their sales ability and
their potential for advancement. The data for the 500 sampled salespeople are
summarized in the following table.
What is the probability that a salesperson selected at random will have below average
sales ability and fair potential for advancement?
A. 0.032
B. 0.10
C. 0.16
D. 0.32
How is a pooled estimate of the population proportion represented?
A. pc
B. z

C. π
D. nπ
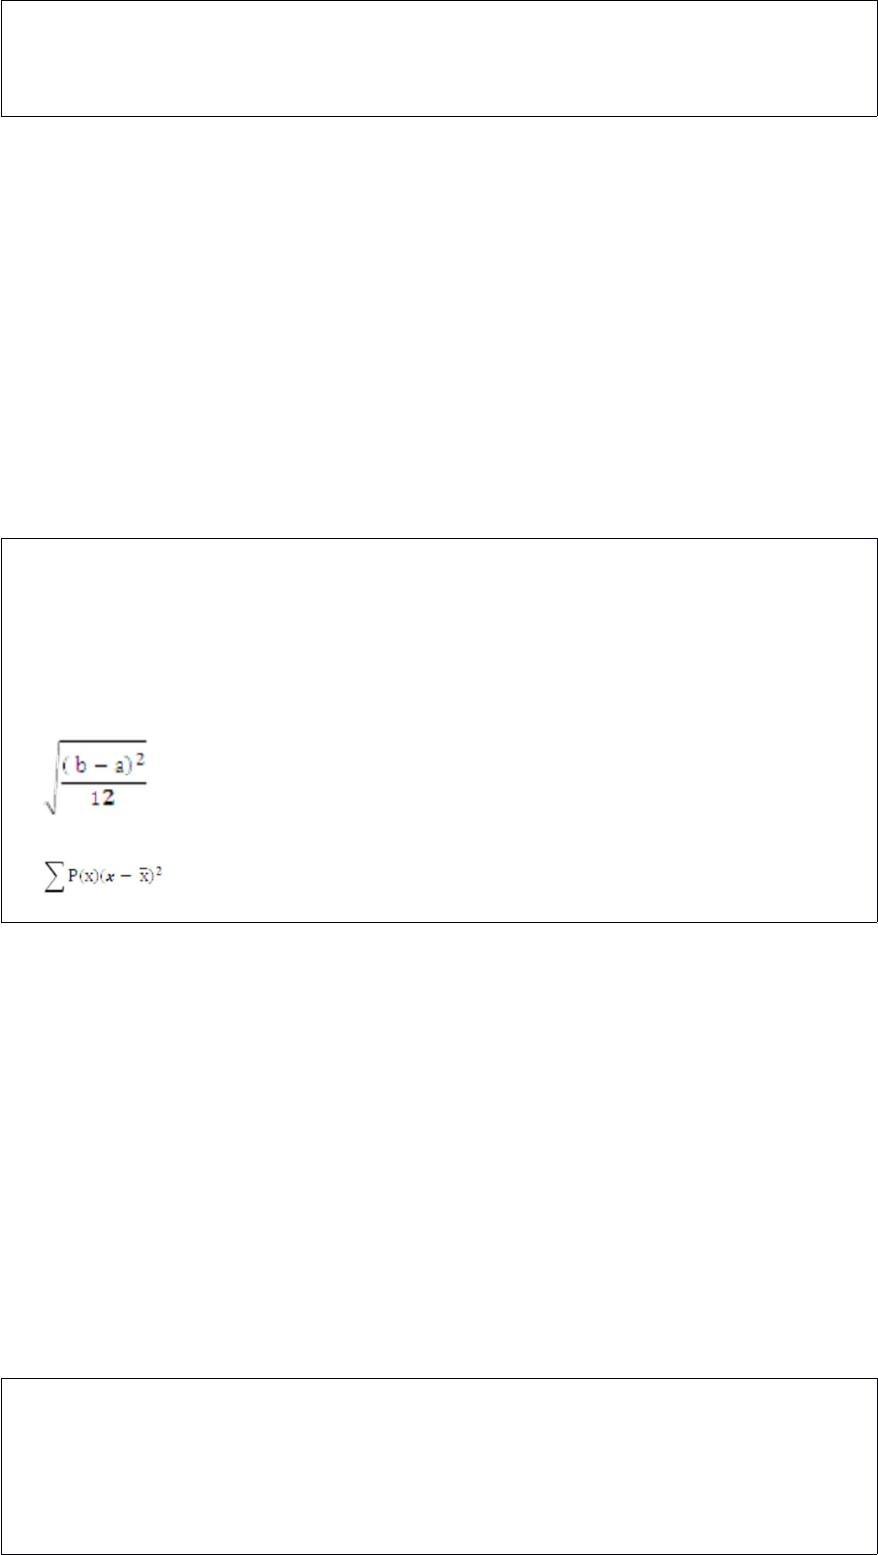
The standard deviation of any uniform probability distribution is ____________.
A. (b – a)/2
B. n(1 – π)
C.
D.
To determine if a set of ungrouped, raw data is normally distributed, the cumulative
relative frequency distribution of the raw data is compared to a ____________.
A. Grouped relative frequency distribution

B. Cumulative normal distribution
C. Anderson-Darling statistic
D. Chi-square statistic
The sample variance of hourly wages was 10. What is the sample standard deviation?
A. $1.96
B. $4.67
C. $3.16
D. $10.00
If we reject the null hypothesis, H0: , what can we conclude about the population
correlation coefficient?
A. It is zero.


B. It could be zero.
C. It is not zero.
D. It equals the computed sample correlation.
All other things being held constant, what is the change in the dependent variable for a
unit change in X1 for the multiple regression equation: Ŷ = 5.2 + 6.3X1 – 7.1 X2?
A. -7.1
B. +6.3
C. +5.2
D. +4.4
According to the central limit theorem, _______________.
A. Sample size is important when the population is not normally distributed
B. Increasing sample size decreases the dispersion of the sampling distribution
C. The sampling distribution of the sample means is uniform
D. The sampling distribution of the sample means will be skewed
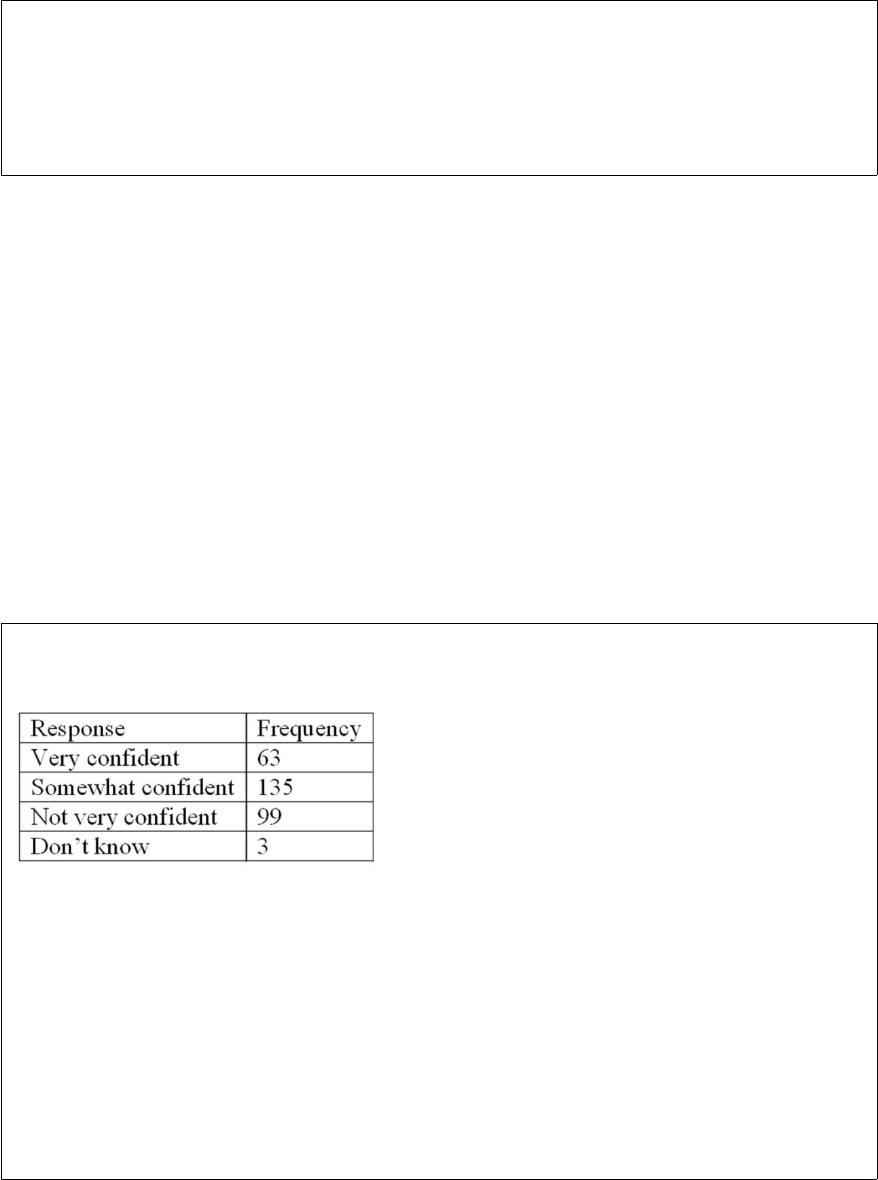
Refer to the following breakdown of responses to a survey of “How confident are you
that you saved enough to retire?”
What percent of the responses indicated that users were very confident?
A. 63%
B. 21%
C. 45%
D. 33%

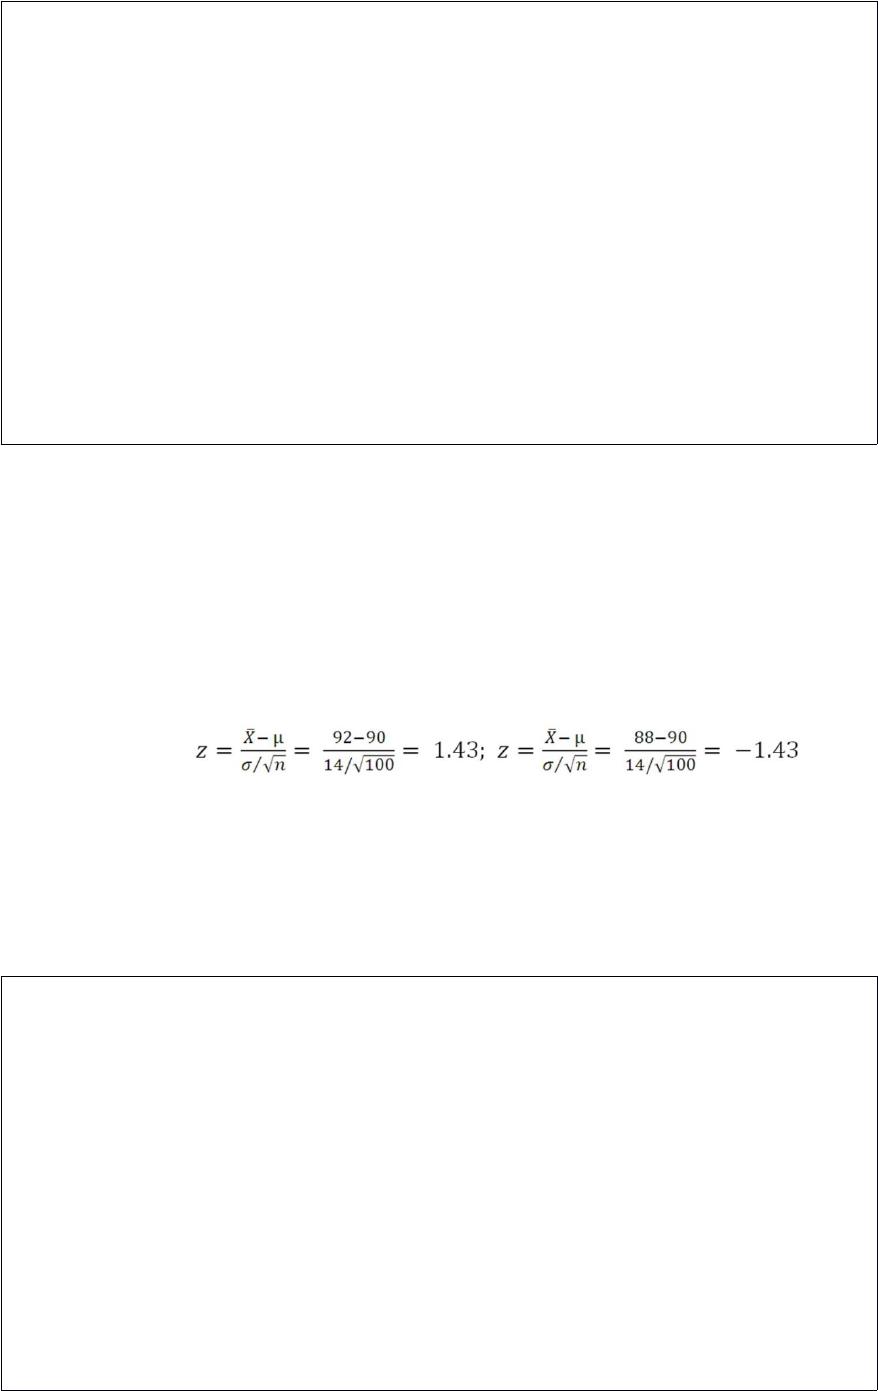
Bones Brothers & Associates prepare individual tax returns. Over prior years, Bones
Brothers has maintained careful records regarding the time to prepare a return. The
mean time to prepare a return is 90 minutes and the standard deviation of this
distribution is 14 minutes. Suppose 100 returns from this year are selected and analyzed
regarding the preparation time. What is the probability that the mean time for the
sample of 100 returns is between 88 minutes and 92 minutes?
A. Approximately 1
B. 0.1664
C. 0.8336
D. 0.8472
The mean annual incomes of certified welders are normally distributed with the mean
of $50,000 and a standard deviation of $2,000. The ship building association wishes to
find out whether their welders earn more or less than $50,000 annually. The alternate
hypothesis is that the mean is not $50,000. If the level of significance is 0.10, what is
the critical value?
A. +1.645
B. -1.282
C. 1.282
D. 1.645

A box plot shows ___________.
A. The mean and variance
B. The relative symmetry of a distribution for a set of data
C. The 10th and 90th percentiles of a distribution
D. The deciles of a distribution
The tread life of tires mounted on light-duty trucks follows the normal probability
distribution with a mean of 60,000 miles and a standard deviation of 4,000 miles.
Suppose we select a sample of 40 tires and use a simulator to determine the tread life.
What is the standard error of the mean?
A. 632.46
B. 40
C. 4000
D. Cannot be determined.


Suppose we test H0: π1 = π2 at the 0.05 level of significance. If the z-test statistic is
-1.07, what is our decision?
A. Reject the null hypothesis.
B. Do not reject the null hypothesis.
C. Take a larger sample.
D. Reserve judgment.
Which of the following is correct about a probability distribution?
A. The sum of all possible outcomes must equal 1.0.
B. Outcomes must be mutually exclusive.
C. The probability of each outcome must be between 0.0 and 1.0 inclusive.
D. All apply.

The tread life of tires mounted on light duty trucks follows the normal probability
distribution with a mean of 60,000 miles and a standard deviation of 4,000 miles.
Suppose you bought a set of four tires, what is the likelihood the mean tire life of these
four tires is more than 66,000 miles?
A. 0.0013
B. 0.9987
C. 0.4987
D. 0.9544
A sample of 250 adults tried the new multigrain cereal “Wow!” A total of 187 rated it as
excellent. In a sample of 100 children, 66 rated it as excellent. Using the 0.1
significance level, the researcher wishes to show that adults like the cereal better than
children. Which of the following is the alternate hypothesis?
A. H1: πA = πC
B. H1: πA < πC
C. H1: πA > πC


D. H1: πA ≠ πC
In a regression analysis, three independent variables are used in the equation based on a
sample of 40 observations. In the ANOVA table for a multiple regression analysis, what
are the degrees of freedom associated with the F-statistic?
A. 3 and 39
B. 4 and 40
C. 3 and 36
D. 2 and 39
Which statistic is used to test a global hypothesis about a multiple regression equation?

A. t-statistic
B. z-statistic
C. Χ2 (chi-square statistic)
D. F
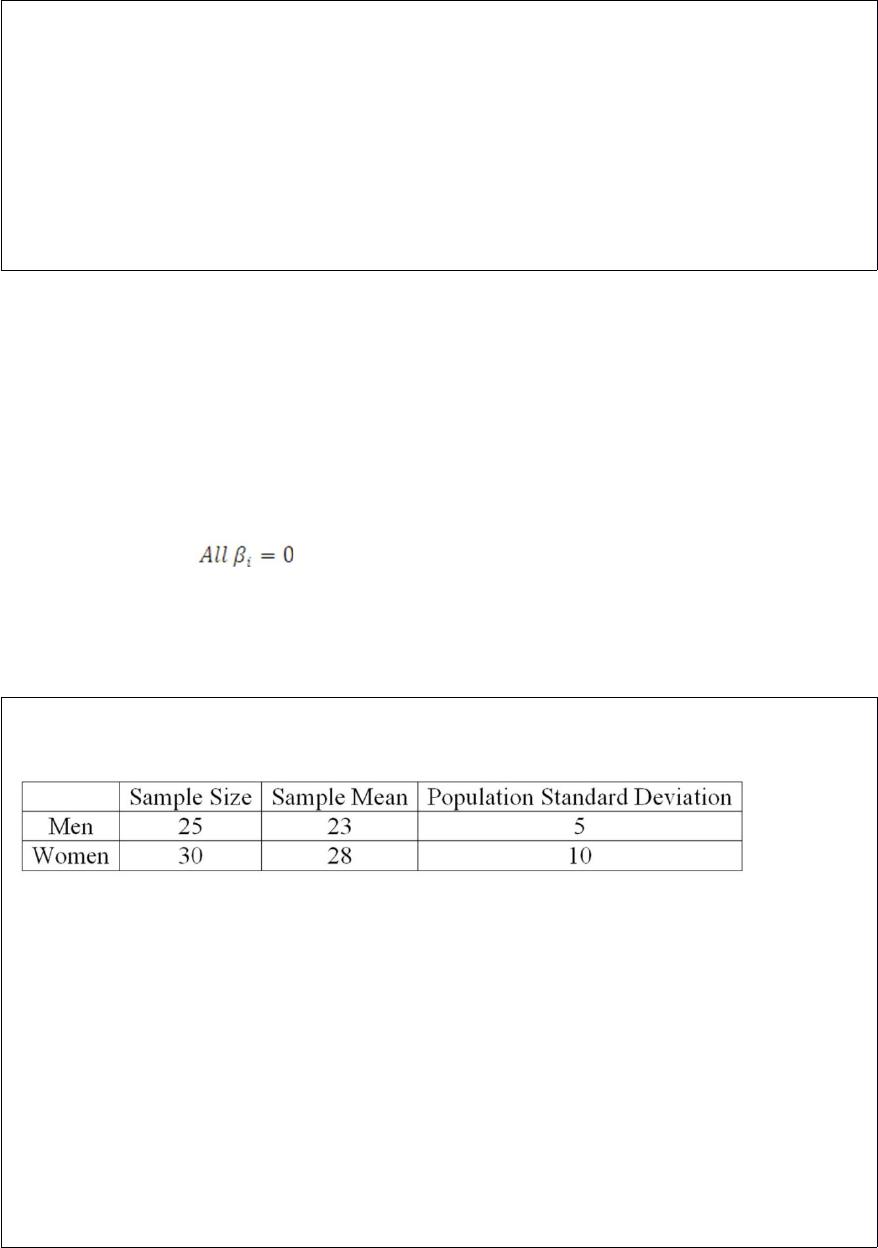
A recent study focused on the number of times men and women send a Twitter message
in a day. The information is summarized next.
At the .01 significance level, is there a difference in the mean number of times men and
women send a Twitter message in a day? Based on the p-value, what is your
conclusion?
A. Reject the null hypothesis and conclude the means are different.
B. Reject the null hypothesis and conclude the means are the same.
C. Fail to reject the null hypothesis.
D. Fail to reject the null hypothesis and conclude the means are different.
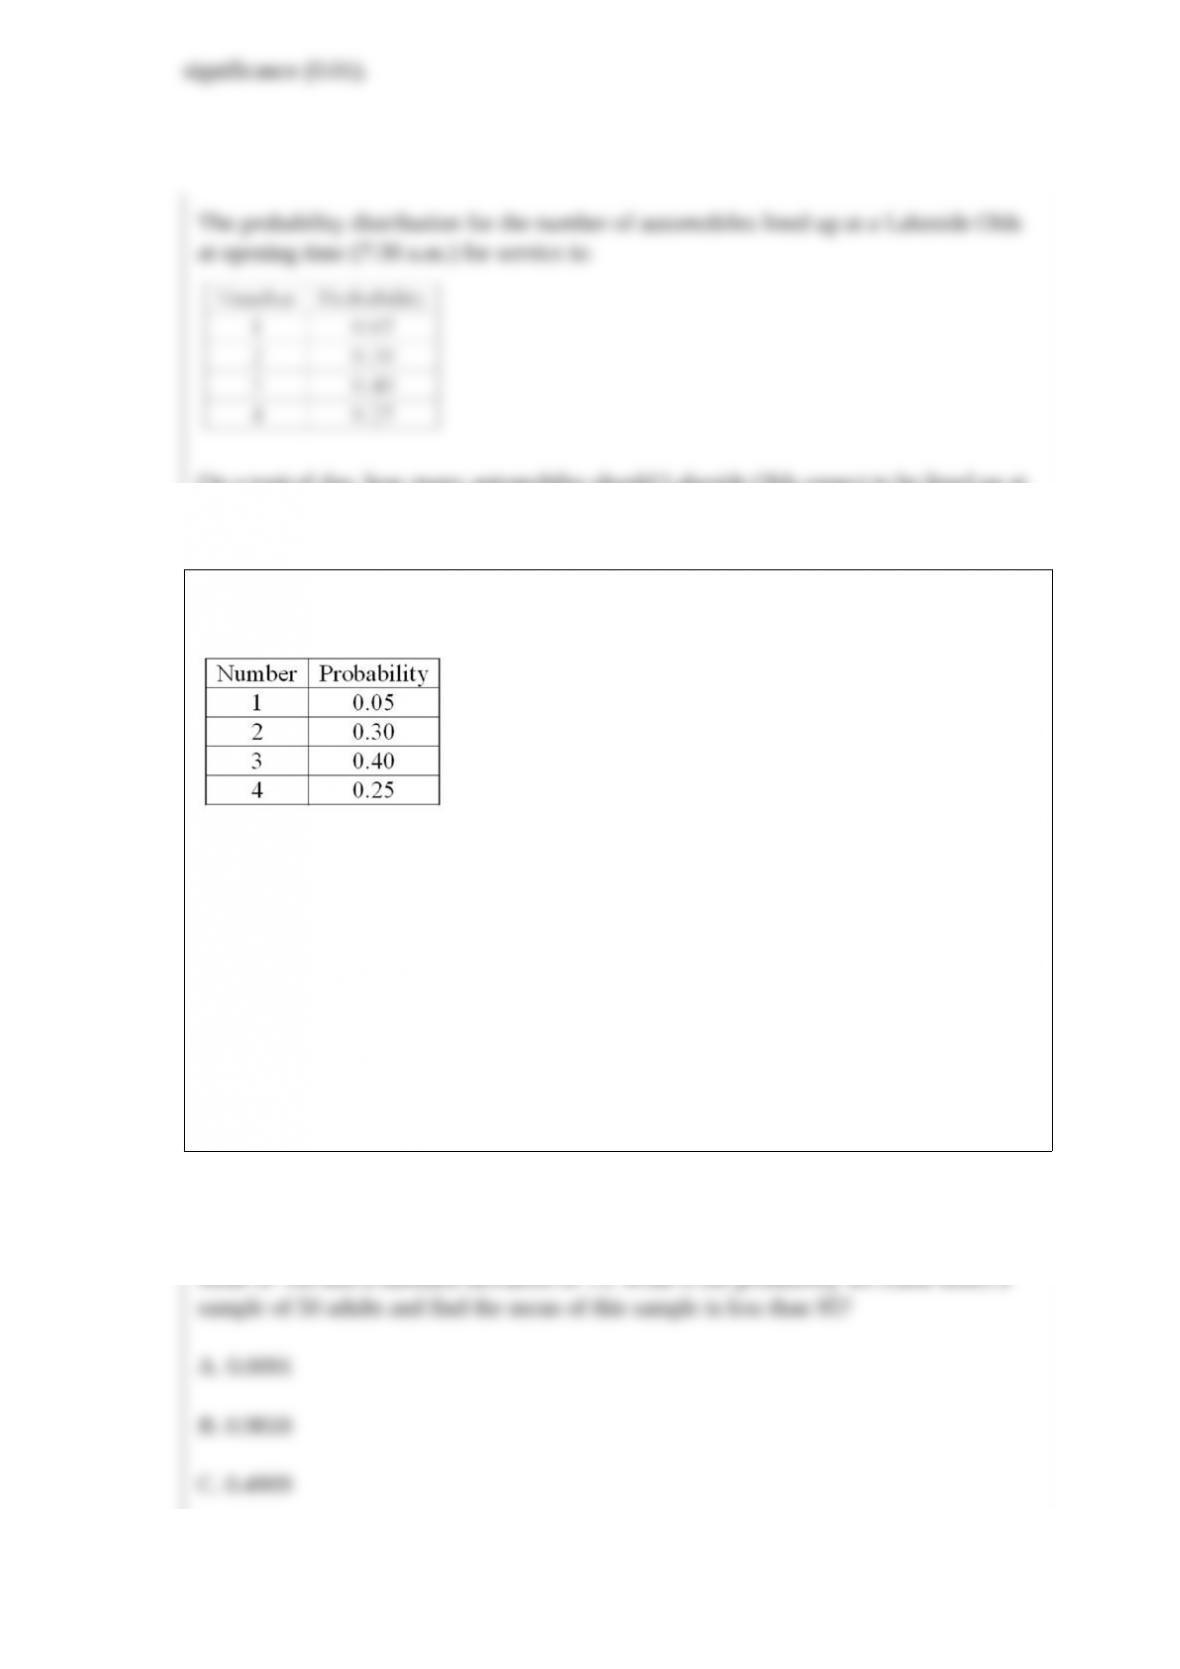
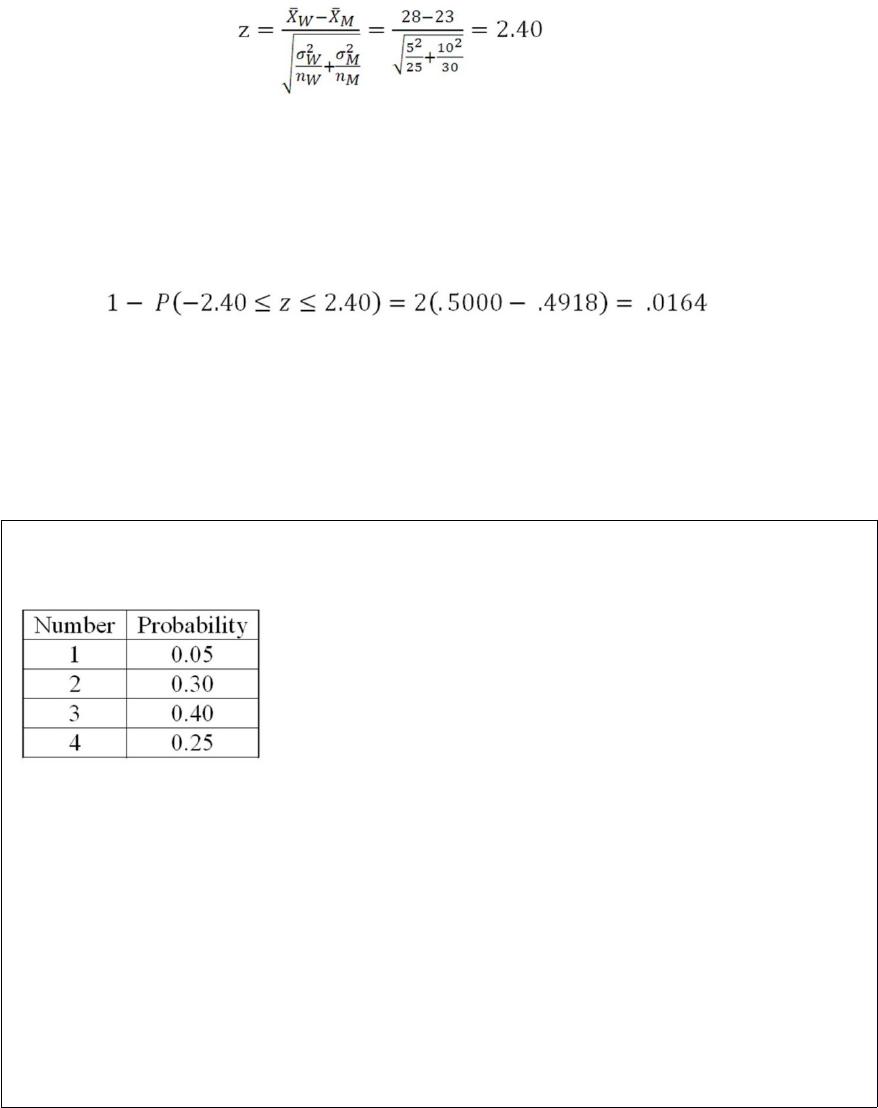
The probability distribution for the number of automobiles lined up at a Lakeside Olds
at opening time (7:30 a.m.) for service is:
On a typical day, how many automobiles should Lakeside Olds expect to be lined up at
opening time?
A. 10.00
B. 1.00
C. 2.85
D. 1.96

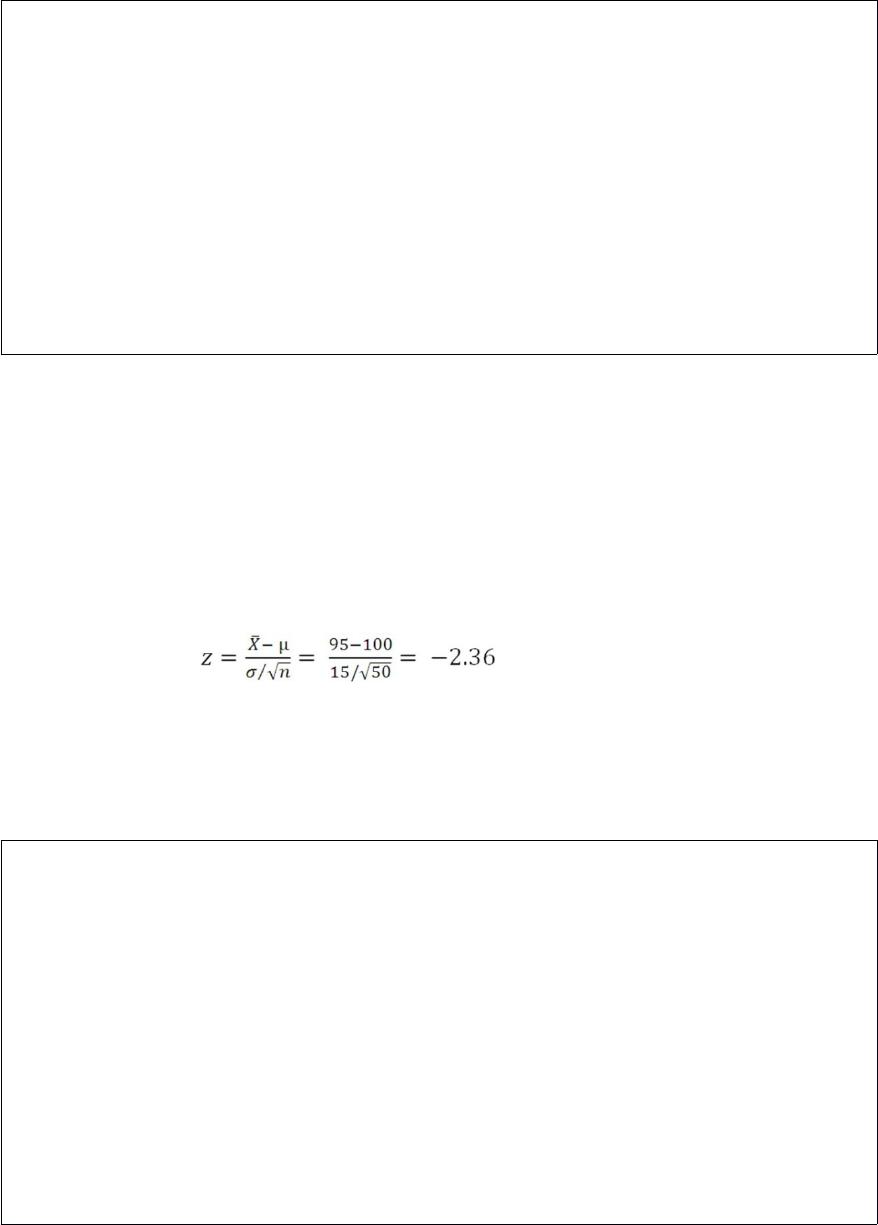
The Intelligence Quotient (IQ) test scores for adults are normally distributed with a
mean of 100 and a standard deviation of 15. What is the probability we could select a
sample of 50 adults and find the mean of this sample is less than 95?
A. 0.0091
B. 0.9818
C. 0.4909
D. 0.9544
The distribution of a sample of the outside diameters of PVC pipes approximates a
symmetrical, bell-shaped distribution. The arithmetic mean is 14.0 inches, and the
standard deviation is 0.1 inches. About 68% of the outside diameters lie between what
two amounts?
A. 13.5 and 14.5 inches
B. 13.0 and 15.0 inches
C. 13.9 and 14.1 inches
D. 13.8 and 14.2 inches
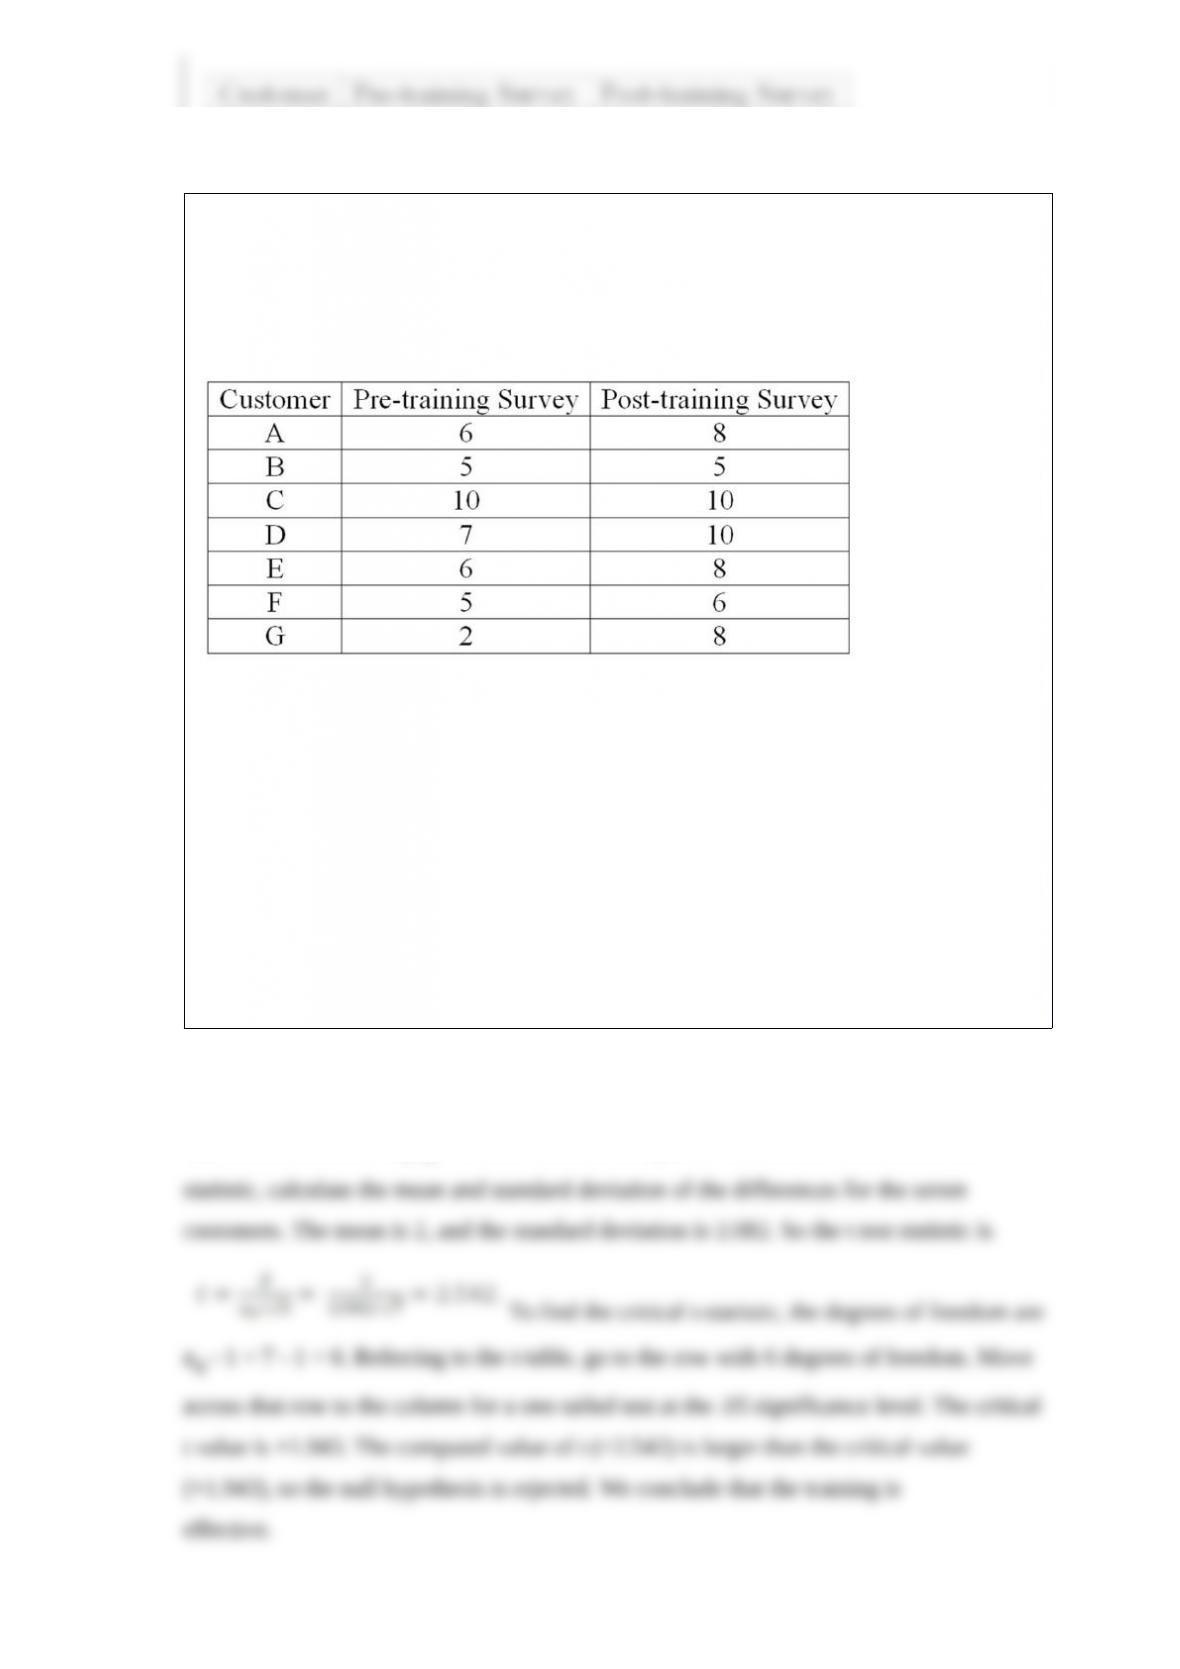
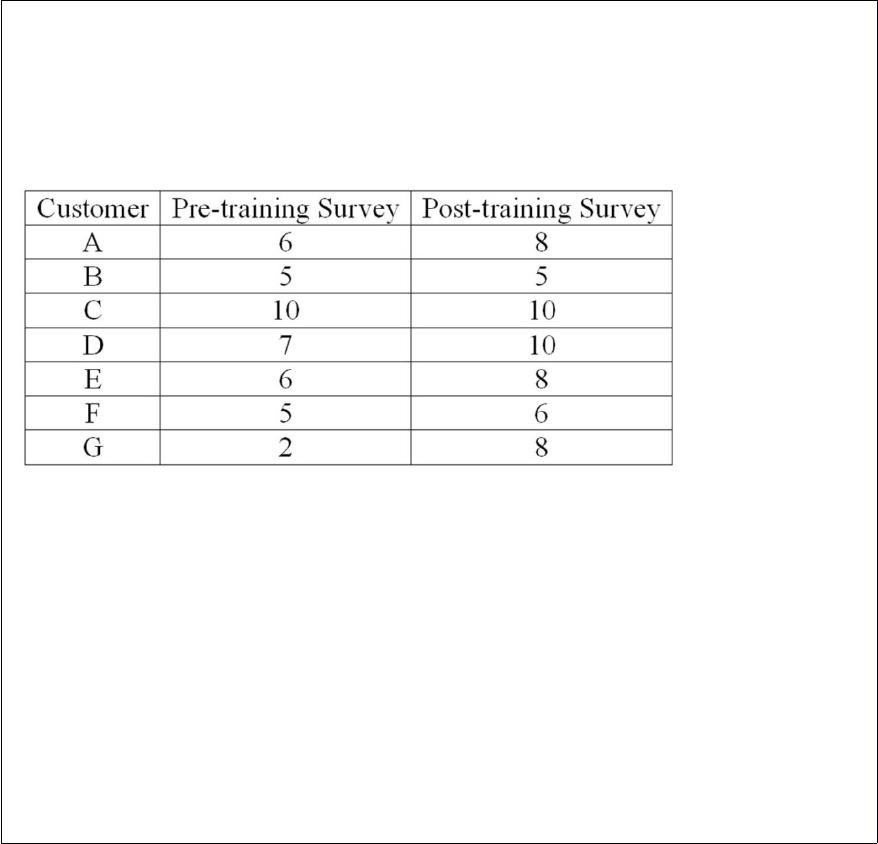
An investigation of the effectiveness of a training program to improve customer
relationships included a pre-training and post-training customer survey. To compare the
differences they computed (post-training survey score – pre-training survey score).
Seven customers were randomly selected and completed both surveys. The results
follow.
For a 0.05 significance level, what is the decision regarding the hypothesis that the
training was effective in improving customer relationships?
A. Reject the null hypothesis and conclude that the training was effective.
B. Reject the null hypothesis and conclude that the training was ineffective.
C. Fail to reject the null hypothesis and conclude that mean survey scores are the same.
D. Fail to reject the null hypothesis and conclude that the mean survey scores are not
equal.


In a frequency distribution, the number of observations in a class is called the class
________.
A. Midpoint
B. Interval
C. Array
D. Frequency
The weights (in thousands of kilograms) of seven shipping containers are 9.5, 10.3,
11.0, 10.4, 10.5, 11.2, and 9.2. What is the mean deviation?
A. 0.543 kg
B. 0.625 kg
C. 0.53 kg
D. 5.50 kg


Define the level of significance.
A. It is the probability of a Type II error.
B. It is the probability of a Type I error.
C. It is a z value of 1.96.
D. It is the beta error.
Which of the following is true in a normal distribution?
A. The mean equals zero.
B. The mode and the third quartile are equal.
C. The mean divides the distribution into two equal areas.
D. The area under the curve is 0.68.

A listing of all possible outcomes of an experiment and their corresponding
probabilities of occurrence is called a ____________.
A. Random variable
B. Probability distribution
C. Subjective probability
D. Frequency distribution
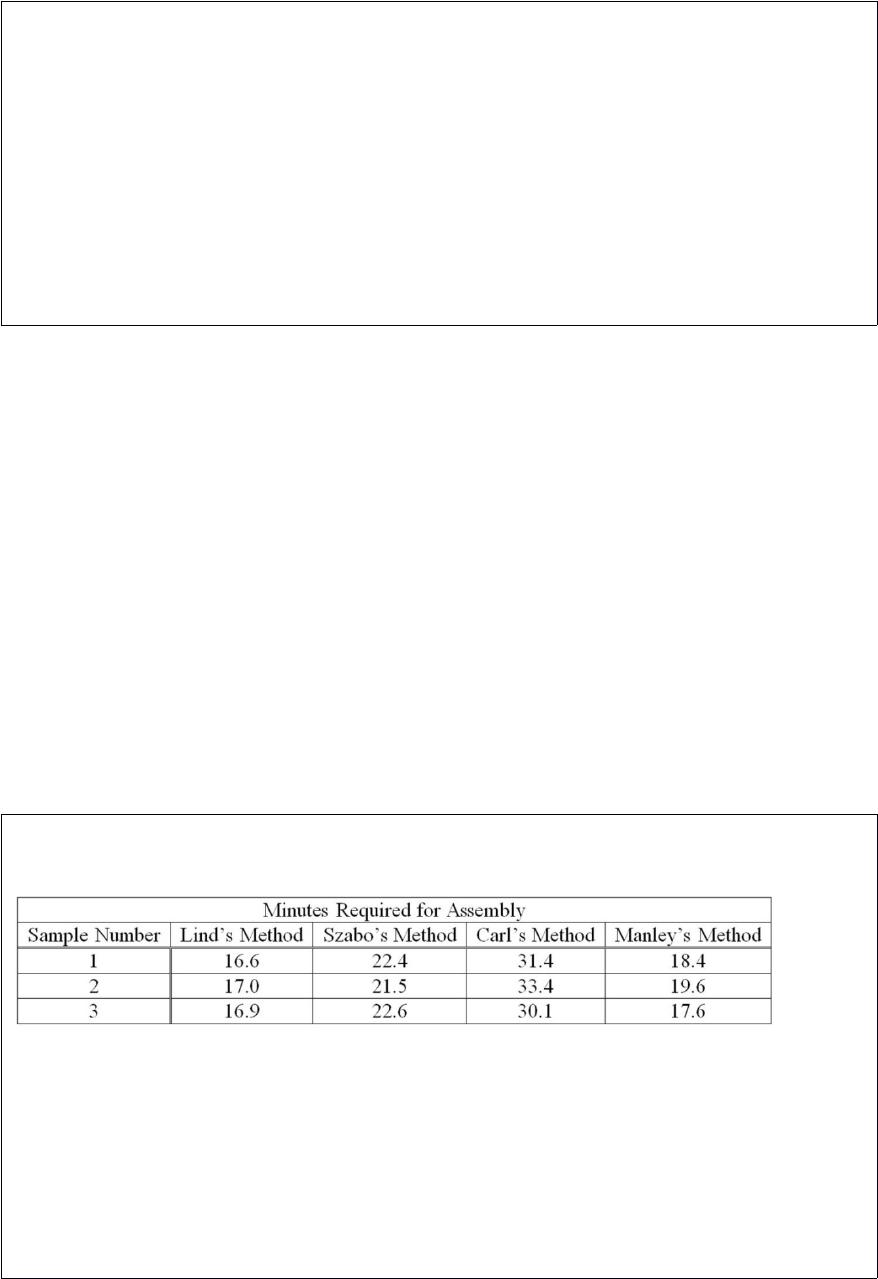
Several employees have submitted different methods of assembling a subassembly.
Sample data for each method are:
How many treatments are there?
A. 3
B. 4
C. 12


D. 0
In a management trainee program, 80% of the trainees are female, 20% male. A total of
90% of the females attended college, while 78% of the males attended college. A
management trainee is selected at random. What is the probability that the person
selected is a male who did NOT attend college?
A. 0.044
B. 0.440
C. 0.256
D. 0.801
The formula to convert any normal distribution for a random variable, x, to the standard
normal distribution is ____________.


A binomial probability distribution approaches a greater degree of symmetry as the
probability of success remains constant and the number of trials becomes ___________.
A manufacturer claims that less than 1% of all its products do not meet the minimum
government standards. A survey of 500 products revealed that 10 did not meet the
standard. Thus, the alternate hypothesis is ___________________.


According to the Empirical Rule, approximately ___________% of the observations lie
within plus and minus one standard deviation of the mean.
The estimate of the population proportion is to be within plus or minus .10, with a 95%
level of confidence. The best estimate of the population proportion is .25. How large a
sample is required?
A survey of 16 executives showed a mean work time per week of 50 hours, with a
standard deviation of 10 hours. What is the 95% confidence interval for the population
mean?

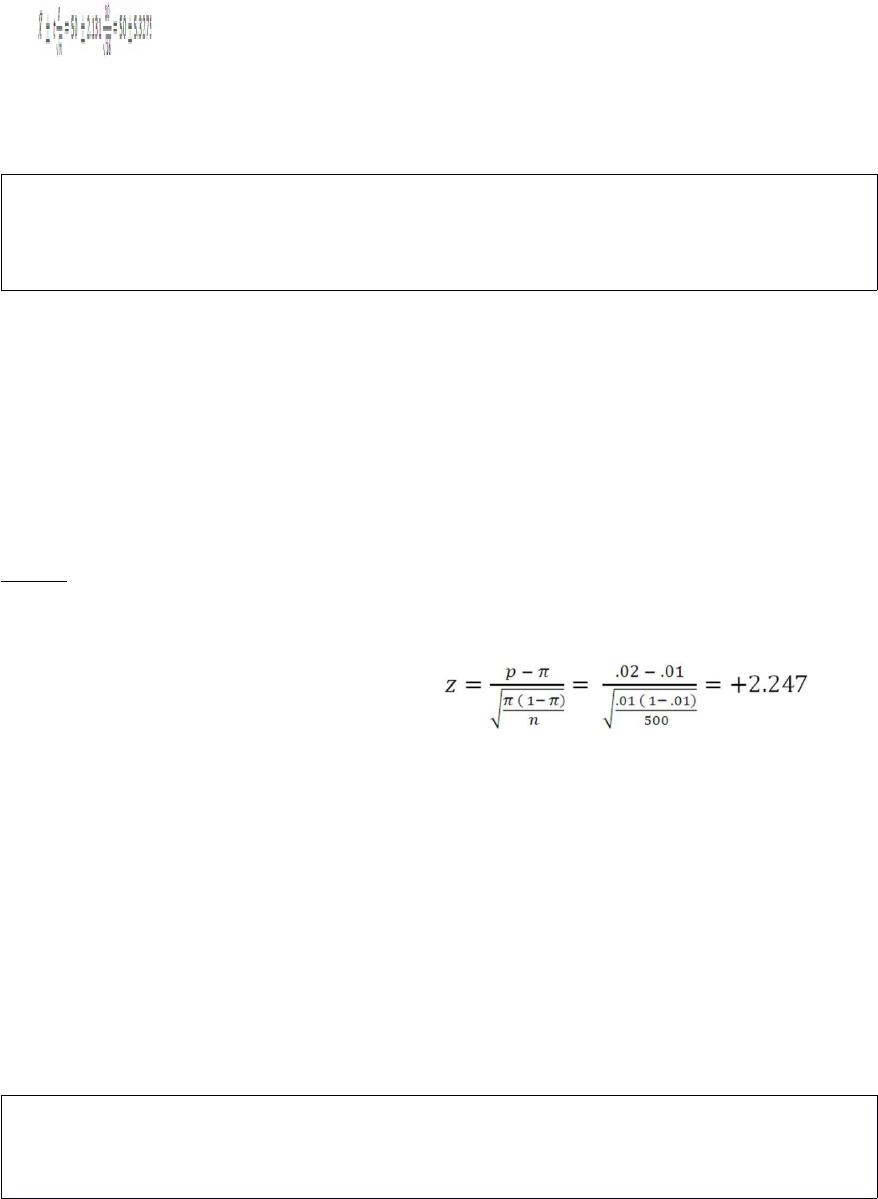
A manufacturer claims that less than 1% of all its products do not meet the minimum
government standards. A survey of 500 products revealed that 10 did not meet the
standard. The p-value is ______________.
Given a multiple linear regression equation, Ŷ = 5.1 + 2.2X1 – 3.5X2 (assuming other
things are held constant), for a unit increase in the independent variable, X2,

will decrease by _______ units.
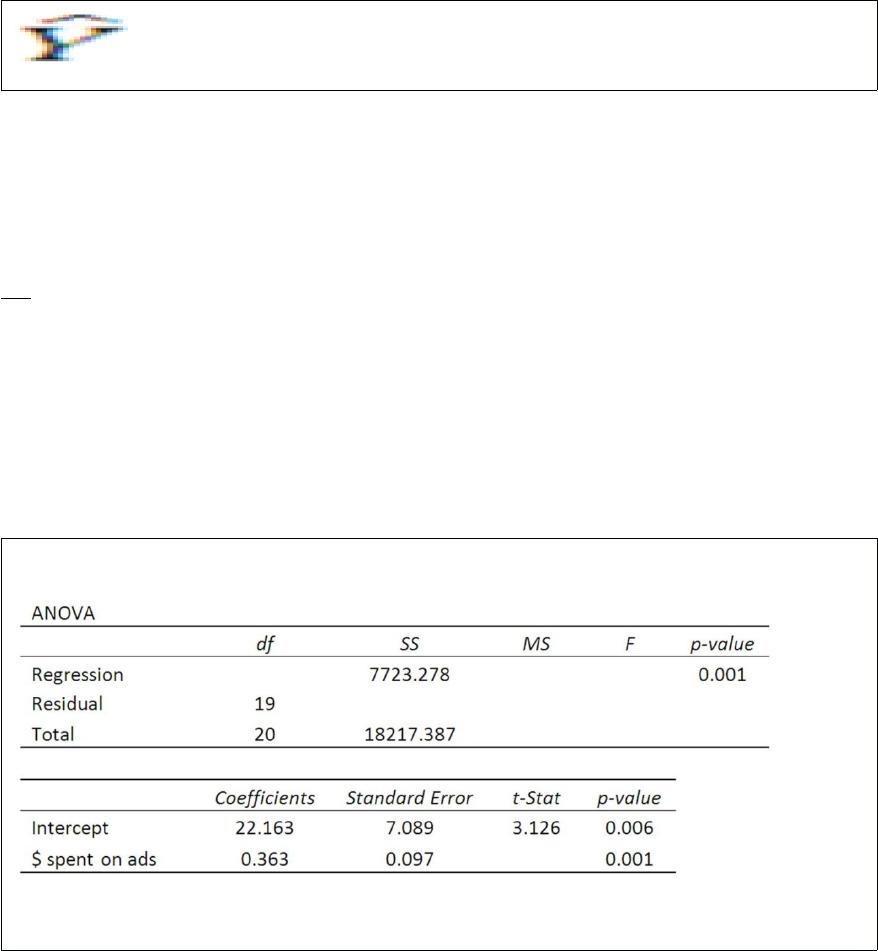
Using the following regression analysis:
What is the regression mean square?
The interquartile range is the distance between ___________.
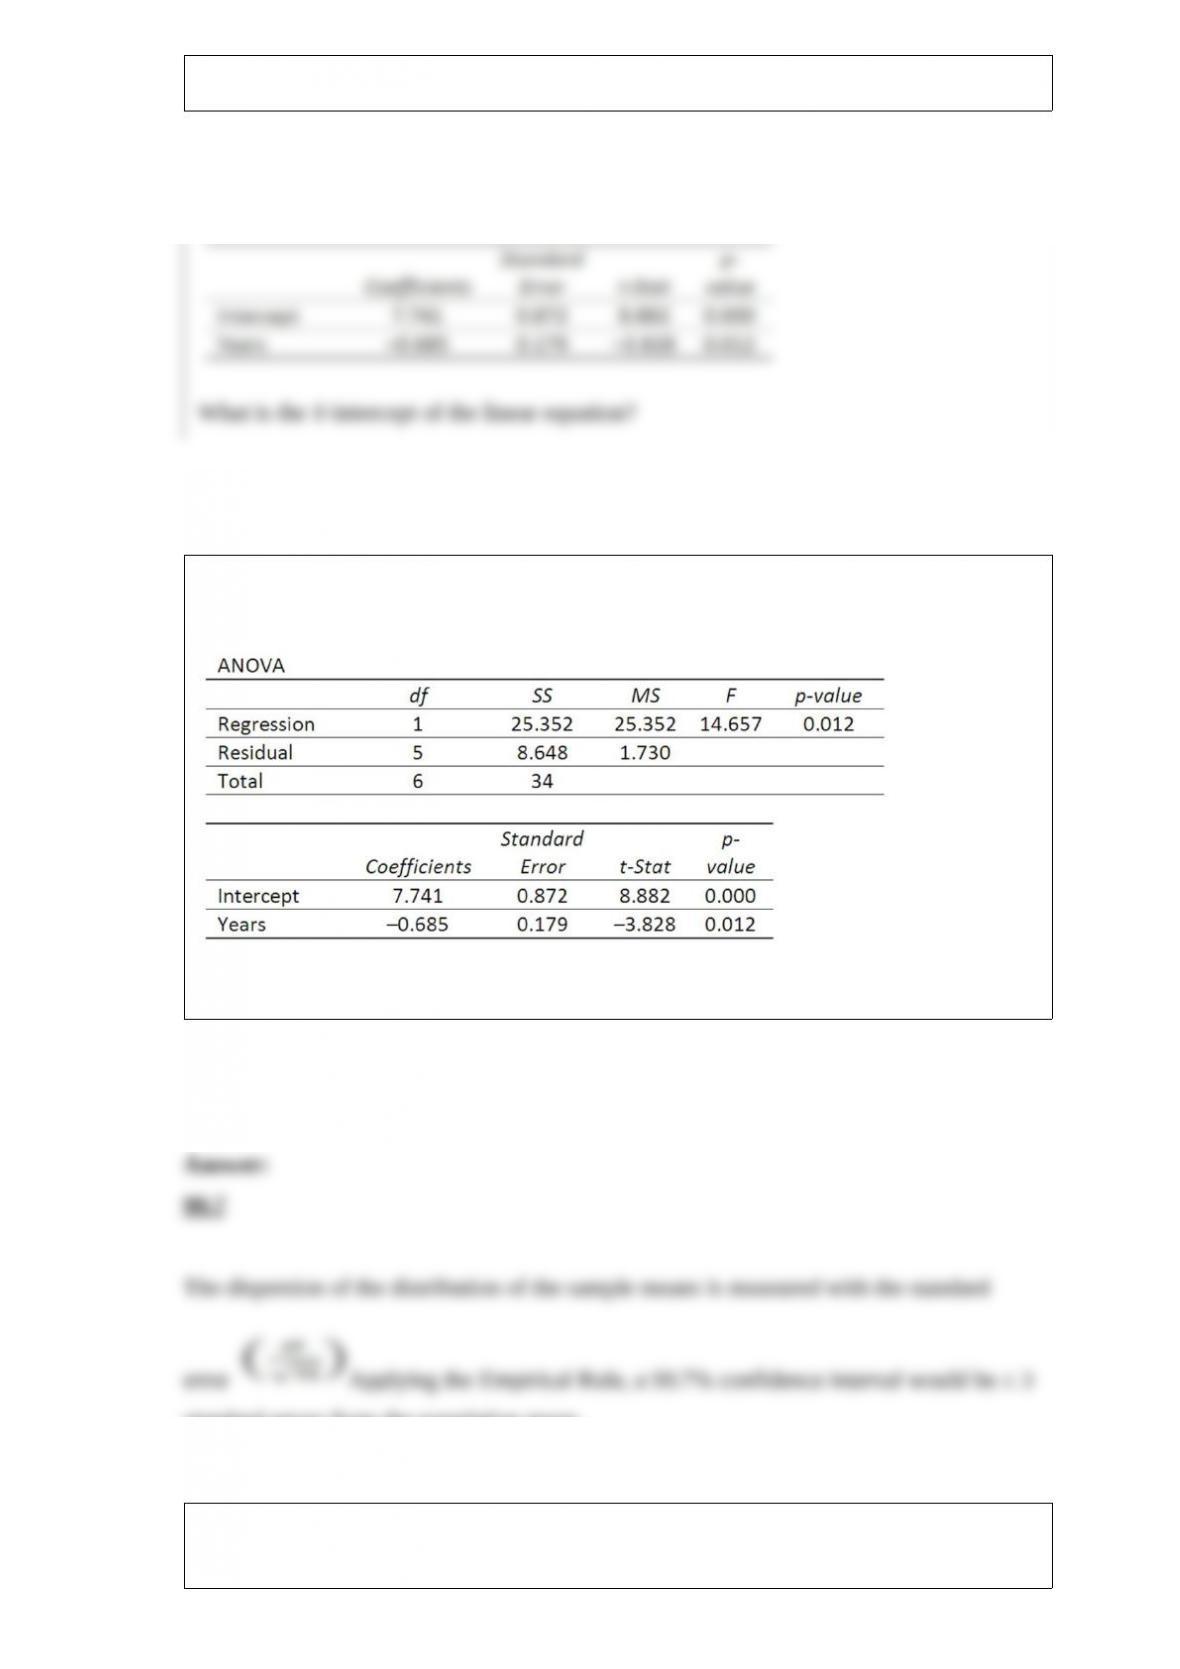
A company wants to study the effect of an employee’s length of employment on their
number of workdays absent. The results of the regression analysis follow.
What is the Y-intercept of the linear equation?
For a distribution of sample means with a known population standard deviation, about
_____ percent of the sample means are within three standard errors of population mean.
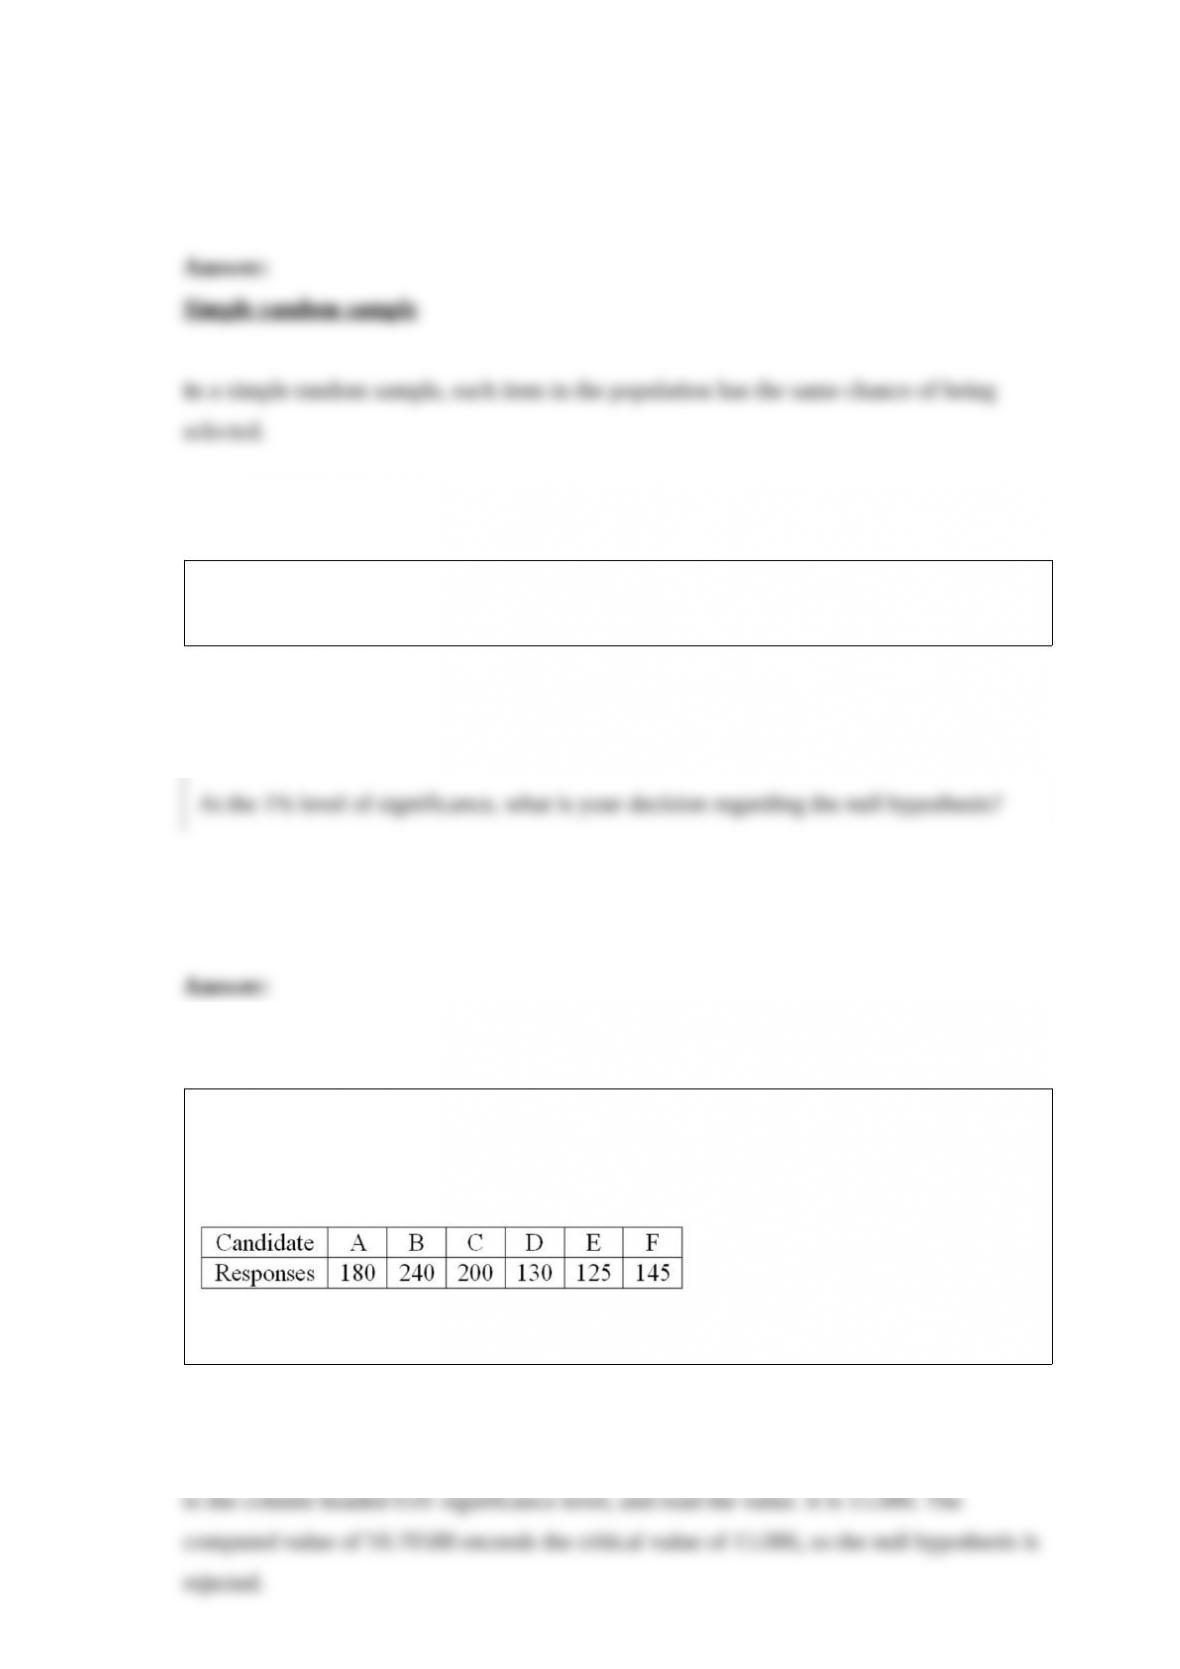
A __________________ assumes that each item or individual in the population has an
equal chance of being included.
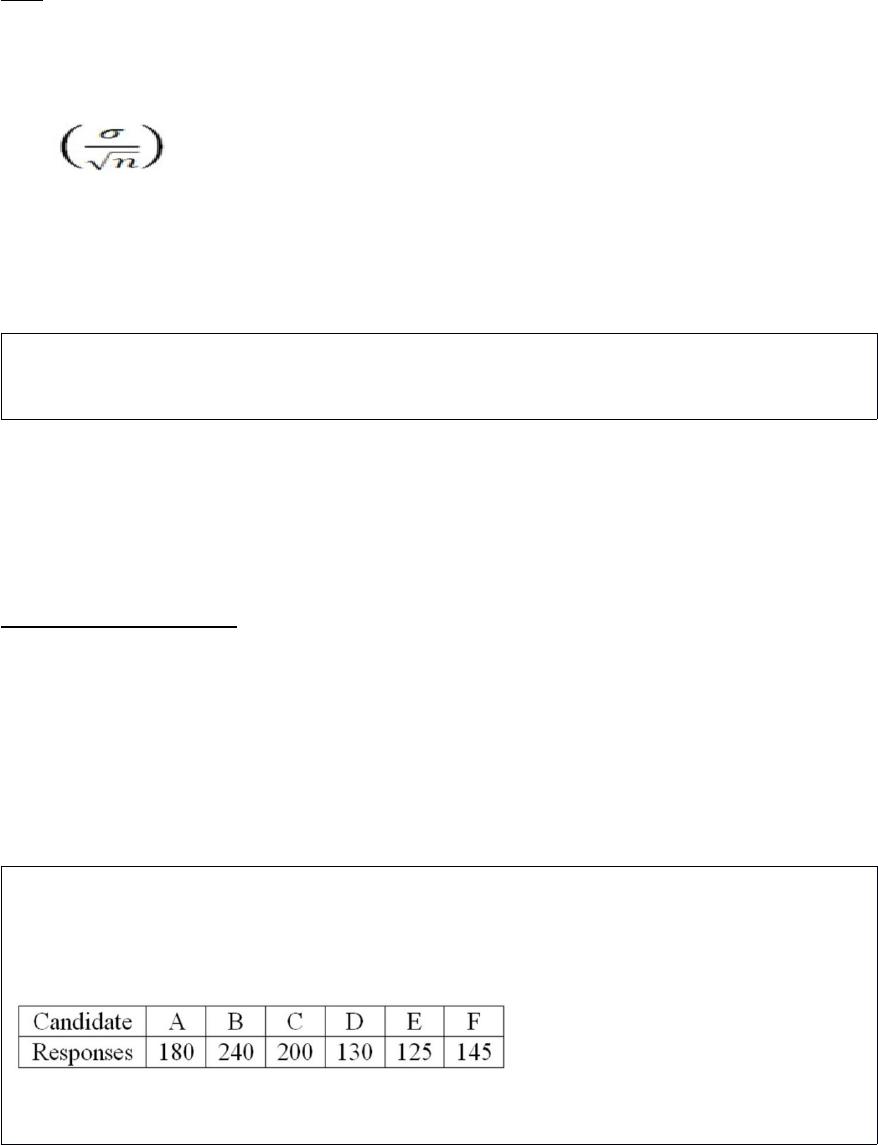
Six people have declared their intentions to run for a seat on the school board in the
next local election. A poll is conducted during the campaign among 1,020 randomly
sampled voters to determine if there is any clear preference among the voters. The
responses are shown next.
At the 1% level of significance, what is your decision regarding the null hypothesis?


A study by a bank compared the mean savings of customers who were depositors for
three years or less with those who had been depositors for more than three years. The
results of a sample are as follows.
What are the similarities and differences between the mean, the median, and the mode?


The following frequency distribution shows the distribution of delivery times (in days)
for swimstuff.com customer orders during the last month.
What is the relative frequency for orders delivered in less than three days?
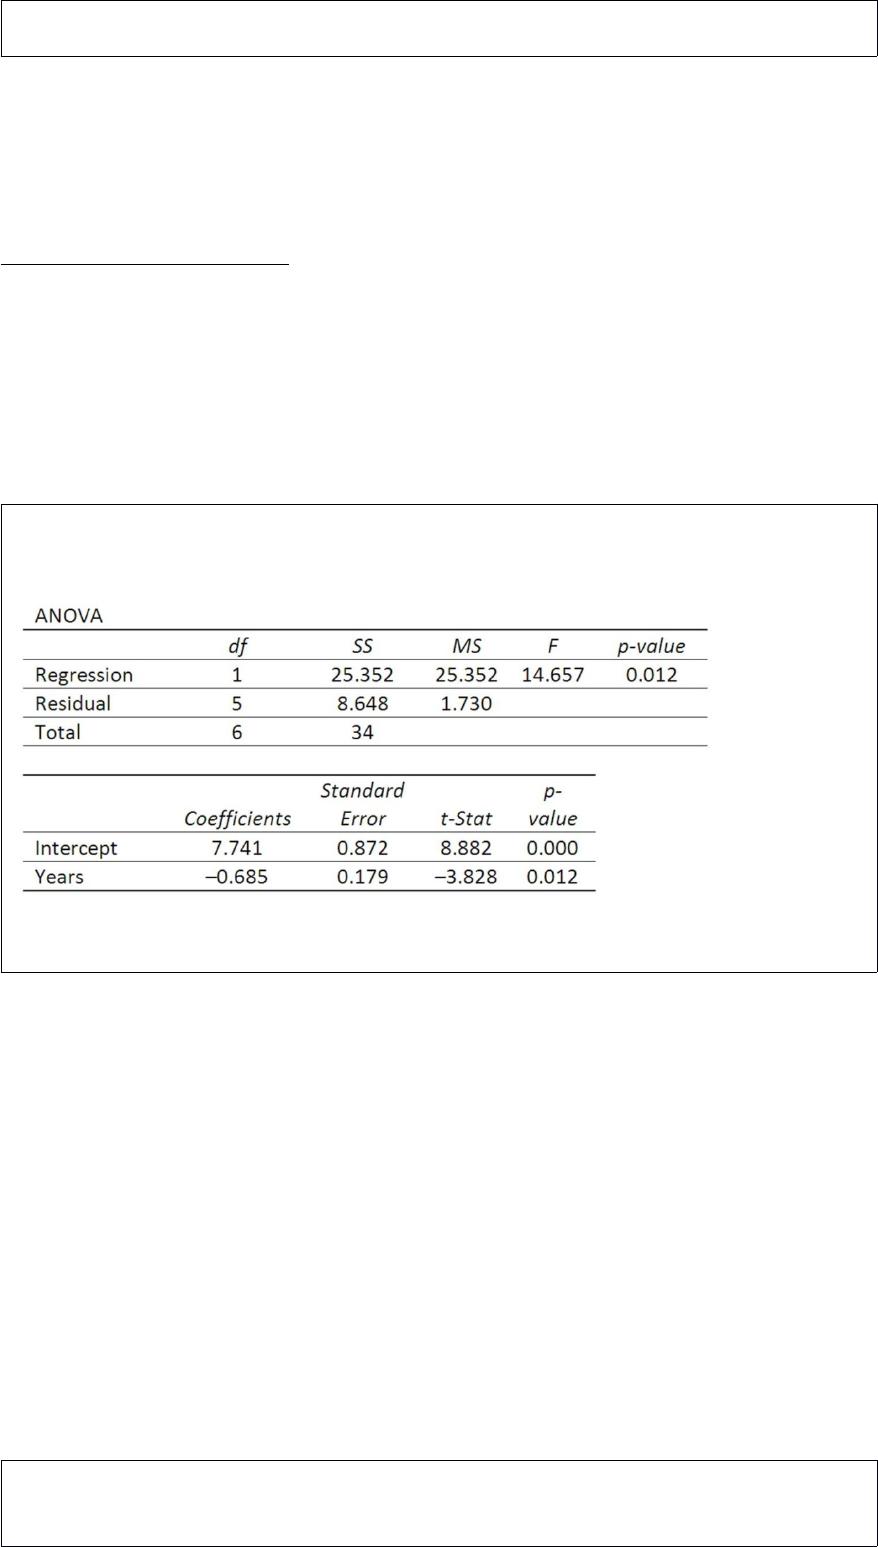
A company wants to study the effect of an employee’s length of employment on their
number of workdays absent. The results of the regression analysis follow.
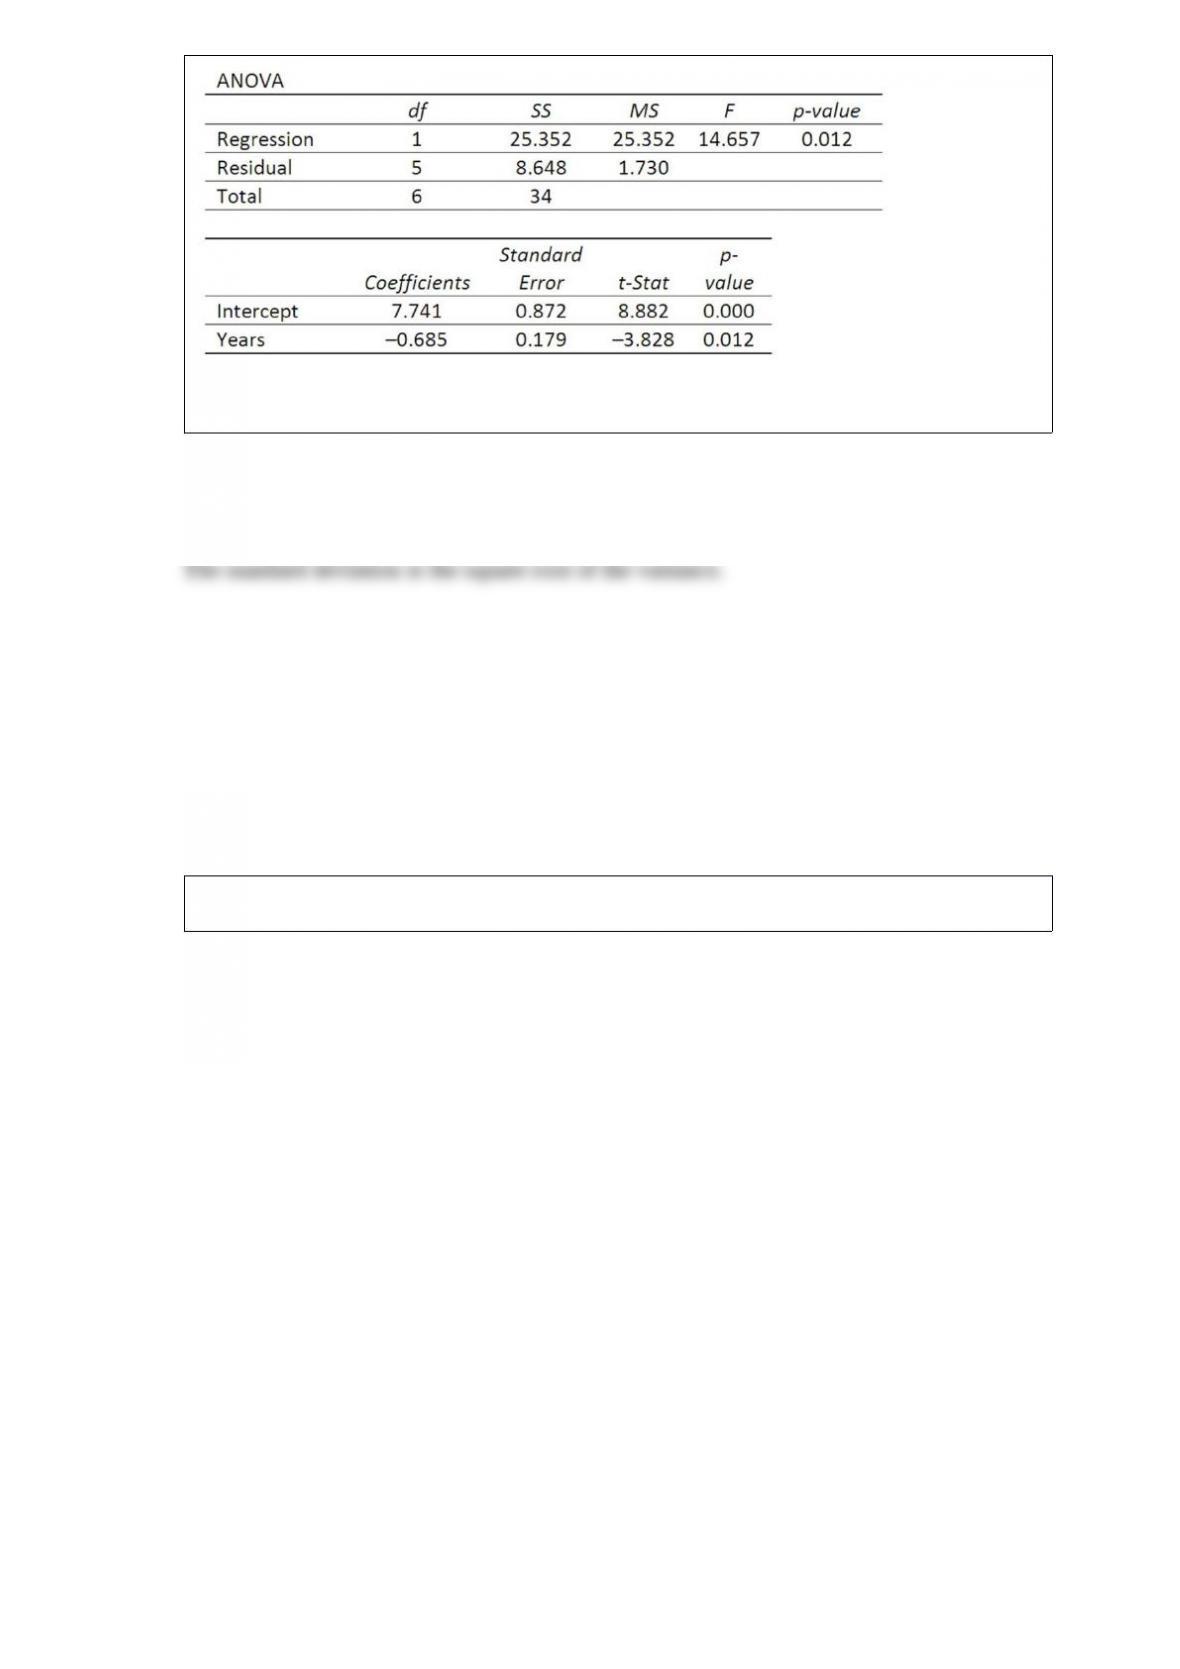
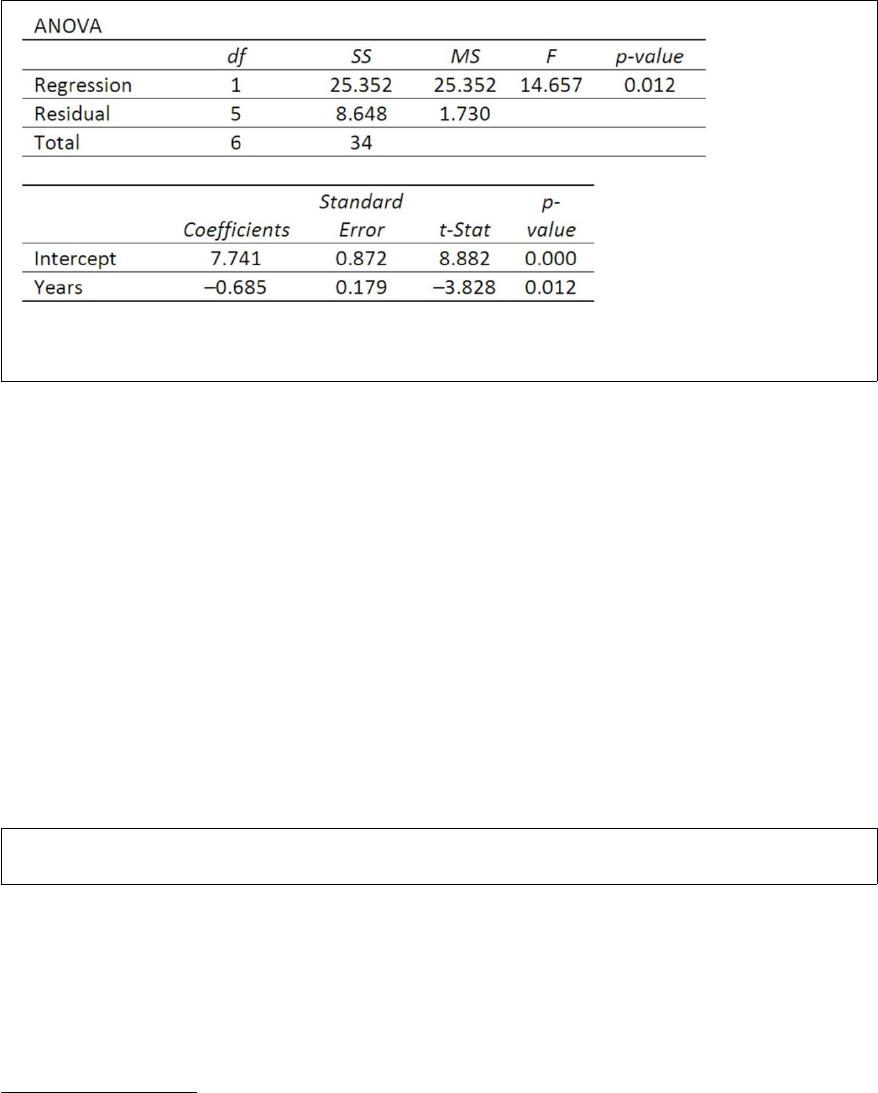
What is the least squares equation?
The square root of the variance is called the ______.