Taking a larger sample size will always result in less sampling error but costs more
money and takes more time.
If a sample is selected using random sampling methods, the primary reason that the
sample mean might be different from the corresponding population mean is that the
sample might be biased.
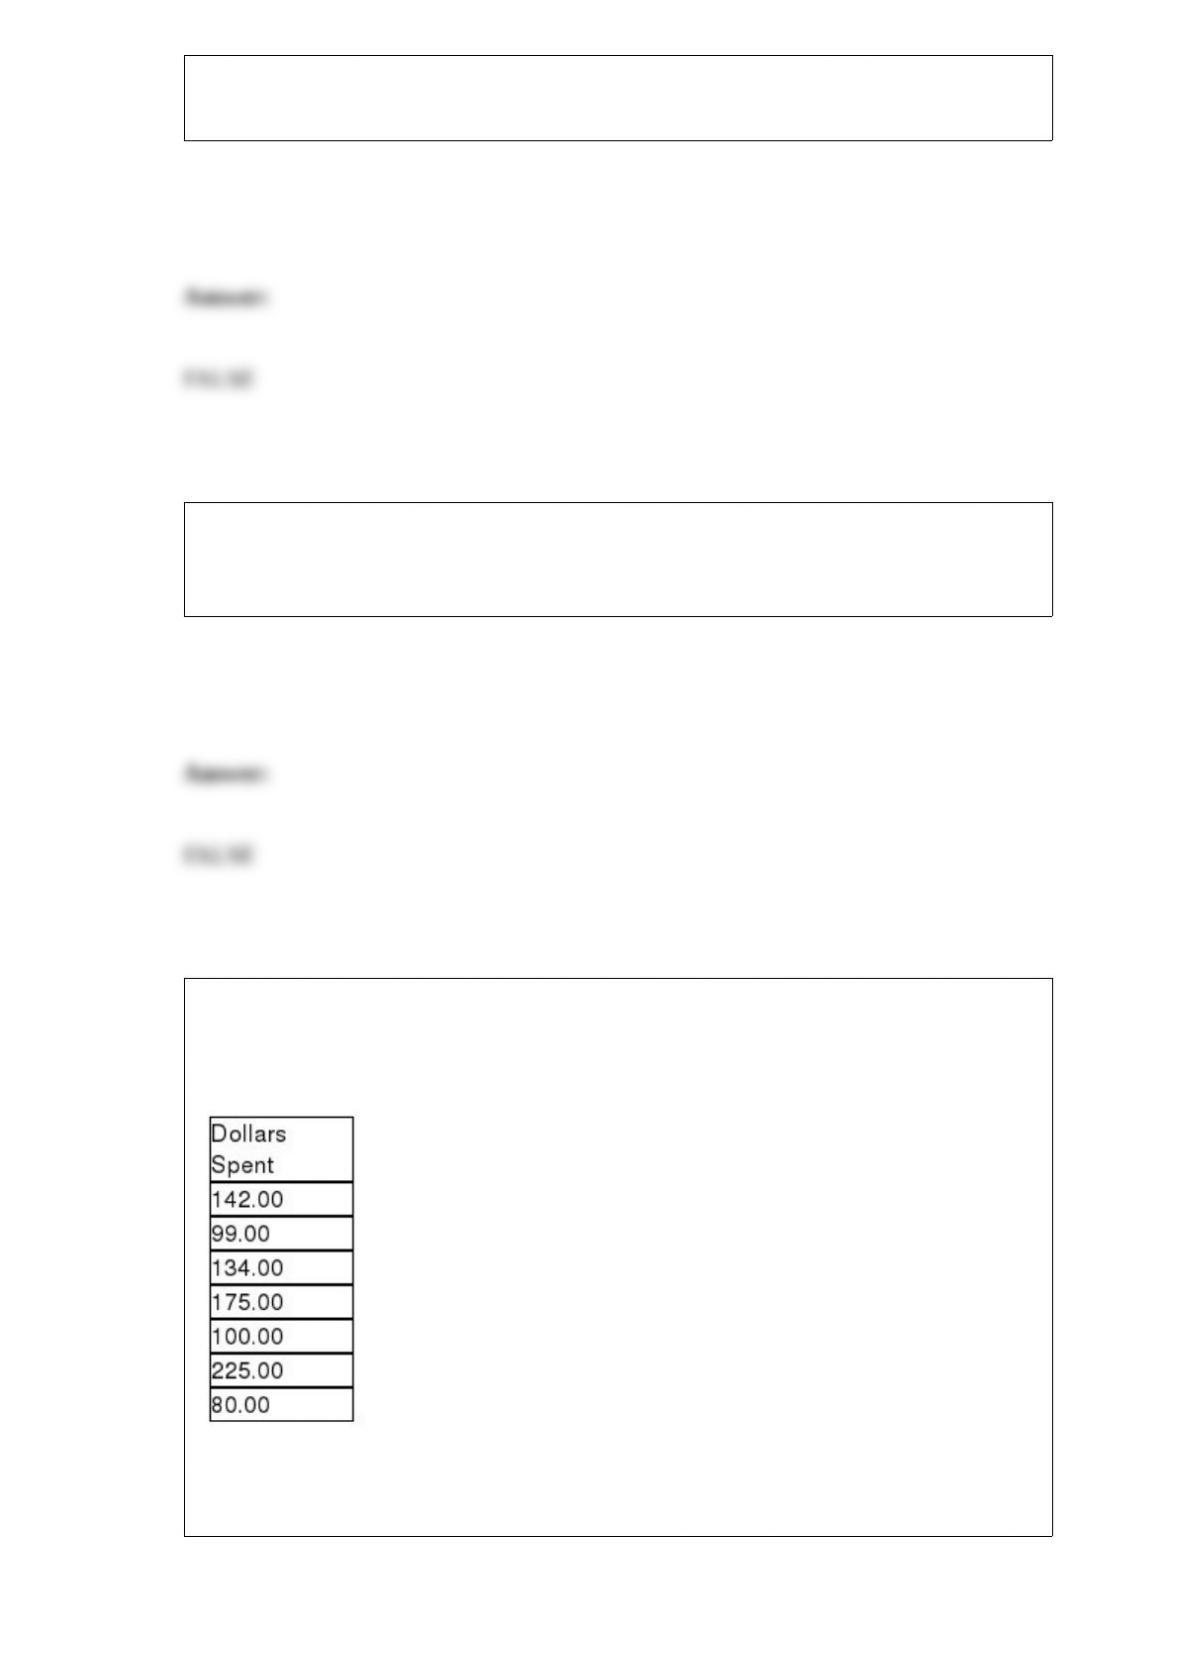
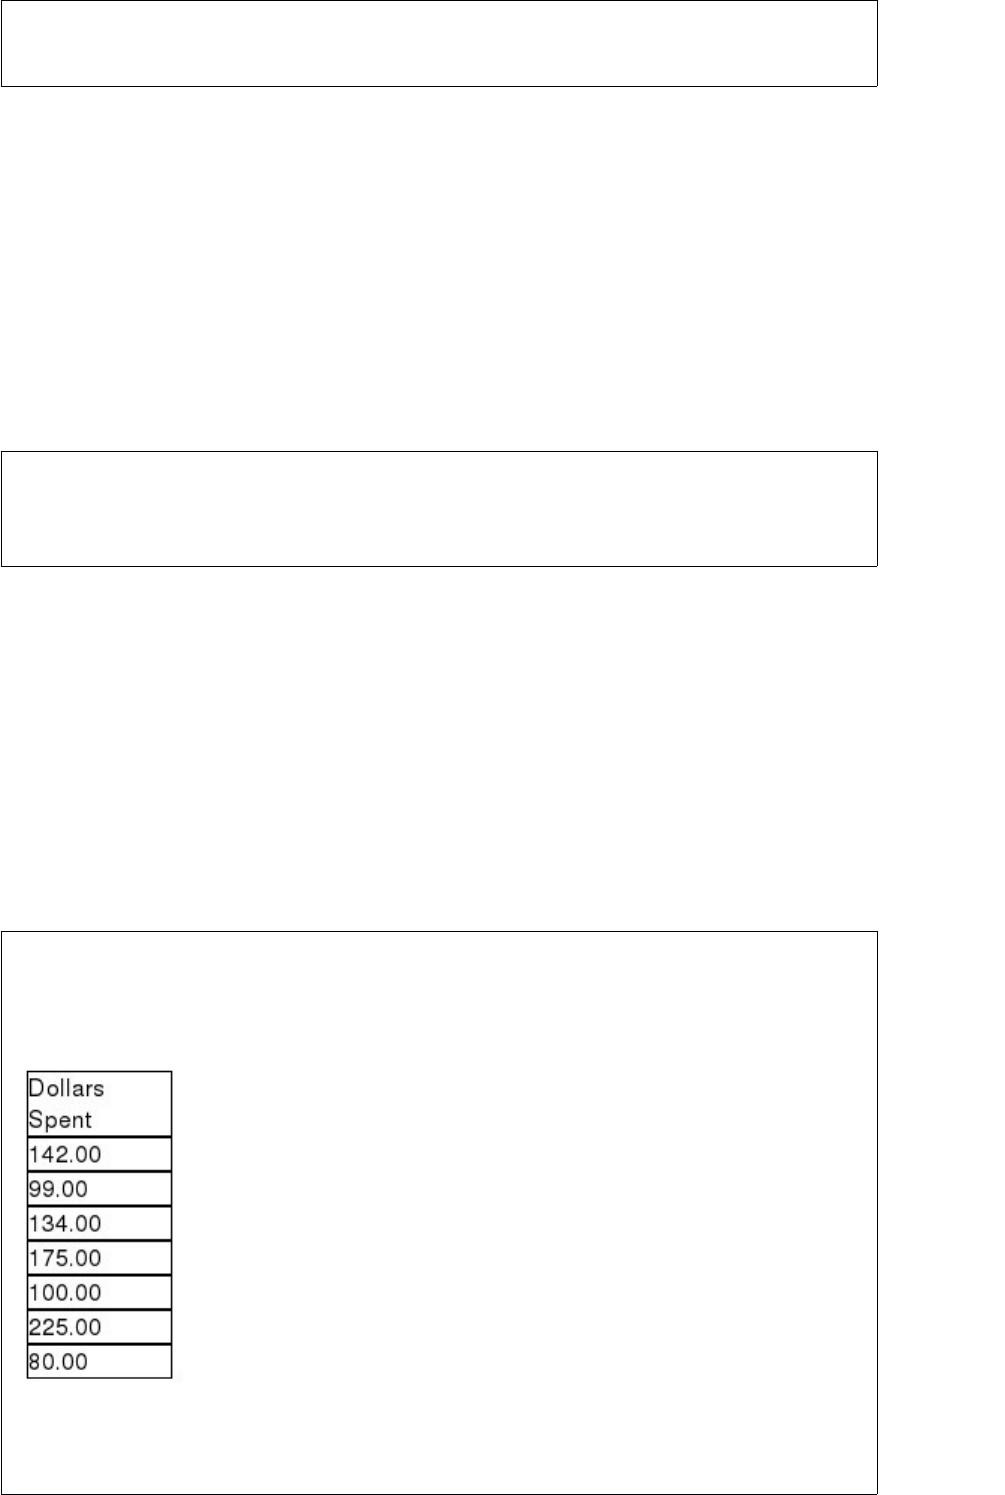
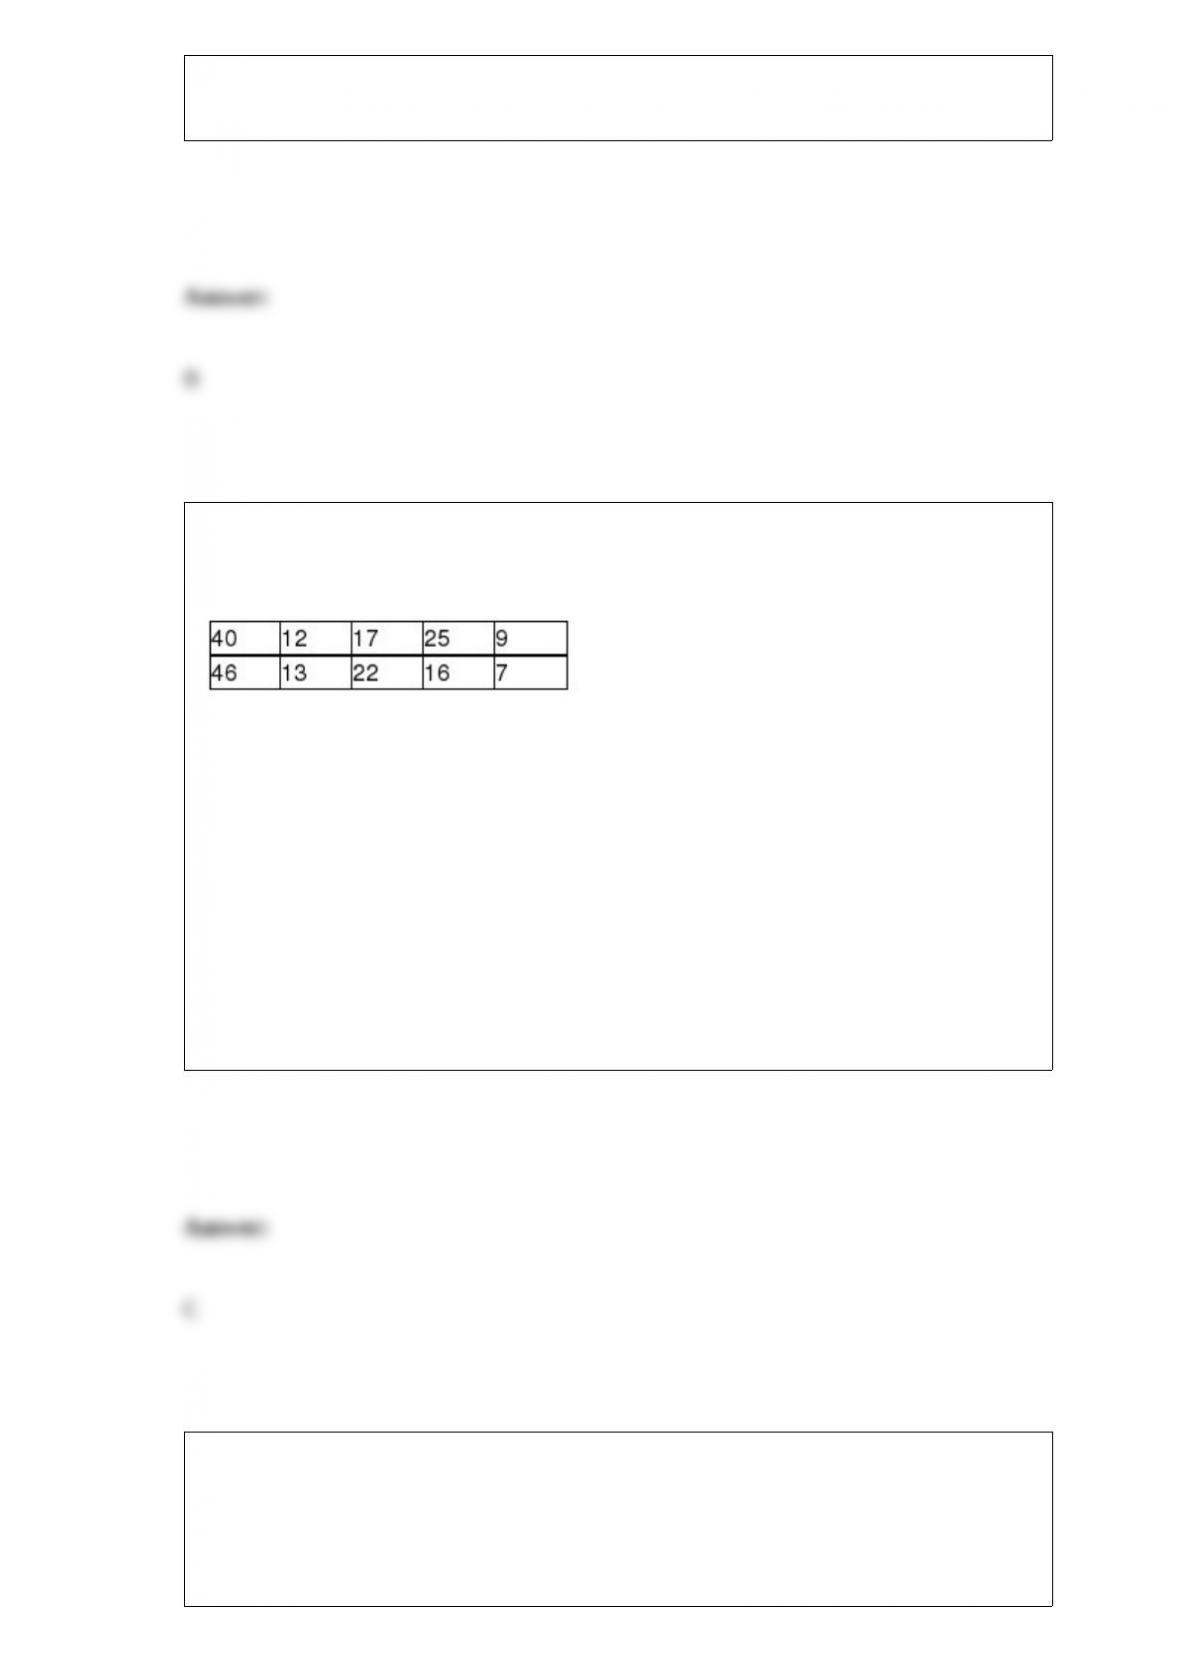
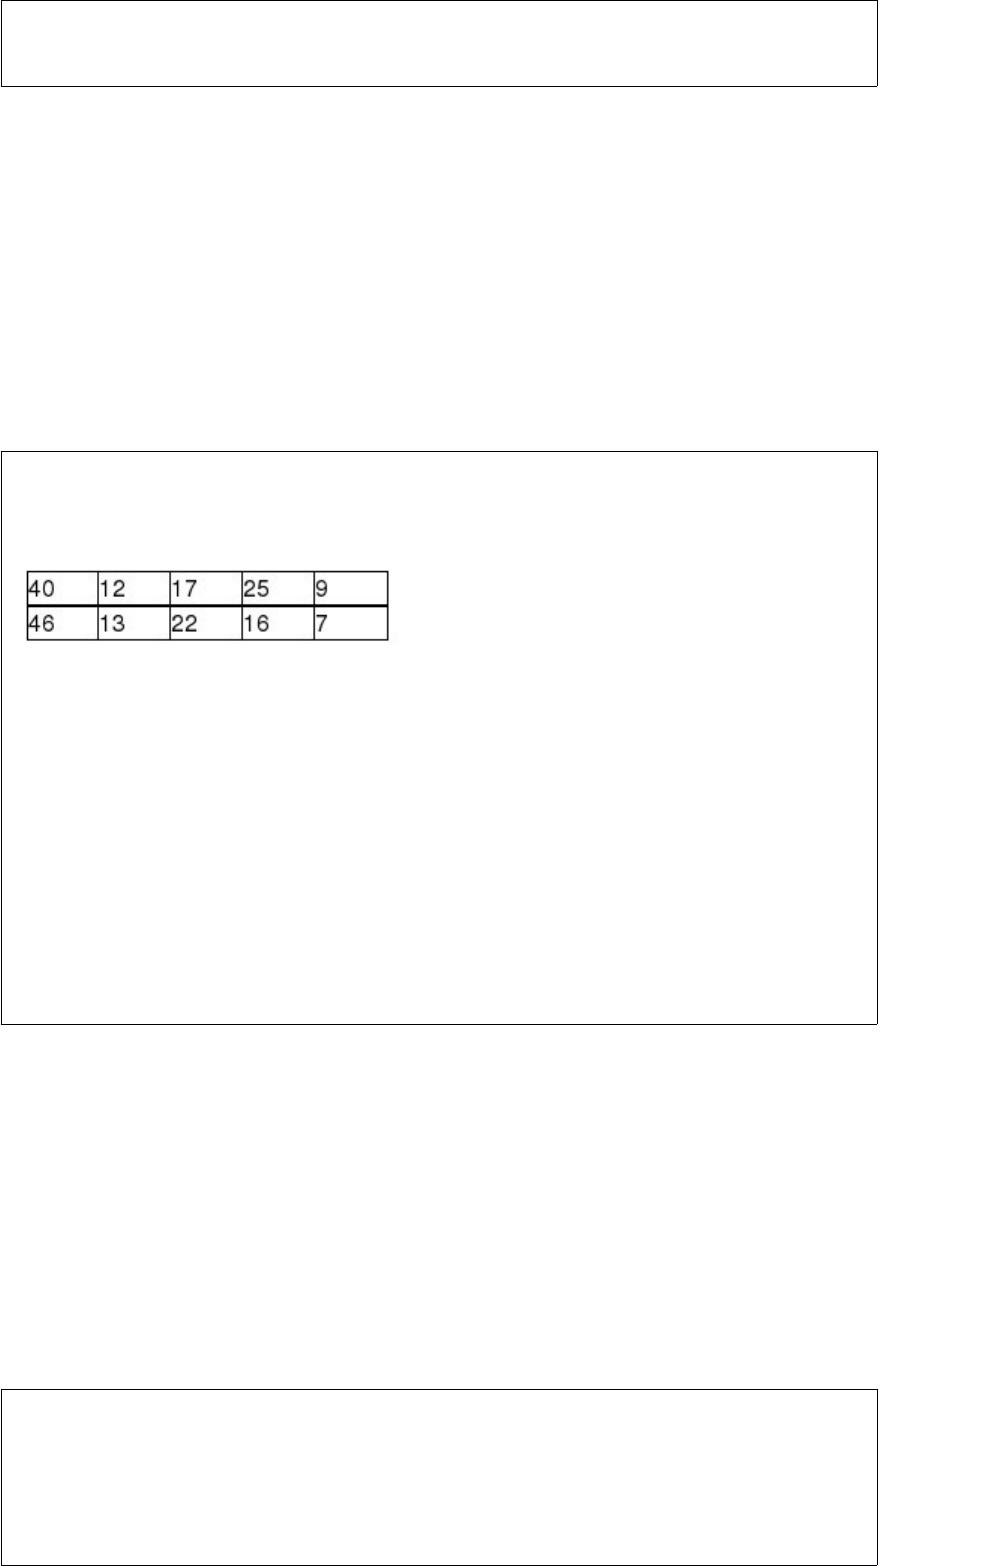
Recently, Major League Baseball officials stated that the median cost for a family of
four to attend a baseball game including, parking, tickets, food, and drinks did not
exceed $125.00. The following sample data were collected:
Assuming that the test of the owners’ claim is going to be conducted using an alpha = .
05 level, the critical value is t = 1.9432.
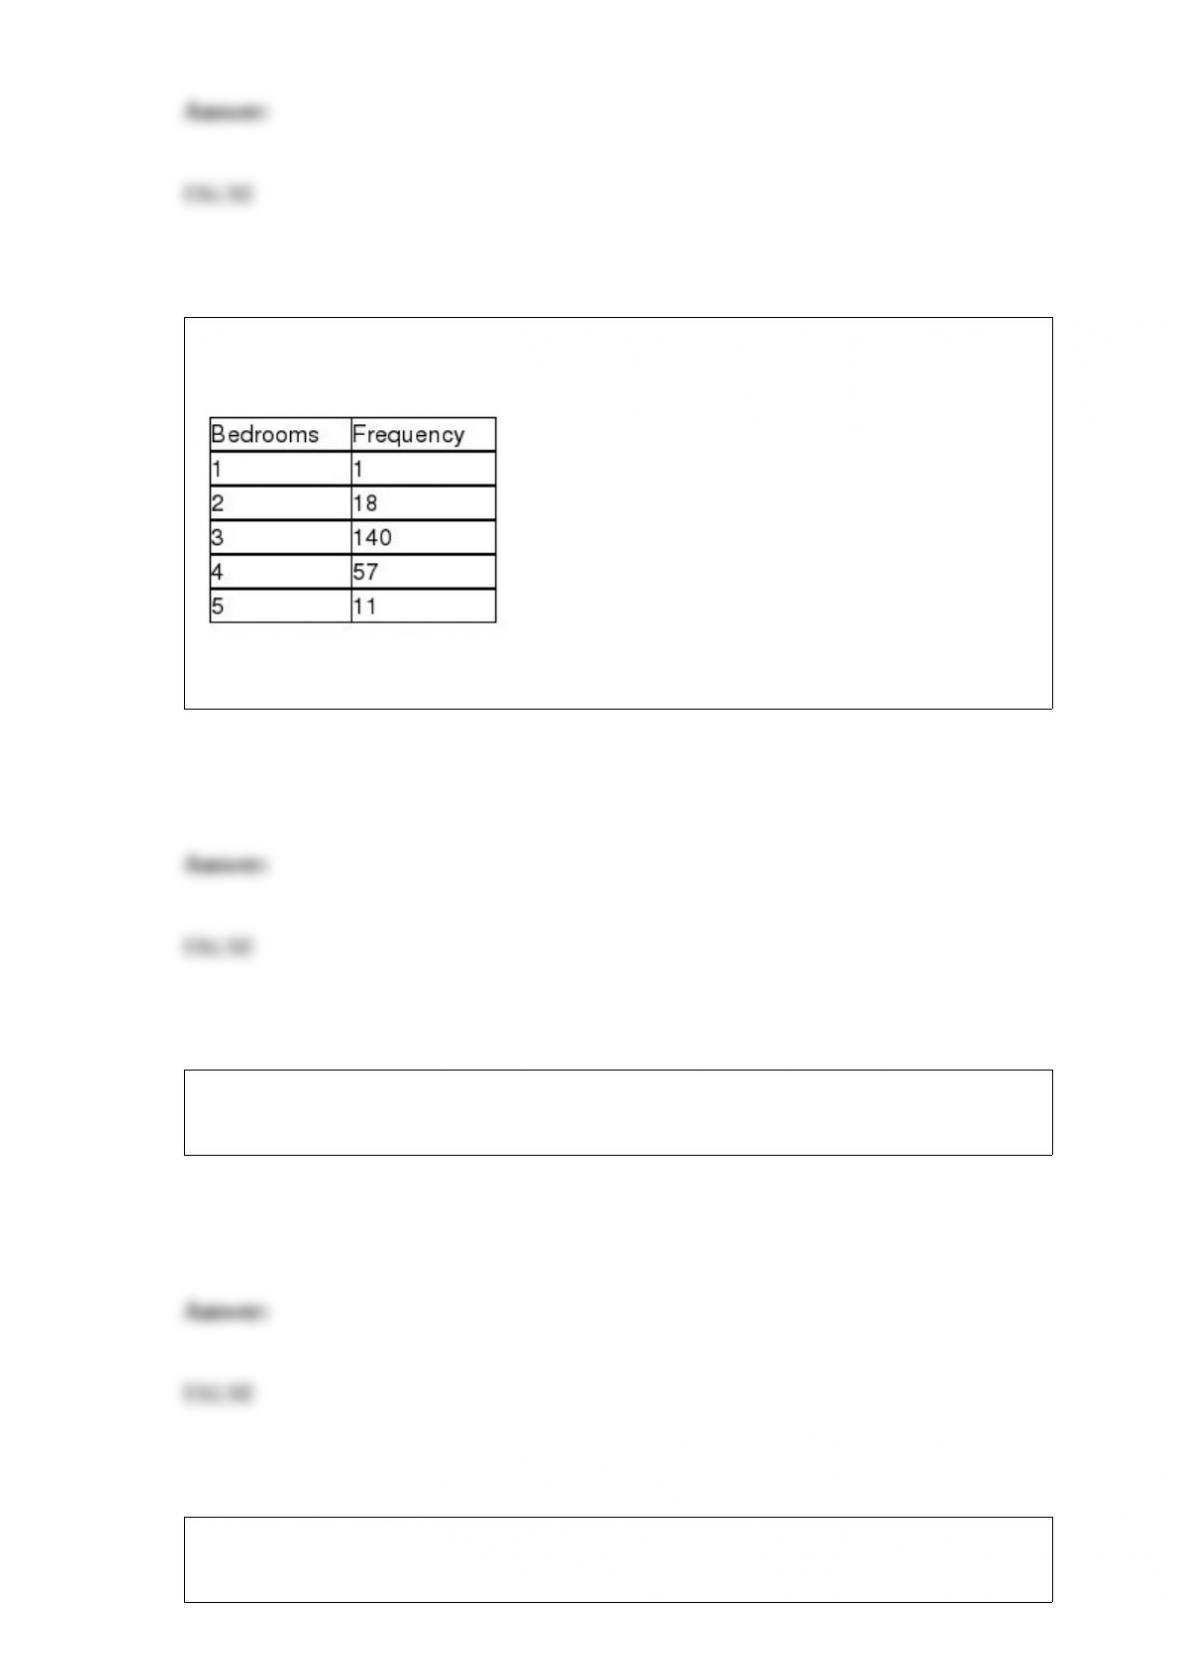
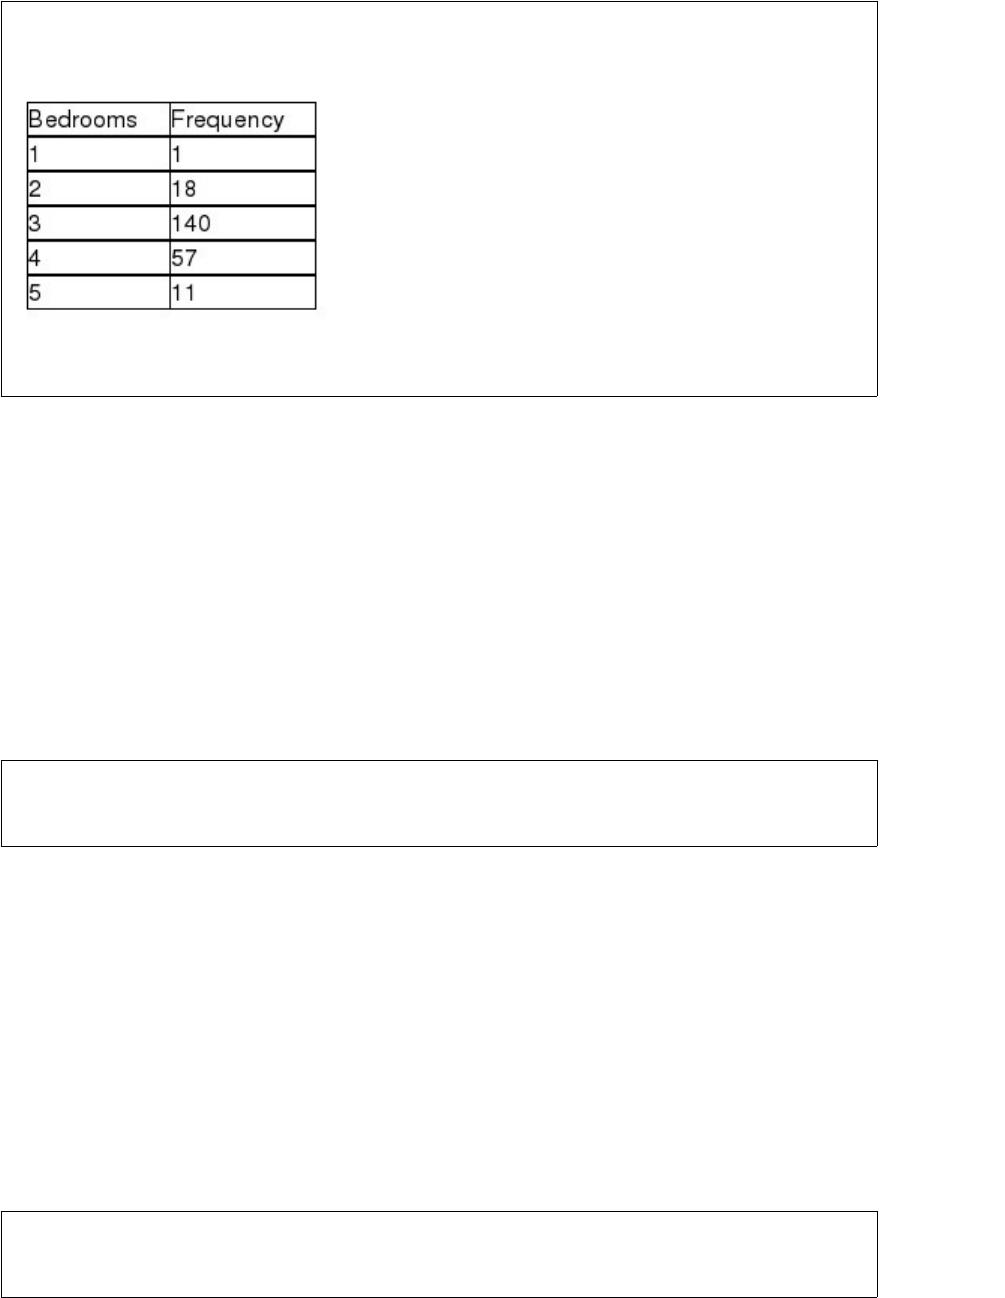
Suppose a study of houses that have sold recently in your community showed the
following frequency distribution for the number of bedrooms:
Based on this information, the mode for the data is 140.
The Wilcoxon signed rank test should be used in place of the t-test whenever the sample
size is less than 20.
Holmstead Company owns two small engine repair stores. The expected value of the
number of complaints received per month at store 1 is 4.5 complaints. Further, the

expected number of complaints per month for store 1 and store 2 combined is 13.6. This
means the expected number of complaints per month at store 2 must be 9.1 complaints.
One of the things that the Central Limit Theorem tells us is that about half of the sample
means will be greater than the population mean and about half will be less.
The makers of weight loss product are interested in estimating the mean weight loss for
users of their product. To do this, they have selected a random sample of n = 9 people
and have provided them with a supply of the product. After six months, the nine people
had an average weight loss of 15.3 pounds with a standard deviation equal to 3.5
pounds. The upper limit for the 90 percent confidence interval estimate for the
population mean is approximately 17.47 pounds.
A pizza restaurant uses 7 different toppings on its pizzas. At lunch time it has a pizza
buffet and makes pizzas with 2 toppings. If it wants to serve every possible combination
of 2 toppings, it would need to make 14 different pizzas.
Close-end questions provide the greatest opportunity to obtain ideas and thoughts on
the part of those surveyed but the resulting data are more difficult to analyze.
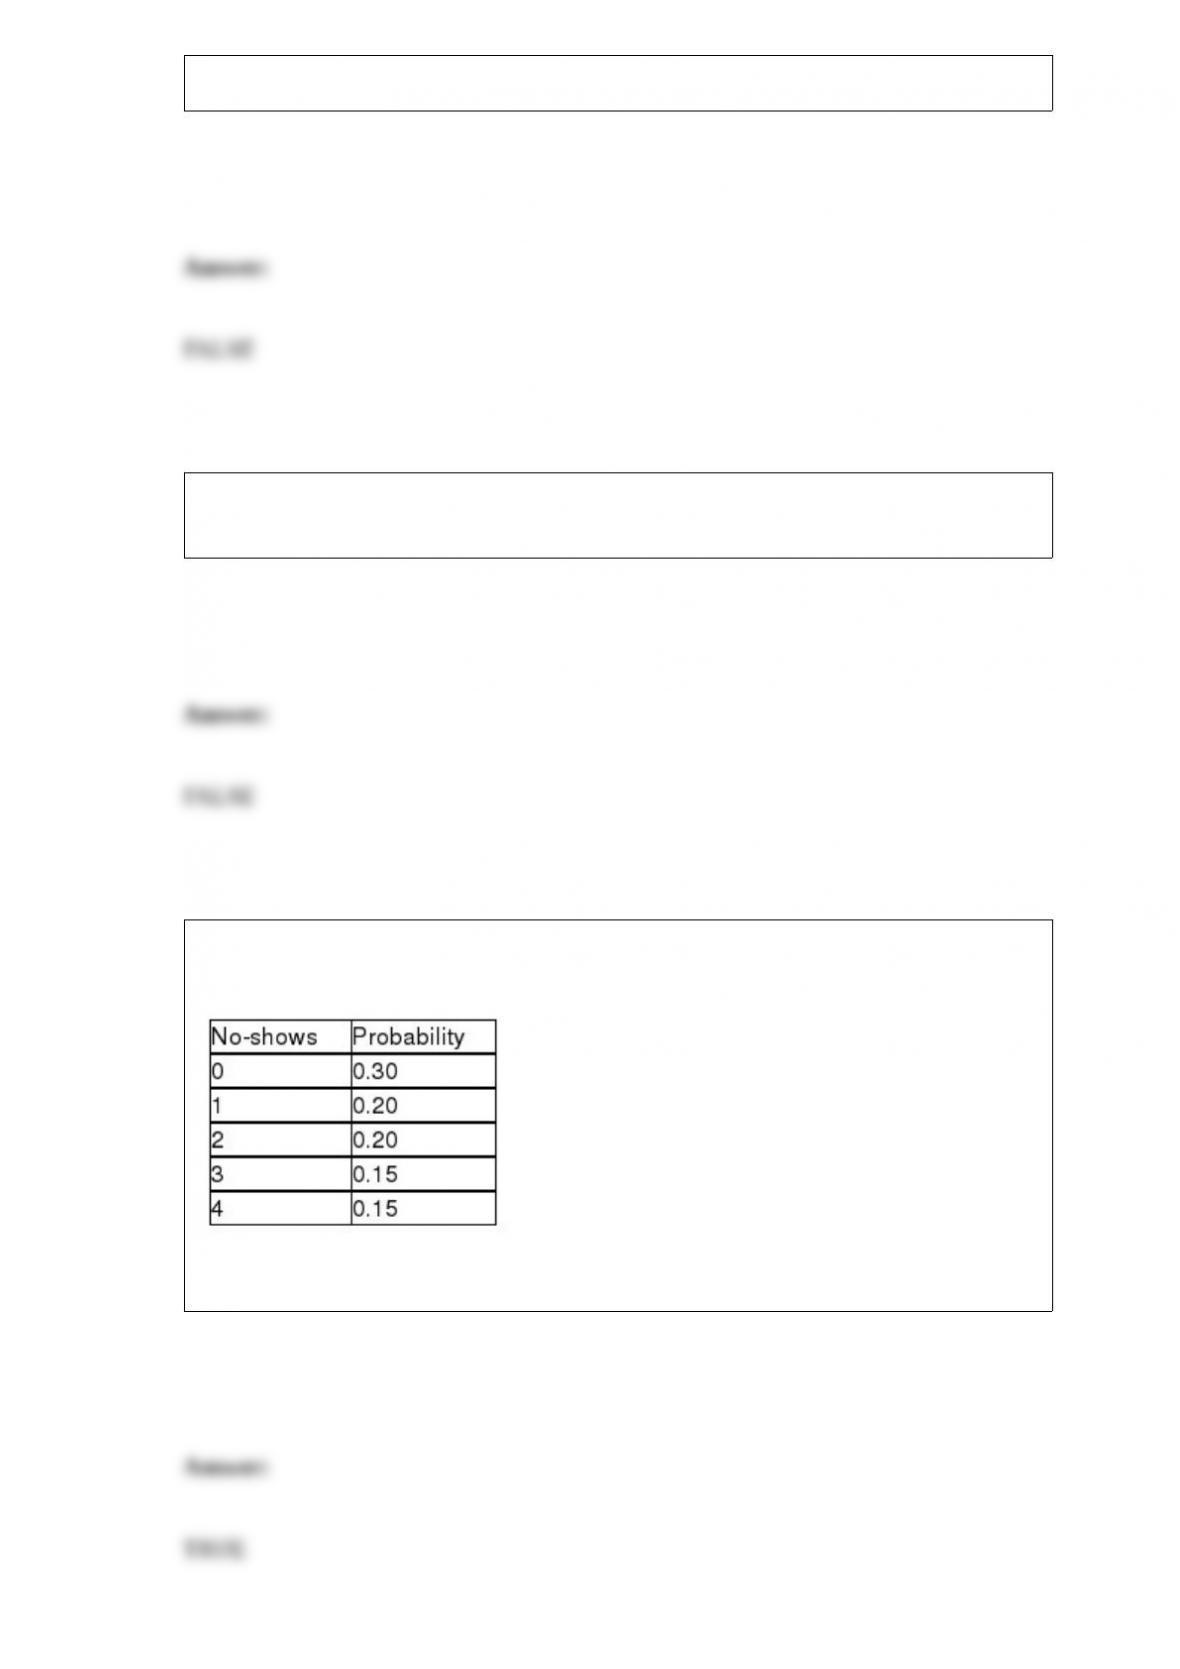
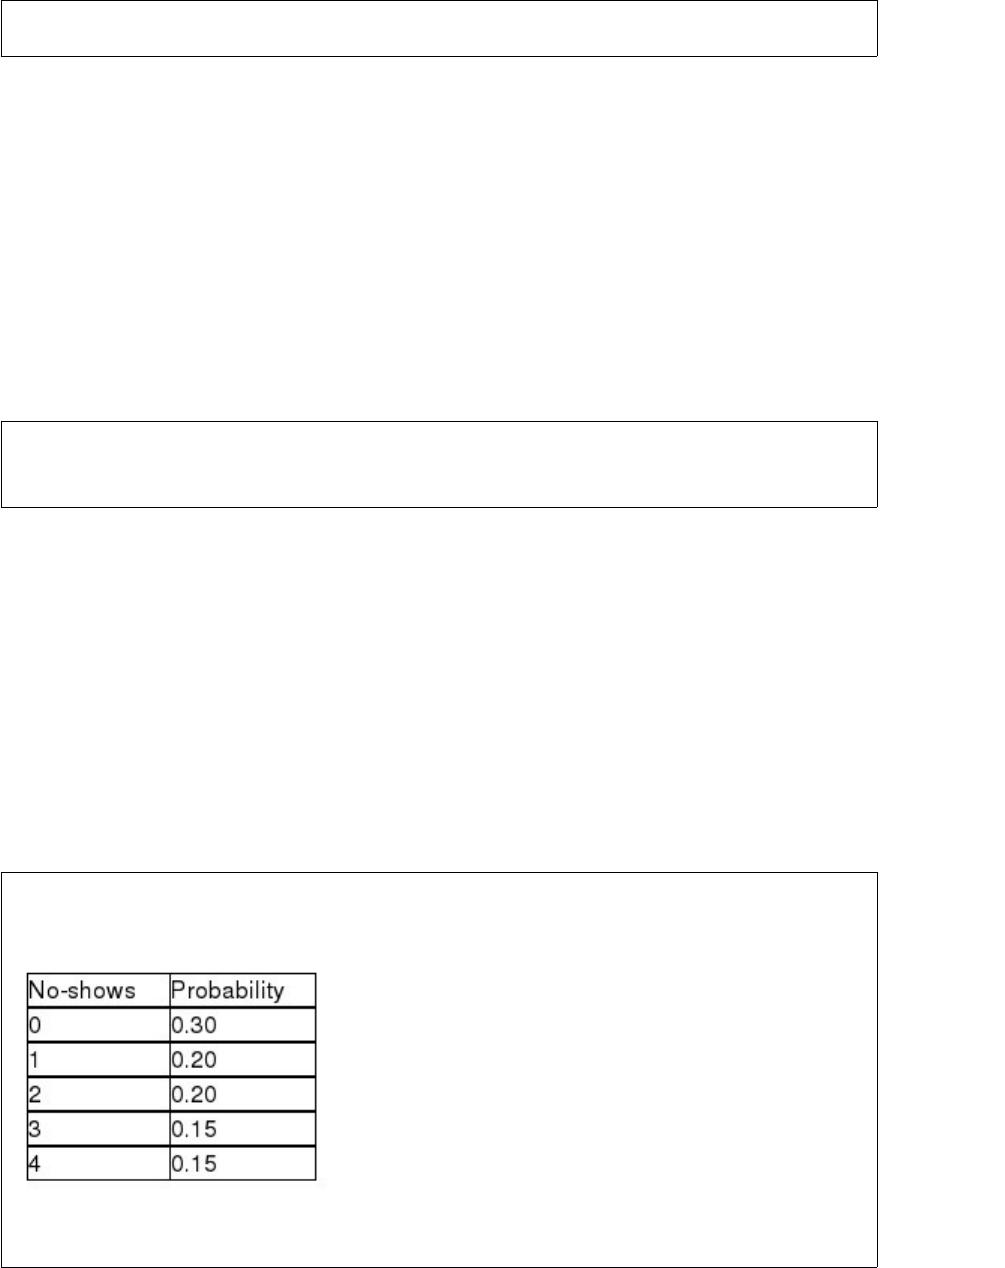
The number of no-shows each day for dinner reservations at the Cottonwood Grille is a
discrete random variable with the following probability distribution:
Based on this information, the expected number of no-shows is 1.65 customers.


A data set in which the mean, median, and mode are all equal is said to be a skewed
distribution.
If a population is not normally distributed, then the sampling distribution for the mean
also cannot be normally distributed.
In multiple regression analysis, the model will be developed with one dependent
variable and two or more independent variables.
In a sample size determination situation, reducing the margin of error by half will
double the required sample size.


An electronics repair shop has determined that the time between failures for a particular
electronic component part is exponentially distributed with a mean time between
failures of 200 hours. Based on this information, the probability that a part will fail in
the first 20 hours is approximately 0.095.
An analyst for a financial investment firm recently went through the effort to determine
the required sample size for estimating the mean number of transactions per year for the
clients of his firm. The calculations, which were based on a 95 percent confidence level
and a margin of error of 3, gave a required sample size of 300. Given this information,
the value used for the population standard deviation must have been about 26.5
transactions.
The fact that a point estimate will likely be different from the corresponding population
value is due to the fact that point estimates are subject to sampling error.

In constructing a frequency distribution for the savings account balances for customers
at a bank, the following class boundaries might be acceptable if the minimum balance is
$5.00 and the maximum balance is $18,700:
$0.00 – $5,000
$5,000 – 10,000
$10,000 – $15,000
$15,000 – $20,000
The general idea is that interaction between two factors means that the effect due to one
of the factors is not uniform across all levels of the other factor.
If a one-tailed F-test is employed when testing a null hypothesis about two population
variances, the test statistic is an F-value formed by taking the ratio of the two sample
variances so that the sample variance predicted to be larger is placed in the numerator.

The t-distribution is used to obtain the critical value in developing a confidence interval
when the population distribution is not known or the sample size is small.
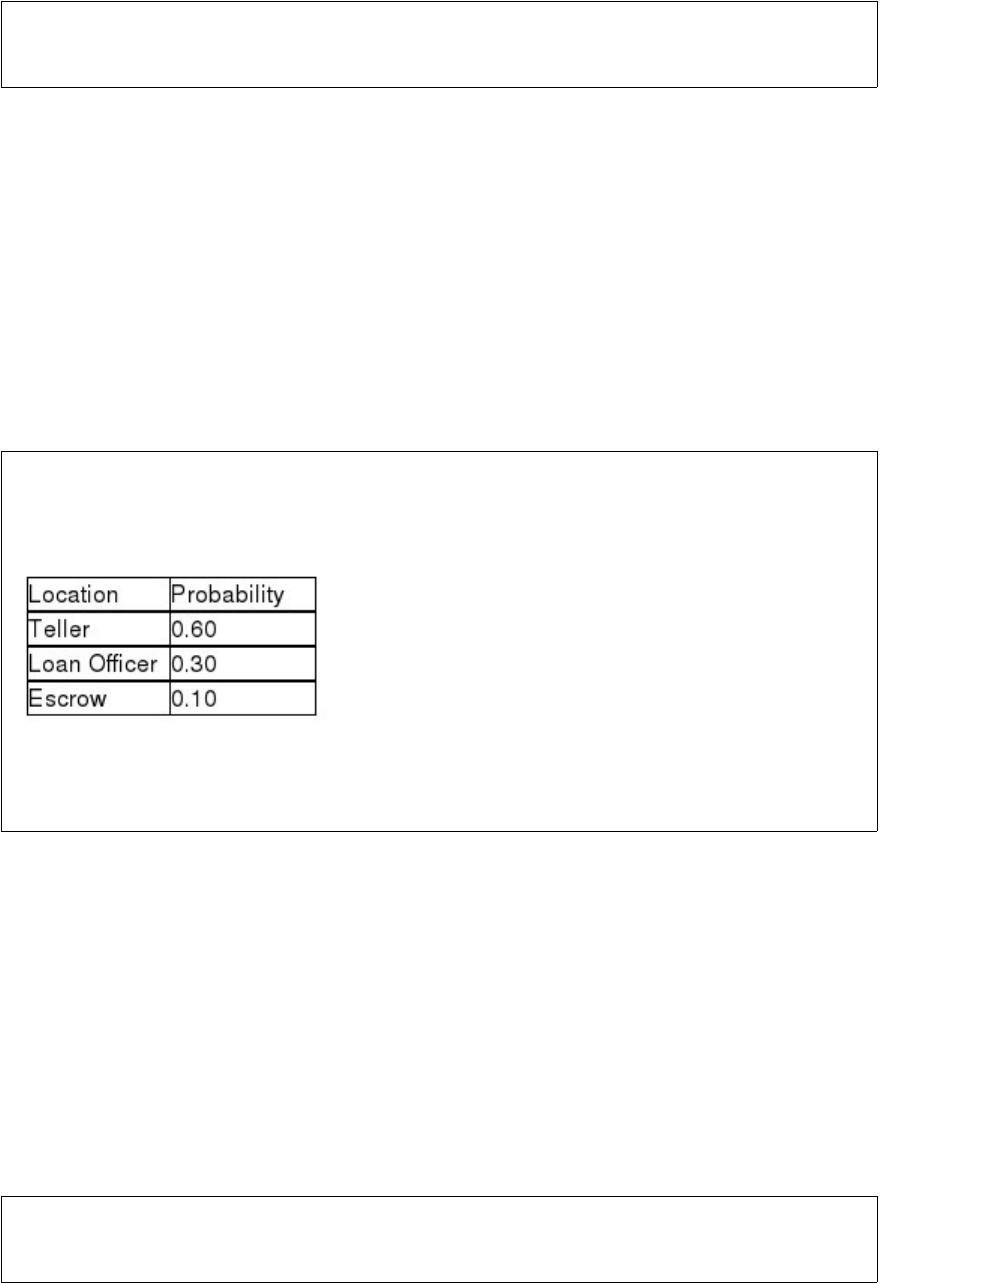
When customers come to a bank, there are three primary locations they may select to go
to: teller, loan officer, or escrow department. Based on past experience, the following
probability distribution applies:
Seventy percent of customers are males. The probability that three consecutive
customers all go to a teller is approximately 0.22.
When the salesperson makes a sale, there are three possible sales levels: large, medium,
and small. The probability of a large sale is 0.20 and the chance of a medium sale is
0.60. Thus, when a sale is made, the chance of it being a small sale is 0.20.
The sign on the intercept coefficient in a simple regression model will always be the
same as the sign on the correlation coefficient.
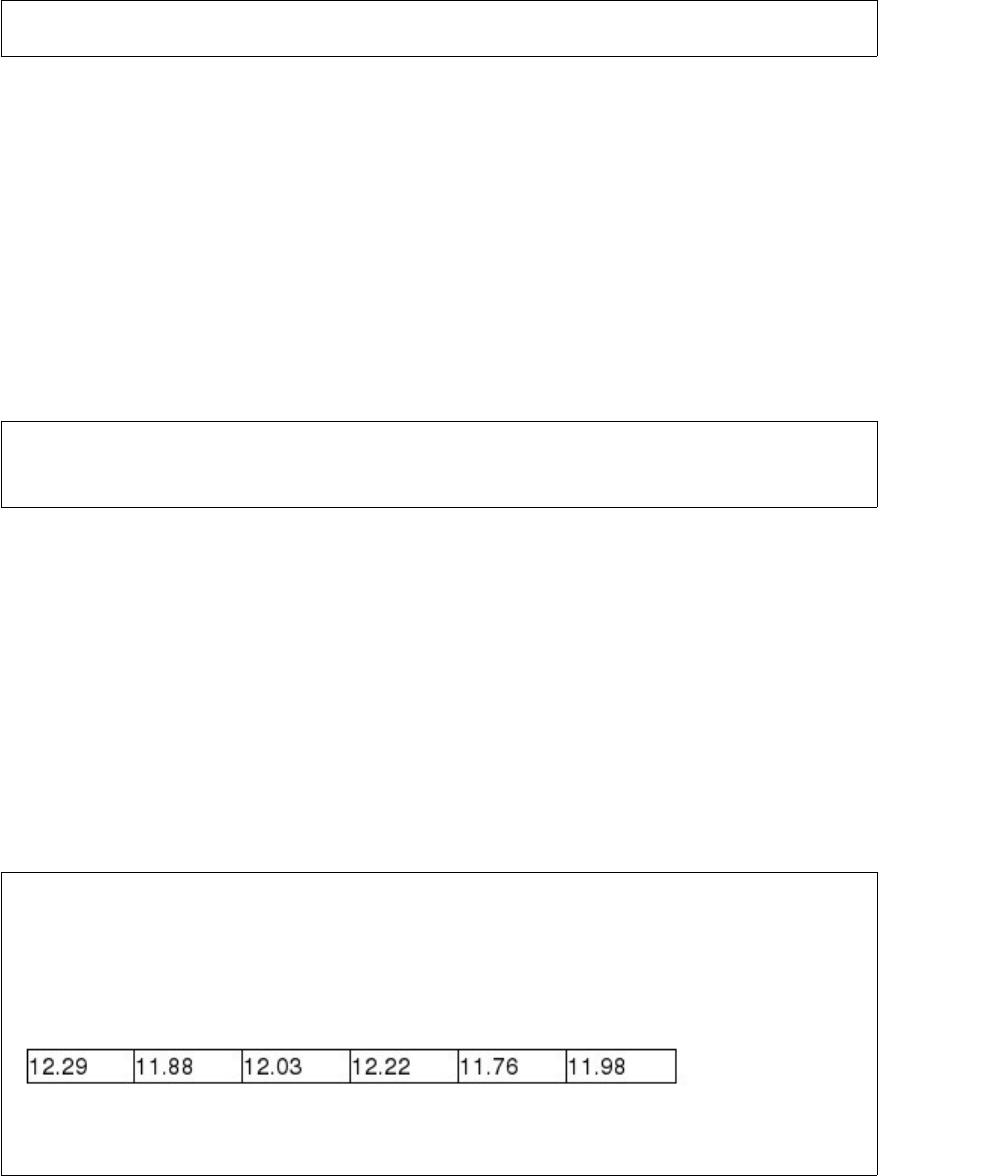
A machine that is used to fill soda pop cans with pop has an adjustable mean fill setting,
but the standard deviation is not supposed to exceed 0.18 ounces. To make sure that this
is the case, the managers at the beverage company each day select a random sample of
n = 6 cans and measure the fill volume carefully. In one such case, the following data
(ounces per can) were observed.
Based on these sample data, the test statistic is approximately χ2 = 5.01.

When the correlation coefficient for the two variables was -0.23, it implies that the two
variables are not correlated because the correlation coefficient cannot be negative.
A local pizza company is interested in estimating the percentage of customers who
would take advantage of a coupon offer. To do this, they give the coupon out to a
random sample of 100 customers. Of these, 45 actually use the coupon. Based on a 95
percent confidence level, the upper and lower confidence interval limits are
approximately 0.3525 to 0.5475.
In a two-tailed hypothesis test involving two population variances, if the null hypothesis
is true then the F-test statistic should be approximately equal to 1.0.
Kruskal-Wallis One-Way Analysis of Variance is the nonparametric counterpart to the
one-way ANOVA procedure in which the assumptions of normally distributed
populations with equal variances are satisfied.
Sampling error can be eliminated if the sampling is done properly.
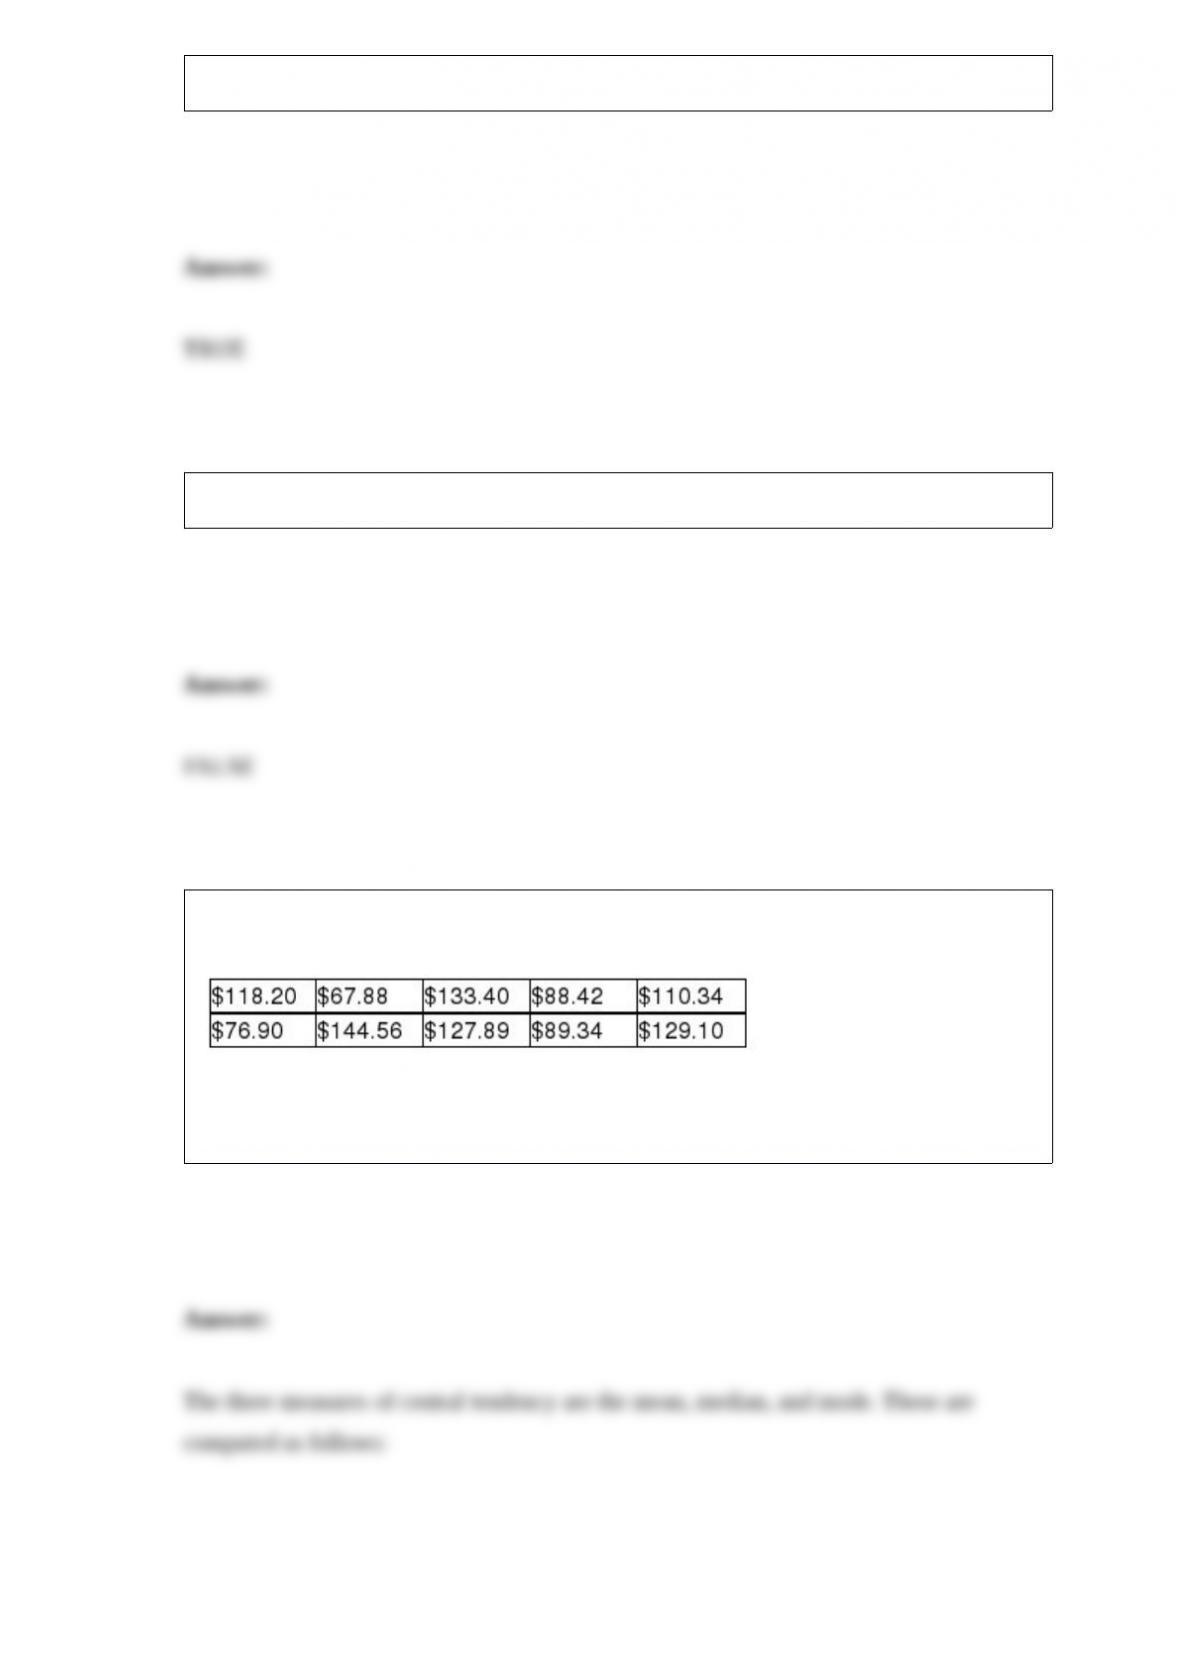
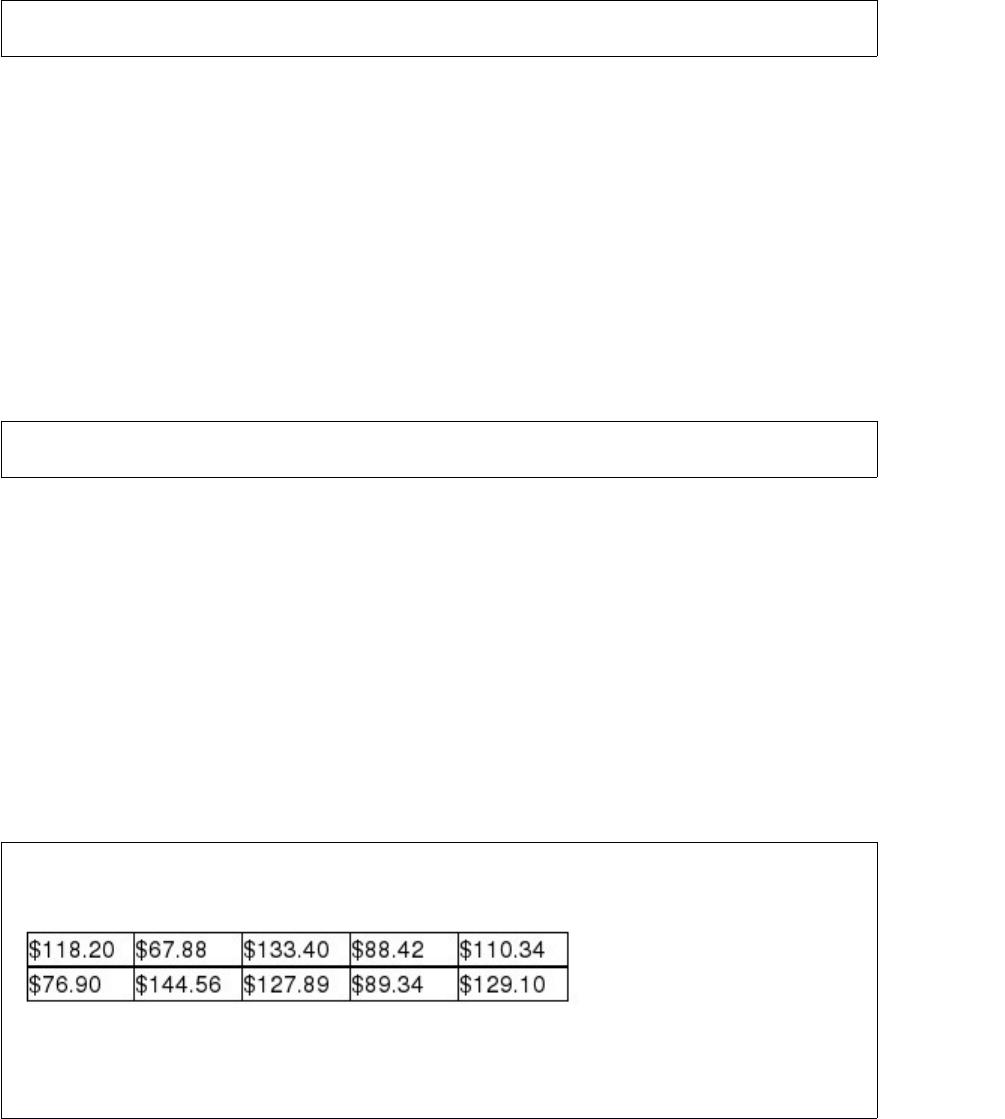
The following sample data reflect electricity bills for ten households in San Diego in
March.
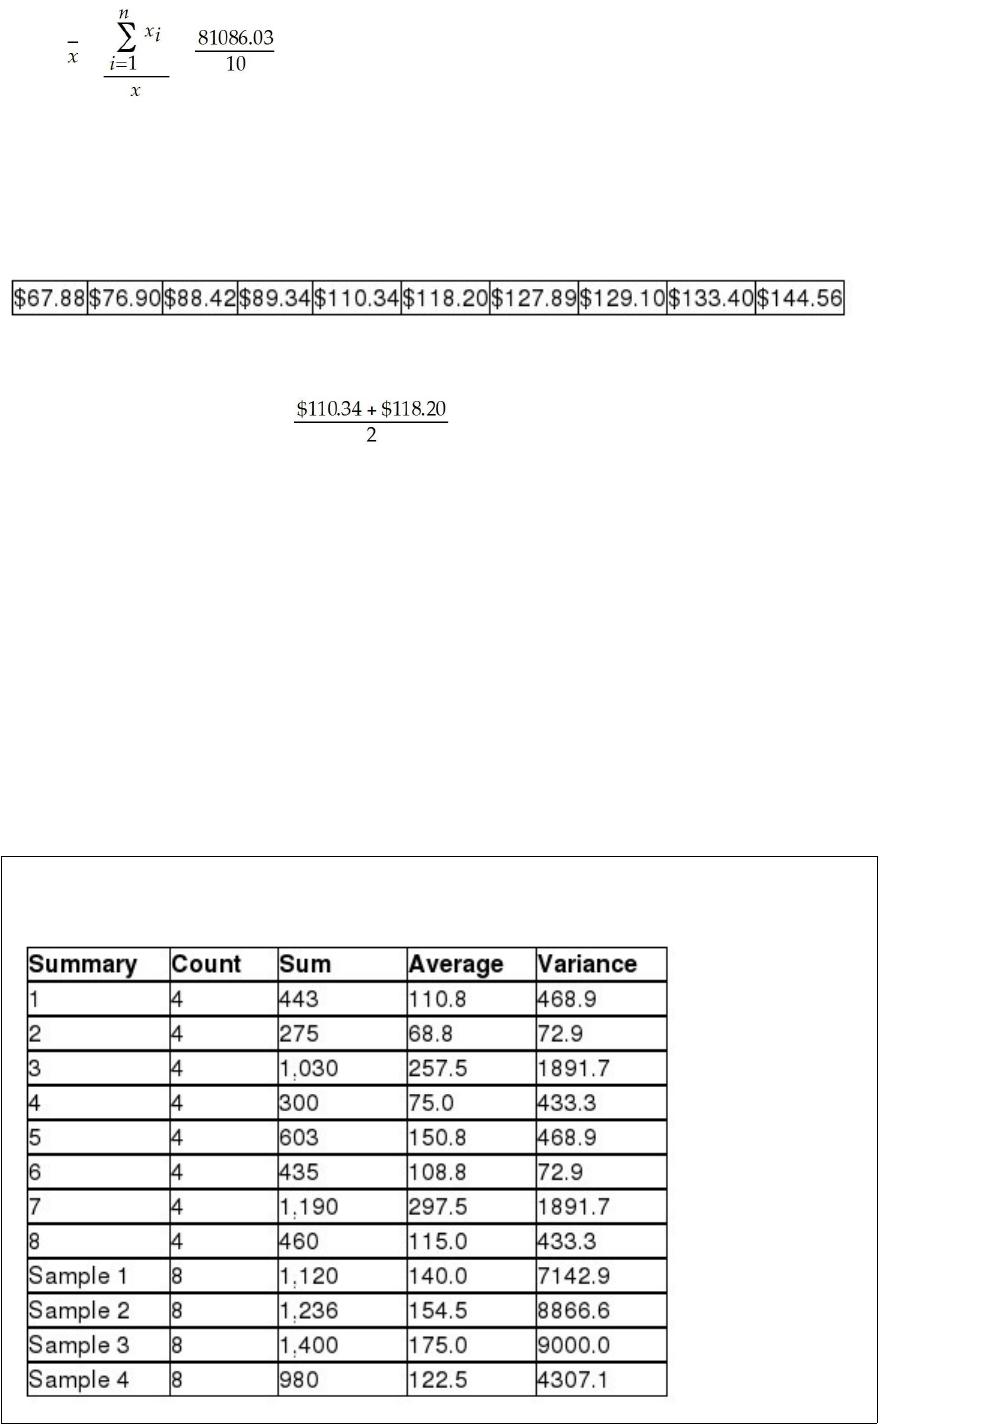
Determine three measures of central tendency for these sample data. Then, based on
these measures, determine whether the sample data are symmetric or skewed.

Consider the following:

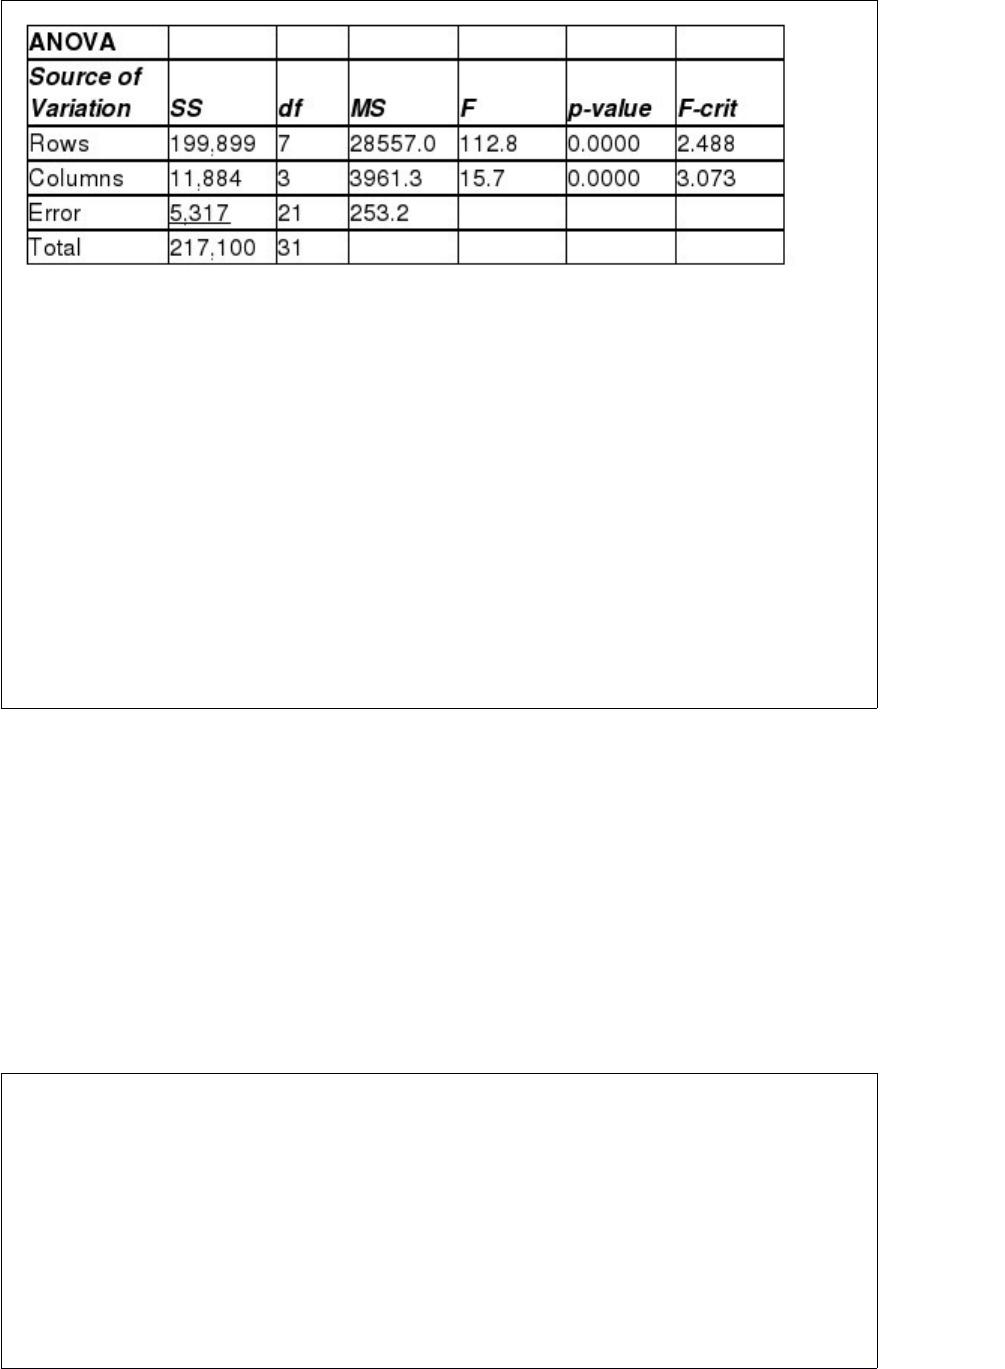
Test to determine whether blocking is effective using an alpha level equal to 0.05
A) Because F = 14.81 > critical F = 2.5, we do not reject the null hypothesis and
conclude that blocking is not effective.
B) Because F = 14.81 > critical F = 2.5, we reject the null hypothesis and conclude that
blocking is effective.
C) Because F = 112.79 > critical F = 2.5, we do not reject the null hypothesis and
conclude that blocking is not effective.
D) Because F = 112.79 > critical F = 2.5, we reject the null hypothesis and conclude
that blocking is effective.
An event is:
A) the list of possible outcomes that can occur from a selection or decision.
B) a collection of elementary events.
C) similar to an experiment but not controlled by the decision maker.
D) more frequently found in business than in other disciplines.


A new phone answering system installed by the Ohio Power Company is capable of
handling five calls every 10 minutes. Prior to installing the new system, company
analysts determined that the incoming calls to the system are Poisson distributed with a
mean equal to two every 10 minutes. If this incoming call distribution is what the
analysts think it is, what is the probability that in a 10-minute period more calls will
arrive than the system can handle?
A) 0.174
B) 0.0812
C) 0.0166
D) 0.0233
Which of the following will be helpful if the decision maker wishes to reduce the
chance of making a Type II error?
A) Increase the level of significance at which the hypothesis test is conducted.
B) Increase the sample size.
C) Both A and B will work.
D) Neither A nor B will be effective.
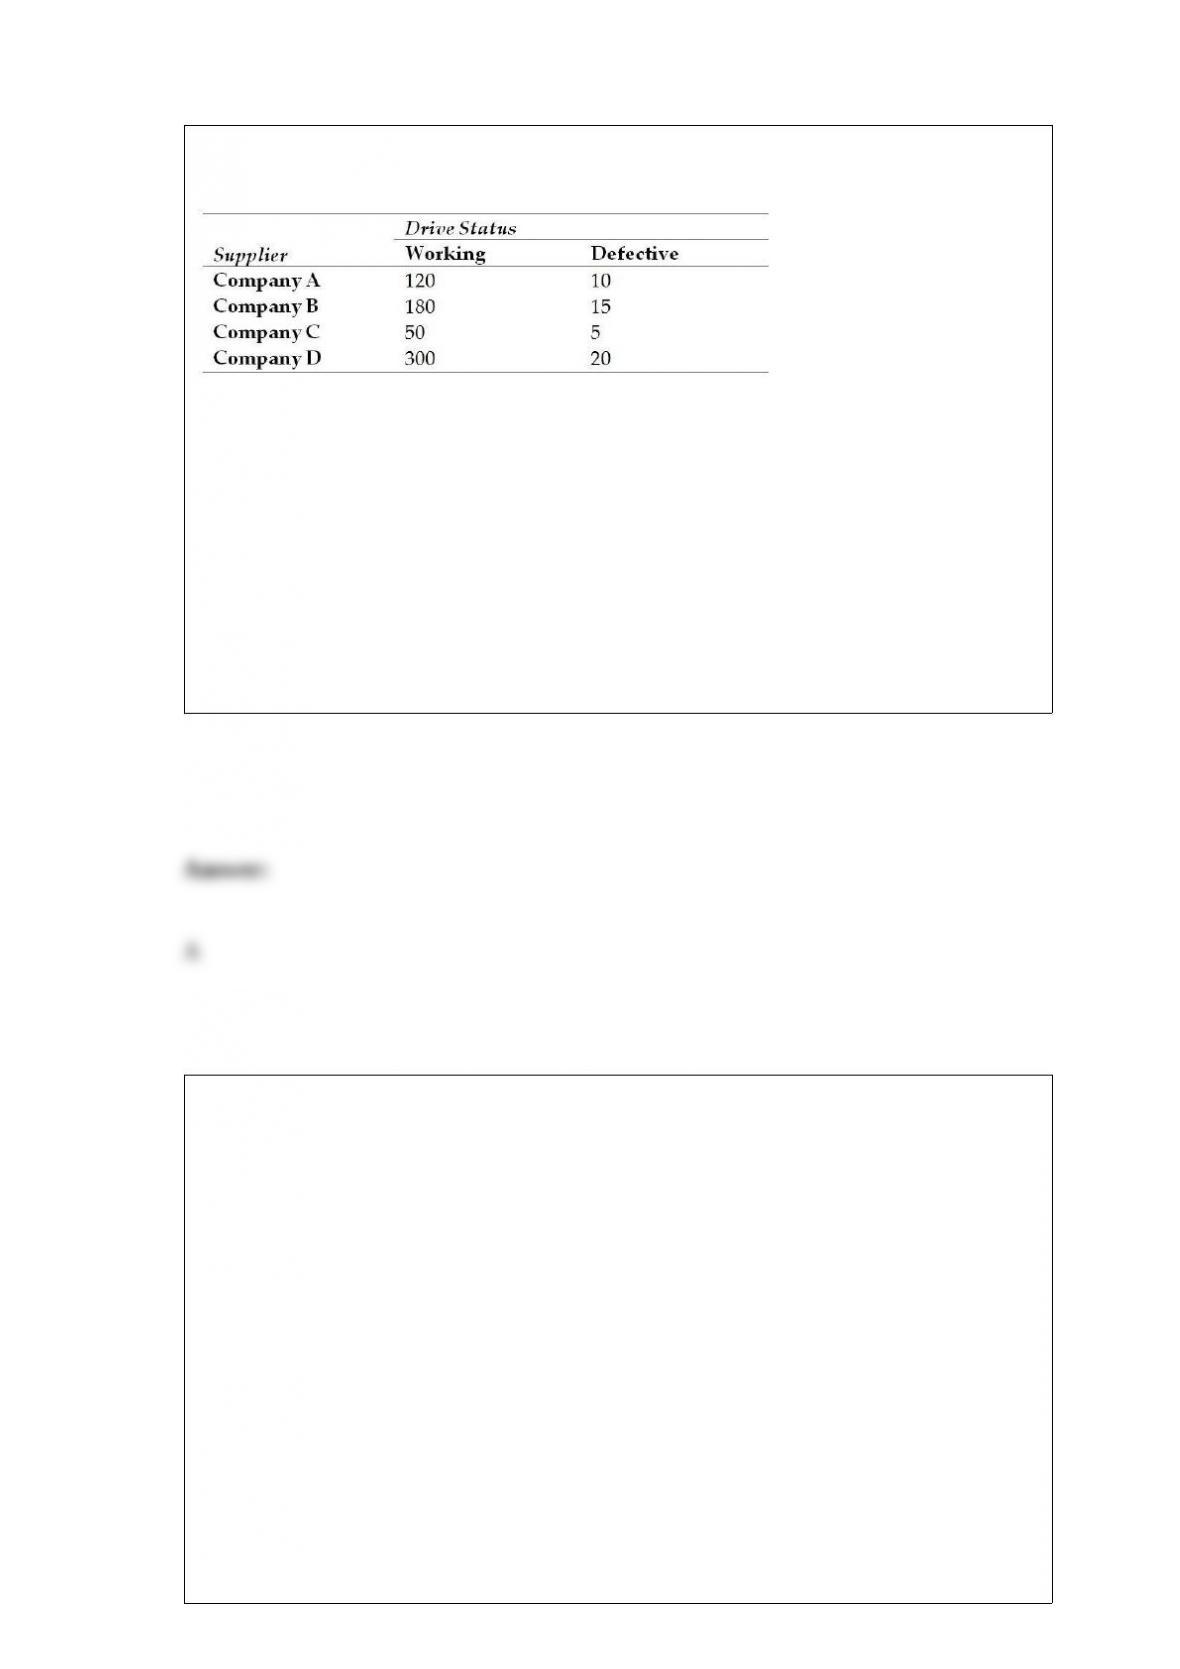

Suppose a quality manager for Dell Computers has collected the following data on the
quality status of disk drives by supplier. She inspected a total of 700 disk drives.
What is the probability of a defective disk drive being received by the computer
company?
A) 0.07
B) 0.28
C) 0.021
D) 0.76
According to USA Today, customers are not settling for automobiles straight off the
production lines. As an example, those who purchase a $355,000 Rolls-Royce typically
add $25,000 in accessories. One of the affordable automobiles to receive additions is
BMW’s Mini Cooper. A sample of 179 recent Mini purchasers yielded a sample mean of
$5,000 above the $20,200 base sticker price. Suppose the cost of accessories purchased
for all Mini Coopers has a standard deviation of $1,500.
Determine the margin of error in estimating the average cost of accessories on Mini
Coopers.
A) 219.75
B) 214.41
C) 231.14
D) 291.11


In a situation where the population standard deviation is known and we wish to estimate
the population mean with 90 percent confidence, what is the appropriate critical value
to use?
A) z = 1.96
B) z = 2.33
C) z = 1.645
D) Can’t be determined without knowing the degrees of freedom.
Suppose that an internal report submitted to the managers at a bank in Boston showed
that with 95 percent confidence, the proportion of the bank’s customers who also have
accounts at one or more other banks is between .45 and .51. Given this information,
what sample size was used to arrive at this estimate?
A) About 344
B) Approximately 1,066
C) Just under 700
D) Can’t be determined without more information.
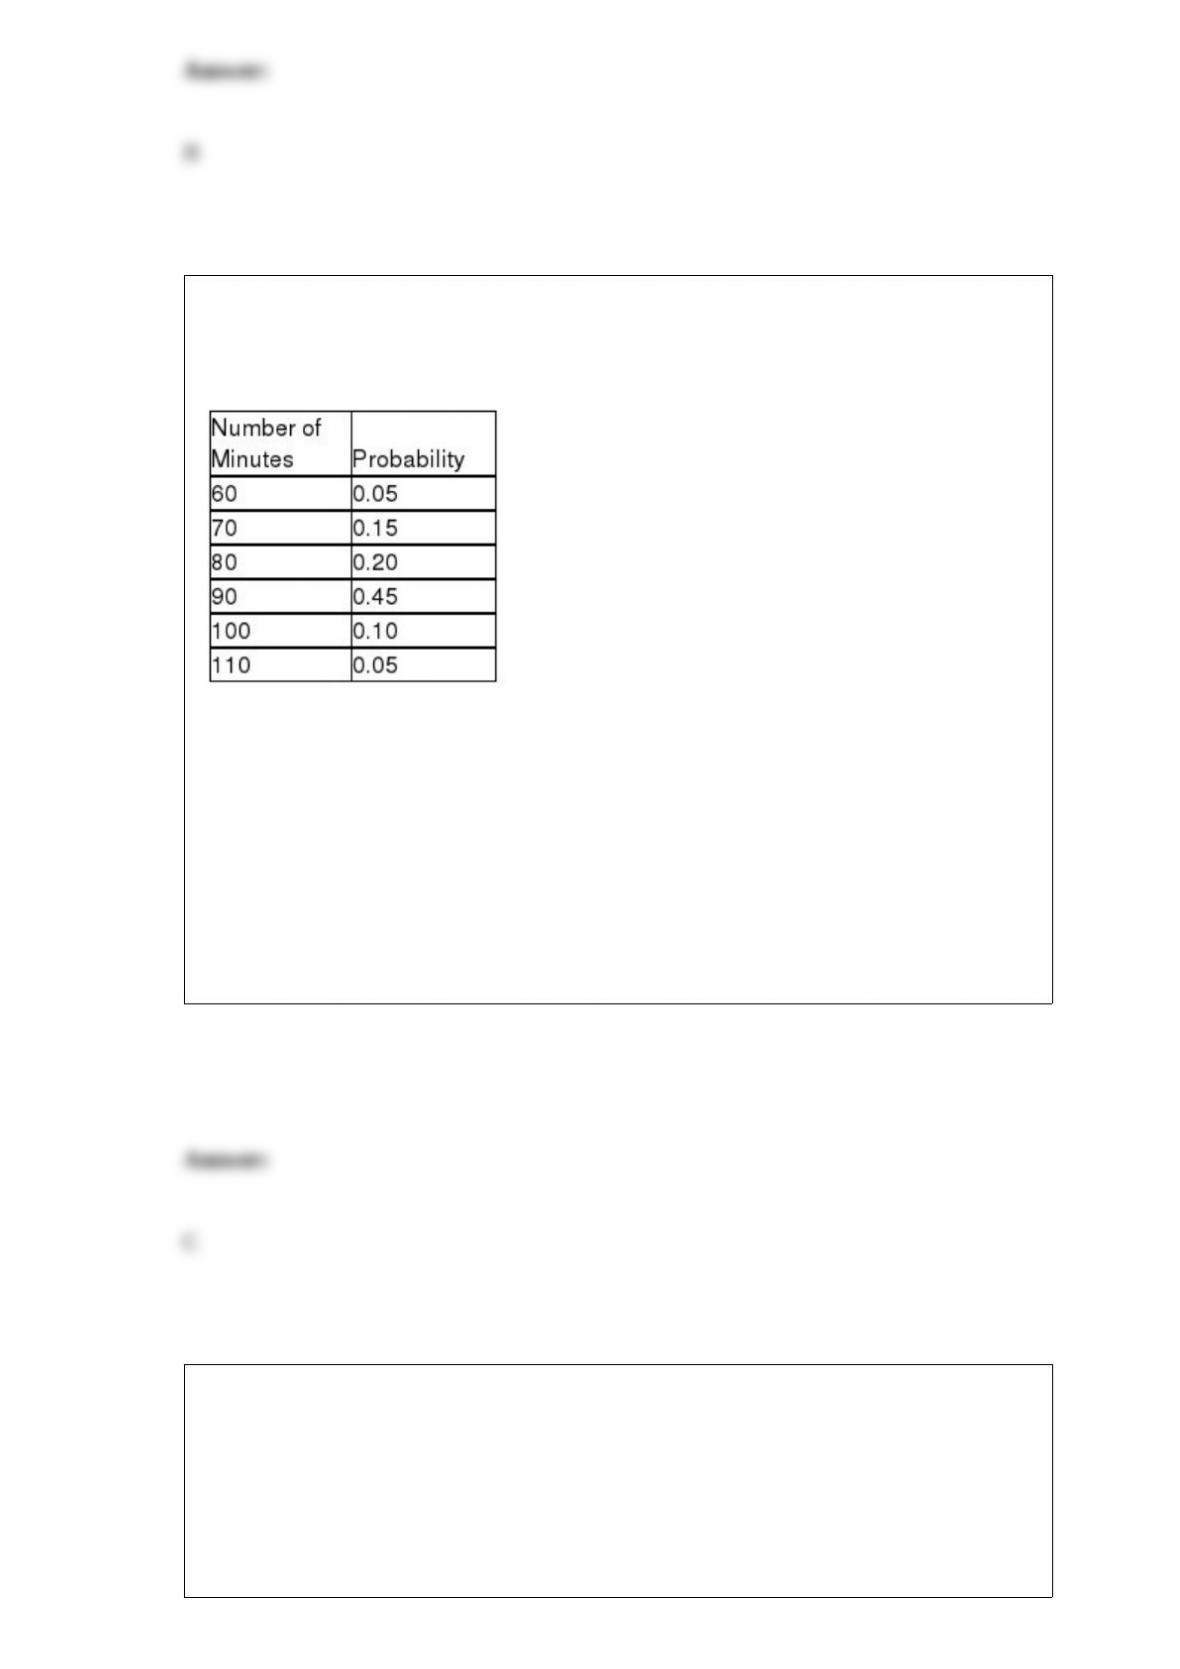
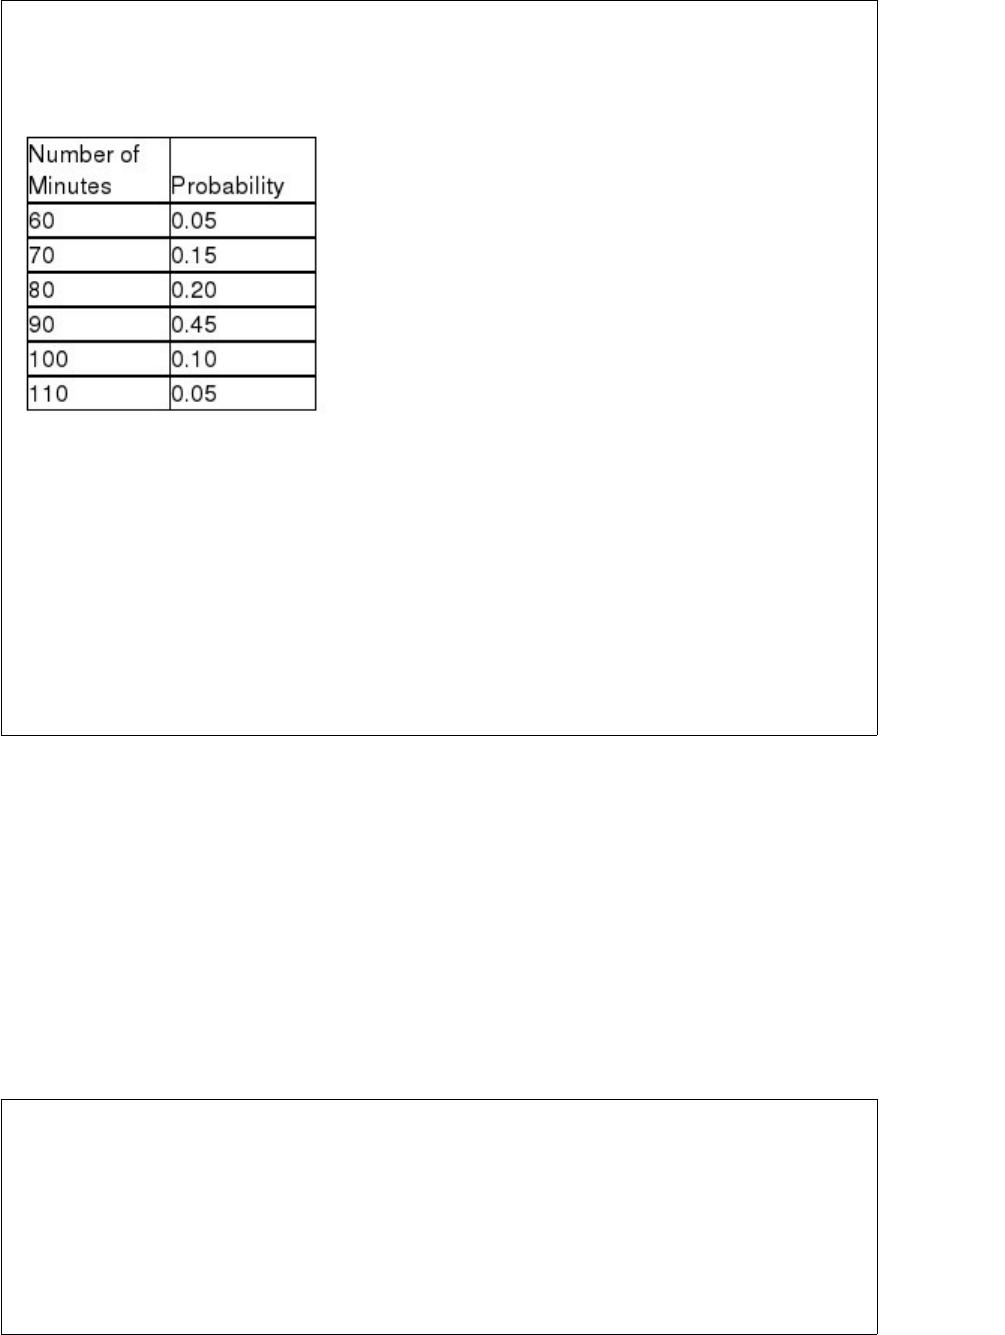
Cramer’s Bar and Grille in Dallas can seat 130 people at a time. The manager has been
gathering data on the number of minutes a party of four spends in the restaurant from
the moment they are seated to when they pay the check.
What is the mean number of minutes for a dinner party of four?
A) 65.5
B) 67.5
C) 85.5
D) 75.5
Each evening, a nationwide retail chain randomly calls 100 of the customers who came
to their store that day to ask whether they were satisfied with the service they had
received. The customers respond yes or no. Suppose the company has found over time
that 8 percent of the customers are not satisfied (“no” answers), what is the 3-sigma
upper and lower control limits for the appropriate control chart?
A) About .053 and .107


B) 0 to about .16
C) -.0.14 to about .16
D) About -1.96 to 1.96
The x-bar chart is based on the principles of which distribution?
A) t-distribution
B) Chi square distribution
C) F distribution
D) Normal distribution
An Internet service provider is interested in testing to see if there is a difference in the
mean weekly connect time for users who come into the service through a dial-up line,
DSL, or cable Internet. To test this, the ISP has selected random samples from each
category of user and recorded the connect time during a week period. The following
data were collected:
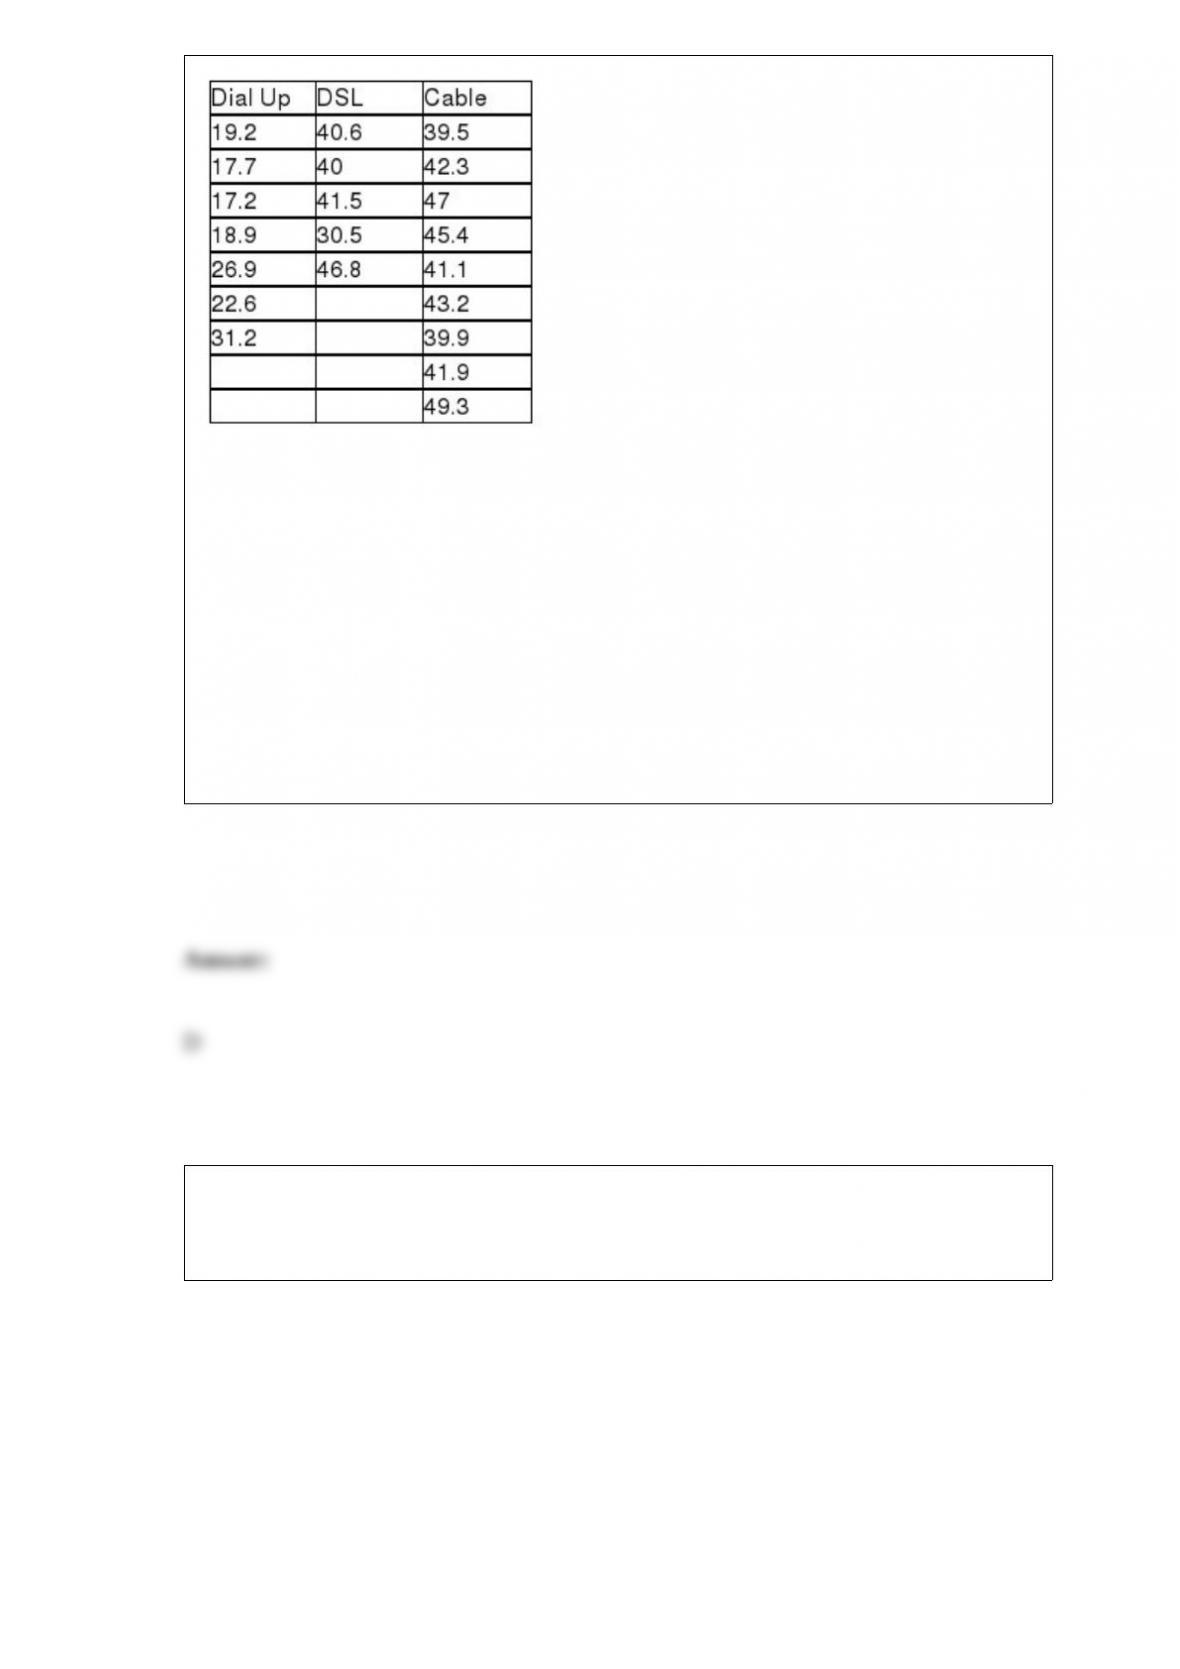
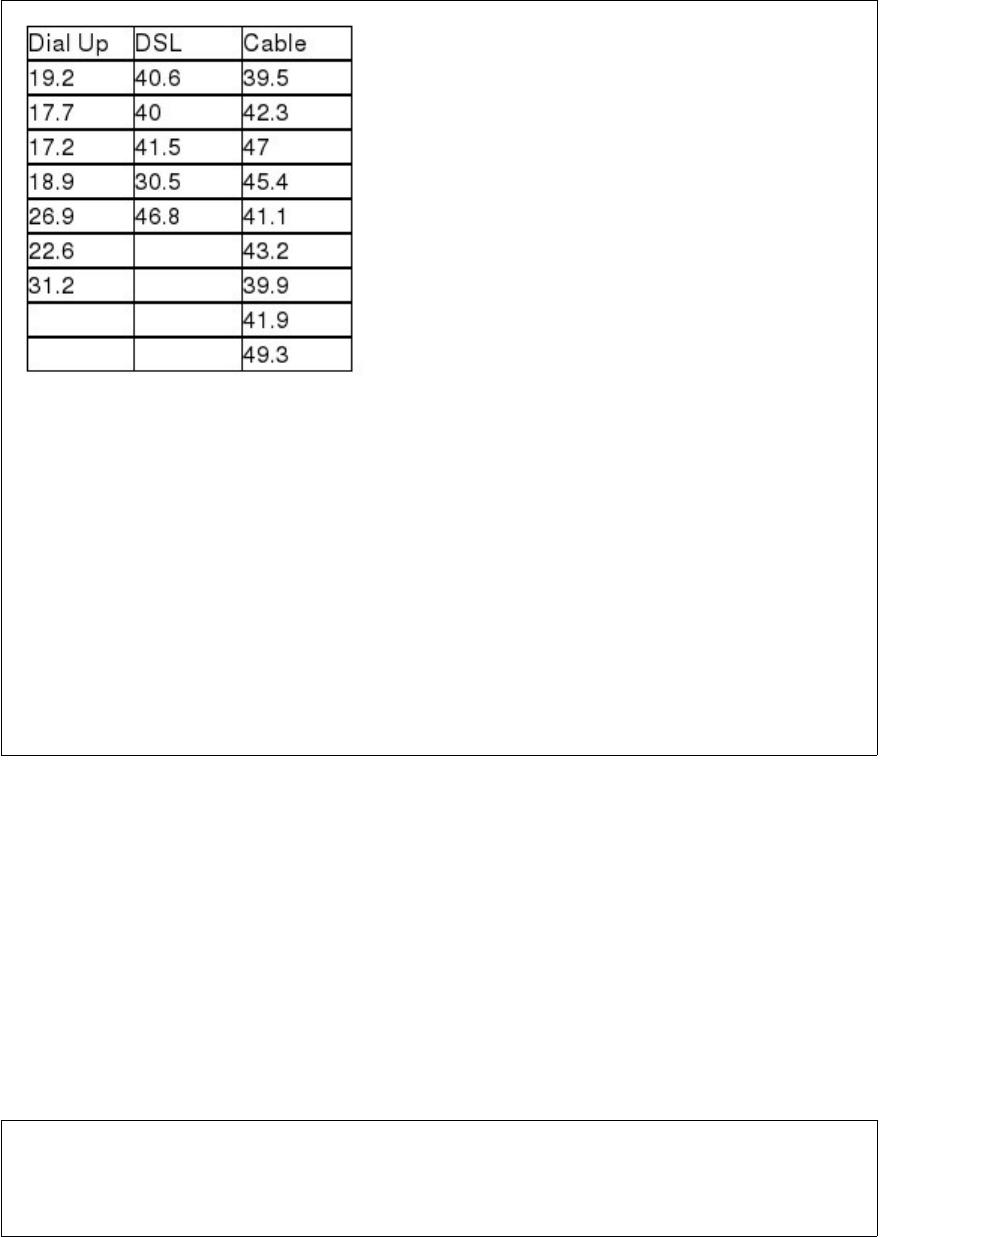
Based upon these data and a significance level of 0.05, which of the following
statements is true?
A) The F-critical value for the test is 3.555
B) The test statistic is approximately 43.9
C) The null hypothesis should be rejected and conclude that the mean connect times for
the three user categories are not all equal.
D) All of the above are true.
State University recently randomly sampled ten students and analyzed grade point
average (GPA) and number of hours worked off-campus per week. The following data
were observed:
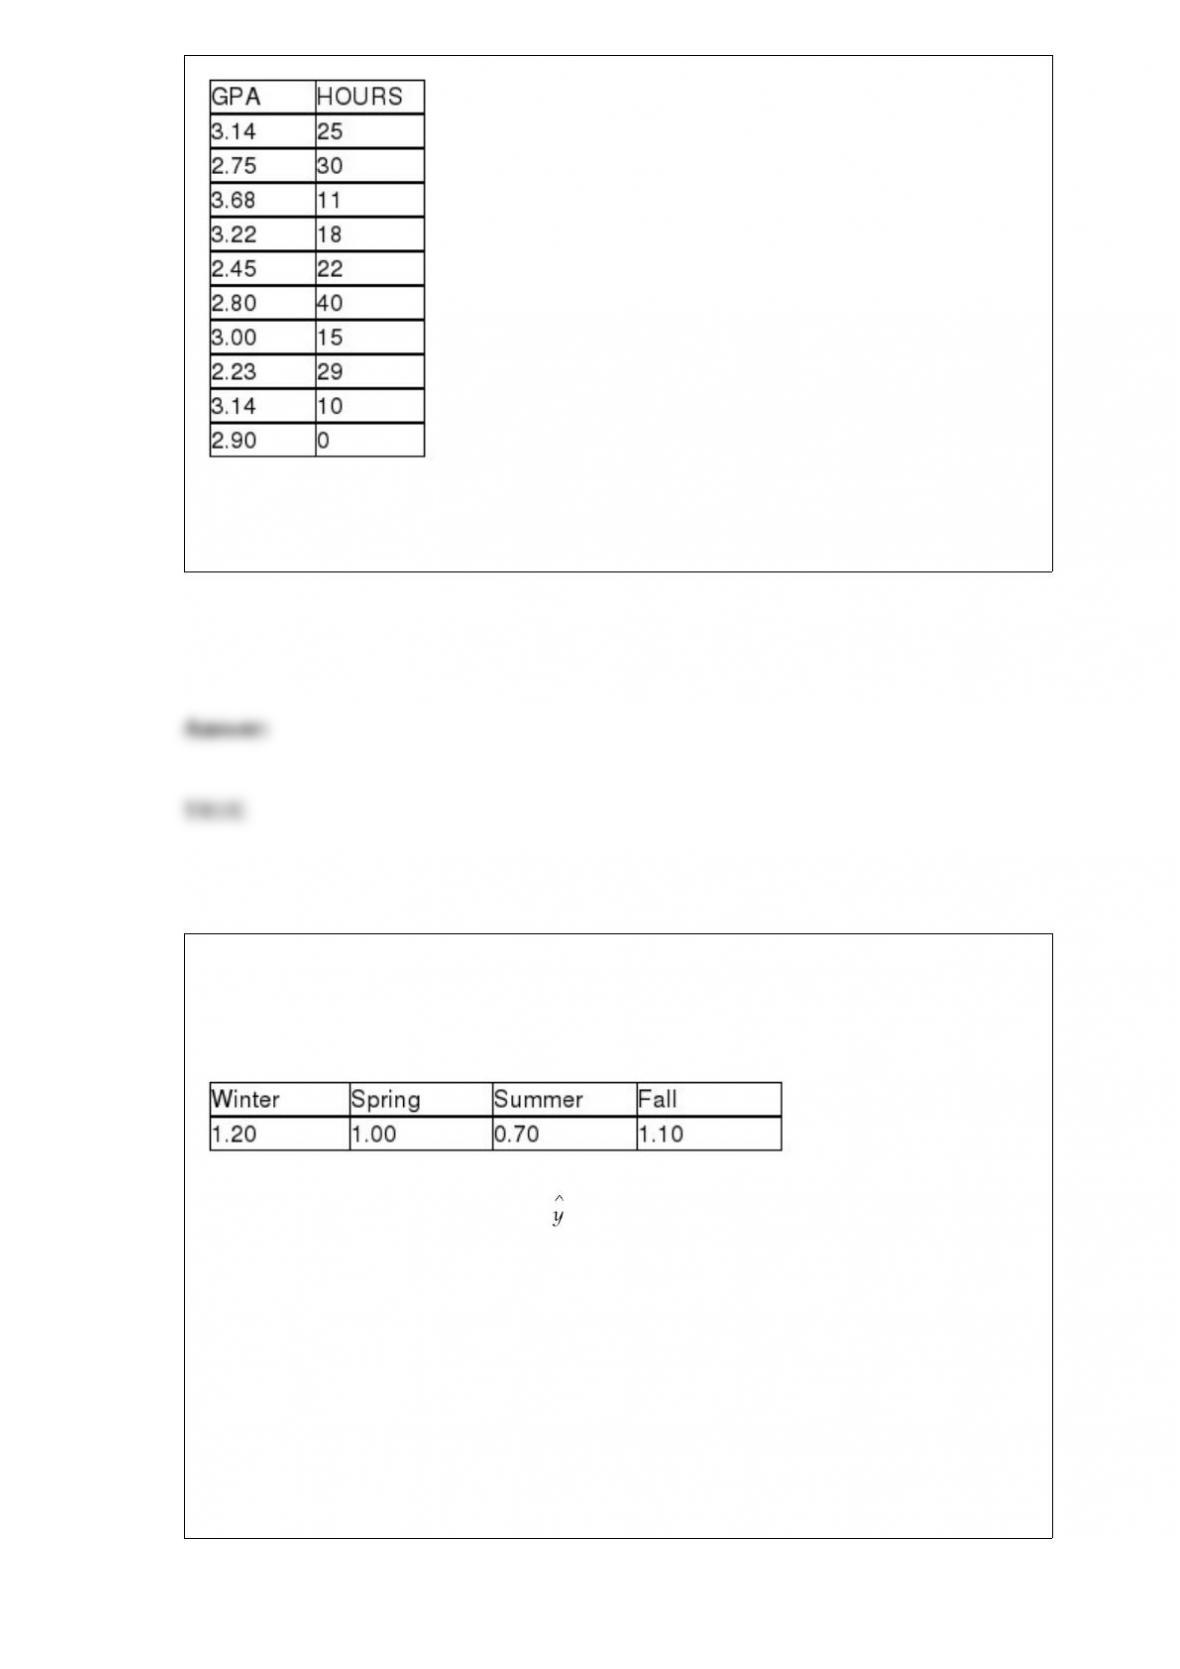
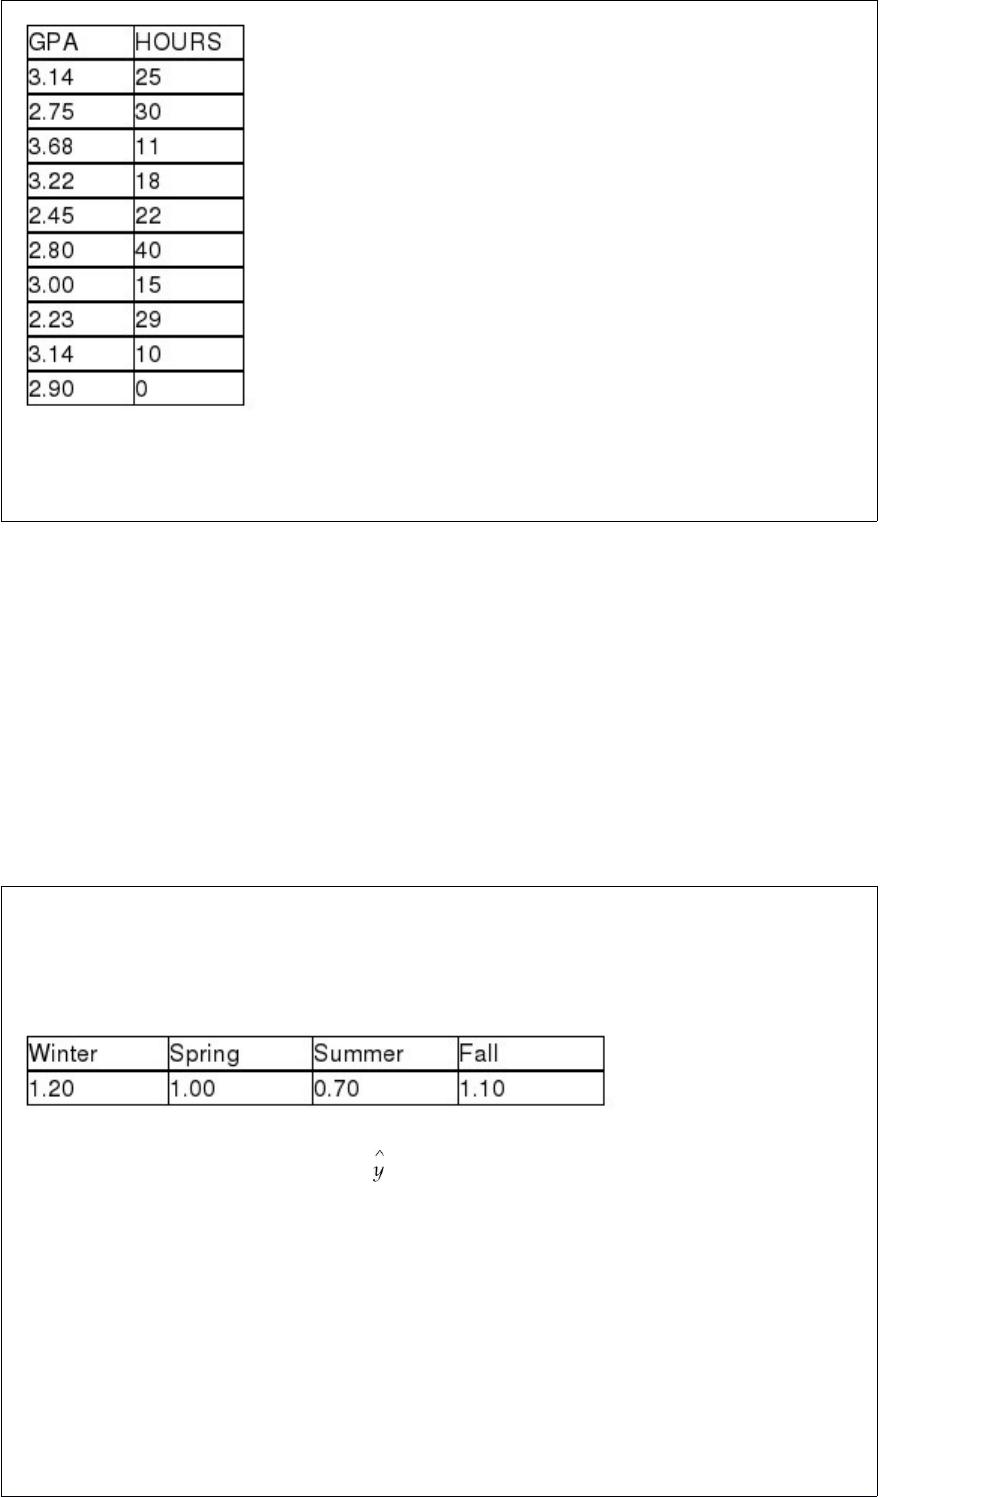
In this study the independent variable is the number of hours worked off campus per
week.
A company has developed a linear trend regression model based on 16 quarters of data.
The independent variable is the measure of time (t = 1 thru 16 where quarter 1 is winter
quarter, 2 is spring, etc.). The company has also developed seasonal indexes for each
quarter as follows:
The linear trend forecast equation is: = 120 + 56t.
Given this information, what is the seasonally unadjusted forecast for period 19?
A) 1,064
B) 1,184
C) 828.80
D) 986.7


If a binomial distribution applies with a sample size of n = 20, find the standard
deviation, n = 20, p = 0.20.
A) 1.7889
B) 2.1889
C) 2.7889
D) 3.1221
Golf handicaps are used to allow players of differing abilities to play against one
another in a fair match. Recently a sample of golfers was selected in an effort to
develop a model for explaining the difference in handicaps. One independent variable
of interest is the number of rounds played per year. Another is whether or not the player
is using an “original” name brand club or a copy. In recent years, a number of smaller
golf club manufacturers have attempted to copy major golf club designs and sell
“copies” of original clubs such as the Big Bertha by Calloway. The resulting regression
analysis containing both Rounds Played and a Dummy variable for Club Used is shown
as follows:

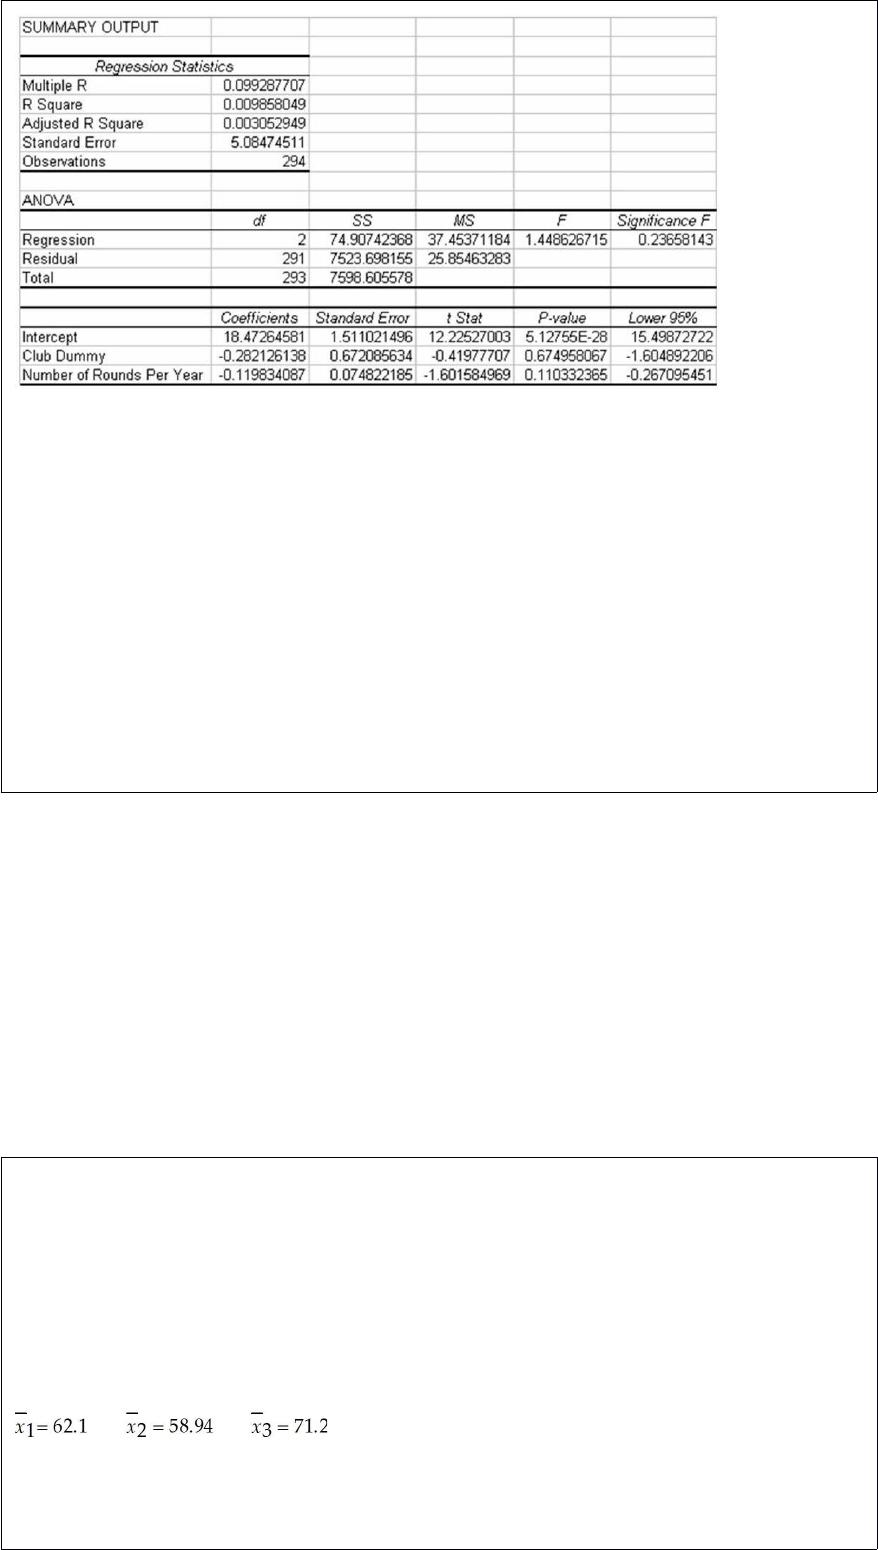
Given this information, which of the following statements is not correct?
A) The overall regression model is insignificant at the alpha = .05 level.
B) The Club Dummy variable is statistically significant in the model meaning that
knowing that a player used an original club or copy is of value in knowing the player’s
handicap.
C) The two independent variables do not explain a statistically significant portion of the
variation in golf handicap.
D) All of the above are not correct.
The State Transportation Department is thinking of changing its speed limit signs. It is
considering two new options in addition to the existing sign design. At question is
whether the three sign designs will produce the same mean speed. To test this, the
department has conducted a limited test in which a stretch of roadway was selected.
With the original signs up, a random sample of 30 cars was selected and the speeds
were measured. Then, on different days, the two new designs were installed, 30 cars
each day were sampled, and their speeds were recorded. Suppose that the following
summary statistics were computed based on the data:
Based on these sample results and significance level equal to 0.05, what is the critical
value for this hypothesis test?


A) F = approximately 3.15
B) F = approximately 4.90
C) F = approximately 29.47
D) F = approximately 2.70
Ace Computer Manufacturer buys disk drives in lots of 5,000 units from a supplier in
California. The contract calls for, at most, 3 percent of the disk drives to be defective.
When a shipment arrives, a sample of n = 15 parts is selected. If zero defects are found
in this sample, the shipment is accepted. If 3 or more defects are found, the shipment is
rejected and sent back to the supplier. If the number of defects found is 1 or 2, a second
sample of 15 parts is selected. If this sample yields 1 or fewer defects, the shipment is
accepted; otherwise the shipment is rejected. Based on a binomial distribution, the
probability that Ace will reject a shipment of parts that meets the contract requirements
is approximately 0.0355.
Under what circumstances should the standard normal distribution be used when
employing the Mann-Whitney U test?
A) When the sample sizes are equal from the two populations
B) When the sample sizes are greater than 20
C) When the populations are normally distributed
D) You would never use the standard normal distribution.
The following data reflect the number of customers who return merchandise for a
refund on Monday. Note these data reflect the population of all 10 Mondays for which
data are available.
Assume that this same exact pattern of data were replicated for the next ten days. How
would this affect the standard deviation for the new population with 20 items?
A) The standard deviation would be doubled.
B) The standard deviation would be cut in half.
C) The standard deviation would not be changed.
D) There is no way of knowing the exact impact without knowing how the mean is
changed.
Which of the following is not an assumption of the Kruskal-Wallis one-way analysis of
variance?
A) Variables have a continuous distribution.
B) Samples are independent.
C) Sample sizes are equal for all populations.
D) Population distributions are identical except for possible differences in center.
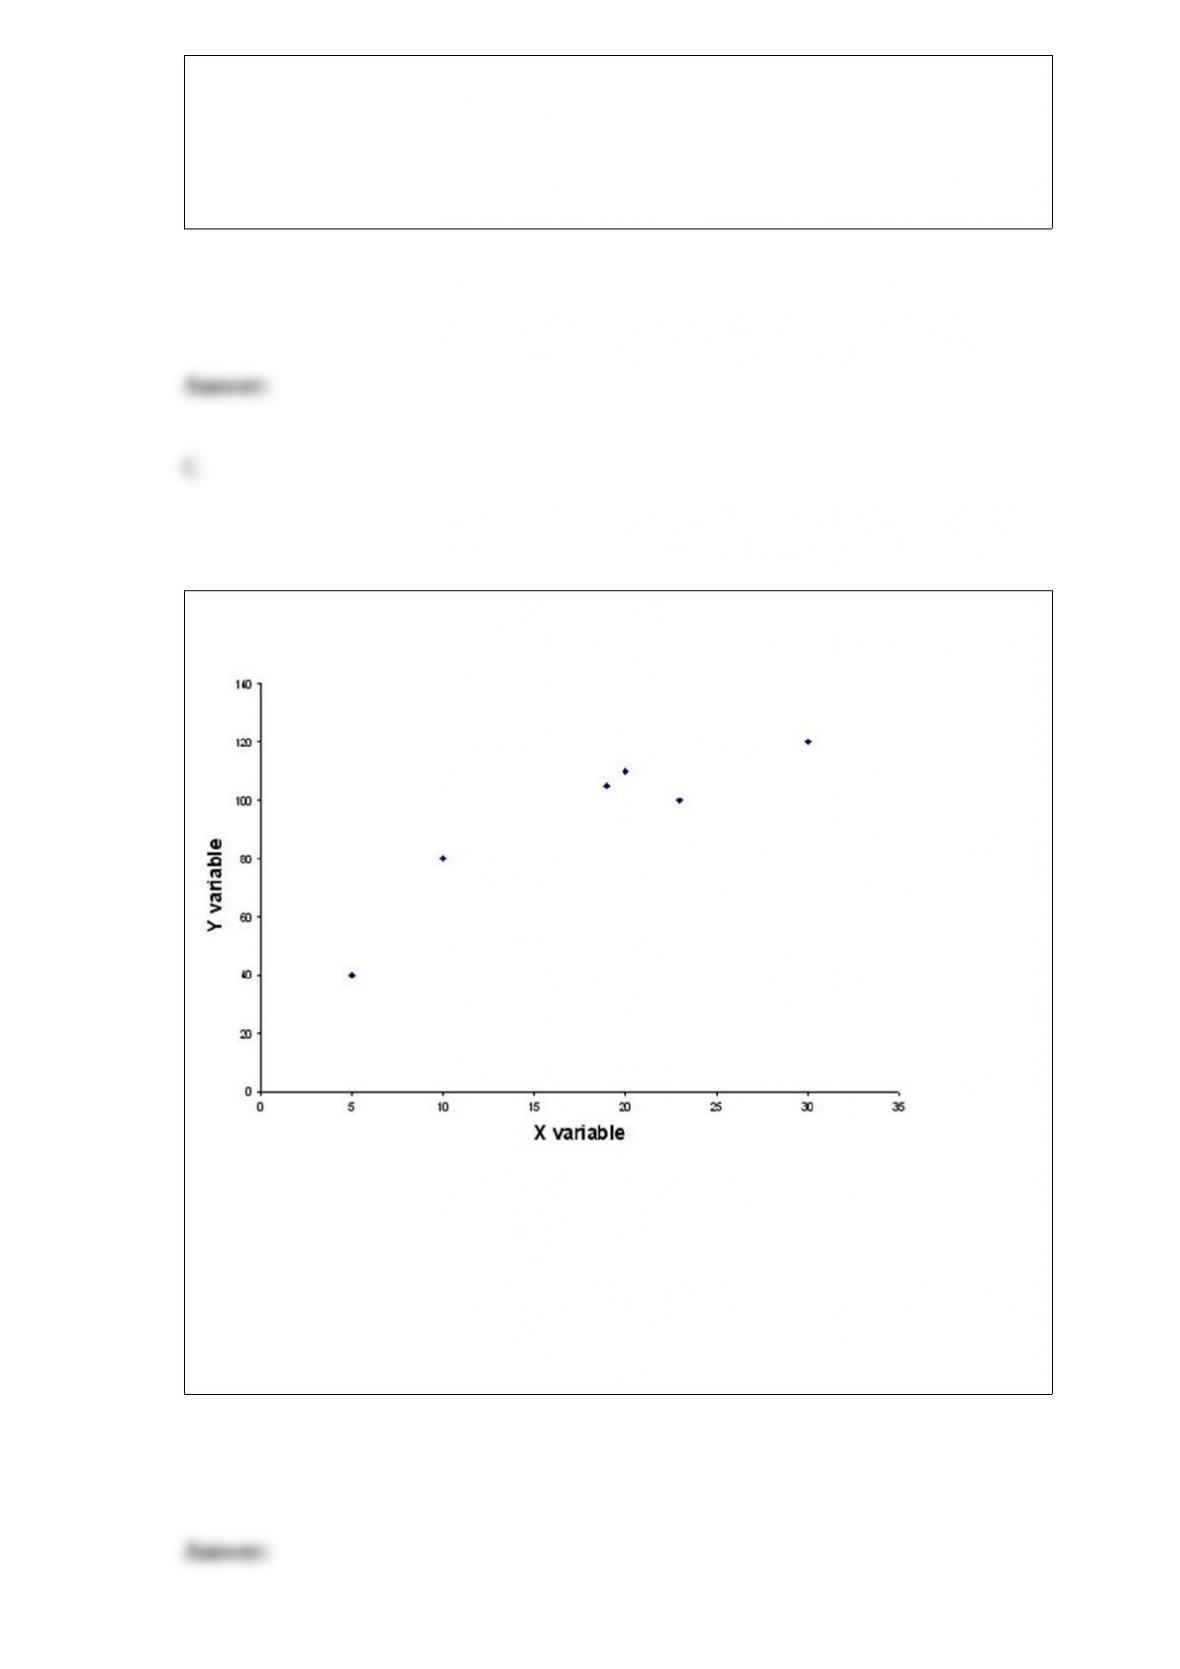
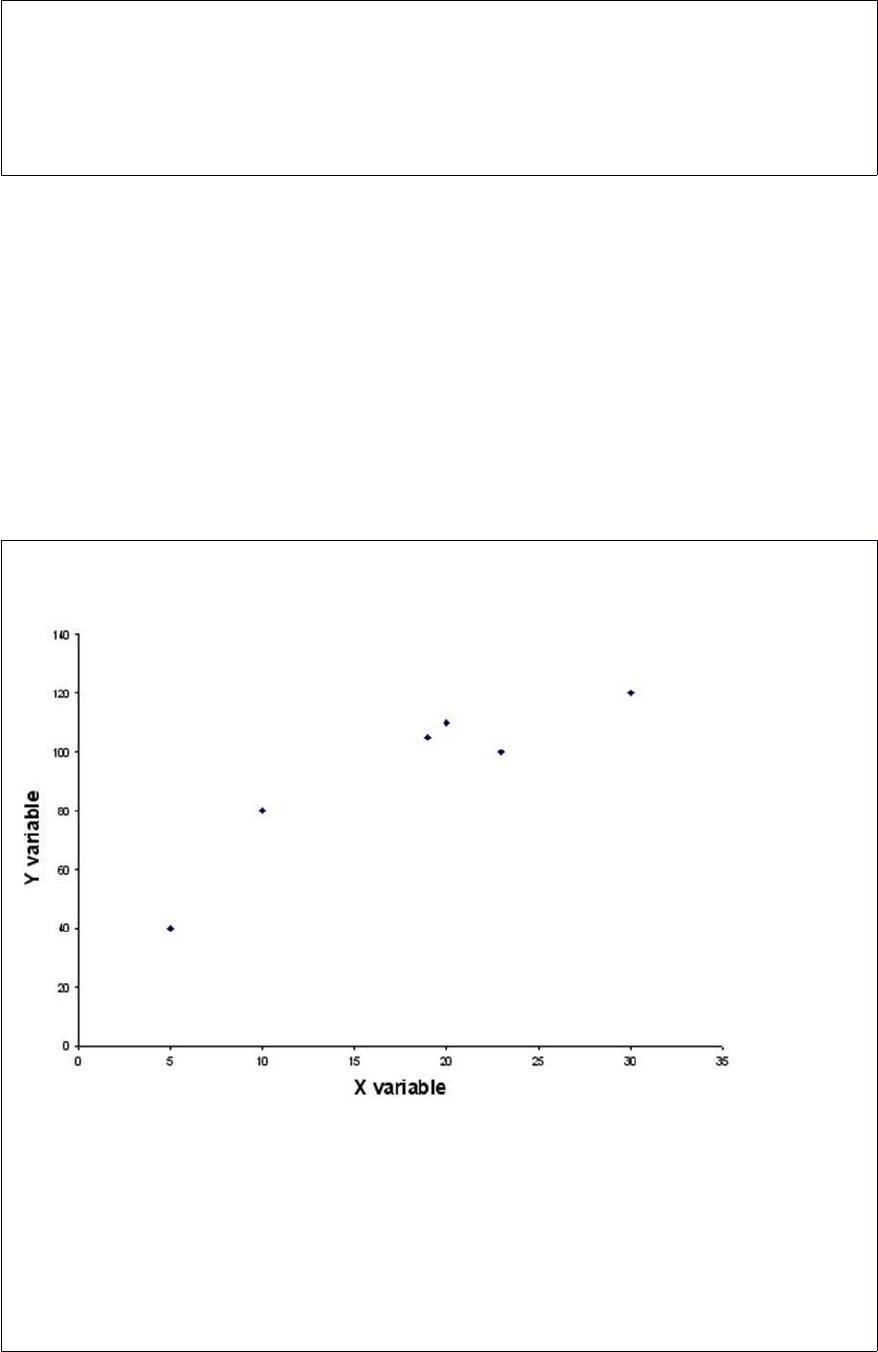
Consider the following chart. Which of the following statements is most correct?
A) There is a negative linear relationship between the two variables.
B) There is a positive linear relationship between the two variables.
C) There is a perfect linear relationship between the two variables.
D) There is no apparent relationship between the two variables.
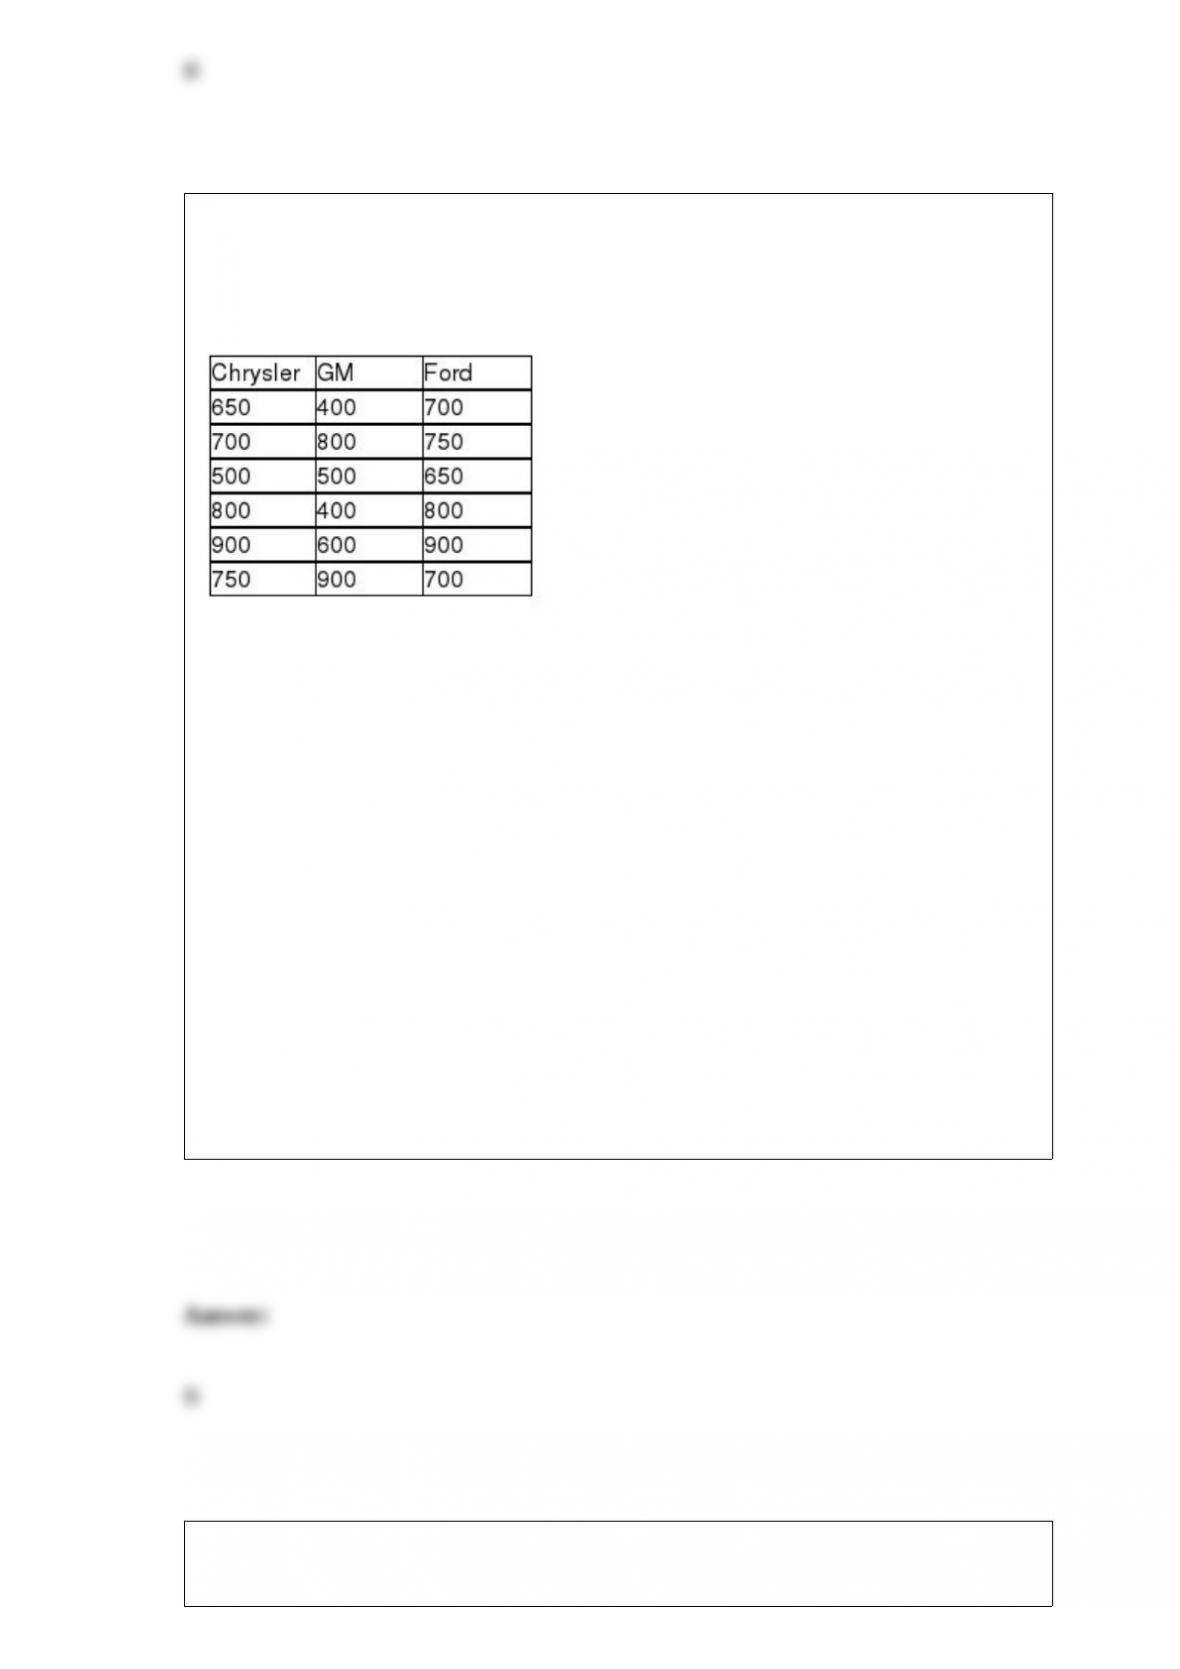
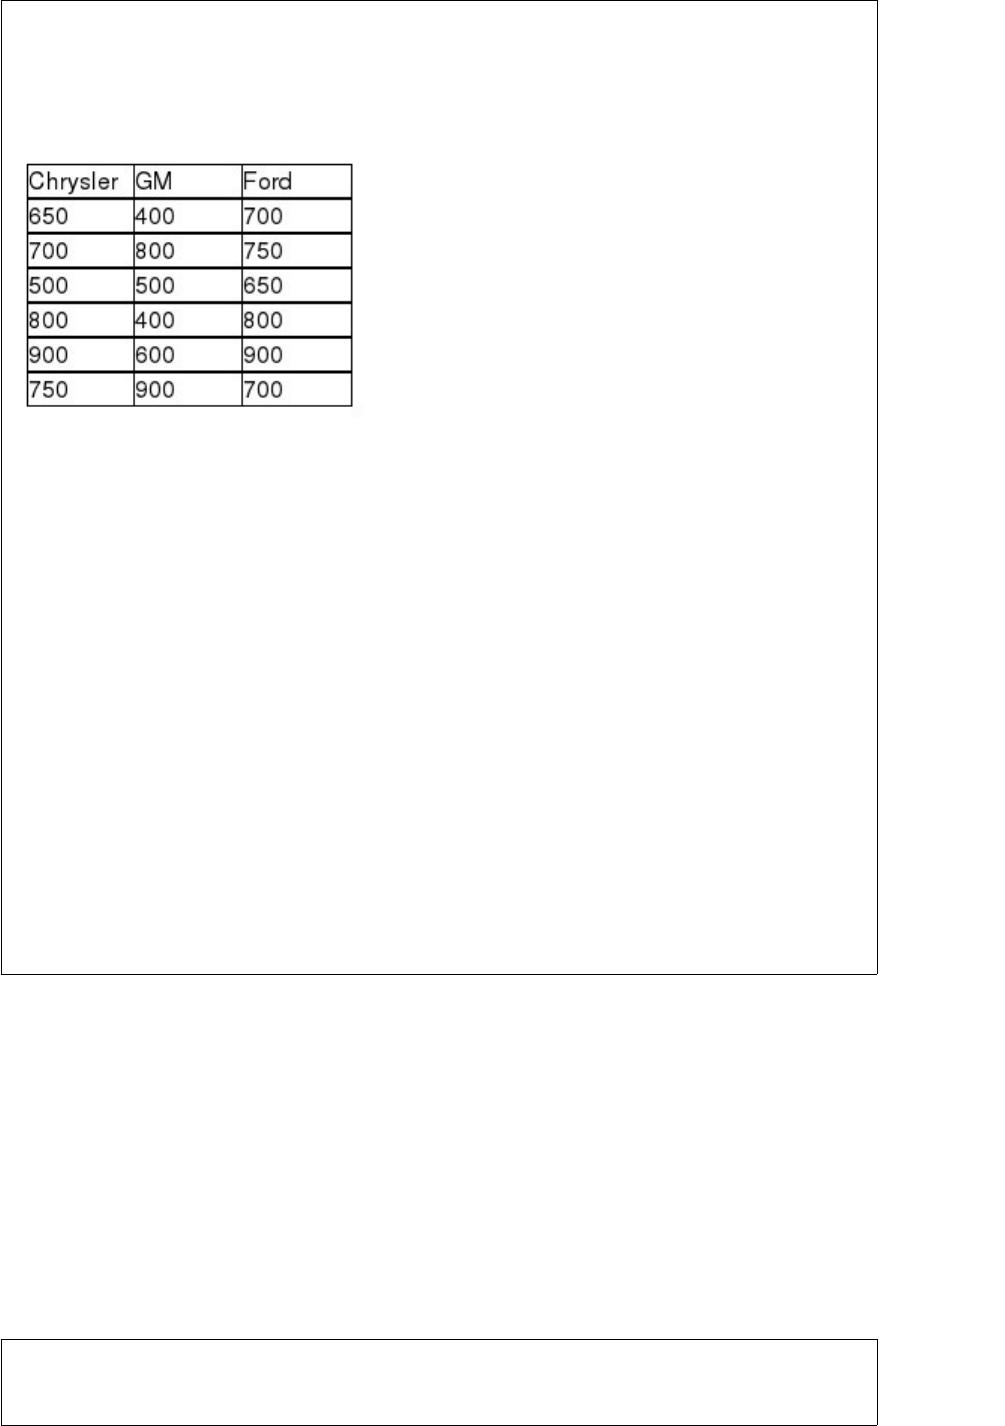
A survey was recently conducted in which random samples of car owners of Chrysler,
GM, and Ford cars were surveyed to determine their satisfaction. Each owner was
asked to rate overall satisfaction on a scale of 1 (poor) to 1000 (excellent). The
following data were recorded:
If the analysts are not willing to assume that the population ratings are normally
distributed and will use the Kruskal-Wallis test to determine if the three companies have
different median ratings, what is the correct conclusion if the test is to be conducted
using an alpha = .05 level?
A) H0 should be rejected and we conclude that there is no significant difference
between the 3 companies.
B) H0 should not be rejected and we conclude that there is no significant difference
between the 3 companies.
C) H0 should be rejected and we conclude that there is a significant difference between
the 3 companies.
D) H0 should not be rejected and we conclude that there is a significant difference
between the 3 companies.
It is possible to use linear regression analysis to develop a forecasting model for
nonlinear data if we can effectively transform the data.


An Internet service provider has the capability of tracking the time that each of its
customers spends connected to the Internet during a month. These data would
constitute:
A) a simple random sample.
B) a convenience sample.
C) a cluster sample.
D) a population.
A seasonal index is a statistic that is computed from time-series data to indicate the
effect of the seasonality in the time-series data.
The State Department of Weights and Measures is responsible for making sure that


commercial weighing and measuring devices, such as scales, are accurate so customers
and businesses are not cheated. Periodically, employees of the department go to
businesses and test their scales. For example, a dairy bottles milk in 1-gallon containers.
Suppose that if the filling process is working correctly, the mean volume of all gallon
containers is 1.00 gallon with a standard deviation equal to 0.10 gallon. Based on this
information, if the department employee selects a random sample of n = 9 containers,
what is the probability that the mean volume for the sample will be greater than 1.01
gallons?
A) 0.3821
B) 0.1179
C) 0.6179
D) 0.2358
Consider a situation in which a used-car lot contains five Fords, four General Motors
(GM) cars, and five Toyotas. If five cars are selected at random to be placed on a
special sale, what is the probability that three are Fords and two are GMs?
A) 0.09
B) 0.03
C) 0.04
D) 0.06
Consider a random variable, z, that has a standardized normal distribution. Determine P
(1.28 < z < 2.33).
A) 0.0126
B) 0.3997
C) 0.0904
D) 0.4901
What are the disadvantages of using a small sample to estimate the population mean?
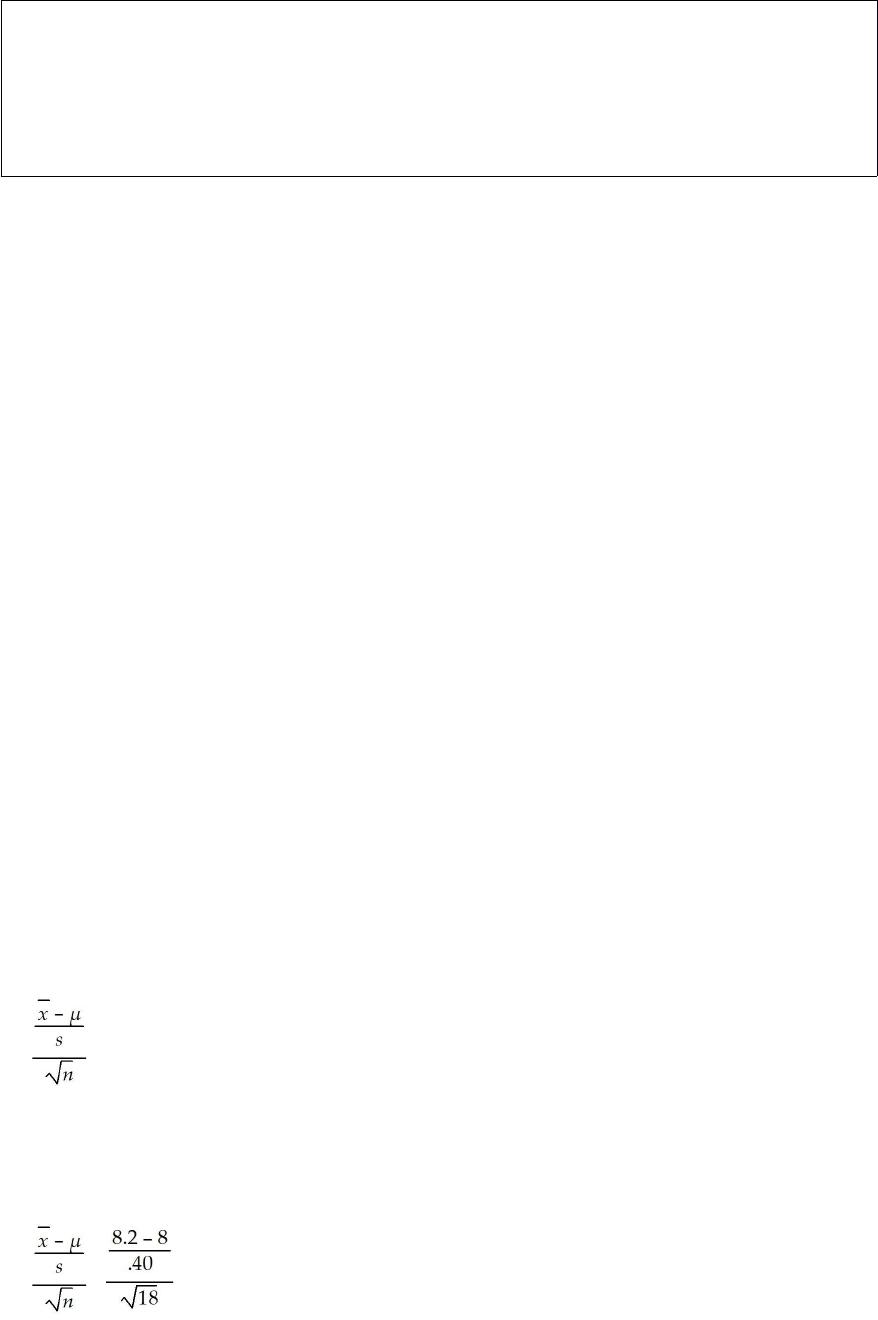
A cell phone manufacturer claims that its phone will last for more than 8 hours of
continuous talk time when the battery is fully charged. To test this claim a sample of n =
18 phones were tested. The results showed a sample mean of 8.2 hours and a sample
standard deviation of 0.4 hour. Conduct the hypothesis test using a 0.5 level of
significance and determine whether or not the company’s claim is supported.

Explain why it is possible for two managers to assess different values for the probability
that a supplier will fail to deliver a shipment on time.
One of the factors that a company will use in determining whether it will locate a new
facility in a community is the status of the real estate market. The managers believe that
an important measure of the real estate market is the average length of time that homes
stay on the market before selling. They believe that if the mean time on the market is
less than 45 days, the real estate market is favorable. To test this in a particular area, a
random sample of n = 100 homes that sold during the past six months was selected. The
mean for this sample was 40 days. It is believed that the population standard deviation
is 15 days. If the test is conducted using a 0.05 level of significance, what conclusion
should be reached?
Open the data file provided with the text called Computer Use. Indicate the level of data
measurement for each variable in the data set.

What are the assumptions for a one-way analysis of variance design?
Statistical Process Control charts are used to detect whether a process remains in
control or whether it has gone out of control. Explain how the SPC signals work.

Explain the relationship between control limits and specification limits.

As a member of the student council at your university, you have been assigned the task
of conducting a phone survey of undergraduate students to determine satisfaction with
the campus food service. Explain how you would go about selecting a simple random
sample.
A major U.S. oil company has developed two blends of gasoline. Managers are
interested in determining whether a difference in mean gasoline mileage will be
obtained from using the two blends. As part of their study, they have decided to run a
test using the Chevrolet Impala automobile with automatic transmissions. They selected
a random sample of 100 Impalas using Blend 1 and another 100 Impalas using Blend 2.
Each car was first emptied of all the gasoline in its tank and then filled with the
designated blend of the new gasoline. The car was then driven 200 miles on a specified
route involving both city and highway roads. The cars were then filled and the actual
miles per gallon were recorded. The following summary data were recorded:
Blend 1 Blend 2
Sample Size 100 100
Sample Mean 23.4 mpg 25.7 mpg
Sample St. Dev. 4.0 mpg 4.2 mpg
Based on the sample data, using a 0.05 level of significance, what conclusion should the
company reach about whether the population mean mpg is the same or different for the
two blends? Use the p-value approach to test the null hypothesis.
The binomial distribution is frequently used to help companies decide whether to accept
or reject a shipment based on the results of a random sample of items from the
shipment. For instance, suppose a contract calls for, at most, 10 percent of the items in a
shipment to be red. To check this without looking at every item in the large shipment, a
sample of n = 10 items is selected. If 1 or fewer are red, the shipment is accepted;
otherwise it is rejected. Using probability, determine whether this is a “good” sampling
plan. (Assume that a bad shipment is one that has 20 percent reds.)


Explain how to use the binomial distribution table when p, the probability of a success,
exceeds 0.50.


Explain what the correlation coefficient measures and some detail of the key issues
associated with it. Be sure to also discuss the concept of spurious correlation.
A financial analyst is interested in estimating the proportion of publicly traded
companies on the New York Stock Exchange that have cash balances that are more than
10 percent of the total assets of the company. A random sample of n = 100 companies
shows that 13 had cash balances of more than 10 percent of assets. Based on this
information, develop and interpret a 90 percent confidence interval estimate for the
population proportion.

A national car rental chain believes that more than 80 percent of its customers are
satisfied with the check-in process that the company is using. To test this, a random
sample of n = 200 customers are surveyed. These sample results show 168 that say they
were satisfied. If the test is to be conducted using a .05 level of significance, what is the
critical value?
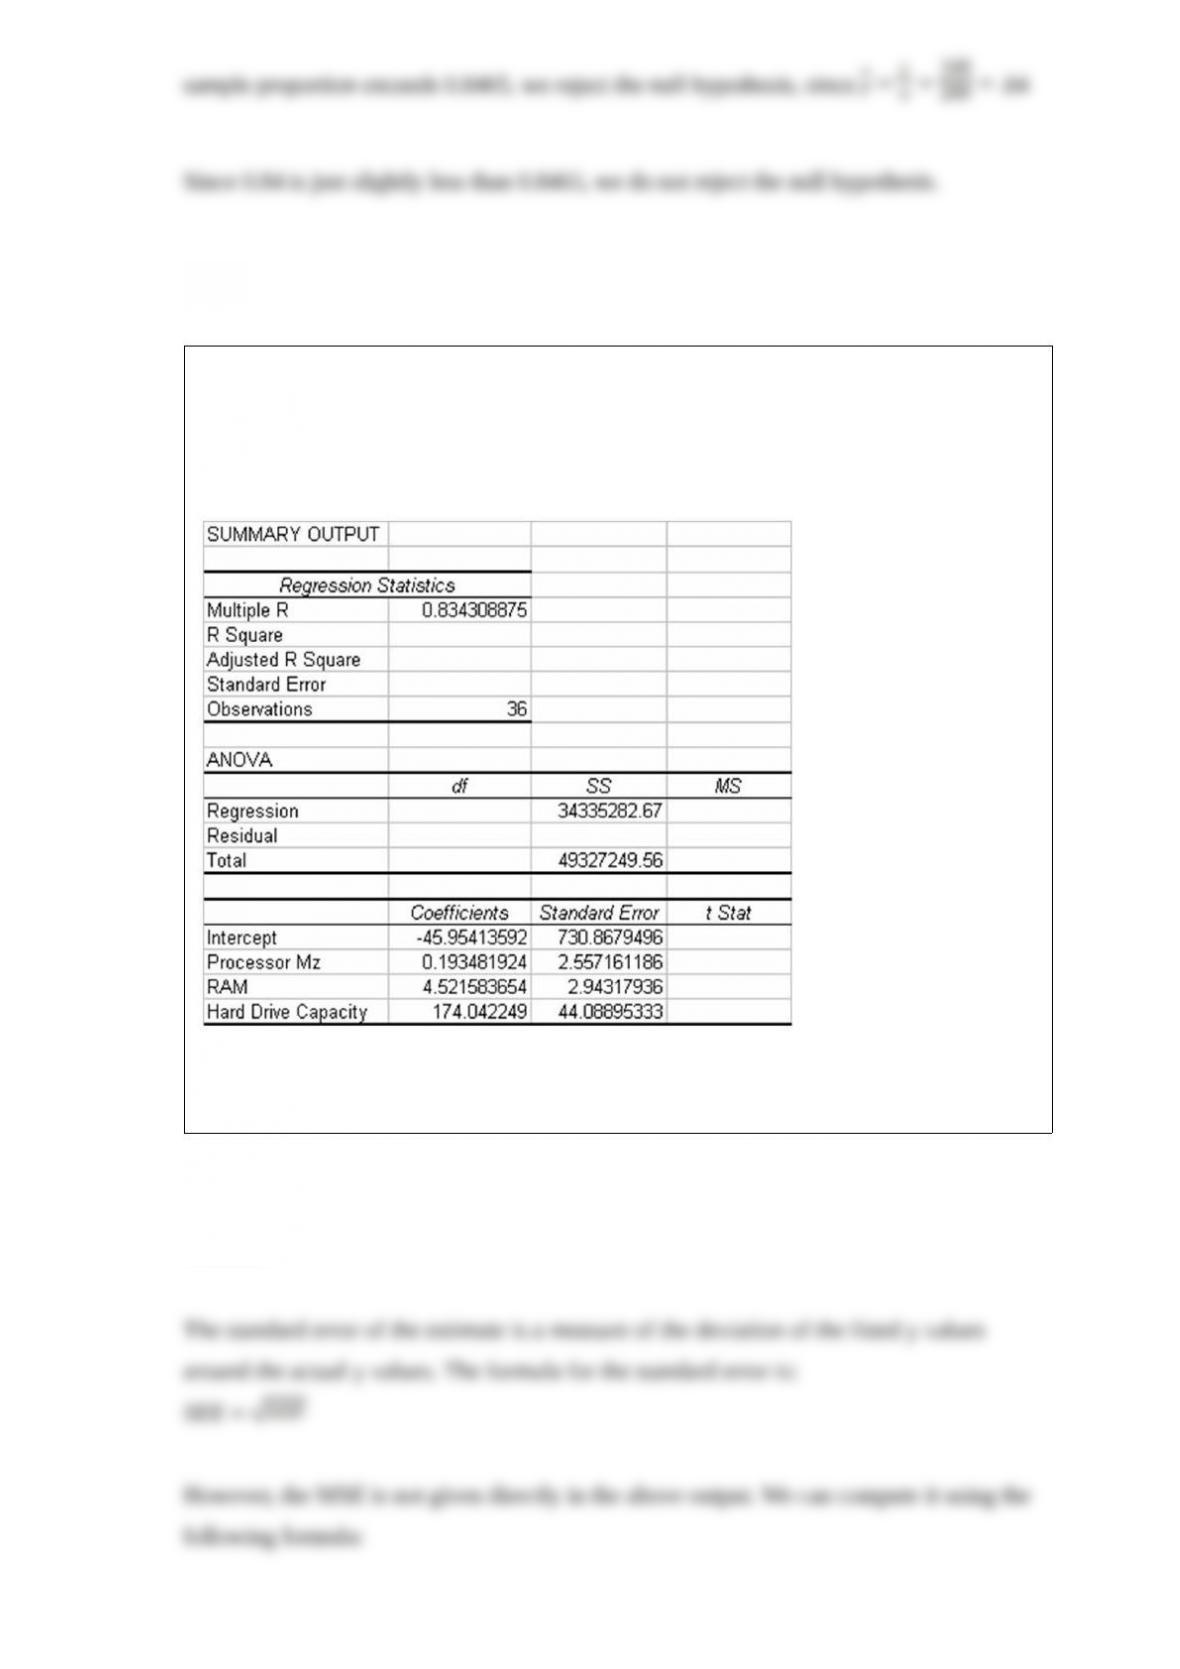
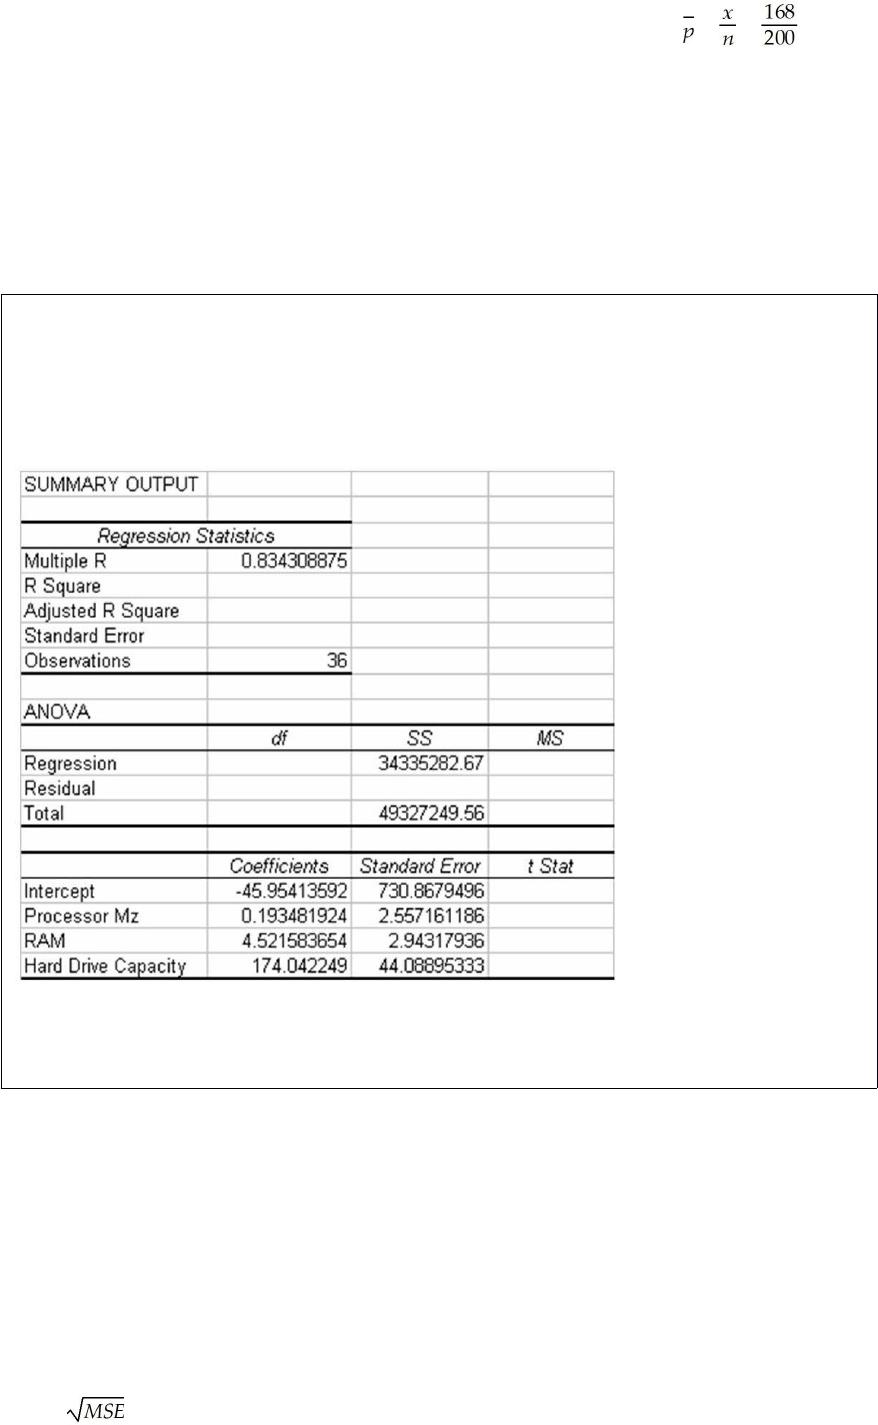
The following regression output is the result of a multiple regression application in
which we are interested in explaining the variation in retail price of personal computers
based on three independent variables, CPU speed, RAM, and hard drive capacity.
However, some of the regression output has been omitted.
Given this information and your knowledge of multiple regression, what is the value for
the standard error of the estimate?
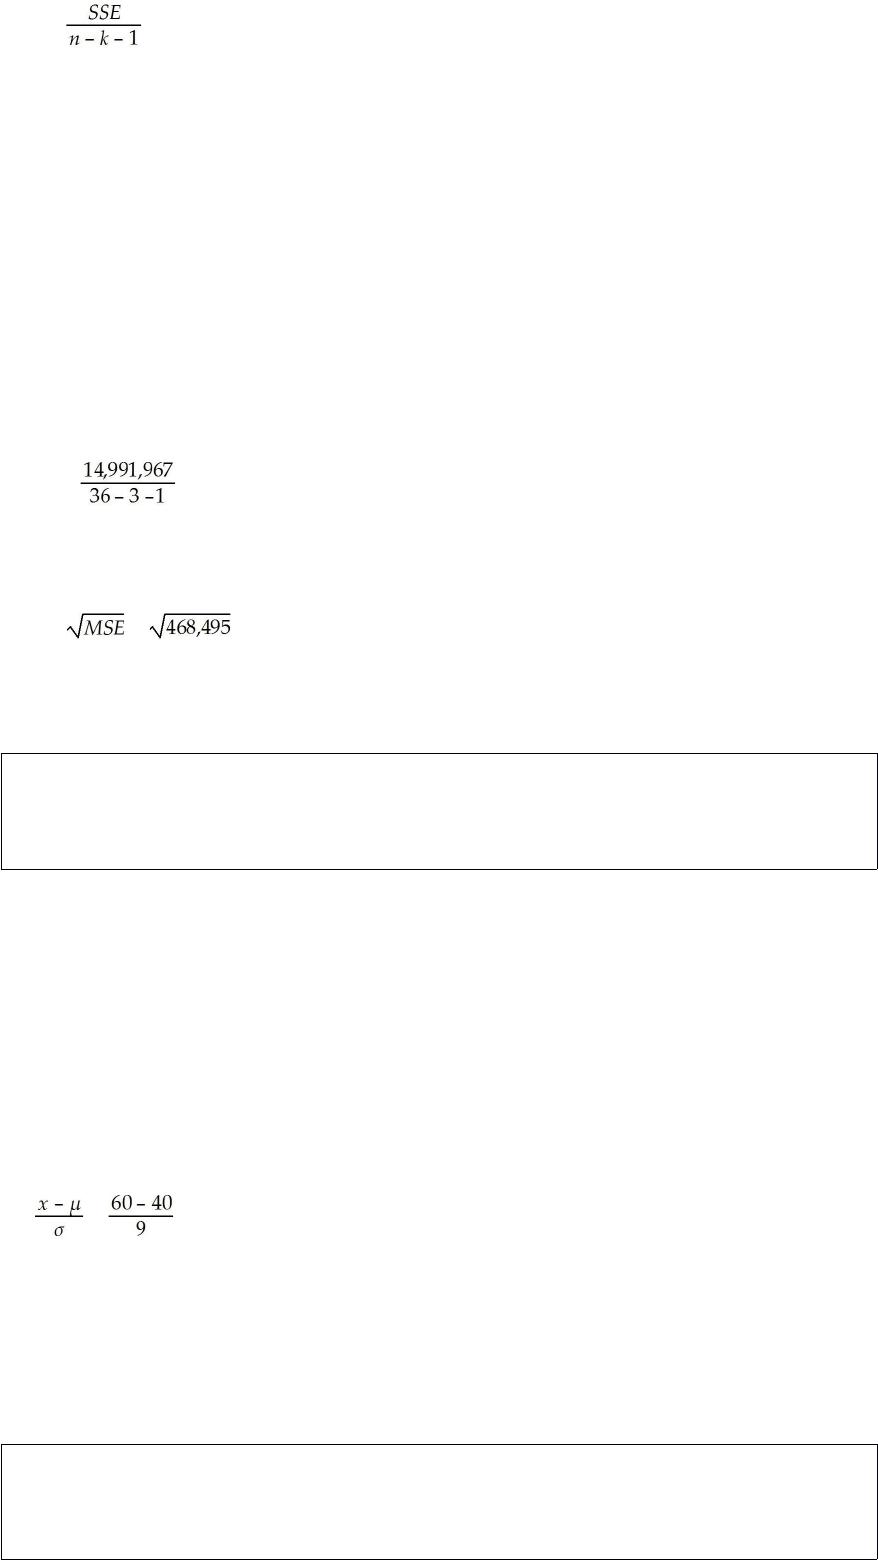
A class takes an exam where the average time to complete the exam is normally
distributed with a time of 40 minutes and standard deviation of 9 minutes. If the class
lasts 1 hour, what percent of the students will have turned in the exam after 60 minutes?
Consumer products are required by law to contain at least as much as the amount
printed on the package. For example a bag of potato chips that is labeled as 10 ounces
should contain at least 10 ounces. Assume that the standard deviation of the packaging
equipment yields a bag weight standard deviation of 0.2 ounces. Explain what average
bag weight must be used to achieve at least 97.5 percent of the bags having 10 or more
ounces in the bag. Assume the bag weight distribution is bell-shaped.